climate change is a geographic problem - gis daygisday.com/resources/ebooks/climate-change.pdf ·...
TRANSCRIPT

By Jack Dangermond and Matt Artz, Esri
Climate Change is a Geographic ProblemThe Geographic Approach to Climate Change
i
Table of Contents
Science and Our Changing Climate 1
What Is GIS? 5
GIS for Climate Change 7
What Is the Geographic Approach? 11
The Geographic Approach to Climate Change 17
A GIS-Based Action Plan 27
Bibliography 31
Acknowledgments 33
JUNE 2010J9921
1 CLIMATE CHANGE IS A GEOGRAPHIC PROBLEM
Science and Our Changing Climate
The Medieval Warm Period (tenth to fourteenth centuries). The Little Ice Age (sixteenth to nineteenth centuries). The Year without a Summer (1816).
Earth's climate has undergone radical changes in the distant as well as the recent past and is almost certain to undergo more radical changes in the not-too-distant future. As industrialization, population, and urbanization continue to increase, so too will stressors on the environment such as pollution. Such change in climate and environmental quality could have huge implications for quality of life. Regardless of where you stand on the often politically charged issue of global warming, or global climate change, we owe it to ourselves and our children to take an intelligent look at the data and develop actionable, intelligent alternatives.
We live in an age of readily and freely available information. The Internet has given us unprecedented awareness of and access to vast quantities of climate data. Never before have scientists and nonscientists had such easy and open access to the data and tools
The Age of Information
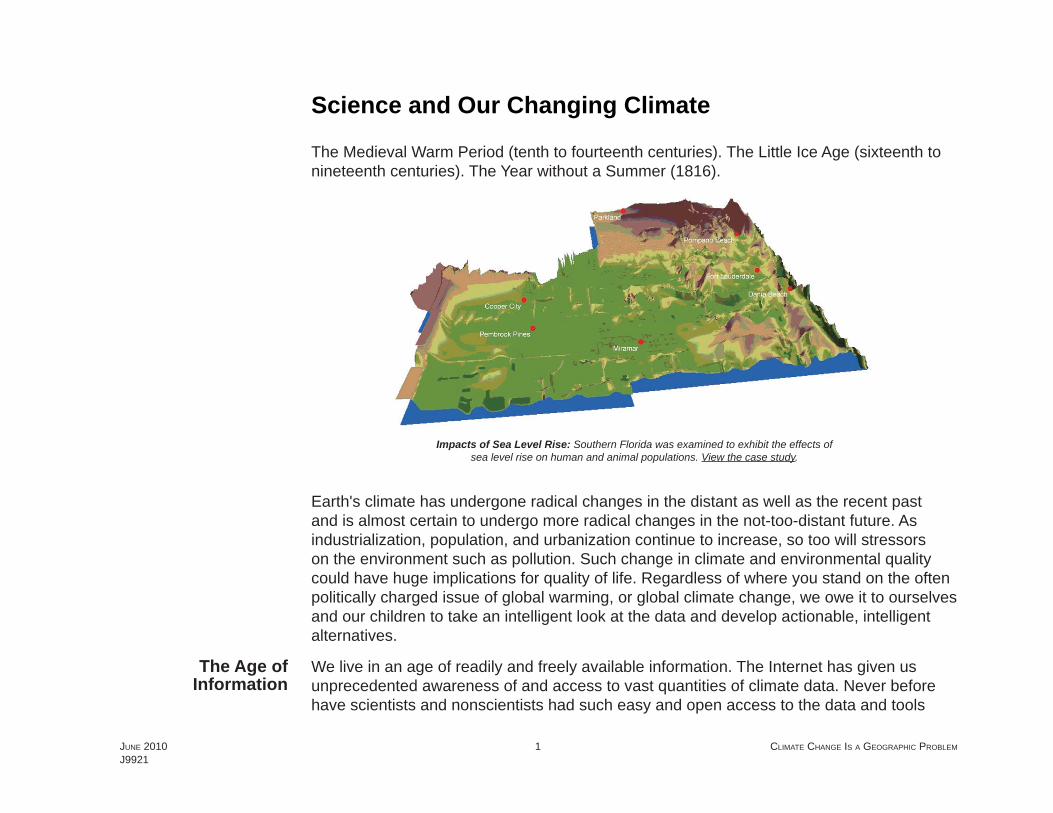
Impacts of Sea Level Rise: Southern Florida was examined to exhibit the effects of sea level rise on human and animal populations. View the case study.
JUNE 2010J9921
2 CLIMATE CHANGE IS A GEOGRAPHIC PROBLEM
needed to study earth's climate. Both past observations and future predictions are useful in studying climate change. Examining and cross-referencing past and future data can help quantify changes already occurring as well as predict patterns and trends that could impact climate in the near and long-term future.
For decades or longer, humans have been keeping careful records of rainfall, temperature, lake levels, stream fl ows, etc., for thousands of locations around the globe. Beyond these historical records, additional records of climate change stretch back even farther when one considers fi elds such as dendrochronology (measuring the size of tree rings), which reveals climate data stretching back for thousands of years, and palynology (changes in the type and distribution of fossil pollen), which gives us clues about climate going back millions of years. The result of all this collection and research is vast stores of data describing conditions at particular locations on the planet at particular points in time.
Careful observation and analysis of past records might help us answer questions such as Are recent weather phenomena a short-term anomaly or a long-term trend? and What past climate changes are due to the earth's natural cycle versus what changes may have been caused by volcanic eruption, meteorite impact, or other cataclysmic disasters?
Observing the Past
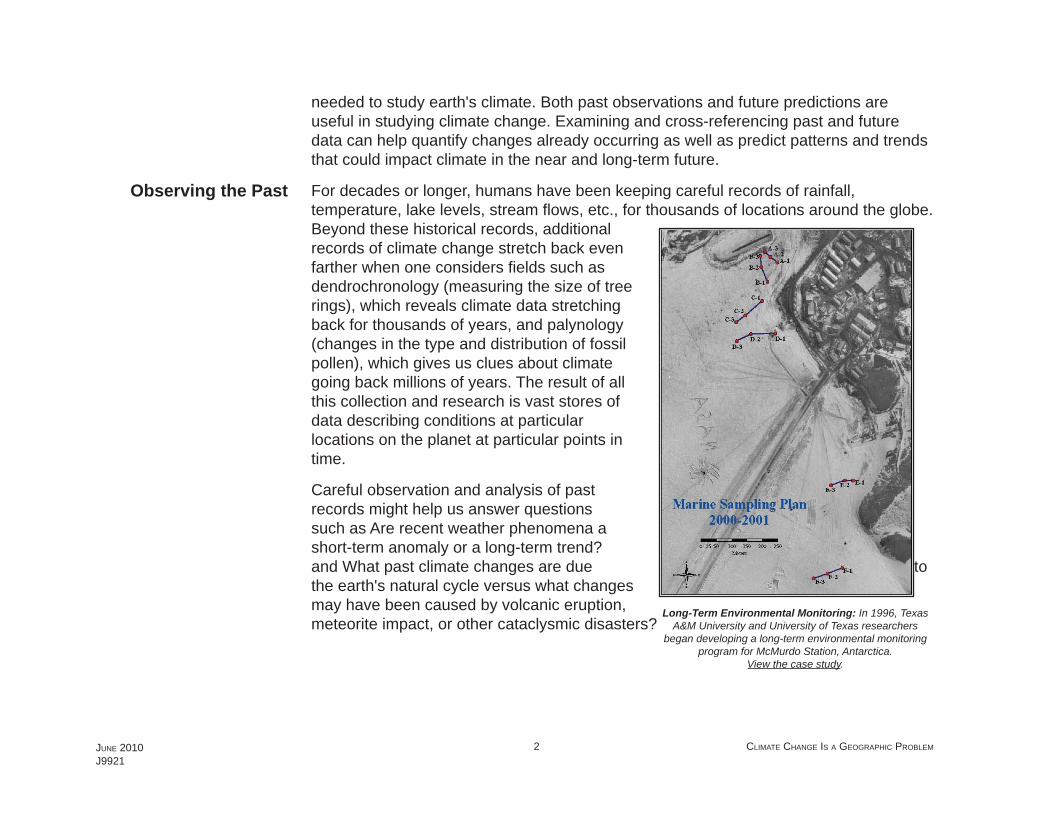
Long-Term Environmental Monitoring: In 1996, Texas A&M University and University of Texas researchers
began developing a long-term environmental monitoring program for McMurdo Station, Antarctica.
View the case study.
JUNE 2010J9921
3 CLIMATE CHANGE IS A GEOGRAPHIC PROBLEM
Anyone who checks weather forecasts on the Internet or television knows how frustrating it is to try to predict the future, but prediction of short-term, highly localized conditions, such as the chance of rain in London on Friday afternoon, is quite different from predicting long-term, more general phenomena such as global climate change. For years scientists have been using sophisticated computer models, such as general circulation, atmosphere-ocean interaction, and radiative-convective process models, in an attempt to visualize the future of earth's climate. The output of a particular model can be enlightening, but combining data from multiple models and sources, both past and future, gives us the best chance for a comprehensive and accurate vision of what the future holds for our planet.
Predicting the Future
JUNE 2010J9921
5 CLIMATE CHANGE IS A GEOGRAPHIC PROBLEM
What Is GIS?
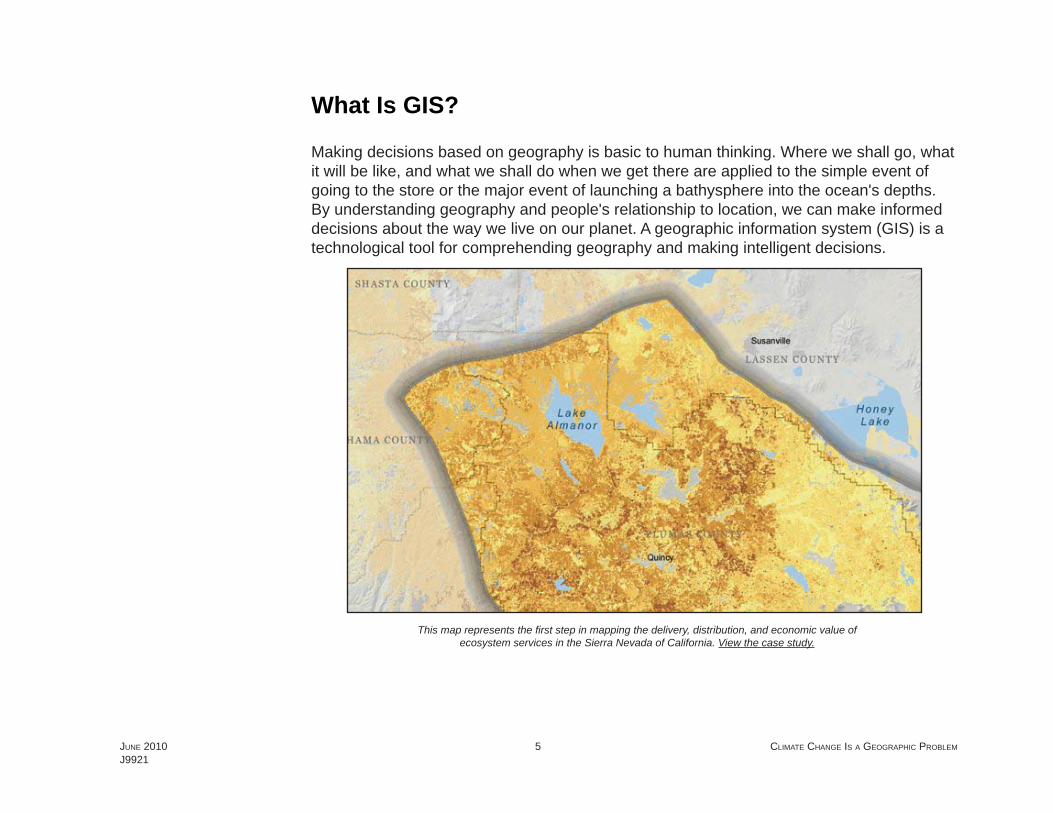
Making decisions based on geography is basic to human thinking. Where we shall go, what it will be like, and what we shall do when we get there are applied to the simple event of going to the store or the major event of launching a bathysphere into the ocean's depths. By understanding geography and people's relationship to location, we can make informed decisions about the way we live on our planet. A geographic information system (GIS) is a technological tool for comprehending geography and making intelligent decisions.
This map represents the fi rst step in mapping the delivery, distribution, and economic value of ecosystem services in the Sierra Nevada of California. View the case study.
JUNE 2010J9921
6 CLIMATE CHANGE IS A GEOGRAPHIC PROBLEM
GIS organizes geographic data so that a person reading a map can select data necessary for a specifi c project or task. A thematic map has a table of contents that allows the reader to add layers of information to a basemap of real-world locations. For example, a social analyst might use the basemap of Eugene, Oregon, and select datasets from the U.S. Census Bureau to add data layers to a map that shows residents' education levels, ages, and employment status. With an ability to combine a variety of datasets in an infi nite number of ways, GIS is a useful tool for nearly every fi eld of knowledge from archaeology to zoology.
GIS maps are interactive. On the computer screen, map users can scan a GIS map in any direction, zoom in or out, and change the nature of the information contained in the map. They can choose whether to see the roads, how many roads to see, and how roads should be depicted. Then they can select what other items they wish to view alongside these roads such as storm drains, gas lines, rare plants, or hospitals. Some GIS programs are designed to perform sophisticated calculations for tracking storms or predicting erosion patterns. GIS applications can be embedded into common activities such as verifying an address.
From routinely performing work-related tasks to scientifi cally exploring the complexities of our world, GIS gives people the geographic advantage to become more productive, more aware, and more responsive citizens of Planet Earth.
JUNE 2010J9921
7 CLIMATE CHANGE IS A GEOGRAPHIC PROBLEM
GIS for Climate Change
Global climate change is a diffi cult, complex, politically charged, and vitally important issue. Yet, from a knowledge perspective, we are at a distinct disadvantage: at this point in time, we still do not have a clear idea of everything we need to know to address the problem in a measured, rational, and–above all—scientifi c manner.
When you think about the multitude of issues surrounding climate change science—from root causes to resultant impacts—geography is clearly an elemental factor in the equation. Every aspect of climate change affects or is affected by geography, be it at a global, regional, or local level. To help us better understand such geographies, GIS is the single most powerful integrating tool for inventorying, analyzing, and ultimately managing this extremely complex problem.
The key to understanding our dynamic climate is creating a framework to take many different pieces of past and future data from a variety of sources and merge them into a single system. Information technology brings together data from these many different sources into a common computer database. GIS is a sophisticated technology tool already widely used
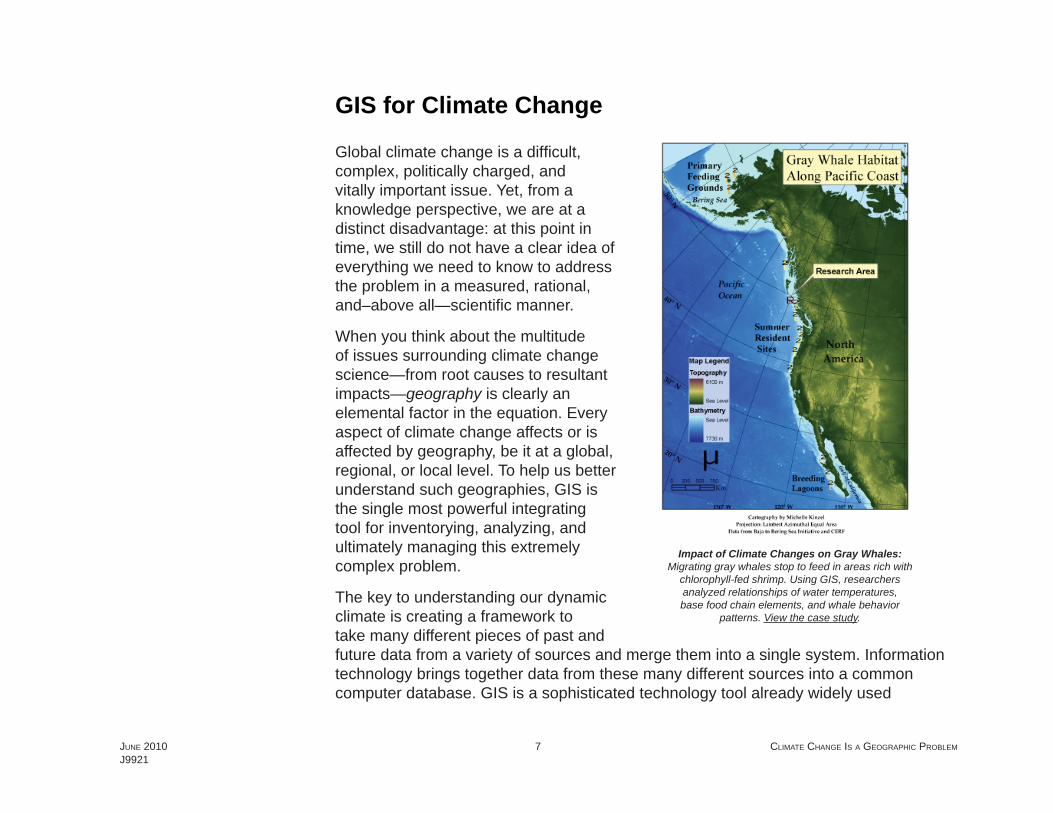
Impact of Climate Changes on Gray Whales: Migrating gray whales stop to feed in areas rich with
chlorophyll-fed shrimp. Using GIS, researchers analyzed relationships of water temperatures, base food chain elements, and whale behavior
patterns. View the case study.
JUNE 2010J9921
8 CLIMATE CHANGE IS A GEOGRAPHIC PROBLEM JUNE 2010
by planners, engineers, and scientists to display and analyze all forms of location-referenced data, from meteorological information to patterns of human settlement. GIS creates a new framework for studying global climate change by allowing users to inventory and display large, complex spatial datasets. GIS can also be used to analyze the potential interplay between various factors, getting us closer to a true understanding of how our dynamic climate may change in the coming decades and centuries.
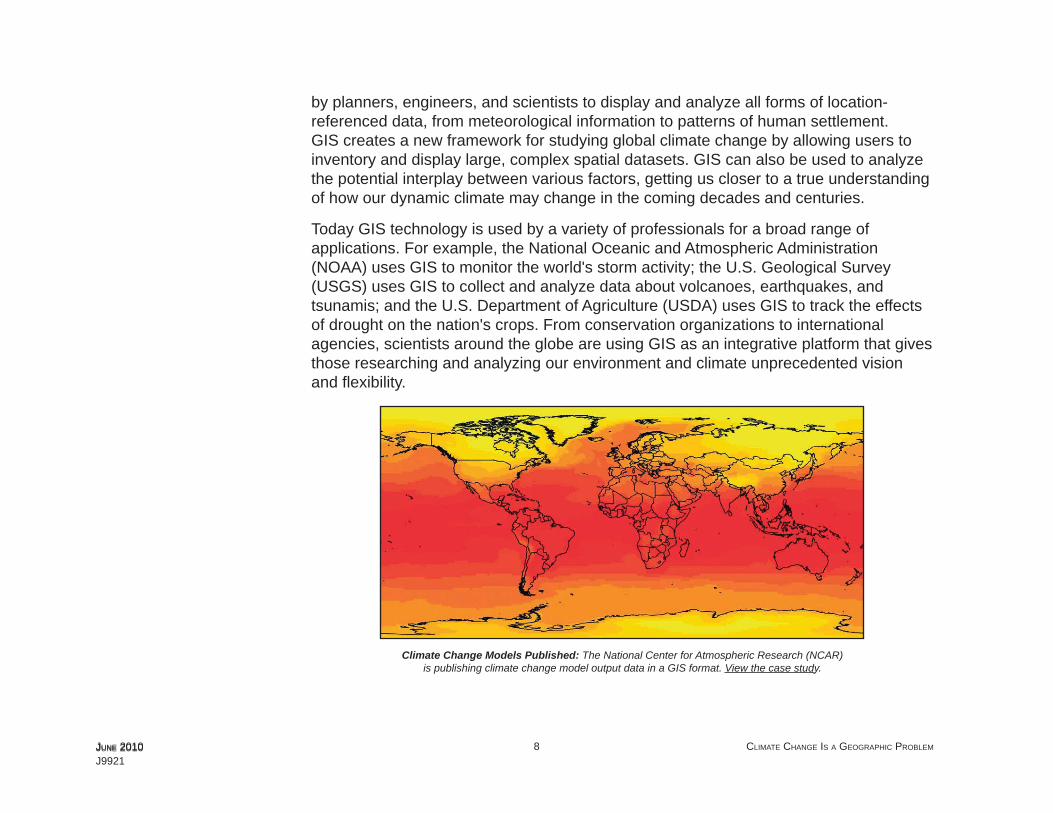
Today GIS technology is used by a variety of professionals for a broad range of applications. For example, the National Oceanic and Atmospheric Administration (NOAA) uses GIS to monitor the world's storm activity; the U.S. Geological Survey (USGS) uses GIS to collect and analyze data about volcanoes, earthquakes, and tsunamis; and the U.S. Department of Agriculture (USDA) uses GIS to track the effects of drought on the nation's crops. From conservation organizations to international agencies, scientists around the globe are using GIS as an integrative platform that gives those researching and analyzing our environment and climate unprecedented vision and fl exibility.
Climate Change Models Published: The National Center for Atmospheric Research (NCAR) is publishing climate change model output data in a GIS format. View the case study.
JUNE 2010J9921
9 CLIMATE CHANGE IS A GEOGRAPHIC PROBLEM
Scientists have long classifi ed various phenomena into logical groupings, or systems. These classifi cations have helped greatly advance the understanding of component physical, biological, and social systems yet often create artifi cial boundaries between disciplines that can be detrimental to the understanding of larger issues. While advancing the understanding of each of these individual systems is vitally important, we ultimately need to bring all these systems together to understand how they are interrelated and dependent on one other.
Whole earth systems science offers an opportunity to advance the science and understanding of climate change by providing a framework for a comprehensive, interdisciplinary, integrated view of our planet. Aggregating complex physical, biological, and social data and models within a unifi ed framework will give us a single view of the whole earth system and provide us with the tools to manage—and ultimately design—our future in the most effective, effi cient, and morally defensible way.
A GIS-based approach to whole earth systems science provides a plan for understanding and addressing the entire breadth of climate change science issues in a holistic manner. Such a framework can provide a base enablement system for global data management, visualization, analysis, modeling, and design. To move climate change studies from a massive collection of unrelated or loosely linked endeavors toward an open, integrated framework, a number of areas need to be addressed.
Whole Earth Science
A GIS-Based Approach

JUNE 2010J9921
11 CLIMATE CHANGE IS A GEOGRAPHIC PROBLEM
What Is the Geographic Approach?
The geographic approach is a phrase often used to describe a high-level vision for using geospatial technology as a key method in fi nding answers to problems.
The geographic approach provides the necessary framework for GIS analysis.
JUNE 2010J9921
12 CLIMATE CHANGE IS A GEOGRAPHIC PROBLEM
Geography, the science of our world, coupled with GIS is helping us better understand the earth and apply geographic knowledge to a host of human activities. The outcome is the emergence of the geographic approach—a new way of thinking and problem solving that integrates geographic information into how we understand and manage our planet. This approach allows us to create geographic knowledge by measuring the earth, organizing this data, and analyzing and modeling various processes and their relationships. The geographic approach also allows us to apply this knowledge to the way we design, plan, and change our world.
Solving problems using a geographic approach is not new. It is fundamental to the way geographers study and analyze our world. The concept is perhaps best articulated by Ian L. McHarg in the 1969 book Design with Nature, in which he details the philosophical context for managing human activities within natural and cultural landscapes.
As a methodology, the geographic approach is used for location-based analysis and decision making. GIS professionals typically employ it to examine selected geographic datasets in detail, which are combined for the comprehensive study and analysis of spatial problems. This methodology parallels the well-known scientifi c method and includes a research-focused, iterative process for examining diverse datasets and uncovering potential solutions. GIS augments the analytic process, helping give people a clearer understanding of complex problems that often include geographic components. This in turn allows better decision making and more opportunities to conserve limited resources, as well as improves the way we work. Many experienced GIS professionals intuitively begin their projects with a structured methodology of this nature. But for those new to GIS technology, these fi ve steps will provide a defi ned and proven approach.
JUNE 2010J9921
13 CLIMATE CHANGE IS A GEOGRAPHIC PROBLEM
Step 1: Ask > Acquire > Examine > Analyze > Act
Approaching a problem geographically involves framing the question from a location-based perspective. What is the problem you are trying to solve or analyze, and where is it located? Being as specifi c as possible about the question you're trying to answer will help you with the later stages of the geographic approach, when you're faced with deciding how to structure the analysis, which analytic methods to use, and how to present the results to the target audience.
Step 2: Ask > Acquire > Examine > Analyze > Act
After clearly defi ning the problem, it is necessary to determine the data needed to complete your analysis and ascertain where that data can be found or generated. The type of data and the geographic scope of your project will help direct your methods of collecting data and conducting the analysis. If the method of analysis requires detailed and/or high-level information, it may be necessary to create or calculate the new data. Creating new data may simply mean calculating new values in the data table or obtaining new map layers or attributes but may also require geoprocessing. Sometimes you might have to consider using surrogate measures, which allow data creation through indirect means. For example, an economic indicator can be used as a surrogate for income. However, because of the limits in collecting accurate data in this way, it is necessary to indicate in your results the manner in which the data was collected.
JUNE 2010J9921
14 CLIMATE CHANGE IS A GEOGRAPHIC PROBLEM
Step 3: Ask > Acquire > Examine > Analyze > Act
You will not know for certain whether the data you have acquired is appropriate for your study until you thoroughly examine it. This includes visual inspection as well as investigating how the data is organized (its schema), how well the data corresponds to other datasets and the rules of the physical world (its topology), and the story of where the data came from (its metadata). Since the data ultimately selected for your analysis depends on your original question or questions, as well as the results that you are seeking and how those results will be used, your examination may be dependent on how precise the data must be to answer the original questions. Because data acquisition can be the most expensive and time-consuming part of the process, it is important that you begin with a well-defi ned data model for your organization and your project. This will provide the basis for evaluating potential data acquisitions.
Step 4: Ask > Acquire > Examine > Analyze > Act
The data is processed and analyzed based on the method of examination or analysis you choose, which is dependent on the results you hope to achieve. Understanding the effects of parameters you have established for the analysis, as well as the algorithms being implemented, is critical so that you can correctly interpret the results. Do not underestimate the power of "eyeballing" the data. Looking at the results can help you decide whether the information is valid or useful or whether you should rerun the analysis using different parameters or even a different method. GIS modeling tools make it relatively easy to make these changes and create new output.
JUNE 2010J9921
15 CLIMATE CHANGE IS A GEOGRAPHIC PROBLEM
Step 5: Ask > Acquire > Examine > Analyze > Act
The results and presentation of the analysis are important parts of the geographic approach. The results can be shared through reports, maps, tables, and charts and delivered in printed form or digitally over a network or on the Web. You need to decide what the best means for presenting your analysis are. You can compare the results from different analyses and see which method presents the information most accurately. You can also tailor the results for different audiences. For example, one audience might require a conventional report that summarizes the analyses and conveys recommendations or comparable alternatives. Another audience may need an interactive format that allows them to ask what-if questions or pursue additional analysis. Yet another audience may simply need to know how the results affect them or their interests.
The geographic approach provides the necessary framework for GIS analysis and helps ensure accurate, verifi able results. By carefully documenting, archiving, and sharing your results and methodology, other researchers receive the opportunity to verify your fi ndings. This practice, called full disclosure, also allows statistical measures of the reliability of this data to be established.
Using a methodology such as the geographic approach formalizes the analytic process with GIS, which allows a clearer understanding of the results and promotes a response that can be supported by the data. By applying the geographic approach to help us solve complex problems, we can make better decisions, conserve resources, and improve the way we work.
Clearer Understanding of Results
JUNE 2010J9921
17 CLIMATE CHANGE IS A GEOGRAPHIC PROBLEM
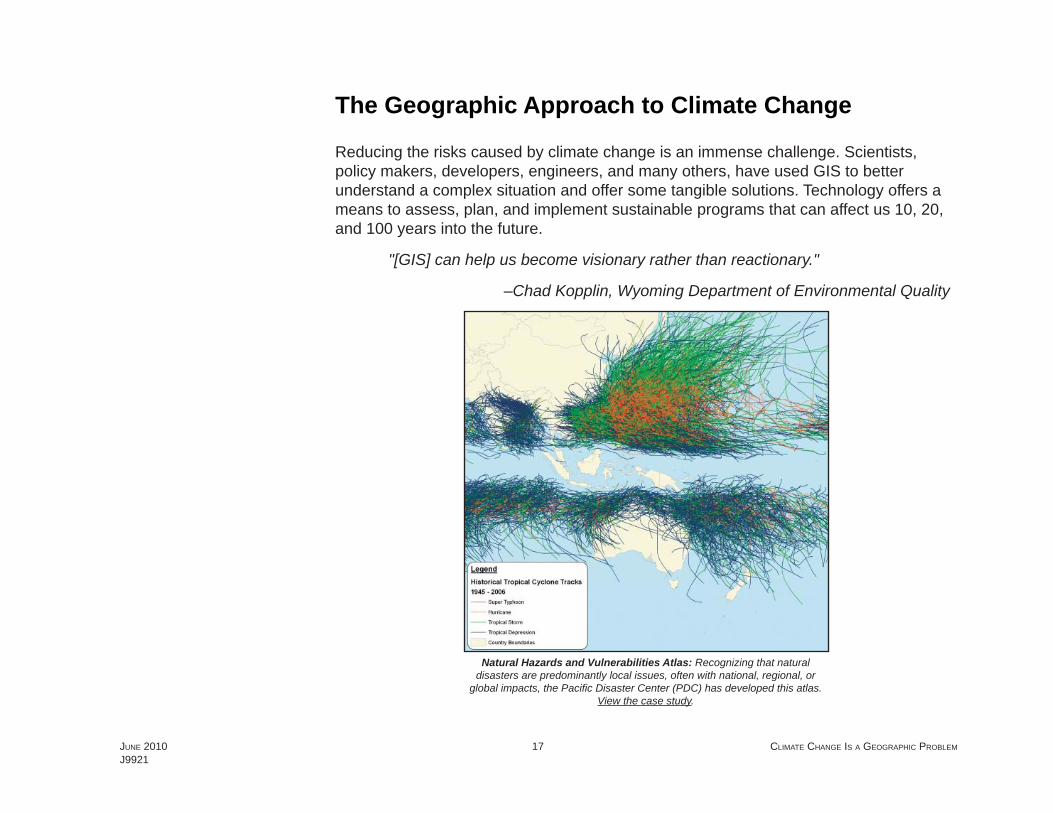
The Geographic Approach to Climate Change
Reducing the risks caused by climate change is an immense challenge. Scientists, policy makers, developers, engineers, and many others, have used GIS to better understand a complex situation and offer some tangible solutions. Technology offers a means to assess, plan, and implement sustainable programs that can affect us 10, 20, and 100 years into the future.
"[GIS] can help us become visionary rather than reactionary."
–Chad Kopplin, Wyoming Department of Environmental Quality
Natural Hazards and Vulnerabilities Atlas: Recognizing that natural disasters are predominantly local issues, often with national, regional, or
global impacts, the Pacifi c Disaster Center (PDC) has developed this atlas. View the case study.
JUNE 2010J9921
18 CLIMATE CHANGE IS A GEOGRAPHIC PROBLEM
A GIS-based framework helps us gain a scientifi c understanding of earth systems at a truly global scale and leads to more thoughtful, informed decision making:
Deforestation analysis spurs successful reforestation programs and sustainable management.
Study of potential sea level rise leads to adaptive engineering projects.
Emissions assessment brings about research into alternative energy sources such as wind turbine siting and residential solar rooftop programs.
Climate change is a geographic problem, and we believe solving it takes a geographic solution.
What are the benefi ts of using GIS technology to advance climate change science? This question was recently posed at the Spatial Roundtable (www.spatialroundtable.com), where GIS industry thought leaders share their perspectives about concerns, trends, challenges, and technologies. Taking a closer look at paramount issues surrounding climate change science, participants in the Spatial Roundtable offered thought-provoking insight into the role of geospatial technologies. We would like to share some important points made by several Spatial Roundtable contributors.
"Climate change is a global concern," noted Dr. Fred Stolle, forest landscape objective project manager, World Resources Institute. "It is one of the fi rst problems we encounter in recent times that links all geographies in a direct way to each other." And participants agreed that geospatial technologies have much to offer when tackling a large, complex geographic problem such as climate change. "GIS . . . is the best model of our real world," said Prof. Dang Hung Vo, Dr Sc., president, Vietnam Association of Geo-Cart-RS. "GIS with updated data helps people to know what happens in our planet, how climate change takes place, and where impacts of climate change affect people."
A Global Concern
JUNE 2010J9921
19 CLIMATE CHANGE IS A GEOGRAPHIC PROBLEM
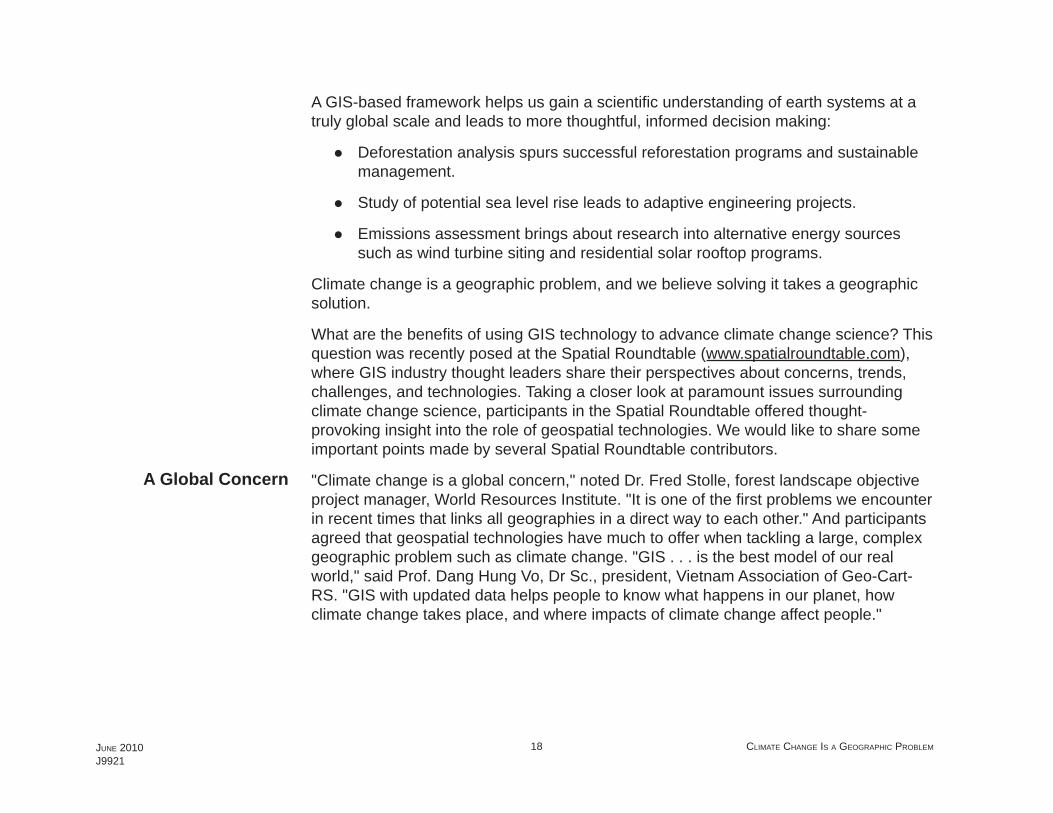
Siting Emergency Medical Centers: Emergency managers determinedthe optimal location for a new medical distribution center using
a GIS-based allocation model. View the case study.
The availability of data was identifi ed as a critical issue for the application of geospatial technologies. "All things on the earth are related to each other," said Hoang Minh Hien, deputy director, Disaster Management Center, Vietnam. "To understand or prevent or fi ght climate change, we cannot skip the steps of building a general database to explore and apply GIS integration abilities, which are essential."
The use of geospatial technologies in climate change science is not limited to GIS; remote sensing was also identifi ed as a foundational technology by several participants. "Tying remote-sensing technologies and data to GIS is a powerful combination of understanding spatial patterns in the earth's ever-changing surface," said Peter McIntosh, manager of Technical Marketing and Outreach, ITT Visual Information
JUNE 2010J9921
20 CLIMATE CHANGE IS A GEOGRAPHIC PROBLEM
Solutions. "Remote sensing allows us to understand what's going on in regions that are largely inaccessible but very signifi cant in regard to climate forcing, as well as tracking regional scale areas in a way not feasible to do on the ground. Using this information in a GIS allows us to track, model, and observe climate trends across the planet's surface, giving us the necessary information to help us set goals and policies and educate the public."
Using GIS and remote-sensing technologies together offers a powerful solution. "GIS and remote-sensing technologies provide the framework, tools, and data needed to address complex earthcentric problems such as climate change," said Michael Hollis, president and CEO, Geospace Inc. "Using GIS and remote-sensing techniques allow us to utilize complex statistical methods to view trends and changes at specifi c times or over periods of time," added Chad Kopplin, GIS coordinator, Wyoming Department of Environmental Quality. "GIS can help us study potential solutions to problems and potential outcomes of implementing the potential solutions. It can help us become visionary rather than reactionary."
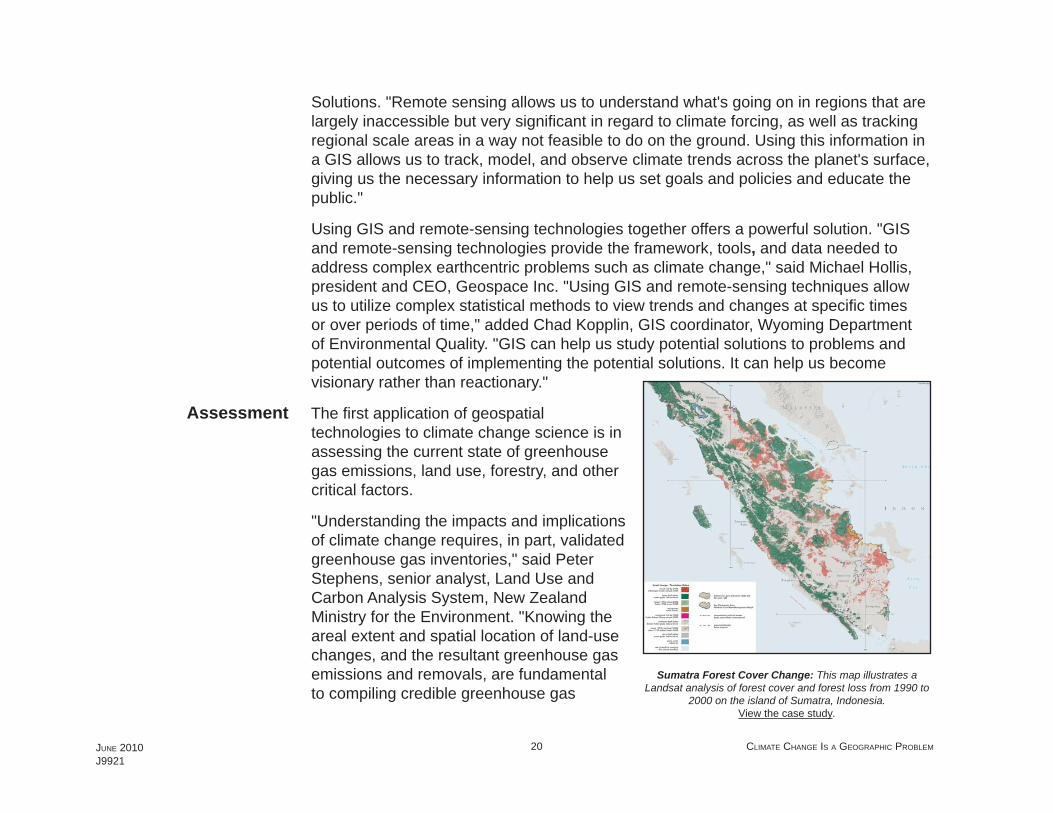
The fi rst application of geospatial technologies to climate change science is in assessing the current state of greenhouse gas emissions, land use, forestry, and other critical factors.
"Understanding the impacts and implications of climate change requires, in part, validated greenhouse gas inventories," said Peter Stephens, senior analyst, Land Use and Carbon Analysis System, New Zealand Ministry for the Environment. "Knowing the areal extent and spatial location of land-use changes, and the resultant greenhouse gas emissions and removals, are fundamental to compiling credible greenhouse gas
Assessment
Sumatra Forest Cover Change: This map illustrates a Landsat analysis of forest cover and forest loss from 1990 to
2000 on the island of Sumatra, Indonesia. View the case study.
JUNE 2010J9921
21 CLIMATE CHANGE IS A GEOGRAPHIC PROBLEM
inventories. This is particularly important for the Land Use, Land-Use Change and Forestry (LULUCF) sector."
"New Zealand is using remotely sensed data and GIS to meet its land-use change mapping and reporting obligations under the UNFCCC [United Nations Framework Convention on Climate Change] and the Kyoto Protocol," added Stephens. "GIS technology provides the platform for storing and managing land-use change data in a transparent and fully versioned manner, ensuring that good practice is met."
"GIS is one of the key elements of the forest carbon monitoring systems needed by tropical developing countries to manage their forests," said Dr. James Baker, director of the Global Carbon Measurement Program of the William J. Clinton Foundation. "Once these systems are in place for forest monitoring, they can also be used to establish and maintain property rights and land tenure, key elements of economic development. Therefore, just as forestry monitoring is the entry point for dealing with climate change, the systems we use for forestry monitoring are the entry point for development in general."
Once we have comprehensive assessments in place, we can begin to design mitigation measures. Again, geography—and geospatial technology—is a key component of the solution. "Suddenly, it is very important where something is happening," noted Stolle. "By carefully choosing the location for expansion of agricultural land, countries can continue to develop their agriculture while minimizing their contributions to climate change—a pure win-win situation."
For some participants, planning for—and responding to—climate change-induced disasters was an important consideration. "The increase of carbon dioxide and greenhouse gases (GHGs) in the atmosphere, combined with climate variability, will likely bring about more extreme weather events, such as tropical storms, fl oods, and droughts," said Dr. Nguyen Huu Ninh, chairman, Centre for Environmental Research. "Global warming and the induced climate change are projected to exacerbate the frequency, magnitude, and intensity of climate-related weather events. Disasters brought about by both climate variability and climate change are thus climate-related disasters. GIS technology upholds base-level information requirements and provides
Mitigation
JUNE 2010J9921
22 CLIMATE CHANGE IS A GEOGRAPHIC PROBLEM
emergency management workfl ow support through data management, situational awareness, planning, and fi eld operations. The visualization of data and planning processes based on GIS tools will give comprehensive situational awareness to policy makers who need to make the right decisions for disaster and emergency management situations at the right time. The application of GIS technology could then provide solutions to many problems raised by climate change, such as disaster and emergency management."
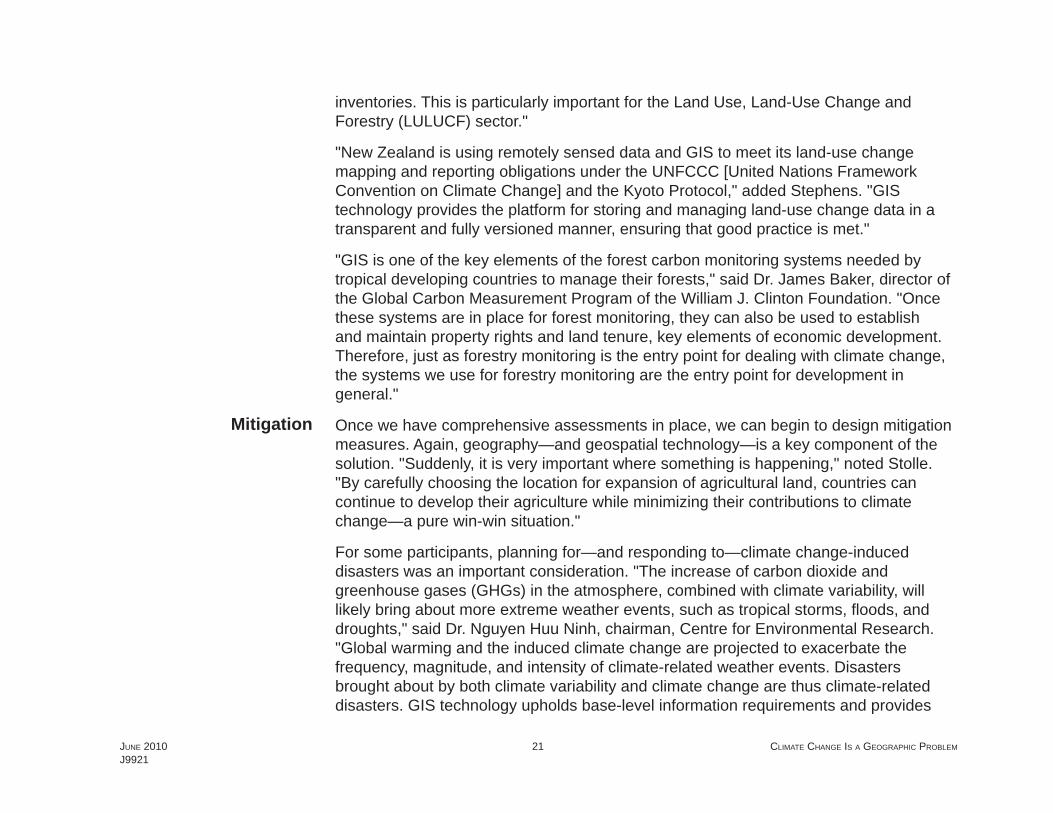
"I think the true power of geospatial analysis is that it allows us to systematically assess our options for mitigating these changes and minimizing any adverse impacts," said Dr. Jerry Johnston, geospatial information offi cer, U.S. Environmental Protection Agency (EPA). "While this capability is currently largely limited to the domain of professional geospatial practitioners, these tools will ultimately be more seamlessly integrated into mainstream, consumer-oriented visualization platforms."
Johnston is not the only participant who saw geospatial technology helping to expand public participation in the climate change dialog. "GIS is often seen primarily as a tool for educated analysis of causes and impacts of phenomena related to climate change, noted Dr. Tuomo Kauranne, Arbonaut Ltd. "However, it can also have an operational role in mitigating global warning, especially when integrated with using the Internet for information collection and dissemination. At Arbonaut, we look forward to operating
Adaptation
National Carbon Sequestration: The U.S. Department of Energy's Regional Carbon Sequestration Partnerships (RCSPs) generated data for the layers displayed in the
Carbon Sequestration Atlas of the United States and Canada. View the case study.
JUNE 2010J9921
23 CLIMATE CHANGE IS A GEOGRAPHIC PROBLEM
forest carbon measurement as a process shared both with local forest-dependent communities and with Internet-based GIS users. The process merges fi eld measurements with airborne laser scanning and satellite images into a seamless information fl ow that collects, distills, and disseminates detailed, high-resolution carbon offset estimates to all parties concerned in near real time, in terms of tree growth. Intelligent GIS tools are indispensable in achieving such speed and accuracy."
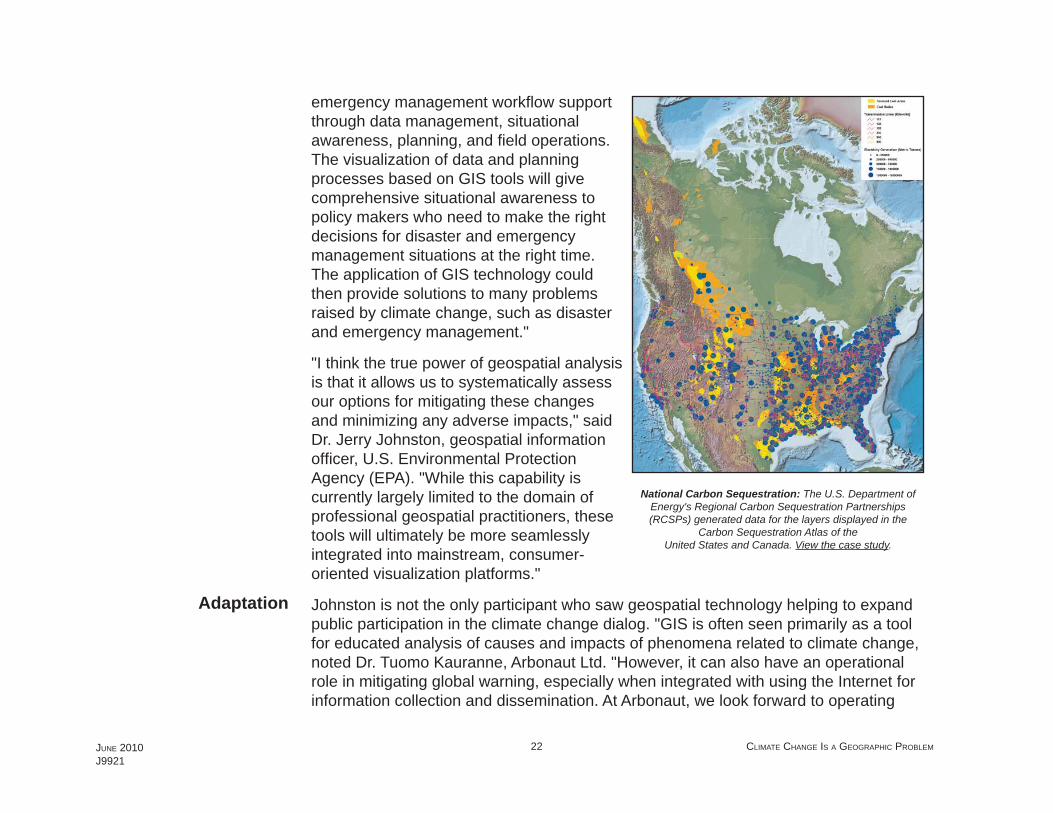
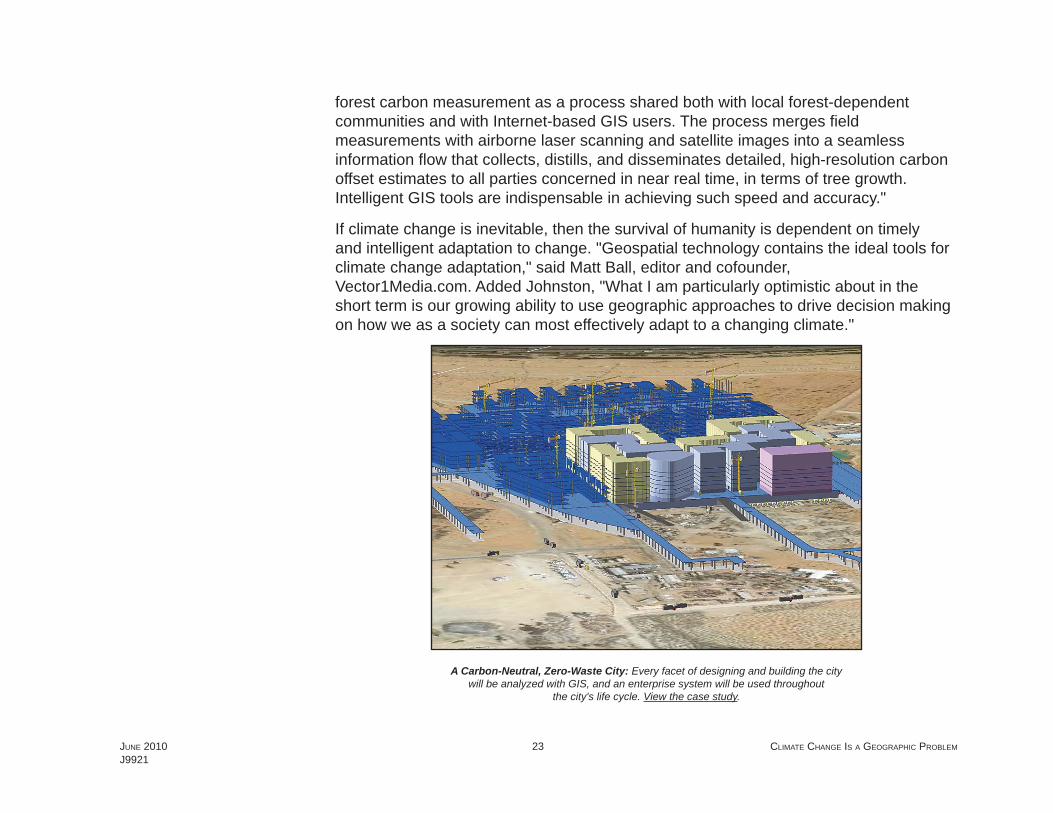
If climate change is inevitable, then the survival of humanity is dependent on timely and intelligent adaptation to change. "Geospatial technology contains the ideal tools for climate change adaptation," said Matt Ball, editor and cofounder, Vector1Media.com. Added Johnston, "What I am particularly optimistic about in the short term is our growing ability to use geographic approaches to drive decision making on how we as a society can most effectively adapt to a changing climate."
A Carbon-Neutral, Zero-Waste City: Every facet of designing and building the city will be analyzed with GIS, and an enterprise system will be used throughout
the city's life cycle. View the case study.
JUNE 2010J9921
24 CLIMATE CHANGE IS A GEOGRAPHIC PROBLEM
"Combating climate change will require fundamental changes to the standard of living enjoyed by the developed world," said Matt Hayes, storm water planner, City of Wilmington, North Carolina. "This means real sacrifi ces for everyone concerned. GIS tools offer some of the best approaches to prepare for what might surely be a huge challenge for the world community." But Gregory Vlasek saw things differently. "We can virtually eliminate our carbon emissions to the atmosphere by transitioning to nuclear and solar power," said Vlasek. "We can expand the global carbon sink by conserving and expanding global forests. GIS has an absolutely critical role in monitoring progress and validating solutions."
"Using GIS allows communities to make plans based on the best available scientifi c information and integrate the needs of both natural and human systems," added Richard Nauman, conservation scientist and GIS manager, National Center for Conservation Science & Policy. Some people are already building the infrastructure for such planning activities. "At the University of Michigan School of Natural Resources and Environment, we are already using GIS on several of our research projects," said Rachel Kornak, database manager/GIS specialist, International Forestry Resources and Institutions. "For example, as part of the project entitled Initiative on Climate Adaptation Research and Understanding through the Social Sciences, we are compiling case studies of human adaptations to climate change, coding information about them into a standardized database, and mapping their distribution around the world. With this GIS database, we will be able to better understand how local populations can adapt to changes, such as fl ooding and drought, and how relationships between livelihoods, institutions, adaptations, and location affect outcomes."
"GIS . . . is the best model of our real world." –Dang Hung Vo, Vietnam Association of Geo-Cart-RS
The tough challenges presented by climate change also offer many opportunities for geospatial professionals to excel with creative and innovative applications and solutions. Many agreed there was signifi cant opportunity in the area of visualization and communication. "Beyond the tremendously important role of GIS in defi ning the science of climate change impacts and informing policy choices is the role that spatial visualization must play in galvanizing the opinion leader and average person alike," said
Opportunities
JUNE 2010J9921
25 CLIMATE CHANGE IS A GEOGRAPHIC PROBLEM
Larry Orman, executive director, GreenInfo Network. "Many GIS applications are presently targeted toward policy and decision makers to ensure that climate change data and science is accessible to the nonscientist in an easily digestible, actionable form," noted Peter Eredics, forestry manager, ESRI. "Geospatial initiatives must present compelling stories that distill their main points in ways that regularly create aha moments," added Orman.
"The scientifi c community has already demonstrated the incredible power of geospatial technology as a key enabler for advancing our shared understanding of past and future climate change," said Johnston. "The most striking examples of this are the multitude of powerful geospatial visualizations that have been developed to communicate the urgency of our current situation by showing the past, present, and possible future of the earth based on state-of-the-art science. Examples of these visualizations include those depicting disappearing glaciers in the Arctic, plant and animal species migrations, and sea level rise and coastal inundation. These images have literally changed the way we think about our world and its future. And this is just the beginning."
As discussed previously, the availability of data presents a critical opportunity. "It has been my experience over the last three decades of conducting spatial analyses on large and small landscapes that the necessary GIS tools to support the requisite planning and analyses already exist," said Dr. Don Reimer, president, D.R. Systems Inc. "What is lacking is natural resource information with suffi cient spatial and attribute detail to enable the appropriate precision level to be achieved in the planning process. It seems to me that if we really want to be able to utilize forests and natural resources to help combat climate change, the fi rst priority is to fi nd a way to secure suffi cient long-term funding for the collection and maintenance of better site-specifi c data. Then we could really make use of all the superb GIS tools and information."

JUNE 2010J9921
26 CLIMATE CHANGE IS A GEOGRAPHIC PROBLEM
Carbon Sequestration Potential: The Sauk sequence is the lowest major sequence ofrocks within the Paleozoic strata of North America. View the case study.
One of the most compelling opportunities is in teaching future scientists, policy makers, and citizens about the geographic approach to solving the problem of climate change. "I am working with the next generation, 18-year-old students, who really will have to deal with the impacts of our present lifestyle," said Mikael Krekula, teacher, GIS/environment, Hjalmar Lundbohms School, Sweden. "Climate change is one of these coming problems. Our students are working in a local scale to understand the global trends. They are monitoring and measuring permafrost at a research station, measuring ice thickness in a melting glacier, and measuring changes in water quality in several lakes around the area to see changes in the environment. Our students . . . understand the local and global scale of environmental impact. GIS is an excellent tool to help learn, understand, and make wise decisions."

JUNE 2010J9921
27 CLIMATE CHANGE IS A GEOGRAPHIC PROBLEM
A GIS-Based Action Plan
Our world faces unprecedented challenges, and only one technology is poised to collect, manage, and analyze the myriad of physical, biological, and cultural data describing the past, present, and future of earth. That technology is GIS, commonly used today to view and manage information about geographic places, analyze geographic relationships, and model geographic processes.
Global Earth Observation System of Systems: The Group on Earth Observations (GEO) operates a portal (GEOportal) that provides a single
Internet access point for data, imagery, and analytic software packages covering the entire earth. View the case study.
GIS technology has proved to be invaluable in driving intelligent decision making, and its application to climate science is a natural fi t. In fact, extensive work has already been
JUNE 2010J9921
28 CLIMATE CHANGE IS A GEOGRAPHIC PROBLEM
done over the last 40 years to apply GIS technology to address subjects such as land-use inventory, data model development, climate model integration, carbon accounting, and climate change visualization.
We are at a point in the evolution of the technology and its broad application where the next logical step is development of a GIS-based framework for earth systems modeling and global design. Such a system would cross academic, scientifi c, and industrial domains and political boundaries to serve as a platform for a comprehensive climate monitoring, modeling, and management system.
There are several actions we can take now to establish a framework that leverages mature GIS technology to advance climate science.
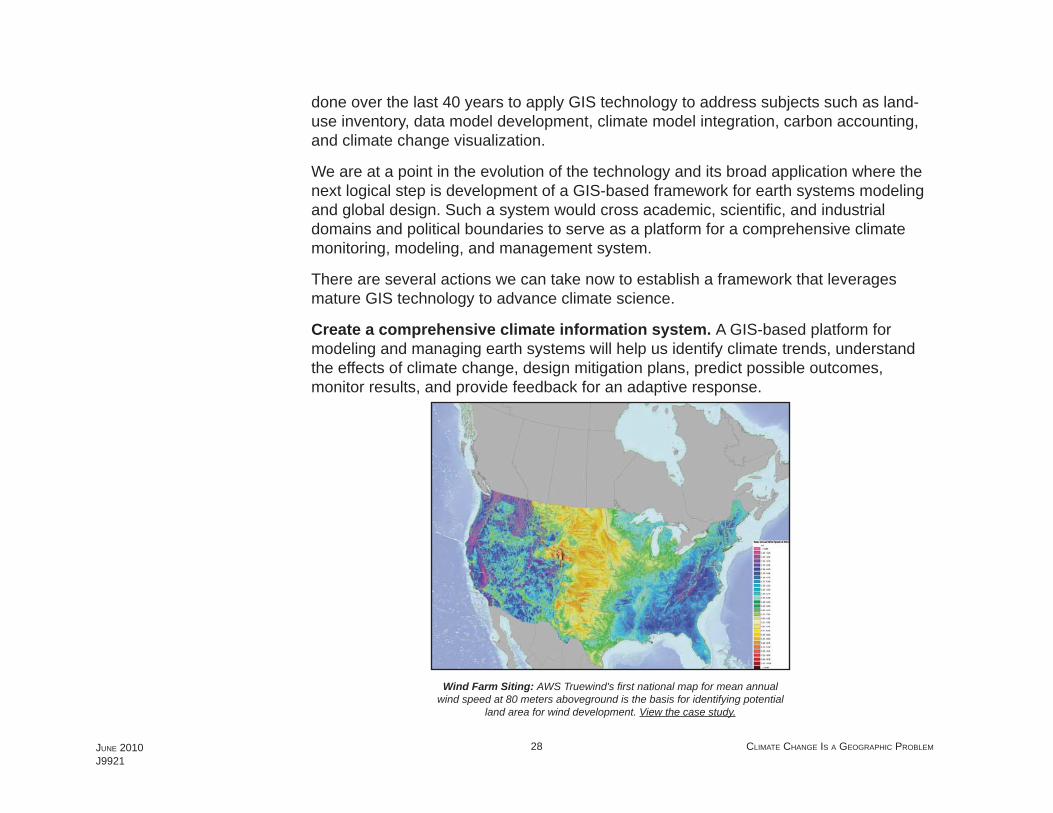
Create a comprehensive climate information system. A GIS-based platform for modeling and managing earth systems will help us identify climate trends, understand the effects of climate change, design mitigation plans, predict possible outcomes, monitor results, and provide feedback for an adaptive response.
Wind Farm Siting: AWS Truewind's fi rst national map for mean annual wind speed at 80 meters aboveground is the basis for identifying potential
land area for wind development. View the case study.
JUNE 2010J9921
29 CLIMATE CHANGE IS A GEOGRAPHIC PROBLEM
Create a climate data infrastructure. A global spatial data infrastructure for climate change studies—a loosely coupled, decentralized directory of all types of climate and map data and imagery—will serve as the basis for earth systems modeling and global design projects conducted in the climate information system.
Integrate earth systems modeling. A thorough inventory of climate change-related spatial data models and sharing of best practices on interoperability will be of tremendous value as we build a climate information system for analyzing impacts and alternative futures at a comprehensive, global scale.
Develop a global climate dashboard. A global climate dashboard would summarize information from the climate information system, providing executives and citizens alike with real-time geographic visualization of various earth systems parameters, enabling a more responsive, iterative, and adaptive response to climate change.
Move toward global design. A GIS-based geodesign framework will provide a robust set of tools for design professionals to support the design and evaluation of alternate futures for our earth and its systems.
We are only beginning to understand the complex issues posed by climate change. Only through careful observation of the data, application of scientifi c principles, and leveraging of modern technology can we hope to grasp the intricacies of the exceedingly complex systems that comprise our planet. A GIS-based framework for climate science offers the best chance at gaining a scientifi c understanding of earth systems at a truly global scale and for making thoughtful, informed design decisions that ultimately allow humans and nature to coexist more harmoniously.
JUNE 2010J9921
31 CLIMATE CHANGE IS A GEOGRAPHIC PROBLEM
Bibliography
Artz, Matt. "Science and Our Changing Climate: GIS Creates a Framework for Research and Modeling." Redlands Daily Facts (Redlands, CA), January 30, 2008.
Artz, Matt (editor). GIS for Climate Change. GIS Best Practices series. ESRI: Redlands, California, November 2008 (fi rst edition); February 2010 (second edition).
Artz, Matt. "Climate Change Science, GIS, and Whole Earth Systems." GISandScience.com, April 29, 2009.
Artz, Matt. "Towards a GIS-Based Framework for Climate Change Studies." GISandScience.com, May 19, 2009.
Artz, Matt. "GIS and Global Design." GISandScience.com, June 4, 2009.
Artz, Matt, and Jim Baumann. "What Is The Geographic Approach?" ArcWatch, August 2009.
Dangermond, Jack. "GIS Helping Manage Our World." ArcNews, Fall 2005.
Dangermond, Jack. "GIS: Designing Our Future." ArcNews, Summer 2009.
Dangermond, Jack. "Climate Change Is a Geographic Problem That Requires a Geographic Solution." Climate Action, 2010/2011.
Dangermond, Jack. "The Geographic Approach to Climate Change." GeoSpatial Today, April 2010.
Dangermond, Jack, and Matt Artz. A GIS-Based Framework for Earth Systems Modeling and Global Design. In: Geoinformatics for Climate Change Studies. (Submitted 2009; in review)
JUNE 2010J9921
33 CLIMATE CHANGE IS A GEOGRAPHIC PROBLEM
Acknowledgments
Sincere appreciation is extended to all the Spatial Roundtable participants; your ideas and perspectives have been a signifi cant contribution to the use of geospatial technologies to address the climate crisis. A special thank-you goes to Jim Baumann and Barbara Shields of Esri for their valuable input on this e-book.
Portions of this e-book have been previously published in ArcNews, GISandScience.com, the Redlands Daily Facts, ArcWatch, Spatial Roundtable, GeoSpatial Today, and Climate Action, 2009/2010. Portions of this e-book are based on a paper titled "A GIS-Based Framework for Earth Systems Modeling and Global Design" by Jack Dangermond and Matt Artz, which was submitted for inclusion in the book Geoinformatics for Climate Change Studies.
Copyright © 2008–2010 Esri. All rights reserved.

Copyright © 2010 ESRIAll rights reserved.Printed in the United States of America.
The information contained in this document is the exclusive property of ESRI. This work is protected under United States copyright law and other international copyright treaties and conventions. No part of this work may be reproduced or transmitted in any form or by any means, electronic or mechani-cal, including photocopying and recording, or by any information storage or retrieval system, except as expressly permitted in writing by ESRI. All requests should be sent to Attention: Contracts and Legal Services Manager, ESRI, 380 New York Street, Redlands, CA 92373-8100, USA.
The information contained in this document is subject to change without notice.
U.S. GOVERNMENT RESTRICTED/LIMITED RIGHTSAny software, documentation, and/or data delivered hereunder is subject to the terms of the License Agreement. In no event shall the U.S. Government acquire greater than RESTRICTED/LIMITED RIGHTS. At a minimum, use, duplication, or disclosure by the U.S. Government is subject to restric-tions as set forth in FAR §52.227-14 Alternates I, II, and III (JUN 1987); FAR §52.227-19 (JUN 1987) and/or FAR §12.211/12.212 (Commercial Technical Data/Computer Software); and DFARS §252.227-7015 (NOV 1995) (Technical Data) and/or DFARS §227.7202 (Computer Software), as applicable. Contractor/Manufacturer is ESRI, 380 New York Street, Redlands, CA 92373-8100, USA.
@esri.com, 3D Analyst, ACORN, ADF, AML, ArcAtlas, ArcCAD, ArcCatalog, ArcCOGO, ArcData, ArcDoc, ArcEdit, ArcEditor, ArcEurope, ArcExplorer, ArcExpress, ArcGIS, ArcGlobe, ArcGrid, ArcIMS, ARC/INFO, ArcInfo, ArcInfo Librarian, ArcInfo—Professional GIS, ArcInfo—The World’s GIS, ArcLocation, ArcLogistics, ArcMap, ArcNetwork, ArcNews, ArcObjects, ArcOpen, ArcPad, ArcPlot, ArcPress, ArcQuest, ArcReader, ArcScan, ArcScene, ArcSchool, ArcSDE, ArcSdl, ArcSketch, ArcStorm, ArcSurvey, ArcTIN, ArcToolbox, ArcTools, ArcUSA, ArcUser, ArcView, ArcVoyager, ArcWatch, ArcWeb, ArcWorld, ArcXML, Atlas GIS, AtlasWare, Avenue, Business Analyst Online, BusinessMAP, Community, CommunityInfo, Data Automation Kit, Database Integrator, DBI Kit, EDN, ESRI, ESRI—Team GIS, ESRI—The GIS Company, ESRI—The GIS People, ESRI—The GIS Software Leader, FormEdit, Geographic Design System, ESRI BIS, Geography Matters, Geography Network, GIS by ESRI, GIS Day, GIS for Everyone, GISData Server, JTX, MapBeans, MapCafé, MapData, MapObjects, Maplex, MapStudio, ModelBuilder, MOLE, NetEngine, PC ARC/INFO, PC ARCPLOT, PC ARCSHELL, PC DATA CONVERSION, PC STARTER KIT, PC TABLES, PC ARCEDIT, PC NETWORK, PC OVERLAY, PLTS, Rent-a-Tech, RouteMAP, SDE, Site·Reporter, SML, Sourcebook·America, Spatial Database Engine, StreetEditor, StreetMap, Tapestry, the ARC/INFO logo, the ArcAtlas logo, the ArcCAD logo, the ArcCAD WorkBench logo, the ArcCOGO logo, the ArcData logo, the ArcData Online logo, the ArcEdit logo, the ArcEurope logo, the ArcExplorer logo, the ArcExpress logo, the ArcGIS logo, the ArcGIS Explorer logo, the ArcGrid logo, the ArcIMS logo, the ArcInfo logo, the ArcLogistics Route logo, the ArcNetwork logo, the ArcPad logo, the ArcPlot logo, the ArcPress for ArcView logo, the ArcPress logo, the ArcScan logo, the ArcScene logo, the ArcSDE CAD Client logo, the ArcSDE logo, the ArcStorm logo, the ArcTIN logo, the ArcTools logo, the ArcUSA logo, the ArcView 3D Analyst logo, the ArcView Business Analyst logo, the ArcView Data Publisher logo, the ArcView GIS logo, the ArcView Image Analysis logo, the ArcView Internet Map Server logo, the ArcView logo, the ArcView Network Analyst logo, the ArcView Spatial Analyst logo, the ArcView StreetMap 2000 logo, the ArcView StreetMap logo, the ArcView Tracking Analyst logo, the ArcWorld logo, the Atlas GIS logo, the Avenue logo, the BusinessMAP logo, the Community logo, the Data Automation Kit logo, the Digital Chart of the World logo, the ESRI Data logo, the ESRI globe logo, the ESRI Press logo, the Geography Network logo, the MapCafé logo, the MapObjects Internet Map Server logo, the MapObjects logo, the MOLE logo, the NetEngine logo, the PC ARC/INFO logo, the Production Line Tool Set logo, the RouteMAP IMS logo, the RouteMAP logo, the SDE logo, The World’s Leading Desktop GIS, Water Writes, www.esri.com, www.esribis.com, www.geographynetwork.com, www.gis.com, www.gisday.com, and Your Personal Geographic Information System are trademarks, registered trademarks, or service marks of ESRI in the United States, the European Community, or certain other jurisdictions.
Other companies and products mentioned in the ESRI Web site may be trademarks or registered trademarks of their respective trademark owners.
G42411_gm
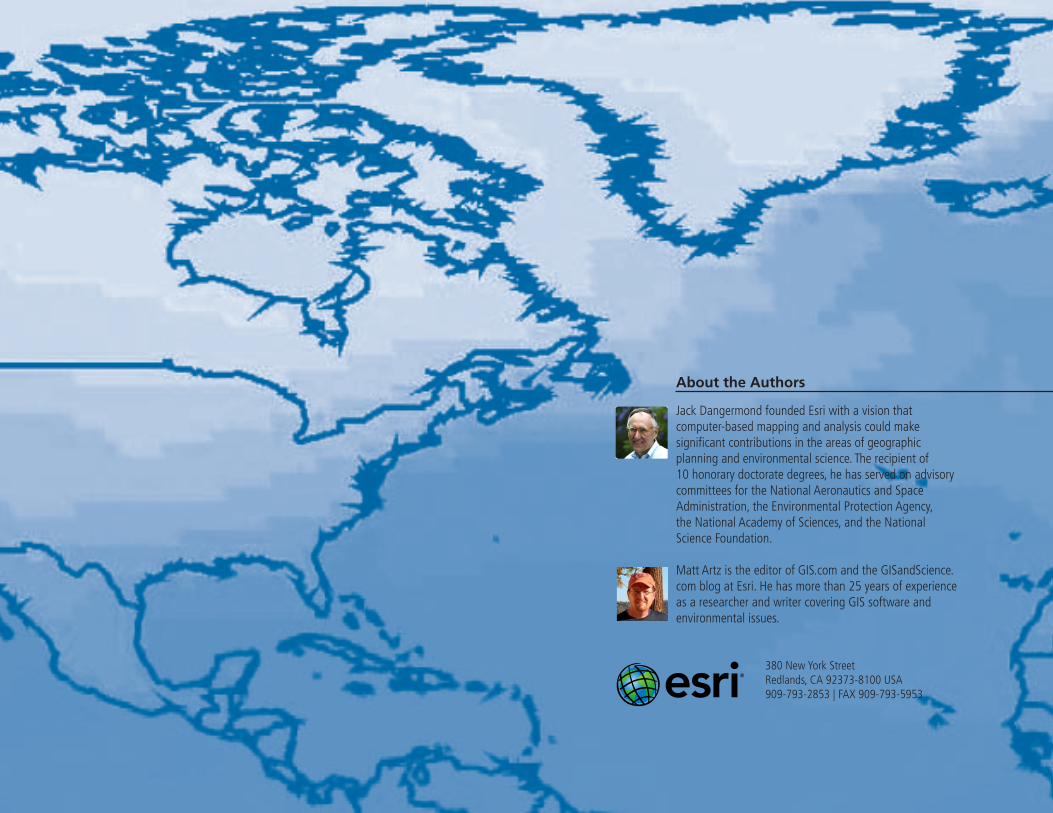
Jack Dangermond founded Esri with a vision that computer-based mapping and analysis could make significant contributions in the areas of geographic planning and environmental science. The recipient of 10 honorary doctorate degrees, he has served on advisory committees for the National Aeronautics and Space Administration, the Environmental Protection Agency, the National Academy of Sciences, and the National Science Foundation.
Matt Artz is the editor of GIS.com and the GISandScience.com blog at Esri. He has more than 25 years of experience as a researcher and writer covering GIS software and environmental issues.
About the Authors
380 New York StreetRedlands, CA 92373-8100 USA909-793-2853 | FAX 909-793-5953