climate change projections for the hudson valley
TRANSCRIPT
8/11/2019 Climate Change Projections for the Hudson Valley
http://slidepdf.com/reader/full/climate-change-projections-for-the-hudson-valley 1/29
7/15/2010
Climate Change Projections for the Hudson Valley
Art DeGaetanoDepartment of Earth & Atmospheric Science
Cornell UniversityDirector, NOAA Northeast Regional Climate Center
Hudson Valley Climate Change Workshop
July 14, 2010
ClimAID:
Adaptation Strategies in New York State
To provide New York State with cutting ‐edge information on its vulnerability to climate change and to facilitate the development of adaptation policies informed by both local
exper ence an s a e ‐o ‐ e‐ar sc en c now e ge.
8/11/2019 Climate Change Projections for the Hudson Valley
http://slidepdf.com/reader/full/climate-change-projections-for-the-hudson-valley 2/29
7/15/2010
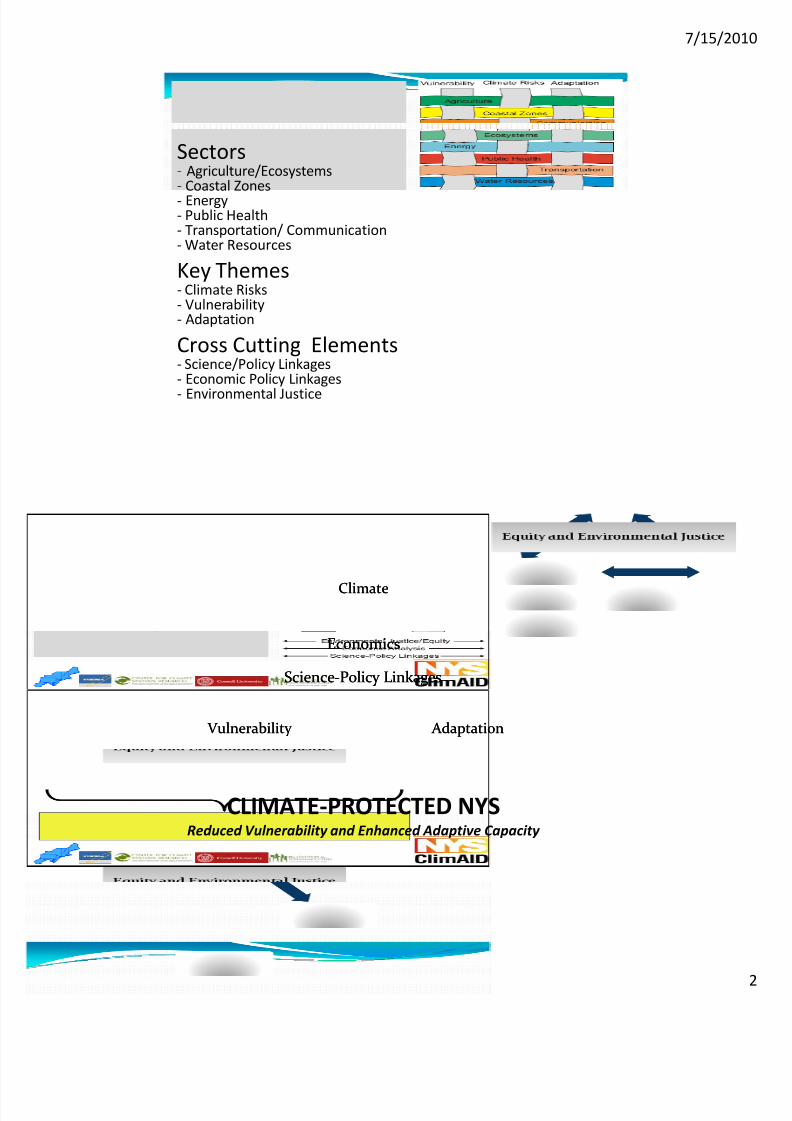
Sectors‐ Agriculture/Ecosystems‐ Coastal Zones‐ Energy‐ Public Health‐ Transportation/ Communication‐ Water Resources
Key Themes‐ Climate Risks‐ Vulnerability‐ Adaptation
Cross Cutting Elements‐ Science/Policy Linkages‐ Economic Policy Linkages‐ Environmental Justice
ClimateClimate
Economics
Economics
Adaptation Adaptation Vulnerability Vulnerability
Science‐Policy Linkages
Science‐Policy Linkages
CLIMATE‐PROTECTED NYSReduced Vulnerability and Enhanced Adaptive Capacity

8/11/2019 Climate Change Projections for the Hudson Valley
http://slidepdf.com/reader/full/climate-change-projections-for-the-hudson-valley 3/29
7/15/2010
Key Climate Products
• uantitative and qualitative projections, statewide and by region
• Sector ‐specific climateproducts
• Re ional climate modeling and statistical
downscaling
Basis of Climate Products
16 Global climate models 3 Emissions Scenarios Statistical Downscaling to 22 stations grouped into 7 regions
8/11/2019 Climate Change Projections for the Hudson Valley
http://slidepdf.com/reader/full/climate-change-projections-for-the-hudson-valley 4/29
7/15/2010
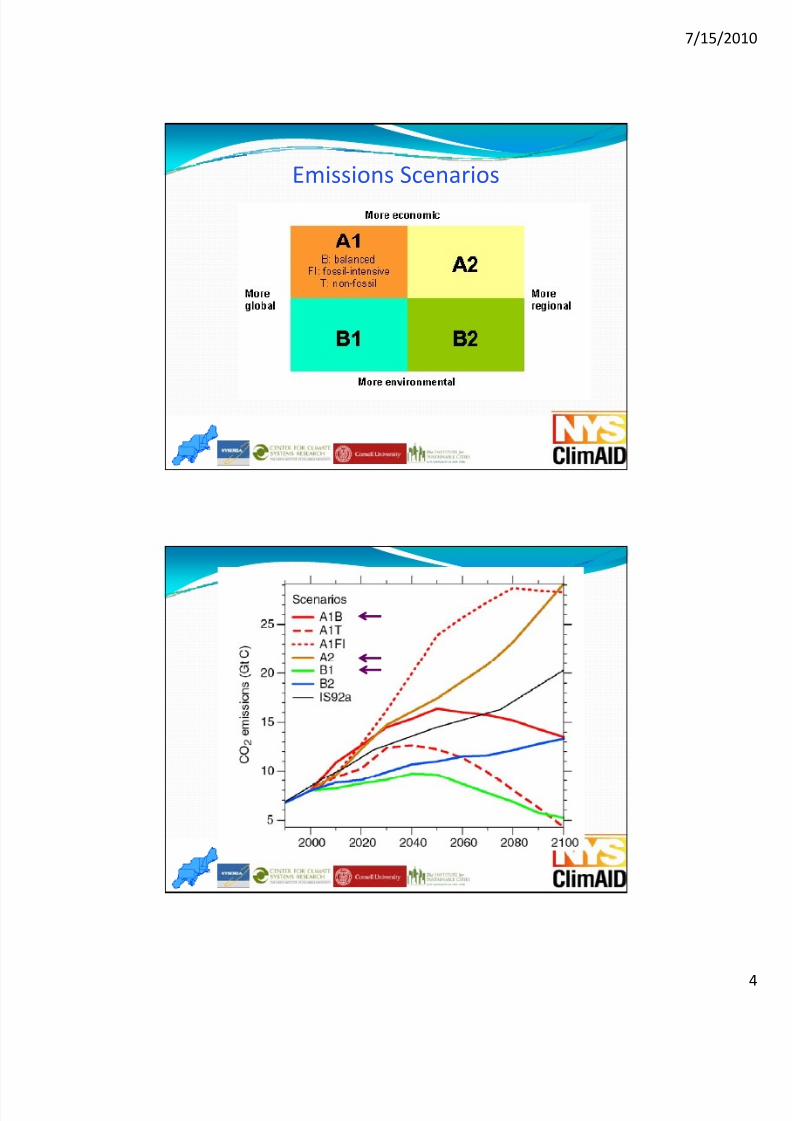
Emissions Scenarios

8/11/2019 Climate Change Projections for the Hudson Valley
http://slidepdf.com/reader/full/climate-change-projections-for-the-hudson-valley 5/29
7/15/2010
Climate Model Ensembles ClimAID (NYS Climate Adaptation Assessment)
67%
What is Downscaling?
200 x 300 km
75 km
8/11/2019 Climate Change Projections for the Hudson Valley
http://slidepdf.com/reader/full/climate-change-projections-for-the-hudson-valley 6/29
7/15/2010
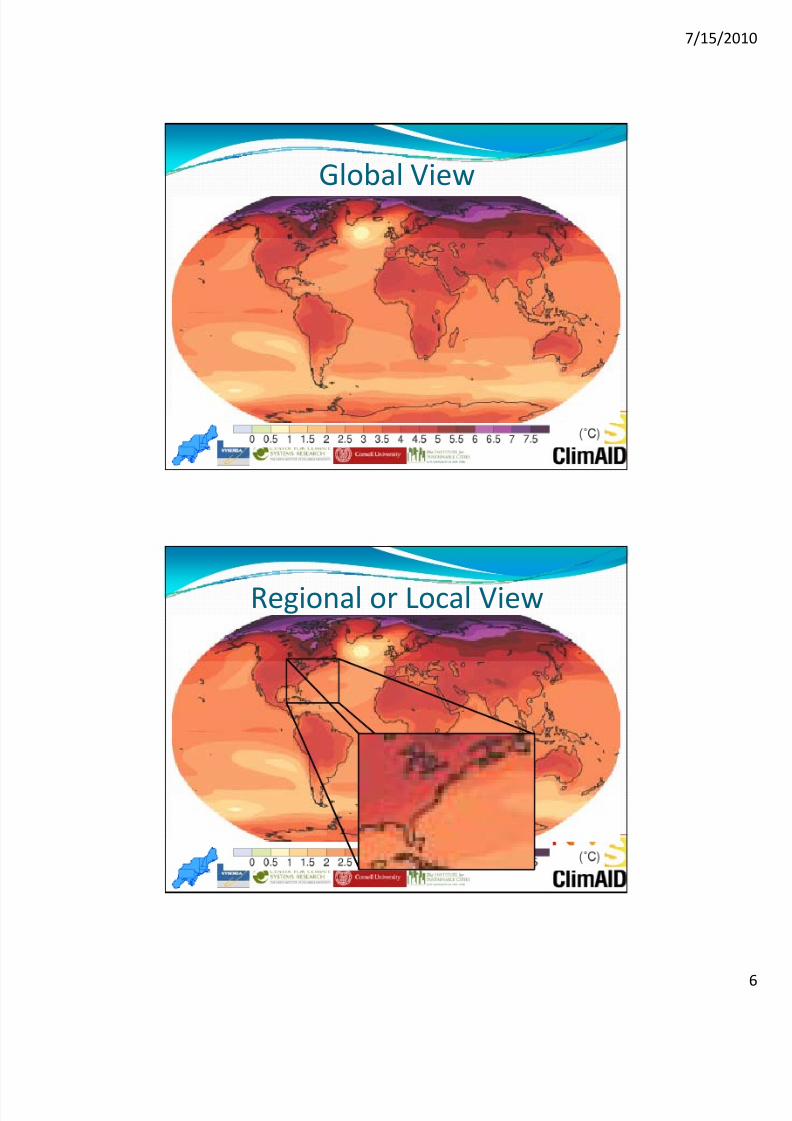
Global View
Regional or Local View

8/11/2019 Climate Change Projections for the Hudson Valley
http://slidepdf.com/reader/full/climate-change-projections-for-the-hudson-valley 7/29
7/15/2010
Smoothed topography
Downscaling
Resolves the mismatch in scale between the coarse spatial resolution of climate model output and the need for weather and climate information at a higher resolution
Extreme rainfall estimates Impact Assessment Models
8/11/2019 Climate Change Projections for the Hudson Valley
http://slidepdf.com/reader/full/climate-change-projections-for-the-hudson-valley 8/29
7/15/2010
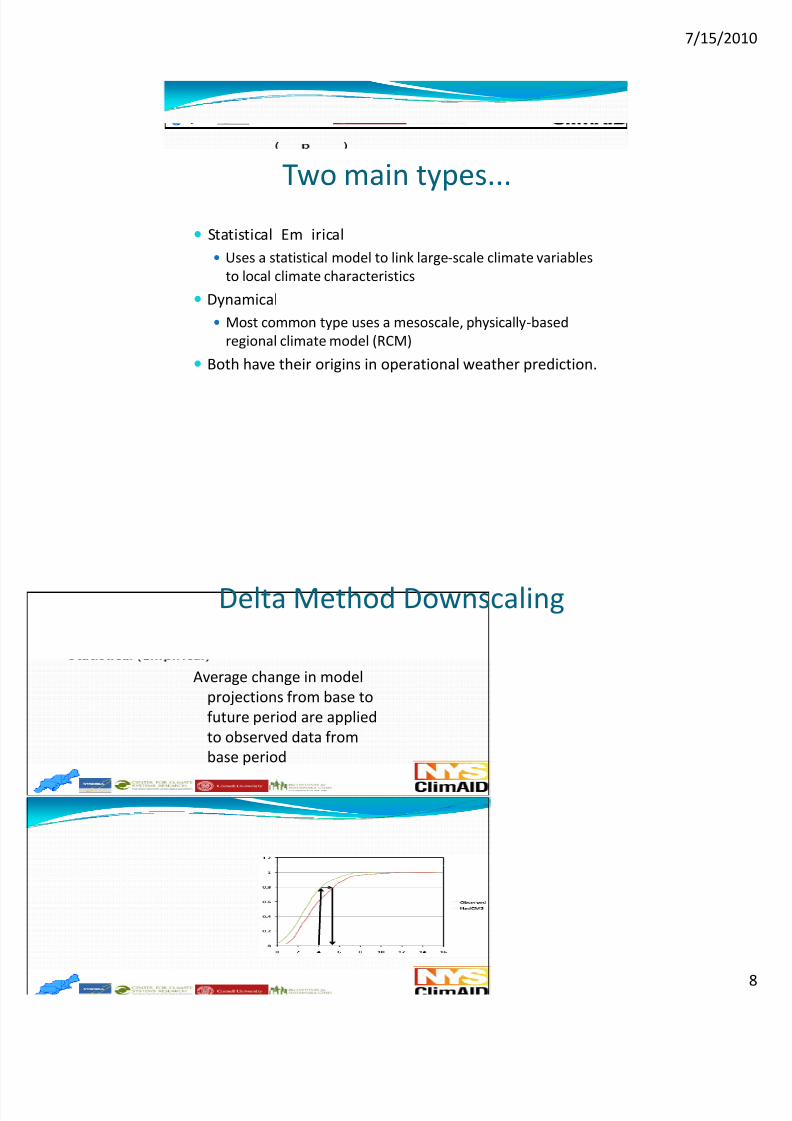
Two main types...
Statistical Em irical Uses a statistical model to link large ‐scale climate variables to local climate characteristics
Dynamical Most common type uses a mesoscale, physically ‐based regional climate model (RCM)
Both have their origins in operational weather prediction.
Delta Method Downscaling
Average change in model projections from base to future period are applied to observed data from base period

8/11/2019 Climate Change Projections for the Hudson Valley
http://slidepdf.com/reader/full/climate-change-projections-for-the-hudson-valley 9/29
7/15/2010
Other Statistical Downscaling Relationships derived between large ‐scale atmospheric variables (predictors) and observed local weather
.
These relationshi s are then a lied to e uivalent
Temperature = f(500 mb Height)Albany Temperature= f(large ‐scale 500 mb height)
variables in the GCM.
Used in CLIMAID for extreme precip, snow
SDSM Output

8/11/2019 Climate Change Projections for the Hudson Valley
http://slidepdf.com/reader/full/climate-change-projections-for-the-hudson-valley 10/29
7/15/2010
Dynamical Downscaling
T ical rid ~20‐50km
Regional climate models work like numerical weather prediction (NWP) models, except that they run for a much longer time
North American Regional Climate Change Assessment Program (NARCCAP)
Nested RCMs need boundary conditions from GCMs or Reanalysis
The World Ends Here
e W o r l d E n d s H e r e T h e
W o r l d E n d s H e r
The World Ends Here
T e
8/11/2019 Climate Change Projections for the Hudson Valley
http://slidepdf.com/reader/full/climate-change-projections-for-the-hudson-valley 11/29
7/15/2010
8/11/2019 Climate Change Projections for the Hudson Valley
http://slidepdf.com/reader/full/climate-change-projections-for-the-hudson-valley 12/29
7/15/2010
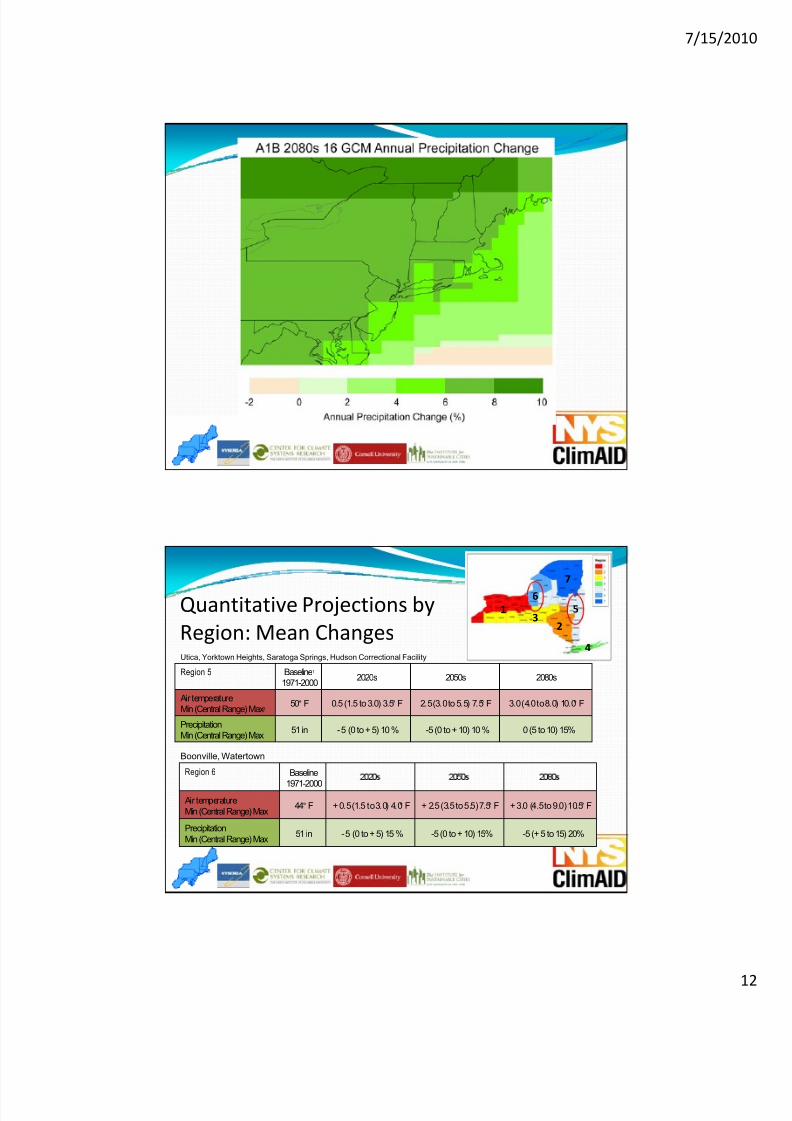
Quantitative Projections by Region: Mean Changes
4
23
1 56
7
Utica, Yorktown Heights, Saratoga Springs, Hudson Correctional Facility
Region 6 Baseline
Region 5 Baseline 1
1971-2000 2020s 2050s 2080s
Air temperatureMin (Central Range) Max 2
50° F 0.5 (1.5 to 3.0) 3.5 ° F 2.5 (3.0 to 5.5) 7.5 ° F 3.0 (4.0 to 8.0) 10.0 ° F
PrecipitationMin (Central Range) Max 51 in -5 (0 to + 5) 10 % -5 (0 to + 10) 10 % 0 (5 to 10) 15%
Boonville, Watertown
1971-2000 Air temperatureMin (Central Range) Max
44° F + 0.5 (1.5 to 3.0) 4.0 ° F + 2.5 (3.5 to 5.5) 7.5 ° F + 3.0 (4.5 to 9.0) 10.5 ° F
PrecipitationMin (Central Range) Max 51 in -5 (0 to + 5) 15 % -5 (0 to + 10) 15% -5 (+ 5 to 15) 20%

8/11/2019 Climate Change Projections for the Hudson Valley
http://slidepdf.com/reader/full/climate-change-projections-for-the-hudson-valley 13/29
7/15/2010

8/11/2019 Climate Change Projections for the Hudson Valley
http://slidepdf.com/reader/full/climate-change-projections-for-the-hudson-valley 14/29
7/15/2010
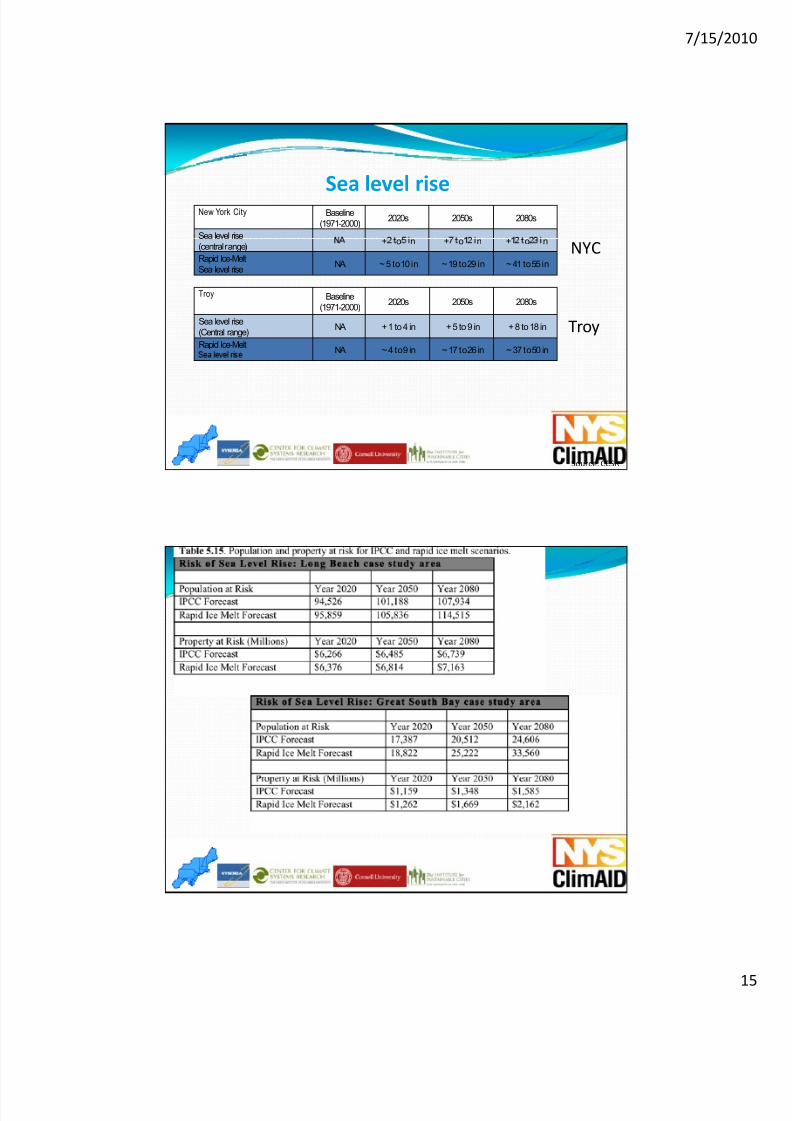
Sea level rise
• • Thermal expansion• Glacier melt• Ice cap/ice sheet melt• Local land sinking/subsidence• Local water surface elevation
Source: CCSR
Sea level rise
• • based on paleoclimate data• 20,000 – 10,000 0.39‐0.47 in/yr
• Local modeling for Hudson to Troy river has low topographic gradient
Source: CCSR
change at Battery = change at Albany
8/11/2019 Climate Change Projections for the Hudson Valley
http://slidepdf.com/reader/full/climate-change-projections-for-the-hudson-valley 15/29
7/15/2010
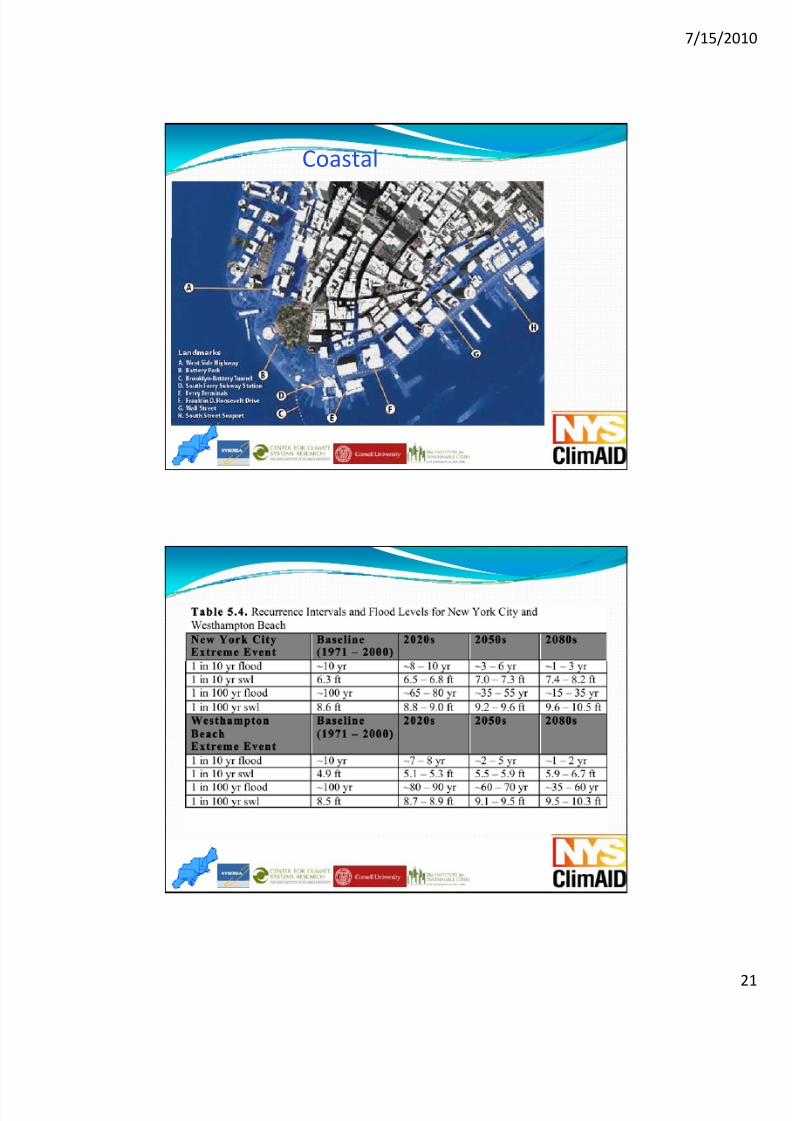
New York City Baseline(1971-2000) 2020s 2050s 2080s
Sea level rise
Sea level rise
NYC
Troy
(central range) + o n + o n + o n
Rapid Ice-MeltSea level rise NA ~ 5 to 10 in ~ 19 to 29 in ~ 41 to 55 in
Troy Baseline(1971-2000) 2020s 2050s 2080s
Sea level rise(Central range) NA + 1 to 4 in + 5 to 9 in + 8 to 18 in
Rapid Ice-Melt NA ~ 4 to 9 in ~ 17 to 26 in ~ 37 to 50 in
Source: CCSR

8/11/2019 Climate Change Projections for the Hudson Valley
http://slidepdf.com/reader/full/climate-change-projections-for-the-hudson-valley 16/29
7/15/2010
Vulnerabilities: Water
Water Supply Across New York
Category Sensitivity to
Climate ChangePopulation Served
1 Draw from Large Waterbodies Low 2,000,000
2 NYC System Moderate 8,300,000
3 Other Reservoir Systems Moderate 1,300,000
4 Run ‐of ‐the ‐river on small drainage High 62,000
5 Long Island GW Moderate 3,200,000
6 Other Primary Aquifers Moderate 650,000 , ,
8 Other Small Water Supply Systems (GW or
SW) Moderate to High 1,600,000
Total = 19,000,000
8/11/2019 Climate Change Projections for the Hudson Valley
http://slidepdf.com/reader/full/climate-change-projections-for-the-hudson-valley 17/29
7/15/2010
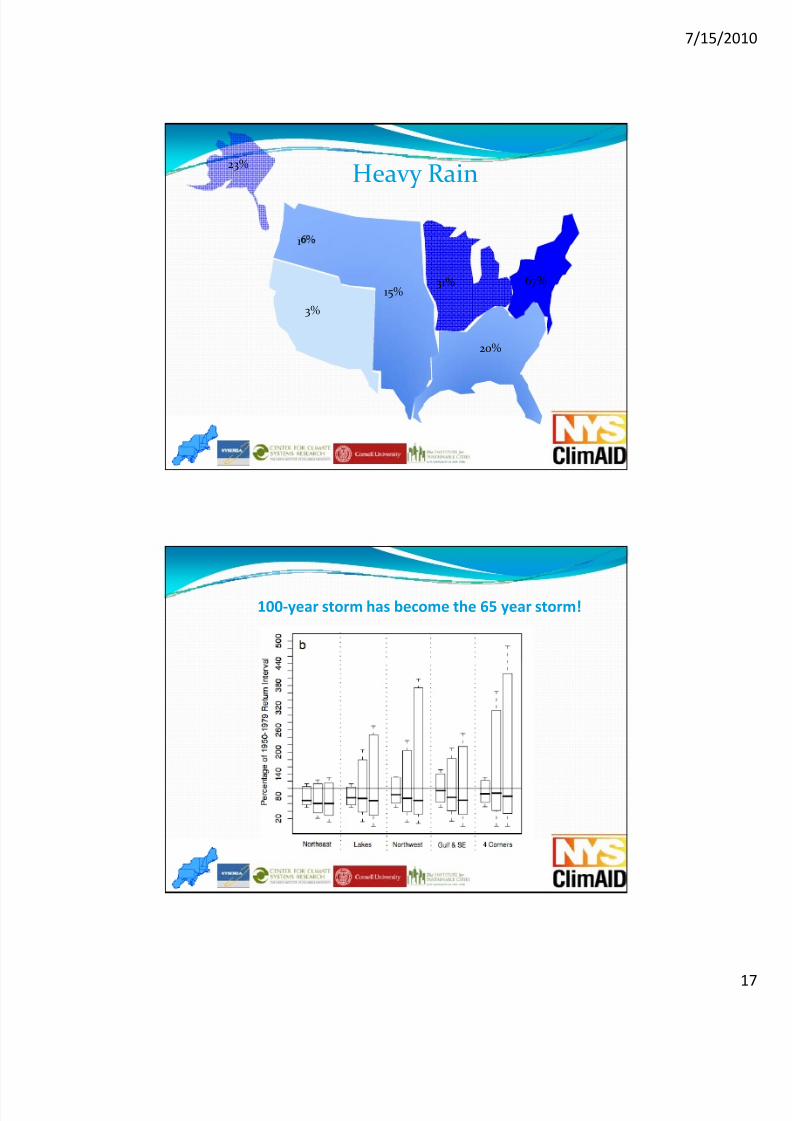
23% Heavy Rain
1
3%
31%15%
67%
20%
100 ‐year storm has become the 65 year storm!
8/11/2019 Climate Change Projections for the Hudson Valley
http://slidepdf.com/reader/full/climate-change-projections-for-the-hudson-valley 18/29
7/15/2010
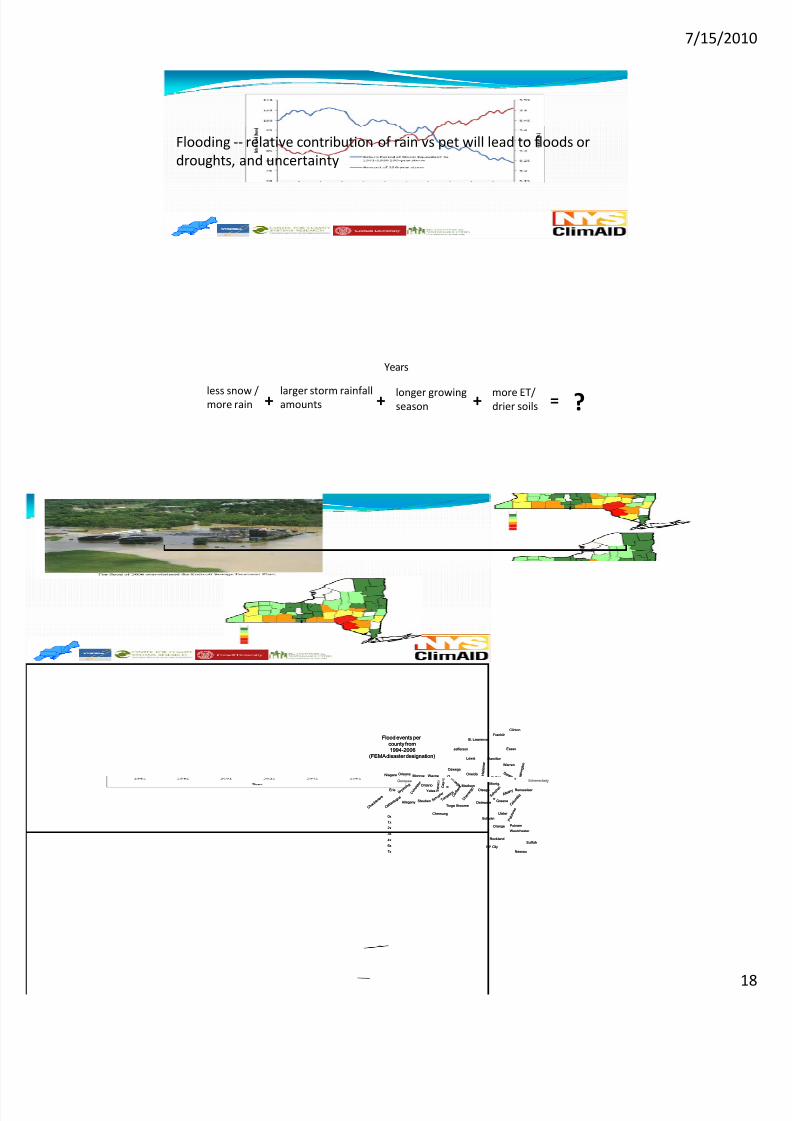
Flooding ‐‐ relative contribution of rain vs pet will lead to floods or droughts, and uncertainty
Years
less snow / more rainlarger storm rainfall amounts
longer growing season+ + more ET/
drier soils+ = ?
Clinton
Essex
Franklin
Fulton
Hamilton
H e r k i m e r
Jefferson
Lewis
MonroeNiagara OneidaO n Orleans
Oswego
Wayne a s h i n g t o n
St. Lawrence
Warren
S a r a t o g
Flood events percounty from1994-2006
(FEMA disaster designation)
Clinton
Essex
Franklin
Fulton
Hamilton
H e r k i m e r
Jefferson
Lewis
MonroeNiagara OneidaO n Orleans
Oswego
Wayne a s h i n g t o n
St. Lawrence
Warren
S a r a t o g
Flood events percounty from1994-2006
(FEMA disaster designation)
A l b a n y
AlleganyBroome C a t
t a r a u g u
s
C a y u g
a
C h a u
t a u q u a
Chemung
C h e n
a n g o
C o l u m
b i a C o r t l a n d
Delaware
D u t c h e s s
Erie
Genesee
Greene
L i v i n g s t o n
Madison Montg.
NassauNY City
o n d a g a Ontario
Orange
SteubenTioga
T o m p k i n
s
S c h u y
l e r
Ulster
Westchester
Putnam
Sullivan
RocklandSuffolk
Otsego Rensselaer
Schenectady
S c h o
h a r i
e
W y o m i n g Yates S
e n e c a
a
0x
1x
2x
3x
4x
6x
7x

8/11/2019 Climate Change Projections for the Hudson Valley
http://slidepdf.com/reader/full/climate-change-projections-for-the-hudson-valley 19/29
7/15/2010
Water Quality

8/11/2019 Climate Change Projections for the Hudson Valley
http://slidepdf.com/reader/full/climate-change-projections-for-the-hudson-valley 20/29
7/15/2010
• CSO IncreasesGreater relative increase on systems that meet EPA Fourdischarge per year regulation
Other Issues
• Run off from urban/agriculture surfacesMight be limited by available pollutant load
• Increased water temperaturePathogens (some better some worse)Increases algal growth
SPDES permit implications especially in combo with lowsummer flows
• Potentially power plant cooling issues
• Ex ansion of irri ated a riculture ma lace
Other Issues
further demands on water supply
• Potentially local demand increases due to gas well drilling
• Population migration from drier regions
8/11/2019 Climate Change Projections for the Hudson Valley
http://slidepdf.com/reader/full/climate-change-projections-for-the-hudson-valley 21/29
7/15/2010
Coastal

8/11/2019 Climate Change Projections for the Hudson Valley
http://slidepdf.com/reader/full/climate-change-projections-for-the-hudson-valley 22/29
7/15/2010
Rapid ice
8/11/2019 Climate Change Projections for the Hudson Valley
http://slidepdf.com/reader/full/climate-change-projections-for-the-hudson-valley 23/29
7/15/2010
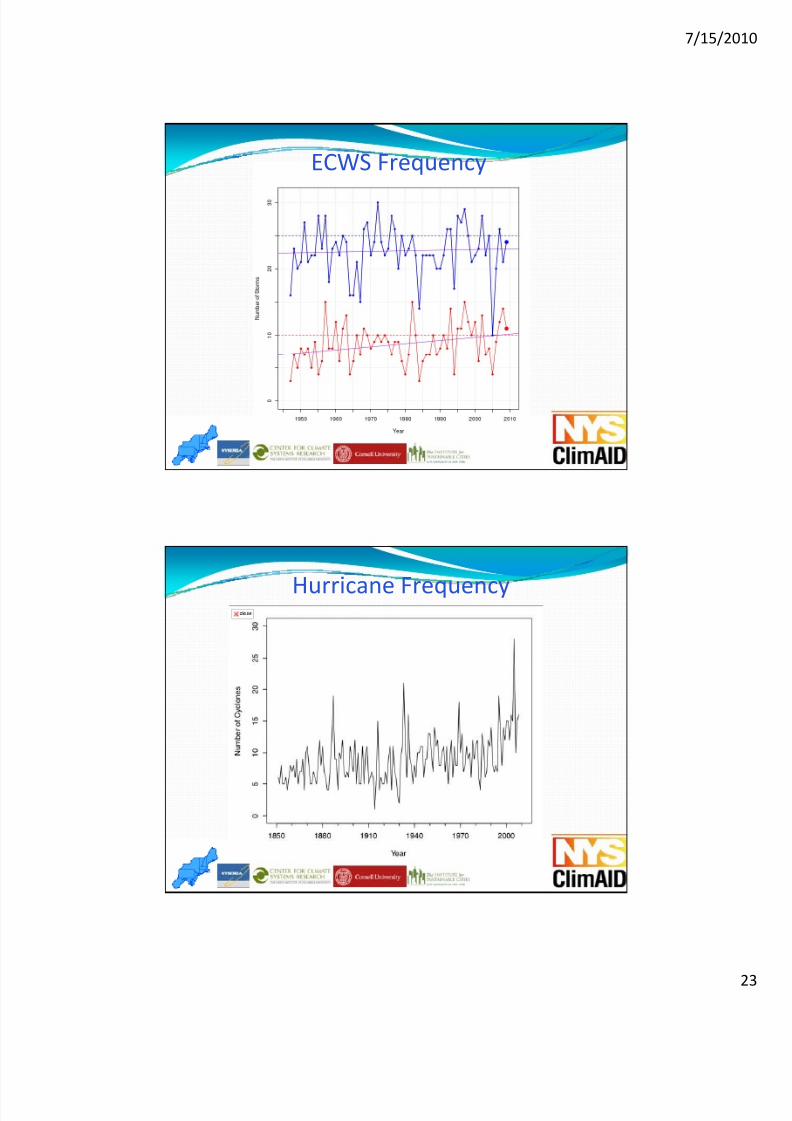
ECWS Frequency
Hurricane Frequency
8/11/2019 Climate Change Projections for the Hudson Valley
http://slidepdf.com/reader/full/climate-change-projections-for-the-hudson-valley 24/29
7/15/2010
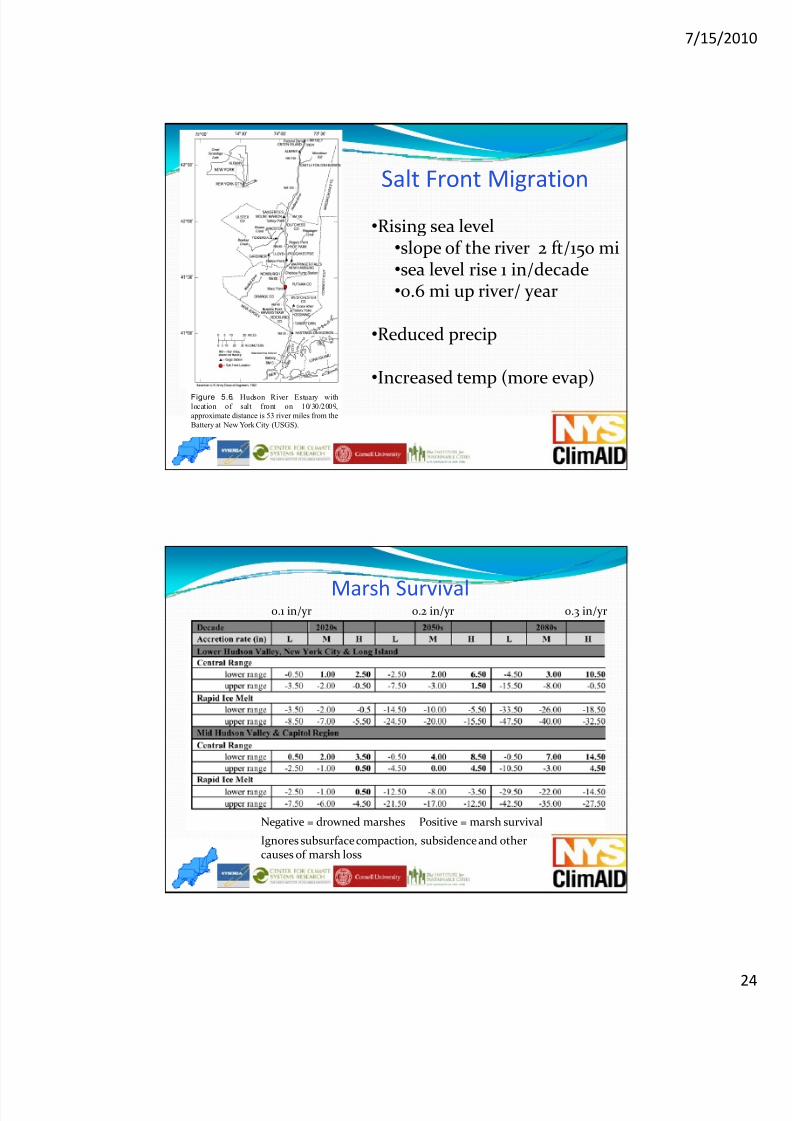
•Rising sea level
Salt Front Migration
•slope of the river 2 ft/150 mi•sea level rise 1 in/decade •0.6 mi up river/ year
•Reduced precip
Figure 5.6. Hudson River Estuary withlocation of salt front on 10/30/2009,approximate distance is 53 river miles from theBattery at New York City (USGS).
•Increased temp (more evap)
Marsh Survival0.1 in/yr 0.2 in/yr 0.3 in/yr
Negative = drowned marshes Positive = marsh survivalIgnores subsurface compaction, subsidence and other causes of marsh loss

8/11/2019 Climate Change Projections for the Hudson Valley
http://slidepdf.com/reader/full/climate-change-projections-for-the-hudson-valley 25/29
7/15/2010
A Significant land loss and break up of
reviousl conti uous
Udalls Cove Park Preserve Queens, NY
marsh
B Eroding embankments
C Widening of channels
• Increase water temp 0.220F per decade between 1920 and 1990 on Hudson
Other Coastal Impacts
Blue claw crabs flourish lobster declines
• Increases in ocean acidity Detrimental effects on the growth, development, and survival of hard clams, bay scallops, and Eastern oysters
• Coastal erosion

8/11/2019 Climate Change Projections for the Hudson Valley
http://slidepdf.com/reader/full/climate-change-projections-for-the-hudson-valley 26/29
7/15/2010
• Flooding of water ‐side facilities (sea level rise, storm surge, extreme rainfall events)
Energy Supply
• Water ‐cooling related impacts (drought, turbidity from storm events, water temperature)
• Air temperature (equipment breakdown during extreme heat events, decreased power plant output or transmission/distribution line throughput capacity, snow vs. rain = timing of hydro availability)
• Drought (hydro availability)
• Resource availability (hydro, solar, wind availability)
• Changes in seasonal and diurnal load patterns
Energy Demand
summer peaking = increases demand length of extreme heat
waves + changing air conditioning saturation rates
8/11/2019 Climate Change Projections for the Hudson Valley
http://slidepdf.com/reader/full/climate-change-projections-for-the-hudson-valley 27/29
7/15/2010
Public Health• Increased heat related mortality and morbidity
• Changes in vector‐borne disease prevalence
• Air quality declinesmogpollen wildfire?
• Consequences from flooding events
• Potential risks to water supply and food production
EcosystemsShifts in plant species composition in forest and other natural landscapes
Lose: Spruce fir boreal plant communities Win: Oak Hickory Pine
Changes in mammal communitiesLose: Snowshoe hare, fisher Win: White ‐tailed deer, northern cardinal Canadian goose
Expansion of invasive species Weeds: KutzuInsects: Hemlock wooly adelgid
Negative impacts on brook trout and other native cold water fishBass might benefit
Loss of winter recreation opportunities
8/11/2019 Climate Change Projections for the Hudson Valley
http://slidepdf.com/reader/full/climate-change-projections-for-the-hudson-valley 28/29
7/15/2010
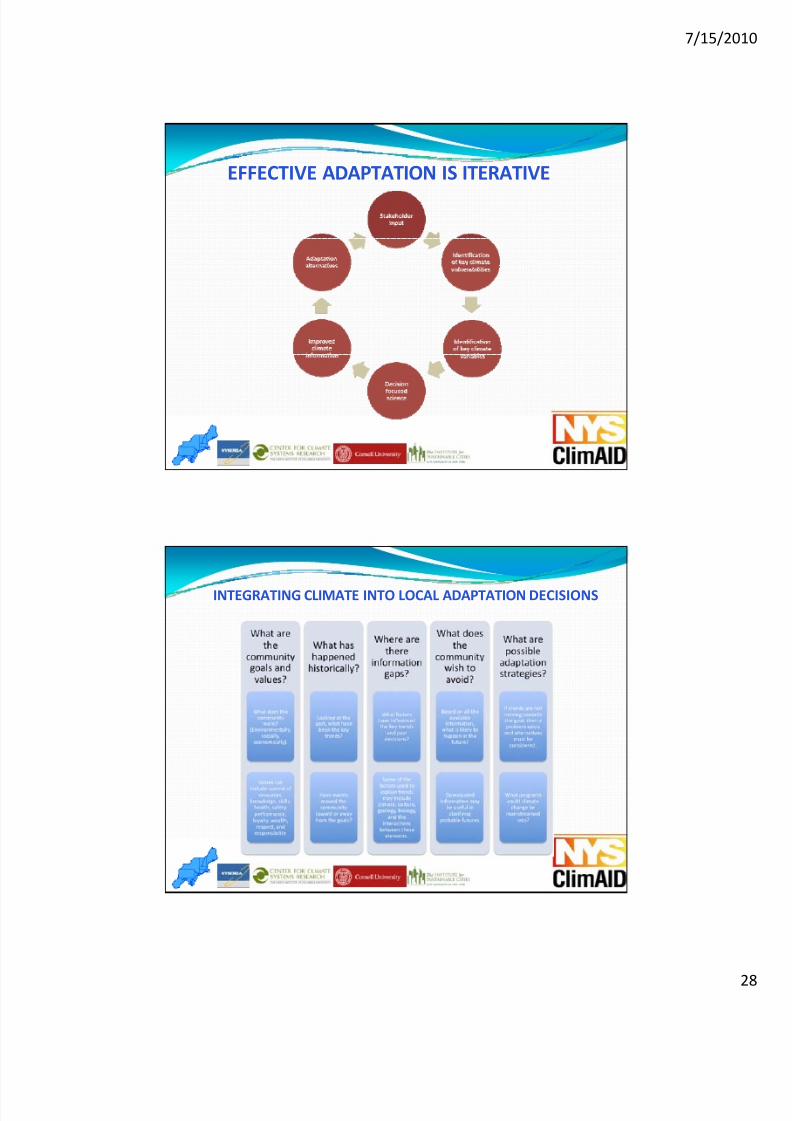
EFFECTIVE ADAPTATION IS ITERATIVE
INTEGRATING CLIMATE INTO LOCAL ADAPTATION DECISIONS

8/11/2019 Climate Change Projections for the Hudson Valley
http://slidepdf.com/reader/full/climate-change-projections-for-the-hudson-valley 29/29
7/15/2010
Questions?