clinical study report leo 90100 compared to vehicle in...
TRANSCRIPT
This document has been downloaded from \V'.v-w.leo-pharma.com subject to the terms of use state on the website. It contains data and results regarding approved and non-approved uses, formulations or treatment regimens, and it is provided for transparency and informational purposes only. The content does not :reflect the complete results from all studies related to a product. As a document of scientific nature it is not to be seen as a recommendation or advic.e regarding the use of any products and you must always consult the specific prescribing information approved for the product prior to any prescription or use.
Clinical Study Report
LEO 90100 Compared to Vehicle in Subjects with Psoriasis Vulgaris
A phase 3 trial comparing once daily treatment with LEO 90100 calcipotriol 50 mcg/g plus betamethasone 0.5 mg/g (as dipropionate) with vehicle in subjects with psoriasis
vulgaris
A multi-centre, prospective, randomised, double-blinded, 2-arm, parallel group, 4-week trial in subjects with psoriasis vulgaris
LEO 90100 in PSOriasis vulgaris, a Fom weeks, vehicle controlled, efficacy And Safety Trial- the PSO-FAST trial
The clinical study report has been redacted using the following principles: \Vhere necessary, information is anonymise d to protect the privacy of study subjects and named persons a sse cia ted t-vith the trial a;, well as to retain commercial confidential information. Summary data are included but data on individual study subjects, including data listings, are removed. This rna y result in page numbers not being consecutively numbered. Access to anonymise d data on individualstudy subject rna y be o bt aine d up on approval of a research proposal by the Patient and Scientific Review Board. Appendices to the clinical study report are omitted. Further details and principles for anonymisationis availableinthe document LEOPH.tUUvl.A PRINCIPLES FOR JI.J.'jONThllSATION OF CLINICAL TRIAL DATA
LEO Pharma A/S
Clinical Development and Safety
00425289
LP0053-1001
04-Mar-2014
EudraCT Number: N/A
LP0053-1001 04-Mar-2014 Page 2 of 315
Clinical Study Report Statement
Approval Statement, Sponsor
The following persons have approved this Clinical Study Report on behalf of
LEO Pharma A/S using electronic signatures:
Biostatistics and Data Management
Medical Department
Approval Statement, Investigator
The International co-ordinating investigator approves the Clinical Study Report by manually
signing the International Co-ordinating Investigator Clinical Study Report Approval Form,
which is a separate document adjoined to this report.
The following person has approved this Clinical Study Report:
, MD
International co-ordinating investigator

LP0053-1001 04-Mar-2014 Page 3 of 315
Compliance with Good Clinical Practice
This Clinical Study Report is designed to comply with the standards issued by the
International Conference on Harmonisation (ICH) (E3 Structure and Content of Clinical
Study Reports and clarified in the ICH E3 Q&A document 07-Jun-2012; E6 Good Clinical
Practice; E9 Statistical Principles for Clinical Trials and M4 Common Technical Document)
(1,2,3,4,5).
Public Registration of the Clinical Trial
The trial was registered on www.Clinicaltrials.gov on 28-May-2013 under the identifier
NCT01866163.
Synopsis
The synopsis of this clinical study report exists as a separately approved document.
LP0053-1001 04-Mar-2014 Page 4 of 315
Table of Contents
Clinical Study Report Statement ................................................................................................ 2
Compliance with Good Clinical Practice ................................................................................... 3
Synopsis ..................................................................................................................................... 3
Table of Contents ....................................................................................................................... 4
List of Tables (In-Text)............................................................................................................... 9
List of Figures (In-Text) ........................................................................................................... 11
List of Appendices.................................................................................................................... 12
List of Abbreviations and Definition of Terms ........................................................................ 14
1 Ethics ................................................................................................................................... 17
1.1 Independent Ethics Committee (IEC) or Institutional Review Board (IRB) .................. 17
1.2 Ethical Conduct of the Trial ............................................................................................ 17
1.3 Subject Information and Informed Consent .................................................................... 17
2 Investigators and Trial Administrative Structure................................................................. 19
3 Introduction ......................................................................................................................... 23
3.1 Psoriasis Vulgaris ............................................................................................................ 23
3.2 Investigational Product.................................................................................................... 23
3.3 Trial Rationale ................................................................................................................. 24
4 Trial Objectives ................................................................................................................... 25
4.1 Primary Objective............................................................................................................ 25
4.2 Secondary Objectives ...................................................................................................... 25
5 Investigational Plan ............................................................................................................. 26
5.1 Overall Trial Design ........................................................................................................ 26
5.1.1 Overview of the Trial .................................................................................................. 26
5.1.2 Trial Periods ................................................................................................................ 27
5.1.2.1 Washout/Screening Phase ........................................................................................ 27
5.1.2.2 Treatment Phase....................................................................................................... 27
5.1.2.3 Follow-up Phase ...................................................................................................... 28
5.2 Discussion of Trial Design, Including the Choice of Control Groups ............................ 29
5.3 Selection of Trial Population........................................................................................... 31
5.3.1 Inclusion Criteria ......................................................................................................... 31
5.3.2 Exclusion Criteria........................................................................................................ 32
LP0053-1001 04-Mar-2014 Page 5 of 315
5.3.3 Removal of Subjects from Therapy or Assessment..................................................... 34
5.4 Treatments ....................................................................................................................... 35
5.4.1 Treatments Administered............................................................................................. 35
5.4.2 Investigational Products .............................................................................................. 36
5.4.3 Method of Assigning Subjects to Treatment Groups................................................... 37
5.4.4 Selection and Timing of Dose for each Subject .......................................................... 38
5.4.5 Blinding ....................................................................................................................... 38
5.4.6 Prior and Concomitant Therapy .................................................................................. 39
5.4.7 Treatment Compliance and Extent of Exposure.......................................................... 41
5.5 Assessments..................................................................................................................... 41
5.5.1 Frequency and Timing of Measurements .................................................................... 41
5.5.2 Baseline Characteristics and Demographics Assessed ................................................ 44
5.5.3 Efficacy Measurements Assessed................................................................................ 45
5.5.3.1 Investigator Assessments ......................................................................................... 45
5.5.3.2 Subject Assessments ................................................................................................ 49
5.5.3.3 Imaging Assessments............................................................................................... 50
5.5.4 Safety Measurements Assessed ................................................................................... 51
5.5.4.1 Local Safety and Tolerability................................................................................... 51
5.5.4.2 Laboratory Analysis................................................................................................. 52
5.5.4.3 Adverse Events ........................................................................................................ 53
5.5.4.4 Reporting of Adverse Events ................................................................................... 54
5.5.4.5 Other Events to be Reported.................................................................................... 57
5.5.4.6 Serious Adverse Events ........................................................................................... 57
5.5.4.7 Vital Signs................................................................................................................ 58
5.5.5 Appropriateness of Measurements .............................................................................. 58
5.6 Endpoints/Response Criteria ........................................................................................... 59
5.6.1 Efficacy Evaluation ..................................................................................................... 59
5.6.1.1 Primary Endpoint..................................................................................................... 59
5.6.1.2 Secondary Endpoints ............................................................................................... 59
5.6.1.3 Additional (Tertiary) Endpoints............................................................................... 59
5.6.2 Safety Evaluation ........................................................................................................ 60
5.6.3 Evaluation of Other Observations ............................................................................... 60
5.7 Data Quality and Assurance ............................................................................................ 61
5.8 Changes to the Conduct of the Trial ................................................................................ 62
6 Statistical Methods .............................................................................................................. 63
6.1 Determination of Sample Size......................................................................................... 63
6.2 Statistical and Analytical Plan......................................................................................... 63

LP0053-1001 04-Mar-2014 Page 6 of 315
6.2.1 Summary ..................................................................................................................... 63
6.2.2 General Principles ....................................................................................................... 63
6.2.3 Subject Qualification for Analysis .............................................................................. 64
6.2.4 Reasons for Leaving the Trial ..................................................................................... 64
6.2.5 Demographics and Baseline Characteristics ............................................................... 64
6.2.6 Treatment Compliance and Extent of Exposure.......................................................... 65
6.2.7 Analysis of Efficacy .................................................................................................... 66
6.2.7.1 Primary Endpoint..................................................................................................... 66
6.2.7.2 Secondary Endpoints ............................................................................................... 67
6.2.7.3 Further (Tertiary) Endpoints .................................................................................... 68
6.2.7.3.1 Investigator’s Assessments................................................................................... 68
6.2.7.3.2 Subject’s Assessments .......................................................................................... 69
6.2.7.4 Handling of Drop-outs and Missing Values............................................................. 70
6.2.8 Analysis of Safety ....................................................................................................... 72
6.2.8.1 Adverse Events ........................................................................................................ 72
6.2.8.2 Laboratory Safety Examinations ............................................................................. 73
6.2.8.3 Vital Signs................................................................................................................ 74
6.2.8.4 Evaluation of Local Safety and Tolerability ............................................................ 74
6.3 Changes to the Statistical Analysis Plan.......................................................................... 74
6.4 Software and Dictionaries ............................................................................................... 74
7 Trial Population ................................................................................................................... 75
7.1 Disposition of Subjects.................................................................................................... 75
7.2 Protocol Deviations ......................................................................................................... 78
7.3 Trial Analysis Sets ........................................................................................................... 79
7.3.1 Full Analysis Set.......................................................................................................... 79
7.3.2 Safety Analysis Set ...................................................................................................... 79
7.3.3 Per Protocol Analysis Set ............................................................................................ 80
7.4 Demographic and other Baseline Characteristics............................................................ 81
7.4.1 Demographic Data....................................................................................................... 81
7.4.2 Disease-Related Baseline Characteristics.................................................................... 84
7.4.3 Medical History and Use of Concomitant Medication................................................ 87
8 Exposure and Treatment Compliance.................................................................................. 88
8.1 Exposure.......................................................................................................................... 88
8.2 Treatment Compliance .................................................................................................... 90
9 Efficacy Evaluation ............................................................................................................. 92
9.1 Primary Efficacy Endpoint .............................................................................................. 92
LP0053-1001 04-Mar-2014 Page 7 of 315
9.2 Secondary Efficacy Endpoints ........................................................................................ 93
9.2.1 m-PASI at Week 4 and Week 1.................................................................................... 93
9.3 Further (Tertiary) Endpoints............................................................................................ 94
9.3.1 Investigator’s Assessments.......................................................................................... 94
9.3.1.1 Treatment Success over Time .................................................................................. 94
9.3.1.2 Investigator’s Global Assessment of Disease Severity............................................ 96
9.3.1.3 m-PASI over Time ................................................................................................... 98
9.3.1.4 PASI-50 and PASI-75 ............................................................................................ 101
9.3.1.5 Investigator’s Assessment of Severity of the Target Lesion .................................. 104
9.3.1.6 Change in BSA Involvement over Time................................................................ 104
9.3.2 Subject’s Assessments ............................................................................................... 105
9.3.2.1 Patient’s Global Assessment of Disease Severity.................................................. 105
9.3.2.2 Subject’s Assessment of Itch as Assessed by Use of a Visual Analogue Scale ..... 108
9.3.2.3 Subject’s Assessment of Itch-Related Sleep Loss by Use of a Visual Analogue Scale............................................................................................................................... 112
9.3.2.4 Change in DLQI over Time ................................................................................... 116
9.3.2.5 Change in EQ-5D-5L over Time ........................................................................... 118
9.4 Efficacy Conclusions..................................................................................................... 119
10 Safety Evaluation............................................................................................................... 122
10.1 Adverse Events.............................................................................................................. 122
10.1.1 Brief Summary of Adverse Events ............................................................................ 122
10.1.2 Incidence of Adverse Events ..................................................................................... 123
10.1.3 Adverse Events by Intensity...................................................................................... 128
10.1.4 Adverse Drug Reactions............................................................................................ 128
10.1.5 Adverse Events Leading to Withdrawal .................................................................... 129
10.2 Deaths, other Serious Adverse Events, and other Significant Adverse Events ............. 130
10.2.1 Narratives of Serious Adverse Events ....................................................................... 130
10.2.2 Lesional/Perilesional Adverse Events ....................................................................... 131
10.3 Other Safety Assessments ............................................................................................. 132
10.3.1 Local Safety and Tolerability .................................................................................... 132
10.4 Vital Signs ..................................................................................................................... 139
10.5 Clinical Laboratory Evaluation ..................................................................................... 139
10.5.1 Laboratory Values Over Time ................................................................................... 139
10.5.2 Individual Changes in Laboratory Values ................................................................. 140
10.5.3 Pregnancies................................................................................................................ 144
10.6 Safety Conclusions ........................................................................................................ 144
11 Discussion and Overall Conclusions ................................................................................. 145
LP0053-1001 04-Mar-2014 Page 8 of 315
11.1 Discussion ..................................................................................................................... 145
11.2 Overall Conclusions ...................................................................................................... 147
12 References ......................................................................................................................... 148
End-of-Text Tables and Figures, Baseline Characteristics and Investigational Product
Data
End-of-Text Tables and Figures, Efficacy [and/or Other as Appropriate] Data
End-of-Text Tables and Figures, Safety Data
End-of-Text Listings
LP0053-1001 04-Mar-2014 Page 9 of 315
List of Tables (In-Text)
Table 2–1 Investigators and Trial Administrative Structure ............................................. 20
Table 5–1 Identity of LEO 90100 ..................................................................................... 36
Table 5–2 Identity of Vehicle ............................................................................................ 37
Table 5–3 Schedule of Trial Procedures............................................................................ 42
Table 5–4 Fitzpatrick Skin Type ....................................................................................... 45
Table 5–5 Investigator’s Global Assessment of Disease Severity – 5-point Scale ........... 47
Table 5–6 Severity Score for Redness, Thickness, and Scaliness..................................... 48
Table 5–7 Patient’s Global Assessment of Disease Severity – 5-point Scale ................... 49
Table 5–8 Investigator Assessment of Skin Reaction Score ............................................. 52
Table 5–9 Subject Assessment of Skin Reaction Score .................................................... 52
Table 5–10 Serum Biochemistry and Urinalysis................................................................. 53
Table 7–1 Sex, Race, Ethnicity and Skin Type: Randomised Subjects............................. 83
Table 7–2 Duration of Psoriasis Vulgaris, BSA and Baseline m-PASI: Randomised Subjects ............................................................................................................ 85
Table 7–3 Baseline IGA: Randomised Subjects ............................................................... 85
Table 7–4 Other Locations of Psoriasis: Randomised Subjects........................................ 86
Table 7–5 Previous Psoriasis Treatments: Randomised Subjects ..................................... 87
Table 7–6 Target Lesion Location: Randomised Subjects ................................................ 87
Table 8–1 Duration and Extent of Exposure to Treatment: Safety Analysis Set .............. 88
Table 8–2 Average Weekly Amount of Trial Medication Used: Safety Analysis set........ 89
Table 8–3 Total Amount of Trial Medication Used: Safety Analysis Set ......................... 90
Table 8–4 Compliance with Treatment Instructions Over the Total Trial Period: Randomised Subjects ....................................................................................... 91
Table 9–1 Statistical Analysis of Treatment Success According to the IGA at Week 4 (Multiple Imputation): Full Analysis Set ......................................................... 92
Table 9–2 Statistical Analysis of Treatment Success According to the IGA at Week 4: Per Protocol Analysis Set ....................................................................................... 93
LP0053-1001 04-Mar-2014 Page 10 of 315
Table 9–3 Statistical Analyses of m-PASI at Week 4 and Week 1 (Multiple Imputation): Full Analysis Set............................................................................................... 94
Table 9–4 Treatment Success According to the IGA by Visit (Observed Cases): Full Analysis Set...................................................................................................... 95
Table 9–5 IGA by Visit (Observed Cases): Full Analysis Set........................................... 97
Table 9–6 Treatment Success According to the IGA at Week 4 by Baseline Disease Severity (Observed Cases): Full Analysis Set.................................................. 98
Table 9–7 m-PASI by Visit (Observed Cases): Full Analysis Set..................................... 99
Table 9–8 Percentage Change in m-PASI by Visit (Observed Cases): Full Analysis Set101
Table 9–9 PASI-50 by Visit (Observed Cases): Full Analysis Set .................................. 102
Table 9–10 Statistical Analysis of PASI-50 at Week 4 (Multiple Imputation): Full Analysis Set................................................................................................................... 102
Table 9–11 PASI-75 by Visit (Observed Cases): Full Analysis Set .................................. 103
Table 9–12 Statistical Analysis of PASI-75 at Week 4 (Multiple Imputation): Full Analysis Set................................................................................................................... 104
Table 9–13 Patient's Global Assessment by Visit (Observed Cases): Full Analysis Set... 106
Table 9–14 Treatment Success According to Patient's Global Assessment by Visit (Observed cases): Full Analysis Set ............................................................... 107
Table 9–15 Statistical Analysis of Treatment Success According to Patient's Global Assessment at Week 4 (Observed Cases): Full Analysis Set ......................... 107
Table 9–16 Analysis of Change in Subject's Assessment of Itch (VAS) by Time Point (Observed Cases): Full Analysis Set .............................................................. 109
Table 9–17 Analysis of Change in Subject's Assessment of Itch (VAS) by Time Point (Observed Cases): Full Analysis Set (Continued).......................................... 110
Table 9–18 Analysis of Subjects Achieving a 70 Percent Reduction in Itch by Time Point (Observed Cases): Full Analysis Set .............................................................. 111
Table 9–19 Analysis of Change in Subject's Assessment of Itch-Related Sleep Loss (VAS) by Time Point (Observed Cases): Full Analysis Set ...................................... 113
Table 9–20 Analysis of Subjects Achieving a 70 Percent Reduction in Itch-Related Sleep Loss by Time Point (Observed Cases): Full Analysis Set.............................. 115
Table 9–21 Analysis of Change in DLQI by Visit (Observed Cases): Full Analysis Set . 117
LP0053-1001 04-Mar-2014 Page 11 of 315
Table 10–1 Overall Summary of Adverse Events: Safety Analysis Set............................ 122
Table 10–2 Adverse Events by MedDRA primary SOC: Safety Analysis Set ................. 124
Table 10–3 Adverse Events by SOC and Preferred Term: Safety Analysis Set................ 125
Table 10–4 Adverse Drug Reactions by SOC and Preferred Term: Safety Analysis Set.. 129
Table 10–5 Lesional/Perilesional Adverse Events by SOC and Preferred Term: Safety Analysis Set.................................................................................................... 132
Table 10–6 Local Safety and Tolerability by Visit: Safety Analysis Set........................... 134
Table 10–7 Summary of Albumin-Corrected Serum Calcium and Change from Baseline: Safety Analysis Set......................................................................................... 139
Table 10–8 Summary of Urinary Calcium:Creatinine Ratio and Change from Baseline: Safety Analysis Set......................................................................................... 140
Table 10–9 Shift Table for Albumin-Corrected Serum Calcium: Safety Analysis Set ..... 142
Table 10–10 Shift Table for Albumin-Corrected Serum Calcium Based on LEO Defined Clinically Significant Values: Safety Analysis Set......................................... 142
Table 10–11 Shift Table for Urinary Calcium:Creatinine Ratio: Safety Analysis Set ........ 143
List of Figures (In-Text)
Figure 5–1 Trial design for LP0053-1001 .......................................................................... 26
Figure 7–1 Visit Attendance: All Enrolled Subjects ........................................................... 76
Figure 7–2 Visit Attendance by Treatment – LEO 90100 .................................................. 77
Figure 7–3 Visit Attendance by Treatment – Vehicle ......................................................... 78
Figure 7–4 Trial Analysis Sets by Treatment – LEO 90100............................................... 81
Figure 7–5 Trial Analysis Sets by Treatment – Vehicle...................................................... 81
Figure 9–1 Treatment Success (IGA) by Visit (Observed Cases): Full Analysis Set ......... 96
Figure 9–2 Mean m-PASI by Visit (Observed Cases): Full Analysis Set......................... 100
Figure 10–1 Local Safety and Tolerability – Safety Analysis Set ...................................... 138

LP0053-1001 04-Mar-2014 Page 12 of 315
List of Appendices
Trial Information
Appendix No.
Appendix Title Status
1.1 Clinical Study Protocol and Amendments Enclosed
1.2 Sample CRF Enclosed
1.3 List of IEC or IRBs and Representative Written Information for the Subjects and Sample Consent Form
Enclosed
1.4 List of Investigators and CV for International Coordinating Investigator
Enclosed
1.5 Signatures of International Coordinating Investigator Enclosed
1.6 Listing of Subjects receiving Investigational Product from Specific Batches
Available upon request
1.7 Randomisation Scheme and Codes Enclosed
1.8 Audit Certificates Enclosed
1.9 Documentation of Statistical Methods Enclosed
1.10 Documentation of Laboratory Standardisation Methods and Quality Assurance Procedures
NA
1.11 Publications based on the Trial NA
1.12 Important Publications Referenced in the Clinical Study Report
Available upon request
LP0053-1001 04-Mar-2014 Page 13 of 315
Listings
Appendix No Appendix Title Status
2.1 Discontinued Subjects Enclosed
2.2 Protocol Deviations Enclosed
2.3 Trial Analysis Sets Enclosed
2.4 Demographic Data Enclosed
2.5 Compliance and/or Investigational Product Concentration Data
Enclosed
2.6 Efficacy Data Enclosed
2.7 Safety Data Enclosed
2.8 Listing of Laboratory Values by Subject Enclosed
Case Report Forms
Appendix No Appendix Title Status
3.1 CRFs for Deaths, other SAEs, and Withdrawals due to AEs
Available upon request
3.2 Other CRFs Submitted NA
4.1 Individual Subject Data Listings
4.1.1 Photo Report Site US04 Enclosed
4.1.2 Photo Report Site US08 Enclosed
4.1.3 Photo Report Site US10 Enclosed
4.1.4 Photo Report Site US12 Enclosed
4.1.5 Photo Report Site US13 Enclosed
4.1.6 Photo Report Site US16 Enclosed
4.1.7 Photo Report Site US17 Enclosed
4.1.8 Photo Report Site US21 Enclosed
4.1.9 Photo Report Site US24 Enclosed
4.1.10 Photo Report Site US25 Enclosed
4.1.11 Photo Report Site US26 Enclosed
4.1.12 Photo Report Site US27 Enclosed
LP0053-1001 04-Mar-2014 Page 14 of 315
List of Abbreviations and Definition of Terms
ADL Activities of daily life
ADR Adverse drug reaction
AE Adverse event
ANOVA Analysis of variance
BMI Body mass index
BSA Body surface area
CMO Contract Manufacturing Organisation
CRF Case report form
CRO Contract Research Organisation
eCRF Electronic case report form
DLQI Dermatology Life Quality Index
EQ-5D-5L A standardised measure of health status developed by EuroQol Group
FDA Food and Drug Administration
GCP Good Clinical Practice
ICH International Conference on Harmonisation
ICTM International clinical trial manager
IEC Independent ethics committee
IGA Investigator’s Global Assessment of disease severity
IP Investigational product
IRB Institutional review board
IWRS Interactive Web Response System
LOCF Last observation carried forward
MAR Missing at random
MCMC Markov Chain Monte Carlo
MedDRA Medical Dictionary for Regulatory Activities
m-PASI Modified Psoriasis Area and Severity Index
NLCRA National lead clinical research associate
PaGA Patient’s Global Assessment of Disease Severity
PASI-50 A 50% reduction in the Psoriasis Area and Severity Index
PASI-75 A 75% reduction in the Psoriasis Area and Severity Index
PASI Psoriasis Area and Severity Index
PUVA Psoralen combined with Ultraviolet A
SAE Serious adverse event
SD Standard deviation
LP0053-1001 04-Mar-2014 Page 15 of 315
SAPU Statistical analysis plan update
SOC System organ class
SOP Standard Operating Procedure
UVB Ultraviolet B
VAS Visual Analogue Scale
WHO World Health Organisation
DEFINITION OF TERMS
Terms defined by ICH Guidelines are not mentioned here.
Assessment
A (cluster of) characteristic(s) measured and/or recorded for a subject.
Concomitant Medication
Any medication used by a subject during the clinical trial apart from the trial medication.
DAIVOBET®/DOVOBET®/TACLONEX® Ointment
Referred to as Daivobet® ointment.
Enrolled Subject
A subject for whom informed consent has been obtained and who has been registered in a
clinical trial.
International Clinical Trial Manager (ICTM)
The qualified person appointed by LEO to be the main international sponsor representative
responsible for all aspects of a clinical trial as outlined in Global Clinical Operations Standard
Operational Procedures (SOPs).
LEO
LEO (no suffix): refers to the corporate organisation of LEO Pharma A/S.
Monitor
A person appointed by LEO to carry out monitoring of a clinical trial.
National Lead Clinical Research Associate (NLCRA)
LP0053-1001 04-Mar-2014 Page 16 of 315
The person appointed to be the national sponsor representative responsible for all aspects of a
clinical trial within a country as outlined in Global Clinical Operations SOPs.
Randomisation Code List
A list of (sequential) numbers to each of which a treatment is allocated (assigned). Treatment
may be revealed as a code letter (e.g. A, B, …) or by directly revealing the specific treatment
(investigational product).
Endpoint
An assessment or a transformation of the assessment(s) described on a subject level, for
which a statistical analysis is performed, i.e. a p-value or a confidence interval is stated, or for
which tabulation serves as important supportive evidence of efficacy/safety.
LP0053-1001 04-Mar-2014 Page 17 of 315
1 Ethics
1.1 Independent Ethics Committee (IEC) or Institutional Review Board
(IRB)
The clinical study protocol and any relevant amendments to the clinical study protocol were
approved by the relevant Institutional Review Boards (IRBs).
The appropriate regulatory authority was notified of/approved the clinical trial, as required.
A list of all IRBs consulted is given in Appendix 1.3.
1.2 Ethical Conduct of the Trial
This clinical trial conformed to the principles of the Declaration of Helsinki as adopted by the
18th World Medical Association, General Assembly, June 1964 and subsequent amendments.
The clinical trial was conducted in compliance with the principles of Good Clinical Practice
(GCP). The trial was conducted in accordance with applicable national regulatory
requirements and under a US Investigational New Drug (IND) Application.
All subjects received written and verbal information concerning the clinical trial as specified
in Section 1.3.
Subjects were asked to consent that their personal data were recorded, collected, processed
and could be transferred to EU and non-EU countries in accordance with any national
legislation regulating privacy and data protection.
All information containing personal data was to be handled in accordance with the general
terms of the authorisation granted by the Danish Data Protection Agency to LEO Pharma A/S
(hereafter referred to as LEO), as appended to the clinical study protocol, in accordance with
the EU Data protection Directive (95/46/EC) as well as any national data protection
legislation.
1.3 Subject Information and Informed Consent
All subjects received written and verbal information concerning the clinical trial. This
information emphasised that participation in the clinical trial was voluntary and that the
subject could withdraw from the clinical trial at any time and for any reason. All subjects
were given an opportunity to ask questions and were given sufficient time to consider all
relevant issues before consenting.
LP0053-1001 04-Mar-2014 Page 18 of 315
The subject’s signed and dated informed consent to participate in the clinical trial was
obtained prior to any trial-related activities being carried out. An additional signed and dated
informed consent was obtained for those subjects who had clinical photographs taken (Section
5.5.3.3) prior to any trial-related activities being carried out.
A representative subject information sheet and informed consent form is provided in
Appendix 1.3.

LP0053-1001 04-Mar-2014 Page 19 of 315
2 Investigators and Trial Administrative Structure
LEO was the sponsor of the clinical trial and participating LEO affiliates were authorised by
the sponsor to act on behalf of the sponsor in the countries where the clinical trial was
conducted.

LP0053-1001 04-Mar-2014 Page 20 of315
Table 2-1
Role
Investigators and Trial Administrative Structure
Name, Title, Affiliation
futemational co-ordinating investigator:
Head of Medical Department
Head of Biostatistics:
Trial statistician:
futemational clinical trial manager (ICTM):
National Lead CRA (NLCRA):
Sponsor 's medical expe1i:
Contract Research Organisation (CRO):
, MD, Central De1matology, 1034 S.
- ,MSc LEOPhanna Denmruk Tel. : email:
-MD, ~en 5 . , e-mail:
Suite 600, St. . MO 63117, USA, Fax:
Medical Depruiment, LEO DK-2750 Ballemp, Denmark,
Biostatistics and Data Management, 1pru·ken 55 DK-2750 Ballemp,
Fax:
LEO Phruma A/S, Tel. :-
, LEO Phanna :-LEO Phruma
'-'llll.IL<UA' Tel.: II
LEO PhannaA/S, k,Tel. :-
The CRO was responsible for project management, clinical conduct, monitoring, data management, and randomisation code list production.
LP0053-1001
Emergency un-blinding CRO
Clinical Trial Supply:
04-Mar-2014 Page 21 of315
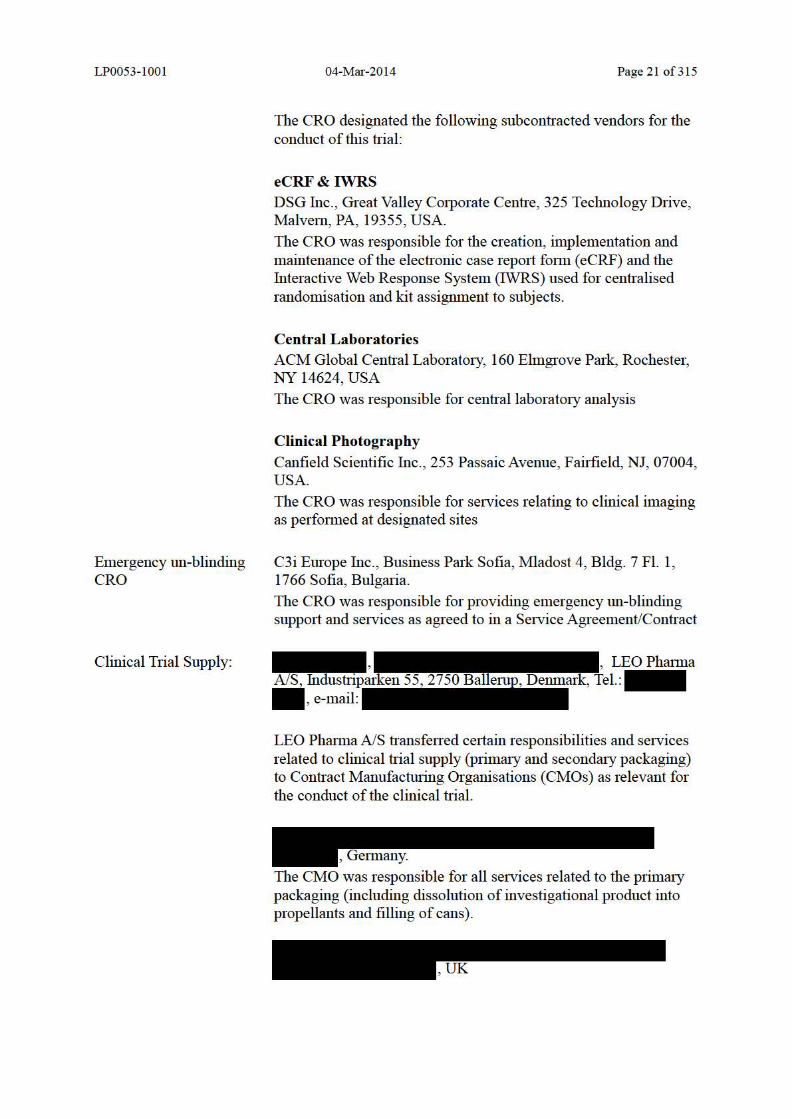
The CRO designated the following subcontracted vendors for the conduct of this u·ial:
eCRF&IWRS DSG Inc., Great Valley Cmporate Cenu·e, 325 Technology Drive, Malvem, PA, 19355, USA The CRO was responsible for the creation, implementation and maintenance of the elecu·onic case repmi fmm ( eCRF) and the Interactive Web Response System (IWRS) used for cenu·alised randomisation and kit assignment to subjects.
Central Laboratories ACM Global Cenu·al Laboratmy, 160 Elmgt·ove Park, Rochester, NY 14624, USA The CRO was responsible for cenu·allaboratmy analysis
Clinical Photography Canfield Scientific Inc. , 253 Passaic Avenue, Fairfield, NJ, 07004, USA The CRO was responsible for services relating to clinical imaging as perfonned at designated sites
C3i Europe Inc., Business Park Sofia, Mladost 4, Bldg. 7 Fl. 1, 1766 Sofia, Bulgaria. The CRO was responsible for providing emergency lm-blinding suppmi and services as agt·eed to in a Service Agreement/Conu·act
LEO Phruma el.: -
LEO Phanna A/S u·ansfened ce1iain responsibilities and services related to clinical u·ial supply (primruy and secondruy packaging) to Conu·act Manufacturing Organisations (CMOs) as relevant for the conduct of the clinical u·ial.
The CMO was responsible for all services related to the prima1y packaging (including dissolution of investigational product into propellants and filling of cans) .
LP0053-1001
Phrumacovigilance Scientist, Global Phrumacovigilance:
Medical writer:
04-Mar-2014 Page 22 of315
The CMO was responsible for the seconda!y packaging, labelling and disu·ibution of u·ial medication, and also the receipt, accountability, weighing, reconciliation and destruction of retumed u·ial medication.
-PhD,- , Medical Deprutment, LEO ~usu·ip~750 TeL:
The cmTiculum vita.e of the intemational coordinating investigator and a list of other persons
whose pruiicipation materially affected the conduct of the u·ial are included in Appendix 1.4.

LP0053-1001 04-Mar-2014 Page 23 of 315
3 Introduction
The trial was performed as a phase 3 clinical trial of LEO 90100 aerosol foam (hereafter
referred to as LEO 90100), a fixed combination product containing calcipotriol plus
betamethasone dipropionate in an aerosol foam formulation, in adult subjects with psoriasis
vulgaris. The trial was conducted in accordance with applicable US regulatory requirements
and under an US IND Application.
3.1 Psoriasis Vulgaris
Psoriasis is one of the most common chronic skin diseases with predominantly skin and joint
manifestations affecting approximately 1–3% of the population (6,7,8). The major
manifestation of psoriasis vulgaris (also known as plaque psoriasis) is chronic inflammation
of the skin, characterised by sharply demarcated, scaling, and erythematous plaques that may
be painful and often severely pruritic. In order to reduce the risk of systemic toxicity, topical
therapy is the regimen of choice for subjects with less extensive disease which comprises two
thirds of all subjects with psoriasis (9). The most commonly used topical treatments are
corticosteroids and vitamin D analogues which can be used alone or in combination.
However, application of topical therapies can be cumbersome, messy and time-consuming,
which can have a negative impact on adherence to the prescribed treatment regimen and
ultimately result in poor control of the disease. Thus there is an ongoing need for development
of topical psoriasis treatments that, in addition to being highly efficacious, are also convenient
and easy to use, which could reduce the burden of daily treatment and improve adherence to
therapy.
3.2 Investigational Product
LEO 90100 is an aerosol formulation of calcipotriol 50 mcg/g (as hydrate) and betamethasone
0.5 mg/g (as diproprionate) currently under development for the topical treatment of psoriasis
vulgaris. LEO 90100 is packed in an aluminum can with dimethyl ether and butane
propellants. At administration, the majority of propellants (butane and dimethyl ether)
evaporate quickly leaving a foam with propellant residues on the skin. Apart from the
propellants, no new excipients have been added to LEO 90100 as compared to the marketed
formulation of the investigational product, DAIVOBET®/DOVOBET®/TACLONEX®
ointment (hereafter referred to as Daivobet® ointment).
LEO 90100 has been developed with the purpose of improving the convenience and ease of
use of the product for patients with psoriasis vulgaris. It may be a more cosmetically accept-
able alternative to Daivobet® ointment, which contains the same active ingredients in the
same concentration.
LP0053-1001 04-Mar-2014 Page 24 of 315
The efficacy and safety of LEO 90100 were evaluated in two phase 2 trials including a total of
678 subjects with psoriasis vulgaris; a proof-of-concept trial comparing LEO 90100 to each of
its active components in the same aerosol foam vehicle (hereafter referred to as vehicle) (18)
and a comparator trial with Daivobet® ointment (19). The proof-of-concept trial showed that
the efficacy of LEO 90100 applied once daily for 4 weeks was superior to that of each active
component used alone in the same vehicle in the treatment of psoriasis vulgaris on the trunk
and limbs. In the comparator trial, LEO 90100 was shown to be more effective than
Daivobet® ointment in the treatment of psoriasis vulgaris on the body over 4 weeks. Overall,
LEO90100 appeared to be well tolerated with a safety profile comparable to that of Daivobet®
ointment.
3.3 Trial Rationale
Daivobet® ointment has proven highly effective in the treatment of psoriasis vulgaris on trunk
and limbs with an improved benefit/safety profile compared with each active component used
as monotherapy. The hypothesis that the same constituents (calcipotriol plus betamethasone
dipropionate) combined in an aerosol delivery system would also be effective in the treatment
of psoriasis vulgaris was supported by the results of an exploratory clinical trial (modified
psoriasis plaque test), in which LEO 90100 showed better anti-psoriatic effect than Daivobet®
ointment and betamethasone dipropionate in the LEO 90100 vehicle. The hypothesis was also
supported by the results of 2 completed phase 2 trials (see Section 3.2) that demonstrated that
LEO 90100 is a highly effective and well tolerated treatment for psoriasis vulgaris on trunk
and limbs and that both active components make a contribution to the overall anti-psoriatic
effect of LEO 90100, in accordance with the US Food and Drug Administration (FDA)
regulation regarding the development of fixed-combination prescription drugs for use in
humans (21 CFR 300.50).
The purpose of this phase 3 trial was to confirm the safety and efficacy of LEO 90100 in the
treatment of subjects with psoriasis vulgaris on the trunk and limbs in a larger, vehicle-
controlled trial.
LP0053-1001 04-Mar-2014 Page 25 of 315
4 Trial Objectives
4.1 Primary Objective
To compare the efficacy of treatment with LEO 90100 to that of treatment with vehicle for
up to 4 weeks in subjects with psoriasis vulgaris.
4.2 Secondary Objectives
To compare the safety of treatment with LEO 90100 to that of treatment with vehicle for
up to 4 weeks in subjects with psoriasis vulgaris.
LP0053-1001
5 Investigational Plan
5.1 Overall Trial Design
5.1.1 Overview of the Trial
04-Mar-2014 Page 26 of315
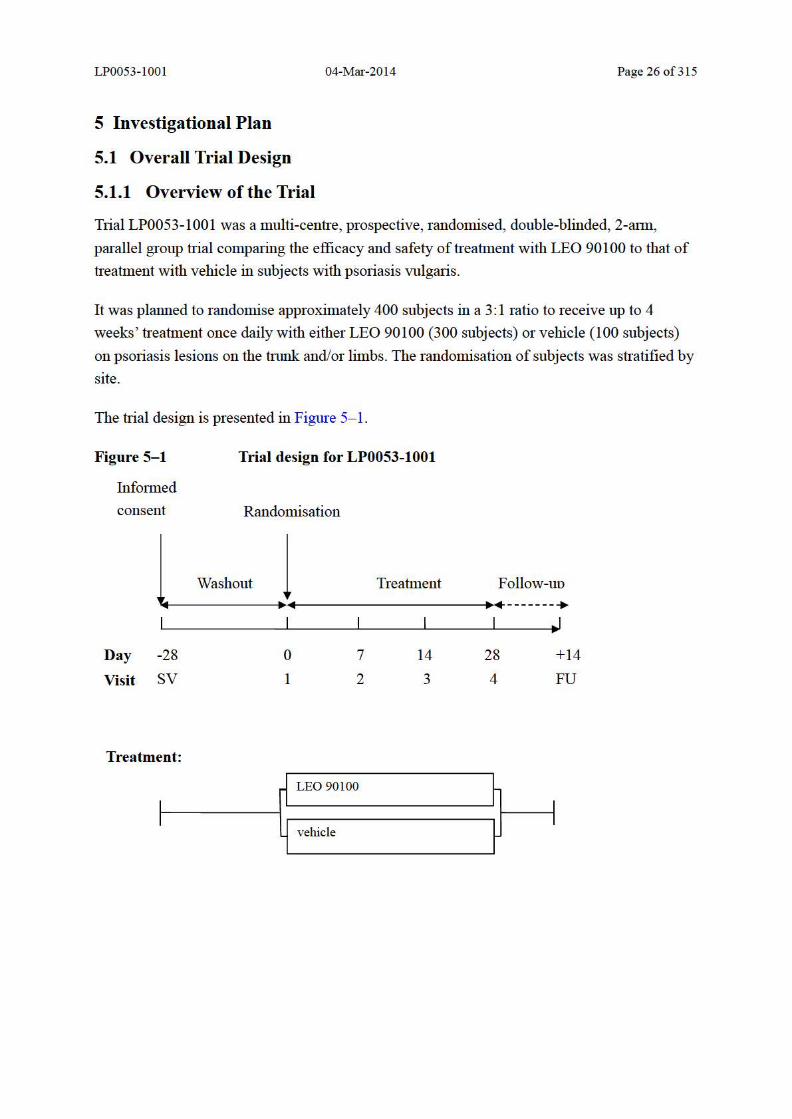
Trial LP0053-1001 was a multi-centre, prospective, randomised, double-blinded, 2-ann ,
parallel group trial comparing the efficacy and safety of treatment with LEO 90100 to that of
treatment with vehicle in subjects with psoriasis vulgaris.
It was planned to randomise approximately 400 subjects in a 3: 1 ratio to receive up to 4
weeks ' treatment once daily with either LEO 90100 (300 subjects) or vehicle (100 subjects)
on psoriasis lesions on the tmnk and/or limbs. The randomisation of subjects was su·atified by
site.
The u·ial design is presented in Figme 5-1 .
Figure 5-1
lnf01med
consent
Trial design for LP0053-1001
Randomisation
Washout 1 Treatment Follow-uo ..._ _____ ____.,+-----------.....- -------·
Day -28
Visit SV
Treatment:
0
1
7
2
LEO 90100
vehicle
14
3
28
4
+14
FU
LP0053-1001 04-Mar-2014 Page 27 of 315
5.1.2 Trial Periods
The trial consisted of a wash-out/screening period for up to 4 weeks (28 days) for withdrawal
of pre-trial medication, a 4-week treatment period (Visits 1 to 4) and, if required, a 2-week
safety follow-up period.
5.1.2.1 Washout/Screening Phase
Prior to participating in any trial procedure, a signed informed consent was obtained from the
subject.
Prior to randomisation, the subject entered a washout phase (if required) where anti-psoriatic
treatment and other relevant medication/treatments were discontinued as defined by the
exclusion criteria (see Section 5.3.2). The wash-out/screening phase could last for up to 4
weeks, depending on which disallowed treatments the subject received (see Section 5.4.6).
However, if no washout was needed the subject could enter Visit 1 directly.
5.1.2.2 Treatment Phase
The treatment phase was scheduled to be 4 weeks. There were 4 visits: Visit 1 (Week 0,
randomisation, baseline), Visit 2 (Week 1), Visit 3 (Week 2) and Visit 4 (Week 4).
Visits 2 to 4 were to be performed within ±2 days of the scheduled time relative to Visit 1; if
the visit was performed outside of the visit window, the (sub)investigator recorded the reason
in the subject’s medical record.
Subjects were assessed at all treatment visits, i.e., at baseline and after 1, 2, and 4 weeks of
treatment. Efficacy assessments included the Investigator’s Global Assessment of disease
severity (IGA) and the modified Psoriasis Area and Severity Index (m-PASI) (see Section
5.5.3.1 for details). For the IGA, the (sub)investigator made a global assessment of the disease
severity of the psoriasis vulgaris on the trunk and limbs, which represented the average lesion
severity on the trunk and limbs. The assessment was based on the condition of the disease at
the time of evaluation, and not in relation to the condition at a previous visit. For the m-PASI,
the (sub)investigator assessed the extent and severity of the three clinical signs (redness,
thickness, and scaliness) on the arms, trunk and legs.
At Visit 1, the (sub)investigator selected a target lesion. The target lesion was to be a
minimum of 5 cm at its longest axis and preferably not located on the extensor surface of an
elbow or knee. At Visits 1 to 4, the (sub)investigator assessed the severity of the target lesion
for each clinical sign (redness, thickness, scaliness) according to the same scale as the m-
PASI.
LP0053-1001 04-Mar-2014 Page 28 of 315
The subject’s assessments included global assessment of disease severity and assessments of
itching, itch-related sleep loss and quality of life. Clinical photographs of the full body
(excluding the head) and the selected target lesion on the trunk or limbs were taken in a subset
of subjects as supportive data to clinical assessments and eligibility criteria.
Subjects classified as ‘clear’ according to the IGA on the trunk and limbs at either Visit 2 or
Visit 3 were allowed to stop treatment at the (sub)investigator’s discretion. Should such occur,
the subject was to remain in the trial and attend all scheduled visits. If the psoriasis
reappeared on the treatment areas, the subject was to reinitiate treatment without consulting
the (sub)investigator. More than one discontinuation/restart cycle was allowed.
Safety assessments included recordings of vital signs, adverse events (AEs), and local safety
and tolerability assessments. In addition, blood and spot urine samples were taken for
evaluation of albumin-corrected serum calcium level and calcium:creatinine ratio,
respectively.
Subjects were provided with a diary at Visits 1 to 3 to record adherence to the once daily
treatment regimen during the visit interval. The diary was to be returned to the site staff at the
subsequent trial visit.
Additionally, the diary provided at Visit 1 included subject’s assessment of itch and itch-
related sleep loss by use of a Visual Analogue Scale (VAS). The 2 VAS were to be completed
by the subject on Days 3 and 5.
5.1.2.3 Follow-up Phase
A follow-up visit/contact was to be conducted 14 (±2) days after the last on-treatment visit,
unless the final outcome of the event had been determined before then.
A follow-up visit/contact would take place only if:
There was an on-going (serious or non-serious) AE at the last on-treatment visit which
was classified as possibly or probably related or not assessable in relation to the
investigational products.
The albumin-corrected serum calcium was above the reference range at the last on-
treatment visit
Any laboratory parameter was abnormal and judged as clinically significant by the
(sub)investigator at the last on treatment visit
LP0053-1001 04-Mar-2014 Page 29 of 315
Where the (sub)investigator considered it appropriate, the follow-up visit was performed as a
telephone contact.
5.2 Discussion of Trial Design, Including the Choice of Control Groups
The consolidated clinical study protocol and erratum sheet are included in Appendix 1.1 and
the unique pages of the case report form (CRF) are enclosed in Appendix 1.2.
Trial Design
The trial was a multi-centre, prospective, randomised, double-blinded, 2-arm, parallel group
trial. This design is the established standard for comparison of safety and efficacy and is
intended to minimise any potential bias that could compromise the conduct and outcome of
the trial.
Subjects
The inclusion/exclusion criteria were designed to select a population that was representative
of the target population; i.e., subjects of all disease severities (‘mild’ to ‘severe’ according to
the IGA) amenable to topical therapy. The eligibility criteria prevented confounding issues
with diagnosis and eliminated any possible effect of concurrent diseases or concomitant
medications on clinical assessment.
Randomisation was stratified by investigational site to ensure a 3:1 ratio between treatment
groups. To ensure the independence of each of the clinical trials in this clinical development
programme, subjects enrolled in this clinical trial had not participated in the phase 2 trials.
Treatment Duration
The treatment duration of 4 weeks was considered appropriate to obtain sufficient data on the
efficacy and safety of the evaluated investigational product. A treatment duration of 4 weeks
was shown to be safe and effective in previous studies of Daivobet® ointment (8,11,12,13) as
well as in the completed phase 2 trials with LEO 90100 (18,19).
Dosing Regimen
A once daily treatment regimen was chosen as this was considered more convenient for the
subject than a twice daily treatment and was shown to be effective in previous trials of
ointment and topical suspension/gel, as well as in the phase 2 trials with LEO 90100. It
decreases drug exposure and time spent on application and is thus expected to enhance subject
compliance. The maximum weekly allowance of investigational product was 90 g and was
within the 100 g limit used for the ointment.
LP0053-1001 04-Mar-2014 Page 30 of 315
Approximately 100 subjects were planned to receive a treatment for their psoriasis with no
active ingredients for 4 weeks. Given the short duration of treatment, this was considered
ethically justified.
Endpoints
The IGA was chosen as the primary efficacy assessment. The IGA is a static skin disease
severity scoring- system, consisting of a five point scale from ‘clear’ to’ severe’.
The primary endpoint was subjects with ‘treatment success’ according to the IGA of trunk and
limbs at Week 4. ‘Treatment success’ was defined as ‘clear’ or ‘almost clear’ for subjects with
at least moderate disease at baseline, and ‘clear’ for subjects with mild disease at baseline.
The percentage of subjects who achieved ‘treatment success’ was regarded as the best
evidence of efficacy (20). Comparison of the percentage of subjects with ‘controlled disease’
between the treatment arms reflects the difference in the effect of the treatments. To facilitate
standardisation of assessments and to minimise inter-rater variability, the IGA scale includes a
detailed description of the morphological characteristics for each severity category, thus
assisting the investigator in evaluation.
The Psoriasis Area and Severity Index (PASI), used as a secondary endpoint, is a well
established assessment that has been used in all previous studies of psoriasis conducted by
LEO. The PASI was included to enable comparison of results across several studies and also
to assess the development of response to treatment over time. This trial used a modified PASI
(m-PASI), calculated as described in Section 5.6.1.2.
Because of the potential effect of the vitamin D analogue containing investigational product
on calcium metabolism and homeostasis, safety analysis of parameters of calcium metabolism
was made following sampling of venous blood and urine collected on Day 0 and Week 4 (or
the last on-treatment visit as applicable).
Local safety and tolerability was evaluated by scoring of application site skin reactions.
Clinical signs and symptoms were assessed on a 4-point scale (from absent to severe) on the
perilesional area and the lesional/perilesional area.
To support clinical decision-making when treating subjects with psoriasis, an evaluation of
quality of life was included in this trial by means of the generic EQ-5D-5L questionnaire,
which is a standardised instrument for use as a measure of health outcome and also the
Dermatology Life Quality Index (DLQI) which is a validated dermatology specific
questionnaire measuring specific factors influencing the quality of life for subjects with skin
disease.

LP0053-1001 04-Mar-2014 Page 31 of 315
A common symptom in subjects with psoriasis is itch, which adversely affects quality of life.
For instance, itch may interfere with sleep quality by increasing nocturnal awakenings and
sleep fragmentation. In this trial the subjects were asked to assess both the intensity of itch
and how it affected sleep by use of a VAS. A special focus was on potential early relief of itch
and sleep impairment. Therefore, in addition to completing the assessments at each visit, the
subjects recorded the VAS scores in a subject diary on Day 3 and Day 5.
Concomitant Treatments
During the course of the trial, subjects were not allowed to use any concomitant treatments
that might have had a possible effect on psoriasis vulgaris on the treatment area (trunk and/or
limbs). This included various systemic treatments (e.g. systemic corticosteroids, retinoids,
methotrexate, ciclosporin and other immunosuppressants and biological therapies).
Use of any drug except the investigational product for the treatment of psoriasis vulgaris was
not allowed except for some topical treatments on the face, skin folds, and scalp (see Section
5.4.6).
Prior to randomisation, a washout period was to be completed if the subject was treated, or
had recently been treated with anti-psoriatic treatments or other relevant medication that could
influence the outcome of the trial.
5.3 Selection of Trial Population
The trial population was chosen to include subjects ≥18 years of age with psoriasis vulgaris
on the trunk and/or limbs of at least mild severity according to the IGA and amenable to
topical therapy with up to 90 g of trial medication per week.
5.3.1 Inclusion Criteria
To be included in the trial subjects had to fulfil all of the following criteria:
1. Signed and dated informed consent obtained prior to any trial related activities
(including washout period)
2. Age 18 years or above
3. Either sex
4. Any race or ethnicity
5. All skin types
6. Attending a hospital outpatient clinic or the private practice of a board certified
dermatologist
LP0053-1001 04-Mar-2014 Page 32 of 315
7. A clinical diagnosis of psoriasis vulgaris of at least 6 months duration involving the
trunk and/or limbs amenable to treatment with a maximum of 90 g of trial medication
per week
8. Psoriasis vulgaris on the trunk and/or limbs (excluding psoriasis on the genitals and
skin folds) involving 2-30% of the body surface area (BSA)
9. An Investigator’s Global Assessment of disease severity (IGA) of at least mild on trunk
and/or limbs on Day 0 (Visit 1)
10. A modified PASI (m-PASI) score of at least 2 on the trunk and/or limbs on Day 0 (Visit
1)
11. A target lesion of a minimum of 5 cm at its longest axis and preferably not located on
the extensor surface on an elbow or knee, scoring at least 1 for each of redness,
thickness and scaliness, and at least 4 in total by the Investigator’s assessment of
severity of the target lesion
12. Females of childbearing potential must have had a negative pregnancy test ont Day 0
(Visit 1)
13. Females of childbearing potential must have agreed to use a highly effective method of
birth control during the trial*
14. Able to communicate with the investigator and understand and comply with the
requirements of the trial
*A highly effective method of birth control was defined as one which results in a low failure
rate (less than 1% per year) such as implants, injectables, combined oral contraceptives, some
intra-uterine devices, sexual abstinence or vasectomised partner. The subjects were to have
used the contraceptive method continuously for at least 1 month prior to the pregnancy test,
and must have continued using the contraceptive method for at least 1 week after the last
application of trial medication. A female was defined as not of child-bearing potential if she
was postmenopausal (12 months with no menses without an alternative medical cause), or
surgically sterile (tubal ligation/section, hysterectomy, or bilateral ovariectomy).
5.3.2 Exclusion Criteria
Any of the following was regarded as a criterion for exclusion from the trial:
1. Systemic treatment with biological therapies, whether marketed or not, with a possible
effect on psoriasis vulgaris within the following time periods prior to randomisation:
Etanercept – within 4 weeks prior to randomisation
LP0053-1001 04-Mar-2014 Page 33 of 315
Adalimumab, infliximab – within 8 weeks prior to randomisation
Ustekinumab – within 16 weeks prior to randomisation
Other products – within 4 weeks/5 half-lives prior to randomisation
(whichever was longer)
2. Systemic treatment with all other therapies with a possible effect on psoriasis vulgaris
(e.g., corticosteroids, retinoids, methotrexate, ciclosporin and other
immunosuppressants) within 4 weeks prior to randomisation
3. Subjects who received treatment with any non-marketed drug substance (i.e. a drug
which had not yet been made available for clinical use following registration) within 4
weeks/5 half-lives (whichever was longer) prior to randomisation
4. Psoralen combined with Ultraviolet A (PUVA) therapy within 4 weeks prior to
randomisation
5. Ultraviolet B (UVB) therapy within 2 weeks prior to randomisation
6. Topical anti-psoriatic treatment on the trunk and limbs (except for emollients) within 2
weeks prior to randomisation
7. Topical treatment on the face, scalp and skin folds with corticosteroids, vitamin D
analogues or prescription shampoos within 2 weeks prior to randomisation
8. Planned excessive exposure of area(s) to be treated with trial medication to either
natural or artificial sunlight (including tanning booths, sun lamps etc.) during the trial
9. Planned initiation of, or changes to, concomitant medication that could affect psoriasis
vulgaris (e.g. beta blockers, antimalarial drugs, lithium, angiotensin converting enzyme
inhibitors) during the trial
10. Current diagnosis of guttate, erythrodermic, exfoliative or pustular psoriasis
11. Subjects with any of the following conditions present on the treatment area: viral (e.g.
herpes or varicella) lesions of the skin, fungal and bacterial skin infections, parasitic in-
fections, skin manifestations in relation to syphilis or tuberculosis, acne vulgaris,
atrophic skin, striae atrophicae, fragility of skin veins, ichtyosis, ulcers and wounds
12. Other inflammatory skin disorders (e.g. seborrhoeic dermatitis or contact dermatitis) on
the treatment area that may have confounded the evaluation of psoriasis
13. Known or suspected disorders of calcium metabolism associated with hypercalcaemia
14. Known or suspected severe renal insufficiency or severe hepatic disorders
15. Known or suspected hypersensitivity to component(s) of the investigational products

LP0053-1001 04-Mar-2014 Page 34 of 315
16. Current participation in any other interventional clinical trial
17. Previously randomised in this trial or any previously conducted trial of LEO 90100
18. Females who were pregnant, wished to become pregnant during the trial or were
breast-feeding
5.3.3 Removal of Subjects from Therapy or Assessment
Subjects could have been withdrawn for any of the following reasons:
1. Unacceptable treatment efficacy: the investigator was free to withdraw the subject at
any time for medical reasons
2. Unacceptable AEs: any AE that the investigator or the subject considered unacceptable
3. Exclusion criteria: any exclusion criteria which emerged/became apparent during the
subject’s participation in the clinical trial
4. Voluntary withdrawal: subjects were free to withdraw from the clinical trial at any time
and for any reason
5. Other reasons: other reasons than stated above which required the subject to (be)
withdraw(n) were to be specified
Subjects who were discovered, after enrolment/randomisation, not to have fulfilled all in-
/exclusion criteria at time of enrolment, were to continue treatment unless the investigator,
based on clinical and ethical evaluation, found continuation inappropriate. The final efficacy
assessment (at the correct scheduled time) should have been attempted to be completed for all
subjects. Such deviation(s) from the consolidated clinical study protocol had to be reported to
LEO (and IRBs) and recorded in the clinical study report.
Subjects that experienced an AE which required the discontinuation of treatment were to
remain in the trial and assessed at all subsequent trial visits according to the trial schedule.
The subject was to continue to be evaluated until the AE resolved or the aetiology was
identified and the AE stabilised.
Subjects who withdrew from treatment for any other reasons had to remain in the trial and at
minimum, be asked to complete the final efficacy assessment (at the correct scheduled time).
In addition, subjects had to be withdrawn from treatment in case of an AE that was judged to
be possibly or probably related to treatment by the investigator and was of Grade 3 or 4
according to the general guideline in the US National Cancer Institute Common Terminology
Criteria for Adverse Events, i.e. one of the following:
LP0053-1001 04-Mar-2014 Page 35 of 315
Was severe or medically significant but not immediately life-threatening
Had life-threatening consequences
Required hospitalisation or prolongation of hospitalisation
Required urgent intervention
Was disabling
Limited self-care activities of daily life (ADL)
Note: Self-care ADL refer to bathing, dressing and undressing, feeding self, using the toilet,
taking medications, and not bed ridden.
Reason(s) for withdrawal from trial had to be recorded in the CRF.
Withdrawn subjects were not replaced.
5.4 Treatments
5.4.1 Treatments Administered
Subjects who fulfilled all inclusion and exclusion criteria were randomised in a 3:1 ratio to
receive one of the following treatments:
LEO 90100 aerosol foam, containing calcipotriol 50 mcg/g plus betamethasone 0.5 mg/g
(as dipropionate) (LEO 90100)
Aerosol foam vehicle (vehicle)
On Day 0 (Visit 1) subjects were given a treatment instruction sheet and received verbal
instruction on how to apply the investigational product. The first application of the
investigational product was made under the supervision and instruction of the trial staff. The
investigational product was applied to psoriasis vulgaris affected areas on the trunk, arms, and
legs once daily for 4 weeks. Subjects were instructed not to apply the investigational product
on psoriasis vulgaris on the face, scalp, genitals, or skin folds. Skin folds included the axillae,
the inguinal folds, the intergluteal folds, and the inframammary folds. There was no specific
requirement with regard to the time of day for application.
Subjects classified as ‘clear’ according to the IGA on the trunk and limbs at either Visit 2 or
Visit 3 were allowed to stop treatment at the (sub)investigator’s discretion. If this occurred,
investigational product was still dispensed and the subject was to remain in the trial and
attend all scheduled visits. If the psoriasis vulgaris reappeared on the treatment areas, the
LP0053-1001 04-Mar-2014 Page 36 of315
subject was to reinitiate treatment without consulting the (sub )investigator. More than one
discontinuationlrestmi cycle was allowed.
5.4.2 Investigational Products
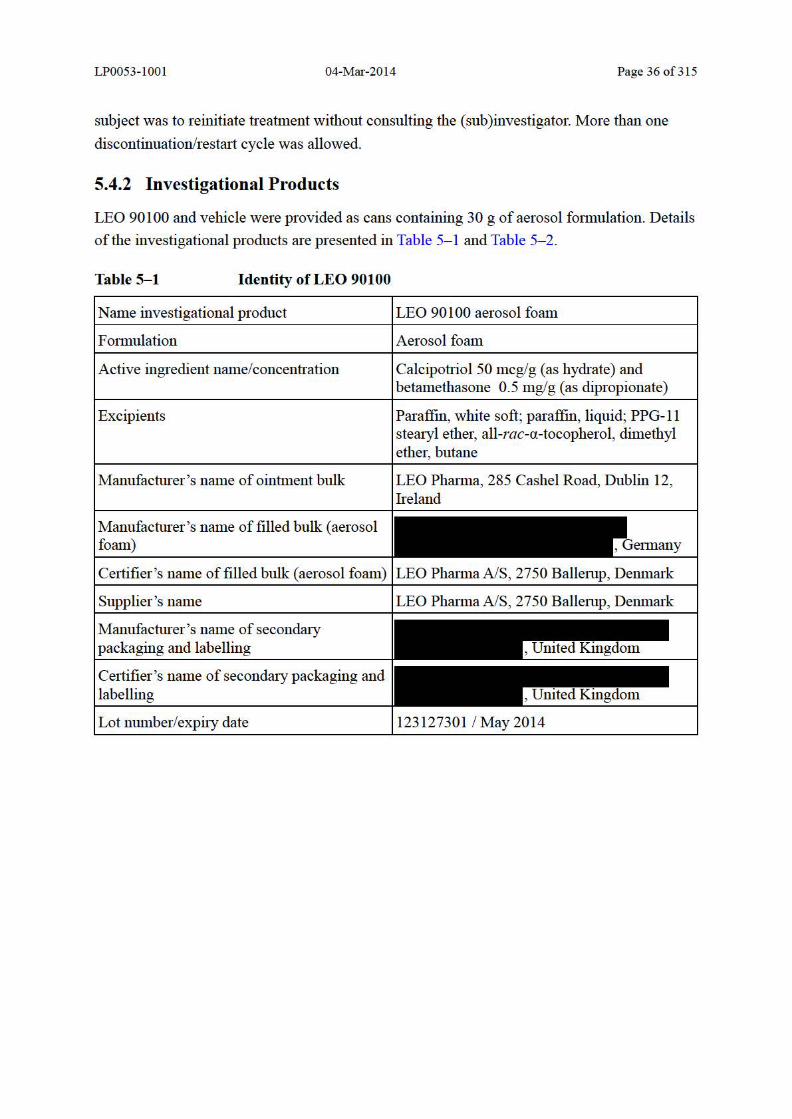
LEO 90100 and vehicle were provided as cans containing 30 g of aerosol f01mulation. Details
of the investigational products m·e presented in Table 5- 1 and Table 5- 2.
Table 5-1 Identity of LEO 90100
Name investigational product
F01mulation
Active ingredient name/concenu·ation
Excipients
Manufacturer's name of ointment bulk
Manufacturer's name of filled bulk (aerosol foam)
Ce1iifier 's name of filled bulk (aerosol foam)
Supplier's name
Manufacturer's name of secondmy packaging and labelling
Ce1iifier 's name of seconda1y packaging and labelling
Lot number/expi1y date
LEO 90100 aerosol foam
Aerosol foam
Calcipou·iol50 mcg/g (as hydrate) and betamethasone 0.5 mg/g (as dipropionate)
Pm·affm, white soft; pm·affin, liquid; PPG-11 stemyl ether, all-rae-a-tocopherol, dimethyl ether, butane
LEO Phmma, 285 Cashel Road, Dublin 12, Ireland

LP0053-1001 04-Mar-2014 Page 37 of315
Table 5-2 Identity of Vehicle
's name of ointment bulk
's name of filled bulk aen>sol foam)
's name of filled bulk (aerosol
's name of secondruy and labelling
's name of secondruy packaging labelling
number/expi1y date
foam vehicle
•'"""''"" .'" white soft; paraffin, liquid; PPG-11 ether, all-rae-a-tocopherol, dimethyl ether,
For details on labelling, storage and accountability of the investigational product, see Sections
1 0.6.1, 1 0.6.2 and 1 0.6.8 of the clinical study protocol (Appendix 1.1 ).
A listing of subjects receiving investigational product from specific batches is provided in
Appendix 1. 6.
5.4.3 Method of Assigning Subjects to Treatment Groups
Subjects who were fmmd to comply with all inclusion and exclusion criteria were randomised
in a 3:1 ratio to receive treatment with either LEO 90100 (300 subjects) or vehicle (100
subjects). Randmnisation was stratified by investigational site. Treatment assignment was
perfmmed using a central IWRS in accordance with a pre-plrumed computer generated
randomisation schedule.
At Visit 1 (Day 0), once a subject's eligibility was confi1med, the (sub )investigator/(site
personnel) supplied the IWRS with the subject number and the IWRS randmnised the subject
to either LEO 90100 or vehicle. At each visit, the IWRS analysed the investigational product
inventmy at the site and allocated a kit number to the subject according to the investigational
product assigned. Thus, each subject attending Visit 1 to Visit 4 was assigned 4 kit numbers

LP0053-1001 04-Mar-2014 Page 38 of 315
during the course of the trial. The subject number, randomisation number and visit kit
numbers for each subject were distinct from each other.
5.4.4 Selection and Timing of Dose for each Subject
A once daily treatment regimen was chosen as this had been shown to be effective in previous
studies of ointment and topical suspension/gel, as well as in the phase 2 trials with LEO
90100. It decreases drug exposure and time spent on application and was thus expected to
enhance subject adherence. The maximum weekly dose of LEO 90100 was selected based on
the approved maximum dose for Daivobet® ointment, which is 100 g. However, for practical
purposes (30 g was the only available pack-size) the maximum weekly dose was set to 90 g (3
cans) per week.
A description of application of the investigational product is provided in Section 5.4.1.
5.4.5 Blinding
The trial was a double-blind trial. The packaging and labelling of the investigational products
contained no evidence of their identity. It was not considered possible to differentiate between
the investigational products solely by sensory evaluation. No effects of the investigational
products which would reveal the identity of the individual treatment allocations were
expected. Consequently, the subjects and the (sub)investigators remained unaware of the
individual treatment assignment during the conduct of the clinical trial.
Emergency un-blinding of individual subject treatment could be performed by contacting the
IWRS. An emergency un-blinding request could be made by the (sub)investigators, other
health care professionals, or authorised LEO personnel.
For other healthcare professionals not directly involved in the trial but with the need to un-
blind an individual subject in an emergency scenario, the CRO responsible for emergency un-
blinding was to be contacted via the emergency number on the subject trial card. This CRO
then accessed the IWRS on behalf of the third-party requester and provided the subject’s
treatment assignment.
If code break was considered necessary for other safety concerns, for example due to adverse
drug reactions (ADRs), un-blinding could be performed by Global Pharmacovigilance at
LEO, and the reason for un-blinding had to be documented.
Treatment codes were not broken for the planned analyses of data until all decisions on the
evaluability of the data from each individual subject had been made and documented.
LP0053-1001 04-Mar-2014 Page 39 of 315
5.4.6 Prior and Concomitant Therapy
Use of concomitant treatment was recorded in the subject’s medical record and the CRF
(treatment/drug name, dose, route of administration, indication and dates of start and stop).
Prior to the Trial Treatment Phase
The washout phase was up to 4 weeks (28 days). Subjects who had been treated with medica-
tions requiring more than 4 weeks washout were not eligible for the trial. However, a subject
would be eligible if she/he had a treatment free period prior to entering the trial (i.e. having
signed the Informed Consent), e.g. if a subject had been off infliximab 6 weeks prior to
entering the trial, the subject could still be eligible for the trial after 2 weeks of washout.
Note: if the subjects had themselves initiated a treatment free period prior to entering the trial,
this was not considered a trial-related procedure and accordingly not part of the trial defined
wash-out phase. The earliest possible wash-out start date to record in the CRF was the day the
subject entered the trial (i.e. having signed the Informed Consent).
To account for an adequate treatment-free period, the date of last use of the excluded
medication was recorded in the CRF.
All previous anti-psoriatic treatment (systemic and topical medications and light therapy)
used by the subject to treat their psoriasis vulgaris was recorded by pre-defined categories.
Inhaled steroids were allowed during the washout phase.
Treatments requiring washout
Treatments requiring washout before Visit 1 are listed below, with the required individual
washout periods indicated in brackets:
Systemic treatment with biological therapies, whether marketed or not, with a potential
effect on psoriasis vulgaris (e.g. etanercept, infliximab, adalimumab and ustekinumab)
(see exclusion criterion No.1)*
Systemic treatments with all other therapies with a potential effect on psoriasis vulgaris
(e.g. corticosteroids, retinoids, methotrexate, ciclosporin and other immunosuppressants)
(4 weeks)
PUVA therapy (4 weeks)
UVB therapy (including excimer laser therapy) (2 weeks)
Topical anti-psoriatic treatment on the trunk and/or limbs (2 weeks)**
LP0053-1001 04-Mar-2014 Page 40 of 315
Topical treatment with corticosteroids, vitamin D analogues, and/or prescription shampoos
on face, scalp and skin folds (2 weeks)**
Use of non-marketed drug substances (see exclusion criterion No.3)
*) Note: duration of the washout phase should not exceed 4 weeks
**) Note: use of emollients was allowed on treatment areas during this 2 week period
During the Trial Treatment Phase
Concomitant medications for conditions other than psoriasis vulgaris (with no potential effect
on psoriasis vulgaris) could be continued throughout the trial without any change in dosage.
Inhaled steroids were allowed during the trial.
Bath oils and moisturising soaps were allowed during the trial.
Sunscreens were allowed, but were not to be applied at the same time as the investigational
product.
Treatments which could not be used during the treatment phase (visits 1 to 4) were the same
as those requiring a washout period, listed previously, with the addition of the following
which were not allowed:
Emollients on the areas of psoriasis that were to be treated with trial medication
(trunk/limbs)
Planned initiation of, or changes to, concomitant medication during the trial that, while
not specifically indicated for treatment of the indication being studied, could positively or
negatively affect psoriasis vulgaris (e.g. beta blockers, antimalarial drugs, lithium, ACE
inhibitors)
Planned excessive exposure of area(s) to be treated with trial medication to either natural
or artificial sunlight (including tanning booths, sun lamps etc.) during the trial
Use of any drug except the investigational product for the treatment of psoriasis vulgaris was
not allowed except for some topical treatments on the face, scalp and skin folds. Accordingly,
only the following concomitant topical anti-psoriatic treatments on face, scalp and skin folds
were permitted during the trial:
All topical medications except corticosteroids, vitamin D analogues and/or prescription
shampoos

LP0053-1001 04-Mar-2014 Page 41 of 315
Unlimited use of emollients
This restriction on concomitant topical therapies on other body regions was to assert a level of
control over the concomitant medication related effects observed during the trial and to allow
use of the trial medication up to the maximum recommended level.
A stable concomitant treatment regimen (no start or change of dosage during the trial) with
drugs that have a potential effect on psoriasis (e.g., beta blockers, anti-malarials, ACE
inhibitors and lithium) was allowed during the trial. Although these drugs have a potential
effect on psoriasis, they are not known to cause fluctuations in disease severity and therefore
should not have affected the subject’s response to trial medication.
5.4.7 Treatment Compliance and Extent of Exposure
Subjects were provided with a diary at Visit 1 to Visit 3 to record adherence to the once daily
treatment regimen during the visit interval. The diary was returned to the site staff at the
subsequent trial visit. At all on-treatment visits, the subject was asked if she/he had used the
medication as prescribed. If this was not the case, the degree and nature of non-compliance
was recorded.
The investigational product was applied once daily to psoriasis vulgaris lesions. Subjects
classified as ‘clear’ according to the IGA on the trunk and limbs at either Visit 2 or Visit 3
were allowed to stop treatment at the (sub)investigator’s discretion. If this occurred,
investigational product was still dispensed and the subject remained in the trial and attended
all scheduled visits. If psoriasis vulgaris reappeared on the treatment areas, the subject was to
reinitiate treatment without consulting the (sub)investigator. More than one discontinuation/
restart cycle was allowed.
Prior to secondary packaging, but following individual unit labelling, 10 cans were weighed
by the CMO and the average used as an estimate of the known filled weight for each can. At
the end of the trial, the investigational products returned to the CMO were reconciled with the
Individual Drug Accountability Forms. All returned cans which were dispensed to a subject
were weighed by the CMO to determine the amount of the investigational product used per
treatment phase visit interval for each subject.
5.5 Assessments
5.5.1 Frequency and Timing of Measurements
The schedule of all trial procedures for all trial visits is presented in Table 5–3.
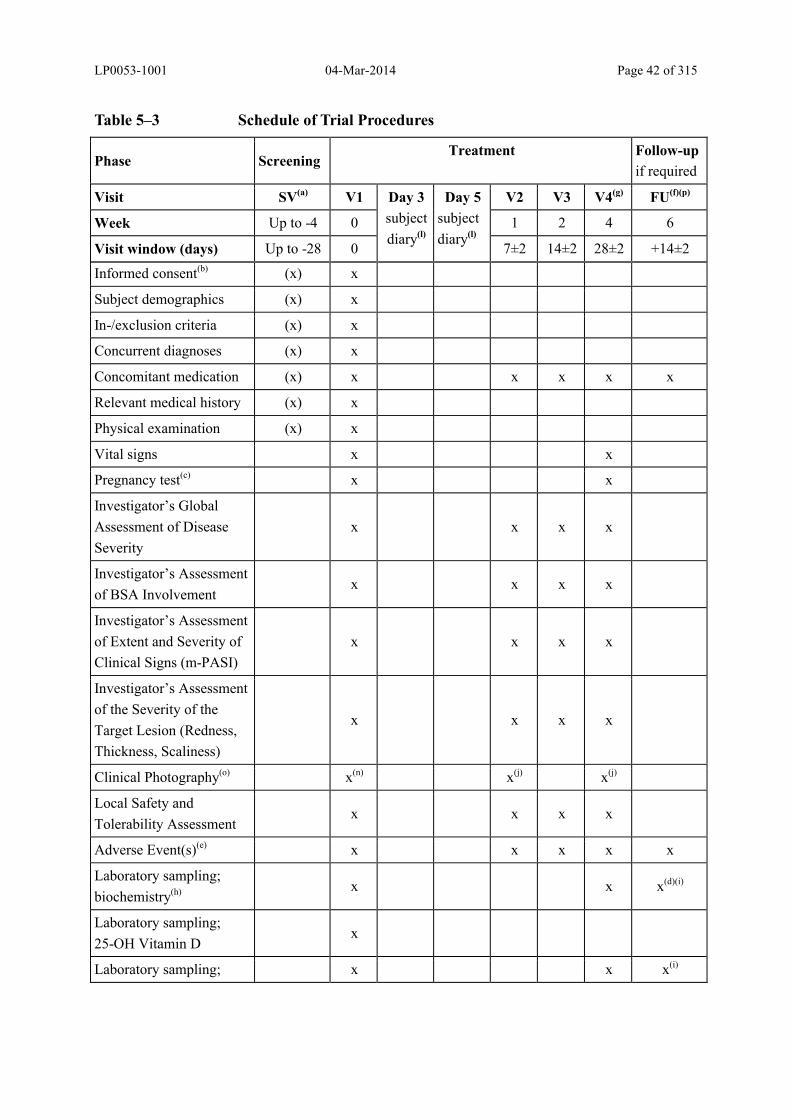
LP0053-1001 04-Mar-2014 Page 42 of 315
Table 5–3 Schedule of Trial Procedures
Phase Screening Treatment Follow-up
if required
Visit SV(a) V1 Day 3
subject
diary(l)
Day 5
subject
diary(l)
V2 V3 V4(g) FU(f)(p)
Week Up to -4 0 1 2 4 6
Visit window (days) Up to -28 0 7±2 14±2 28±2 +14±2
Informed consent(b) (x) x
Subject demographics (x) x
In-/exclusion criteria (x) x
Concurrent diagnoses (x) x
Concomitant medication (x) x x x x x
Relevant medical history (x) x
Physical examination (x) x
Vital signs x x
Pregnancy test(c) x x
Investigator’s Global
Assessment of Disease
Severity
x x x x
Investigator’s Assessment
of BSA Involvementx x x x
Investigator’s Assessment
of Extent and Severity of
Clinical Signs (m-PASI)
x x x x
Investigator’s Assessment
of the Severity of the
Target Lesion (Redness,
Thickness, Scaliness)
x x x x
Clinical Photography(o) x(n) x(j) x(j)
Local Safety and
Tolerability Assessmentx x x x
Adverse Event(s)(e) x x x x x
Laboratory sampling;
biochemistry(h) x x x(d)(i)
Laboratory sampling;
25-OH Vitamin Dx
Laboratory sampling; x x x(i)
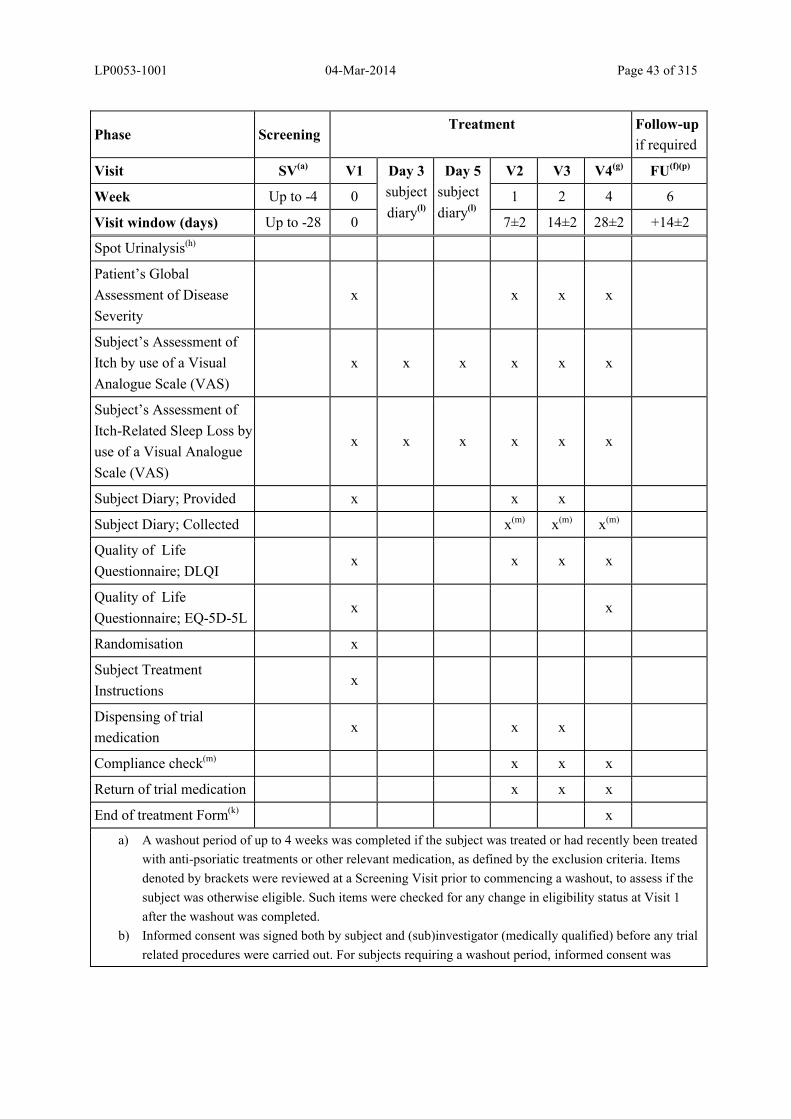
LP0053-1001 04-Mar-2014 Page 43 of 315
Phase Screening Treatment Follow-up
if required
Visit SV(a) V1 Day 3
subject
diary(l)
Day 5
subject
diary(l)
V2 V3 V4(g) FU(f)(p)
Week Up to -4 0 1 2 4 6
Visit window (days) Up to -28 0 7±2 14±2 28±2 +14±2
Spot Urinalysis(h)
Patient’s Global
Assessment of Disease
Severity
x x x x
Subject’s Assessment of
Itch by use of a Visual
Analogue Scale (VAS)
x x x x x x
Subject’s Assessment of
Itch-Related Sleep Loss by
use of a Visual Analogue
Scale (VAS)
x x x x x x
Subject Diary; Provided x x x
Subject Diary; Collected x(m) x(m) x(m)
Quality of Life
Questionnaire; DLQI x x x x
Quality of Life
Questionnaire; EQ-5D-5Lx x
Randomisation x
Subject Treatment
Instructionsx
Dispensing of trial
medicationx x x
Compliance check(m) x x x
Return of trial medication x x x
End of treatment Form(k) x
a) A washout period of up to 4 weeks was completed if the subject was treated or had recently been treated
with anti-psoriatic treatments or other relevant medication, as defined by the exclusion criteria. Items
denoted by brackets were reviewed at a Screening Visit prior to commencing a washout, to assess if the
subject was otherwise eligible. Such items were checked for any change in eligibility status at Visit 1
after the washout was completed.
b) Informed consent was signed both by subject and (sub)investigator (medically qualified) before any trial
related procedures were carried out. For subjects requiring a washout period, informed consent was

LP0053-1001 04-Mar-2014 Page 44 of 315
Phase Screening Treatment Follow-up
if required
Visit SV(a) V1 Day 3
subject
diary(l)
Day 5
subject
diary(l)
V2 V3 V4(g) FU(f)(p)
Week Up to -4 0 1 2 4 6
Visit window (days) Up to -28 0 7±2 14±2 28±2 +14±2
completed prior to washout.
c) For women of child-bearing potential, a pregnancy test was performed at Visit 1 and Visit 4 (or at the last
on-treatment visit)
d) If albumin-corrected serum calcium was above the reference range at the last on-treatment visit, a follow
up test was performed.
e) AEs were collected from the date of signing the informed consent form, i.e. during the washout period
f) If an adverse event (serious or non-serious) classified as possibly or probably related to the trial treatment
or not assessable in relation to the trial treatment was on-going at the last on-treatment visit.
g) For subjects prematurely withdrawn from treatment, the final efficacy assessments scheduled for Visit 4
were completed at the last on-treatment visit.
h) If a laboratory result was abnormal and judged as clinically significant, the (sub)investigator was to
follow-up as clinically appropriate (this could involve requesting repeat samples).
i) If any laboratory parameter was abnormal and judged as clinically significant by the (sub)investigator at
the last on treatment visit, a follow-up visit was performed.
j) Clinical photography to include target lesion only
k) If the subject was not randomised or did not complete the treatment period, the End of Trial form
wascompleted as appropriate.
l) Conducted as self-assessment by the subject and recorded in the diary provided at Visit 1.
m) To supplement the compliance check made at Visit 2 to Visit 4, a subject diary was completed daily
during each visit interval.
n) Clinical photography included target lesion and full body anterior and posterior images.
o) Clinical photography was a voluntary additional procedure for a subset of the studied population.
p) Where the (sub)investigator considered it appropriate, the follow-up visit was performed as a telephone
contact.
5.5.2 Baseline Characteristics and Demographics Assessed
Subject’s eligibility for the clinical trial was checked according to the inclusion and exclusion
criteria at visits specified in the trial procedure schedule in Table 5–3.
Demographic Data
Demographic data consisted of date of birth, sex, ethnic origin (ethnicity), race, and skin type.
The subjects were asked to self-report their ethnicity (Hispanic or Latino, not Hispanic or
Latino) and race (American Indian or Alaska Native, Asian, black or African American,
Native Hawaiian or Other Pacific Islander, white, other)
In addition, the skin type of subjects was recorded using the classification in Table 5–4 (21).
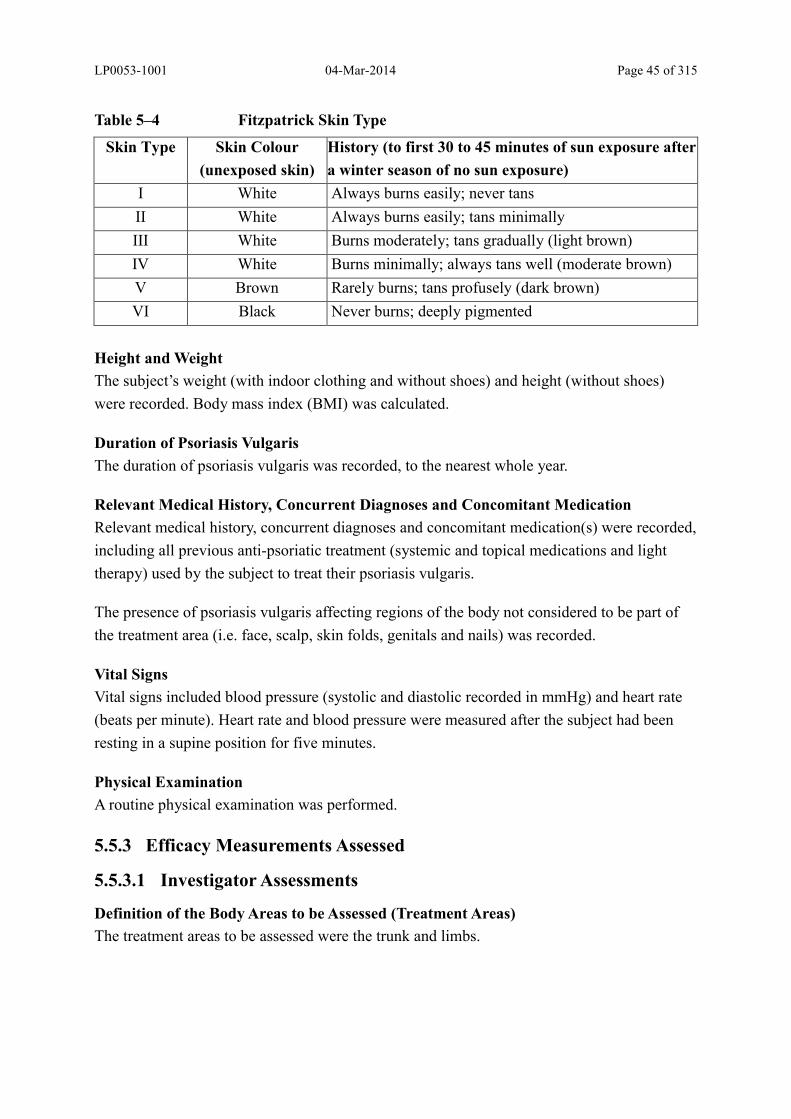
LP0053-1001 04-Mar-2014 Page 45 of 315
Table 5–4 Fitzpatrick Skin Type
Skin Type Skin Colour
(unexposed skin)
History (to first 30 to 45 minutes of sun exposure after
a winter season of no sun exposure)
I White Always burns easily; never tans
II White Always burns easily; tans minimally
III White Burns moderately; tans gradually (light brown)
IV White Burns minimally; always tans well (moderate brown)
V Brown Rarely burns; tans profusely (dark brown)
VI Black Never burns; deeply pigmented
Height and Weight
The subject’s weight (with indoor clothing and without shoes) and height (without shoes)
were recorded. Body mass index (BMI) was calculated.
Duration of Psoriasis Vulgaris
The duration of psoriasis vulgaris was recorded, to the nearest whole year.
Relevant Medical History, Concurrent Diagnoses and Concomitant Medication
Relevant medical history, concurrent diagnoses and concomitant medication(s) were recorded,
including all previous anti-psoriatic treatment (systemic and topical medications and light
therapy) used by the subject to treat their psoriasis vulgaris.
The presence of psoriasis vulgaris affecting regions of the body not considered to be part of
the treatment area (i.e. face, scalp, skin folds, genitals and nails) was recorded.
Vital Signs
Vital signs included blood pressure (systolic and diastolic recorded in mmHg) and heart rate
(beats per minute). Heart rate and blood pressure were measured after the subject had been
resting in a supine position for five minutes.
Physical Examination
A routine physical examination was performed.
5.5.3 Efficacy Measurements Assessed
5.5.3.1 Investigator Assessments
Definition of the Body Areas to be Assessed (Treatment Areas)
The treatment areas to be assessed were the trunk and limbs.

LP0053-1001 04-Mar-2014 Page 46 of 315
The trunk and limbs included the arms (including hands), trunk (including the neck), and the
legs (including the buttocks and feet).
The face, scalp, genitals and skin folds (i.e. the axillae, the inguinal folds, the inter-gluteal
folds and the infra-mammary folds) were not to be treated with the investigational product or
assessed as part of the efficacy analysis.
The (sub)investigator made the following clinical assessments (ideally, all assessments for a
subject were to be made by the same (sub)investigator).
Investigator’s Global Assessment of Disease Severity (IGA)
At all treatment visits (Visit 1 to Visit 4) the (sub)investigator made a global assessment of the
disease severity of the psoriasis vulgaris on the trunk and limbs by use of the 5-point scale
presented in Table 5–5. This assessment represented the average lesion severity on the trunk
and limbs. The assessments were based on the condition of the disease at the time of
evaluation, and not in relation to the condition at any previous visit.

LP0053-1001 04-Mar-2014 Page 47 of 315
Table 5–5 Investigator’s Global Assessment of Disease Severity – 5-point Scale
Clear Plaque thickening = no elevation or thickening of normal skin
Scaling = no evidence of scaling
Erythema = none (no residual red coloration but post-inflammatory hyperpigmentation may be present)
Almost clear
Plaque thickening = none or possible thickening but difficult to ascertain whether there is a slight elevation above normal skin level
Scaling = none or residual surface dryness and scaling
Erythema = light pink coloration
Mild Plaque thickening = slight but definite elevation
Scaling = fine scales partially or mostly covering lesions
Erythema = light red coloration
Moderate Plaque thickening = moderate elevation with rounded or sloped edges
Scaling = most lesions at least partially covered
Erythema = definite red coloration
Severe Plaque thickening = marked or very marked elevation typically with hard or sharp edges
Scaling = non-tenacious or thick tenacious scale, covering most or all of the lesions
Erythema = very bright red coloration; extreme red coloration; deep red coloration
Note: On Day 0 (Visit 1) disease severity had to be graded as at least ‘mild’ in order to meet
the inclusion criterion.
Investigator’s Assessment of the Extent and Severity of Clinical Signs (Redness, Thick-
ness, Scaliness)
At all treatment visits (Visit 1 to Visit 4) the (sub)investigator made assessments of the extent
and severity of clinical signs of the subject’s psoriasis vulgaris.
The extent of psoriatic involvement was recorded for each of the three areas (arms, trunk and
legs) using the following scale:
0 = no involvement
1 = <10%
2 = 10-29%
3 = 30-49%
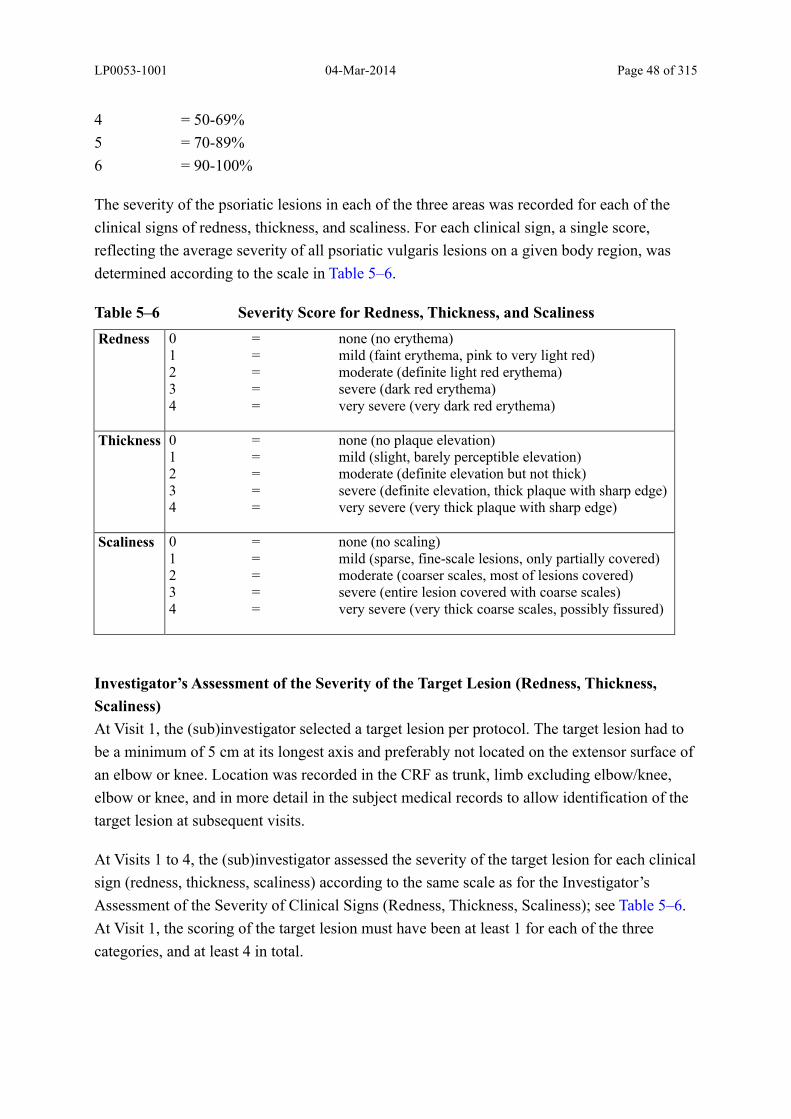
LP0053-1001 04-Mar-2014 Page 48 of 315
4 = 50-69%
5 = 70-89%
6 = 90-100%
The severity of the psoriatic lesions in each of the three areas was recorded for each of the
clinical signs of redness, thickness, and scaliness. For each clinical sign, a single score,
reflecting the average severity of all psoriatic vulgaris lesions on a given body region, was
determined according to the scale in Table 5–6.
Table 5–6 Severity Score for Redness, Thickness, and Scaliness
Redness 0 = none (no erythema)1 = mild (faint erythema, pink to very light red)2 = moderate (definite light red erythema)3 = severe (dark red erythema)4 = very severe (very dark red erythema)
Thickness 0 = none (no plaque elevation)1 = mild (slight, barely perceptible elevation)2 = moderate (definite elevation but not thick)3 = severe (definite elevation, thick plaque with sharp edge)4 = very severe (very thick plaque with sharp edge)
Scaliness 0 = none (no scaling)1 = mild (sparse, fine-scale lesions, only partially covered)2 = moderate (coarser scales, most of lesions covered)3 = severe (entire lesion covered with coarse scales)4 = very severe (very thick coarse scales, possibly fissured)
Investigator’s Assessment of the Severity of the Target Lesion (Redness, Thickness,
Scaliness)
At Visit 1, the (sub)investigator selected a target lesion per protocol. The target lesion had to
be a minimum of 5 cm at its longest axis and preferably not located on the extensor surface of
an elbow or knee. Location was recorded in the CRF as trunk, limb excluding elbow/knee,
elbow or knee, and in more detail in the subject medical records to allow identification of the
target lesion at subsequent visits.
At Visits 1 to 4, the (sub)investigator assessed the severity of the target lesion for each clinical
sign (redness, thickness, scaliness) according to the same scale as for the Investigator’s
Assessment of the Severity of Clinical Signs (Redness, Thickness, Scaliness); see Table 5–6.
At Visit 1, the scoring of the target lesion must have been at least 1 for each of the three
categories, and at least 4 in total.

LP0053-1001 04-Mar-2014 Page 49 of 315
Investigator’s Assessment of the Body Surface Area (BSA) Involvement of Psoriasis
Vulgaris on Trunk and Limbs
At all treatment phase visits (Visit 1 to Visit 4) the (sub)investigator assessed the extent of the
subject’s psoriatic involvement on the trunk and limbs. The total psoriatic involvement on the
trunk and limbs (excluding skin folds and genitals) was recorded as a percentage of the total
BSA, estimating that the surface of the subject’s full, flat palm (including the five digits)
correlated to approximately 1% of the total BSA. The purpose was to obtain an estimate of the
area on the trunk and limbs to be treated with investigational product for each subject.
5.5.3.2 Subject Assessments
The subject’s assessments were to be made prior to the investigator’s assessments.
Patient’s Global Assessment of Disease Severity (PaGA)
This assessment was made at all treatment visits (Visit 1 to Visit 4) based on the condition of
the disease at the time of the evaluation and not in relation to the condition at a previous visit,
by use of the 5-point scale presented in Table 5–7. The (sub)investigator explained the
categories of the scale to the subject and the subject told the (sub)investigator which category
to mark.
Table 5–7 Patient’s Global Assessment of Disease Severity – 5-point Scale
Assessment Severity of symptomsClear No psoriasis symptoms/signs at all
Very mild Very slight psoriasis symptoms/signs, does not interfere with daily lifeMild Slight psoriasis symptoms/signs, interferes with daily life only occasionallyModerate Definite psoriasis symptoms/signs, interferes with daily life frequentlySevere Intense psoriasis symptoms/signs, interferes or restricts daily life very
frequently
Subject’s Assessment of Itch by Use of a Visual Analogue Scale (VAS)
This assessment was made by the subject at baseline (Day 0; Visit 1), Day 3, Day 5, Week 1,
Week 2, and Week 4 by means of a subject diary. A VAS was used to assess itch using a
horizontal line. The line represented the range of itch severity, from 0 mm (no itch at all) at
one end to 100 mm (worst itch you can imagine) at the other. Subjects were asked to rate the
maximal intensity of itch during the last 24 hours, by putting a single vertical line across the
horizontal line at the spot he/she felt best reflected this.
Subject’s Assessment of Itch-Related Sleep Loss by Use of a Visual Analogue Scale (VAS)
This assessment was made by the subject at baseline (Day 0; Visit 1), Day 3, Day 5, Week 1,
Week 2, and Week 4 by means of a subject diary. A VAS was used to assess itch-related sleep
LP0053-1001 04-Mar-2014 Page 50 of 315
loss using a horizontal line. The line represented the range of sleep loss, from 0 mm (no sleep
loss at all) at one end to 100 mm (worst possible sleep loss). Subjects were asked to rate the
itch-related sleep loss during the preceding night, by putting a single vertical line across the
horizontal line at the spot he/she felt best reflected this.
Quality of Life Assessments
The subject’s assessments of quality of life were assessed by means of the generic EQ-5D-5L
questionnaire which is a standardised instrument for use as a measure of health outcome and
the DLQI which is a validated dermatology specific questionnaire. EQ-5D-5L was assessed at
Visit 1 and at Visit 4 or the last on-treatment visit, as applicable. DLQI was assessed at all
treatment phase visits (Visit 1 to Visit 4). The questionnaires were completed by the subject
while at the investigator site, and before the subject was assessed by the (sub)investigator.
5.5.3.3 Imaging Assessments
Clinical Photography
At designated centres, clinical photographs were planned to be taken in approximately 100
subjects for whom specific consent had been obtained. If a subject at one of the designated
centres wished to take part in the trial, but consent had not been provided to allow the extra
photographic procedure, the subject was still invited to take part in the trial without having
photographs taken (i.e. having these photographs taken was entirely voluntary).
Photographs were taken of the psoriasis lesions affecting the trunk and/or limbs only and the
images were only to be used as supportive data to the clinical assessments (i.e. no
adjudication of images or statistical analysis).
Image requirements:
Full body, anterior (excluding the head)
Full body, posterior (excluding the head)
Target lesion on the trunk or limbs
The target lesion used for clinical photography had to be the same as that selected for the
investigator’s assessment of the severity of the target lesion (redness, thickness, scaliness).
The location of the target lesion was recorded by means of a visual representation in the
source records.
The exact specifications of the images to be taken were stated in a clinical photography
manual. All imaging assessments were made with standardised equipment and methodolo-
LP0053-1001 04-Mar-2014 Page 51 of 315
gies with use of appropriate software and methods of data transfer which in no way revealed
the identity of the subject.
Full body images (anterior and posterior) were taken at Visit 1. Target lesions images were
taken at Visits 1, 2, and 4.
Subjects consented that LEO would be allowed to use the photographs obtained from this trial
in publications intended for scientific, marketing and training purposes. Subject
confidentiality will be maintained at all times. The informed consent form is provided in
Appendix 1.1.
5.5.4 Safety Measurements Assessed
5.5.4.1 Local Safety and Tolerability
The assessment of local safety and tolerability consisted of signs assessed by the
(sub)investigator and symptoms reported by the subject.
At Visits 1 to 4, the (sub)investigator assessed application site reactions for the following
signs: perilesional erythema, perilesional oedema, perilesional dryness, and perilesional
erosion. The subject assessed the symptoms of application site burning or pain.
For perilesional erythema, oedema, dryness and erosion, the area for the (sub)investigator to
assess was the perilesional area, defined as the band of skin within two (2) cm from the border
of the psoriatic lesion, i.e. not the lesion itself, at any given time. The assessed signs had to be
present in this area, but could extend beyond it in a continuous manner.
The area for the subject to assess application site burning or pain was the lesional and
perilesional area. The reported symptoms had to be present in this area, but could extend
beyond it in a continuous manner.
For each sign and symptom the highest (worst) skin reaction score across all treatment areas
was coded by use of the 4-point scale presented in Table 5–8 and Table 5–9.

LP0053-1001 04-Mar-2014 Page 52 of 315
Table 5–8 Investigator Assessment of Skin Reaction Score
0 = absent 1 = mild 2 = moderate 3 = severe
Perilesional erythema: No perilesional erythema
Slight, barely perceptible perilesional erythema
Distinct perilesional erythema
Marked, intense perilesional erythema
Perilesional oedema: No perilesional oedema
Slight, barely perceptible perilesional oedema
Distinct perilesional oedema
Marked, intense perilesional oedema
Perilesional dryness: No perilesional dryness
Slight, barely perceptible perilesional dryness
Distinct perilesional dryness
Marked, intense perilesional dryness
Perilesional erosion: No perilesional erosion
Slight, barely perceptible perilesional erosion
Distinct perilesional erosion
Marked, intense perilesional erosion
Table 5–9 Subject Assessment of Skin Reaction Score
0 = absent 1 = mild 2 = moderate 3 = severe
Application site burning or pain:
No burning or pain after application
Slight, barely perceptible burning or pain after application
Distinct burning or pain after application
Marked, intense burning or pain after application
The (sub)investigator explained the categories of the scale to the subject and the subject told
the (sub)investigator which category to mark.
5.5.4.2 Laboratory Analysis
Samples of blood and urine were taken for analysis as scheduled in the flowchart (Table 5–3)
or on withdrawal from or early completion of the treatment phase.
A urine pregnancy test was performed at Visit 1 prior to randomisation and at the last on-
treatment visit (Visit 4 unless early withdrawal) in female subjects of child-bearing potential.
The test kits were provided by the central laboratory. All other laboratory analyses were
performed centrally.
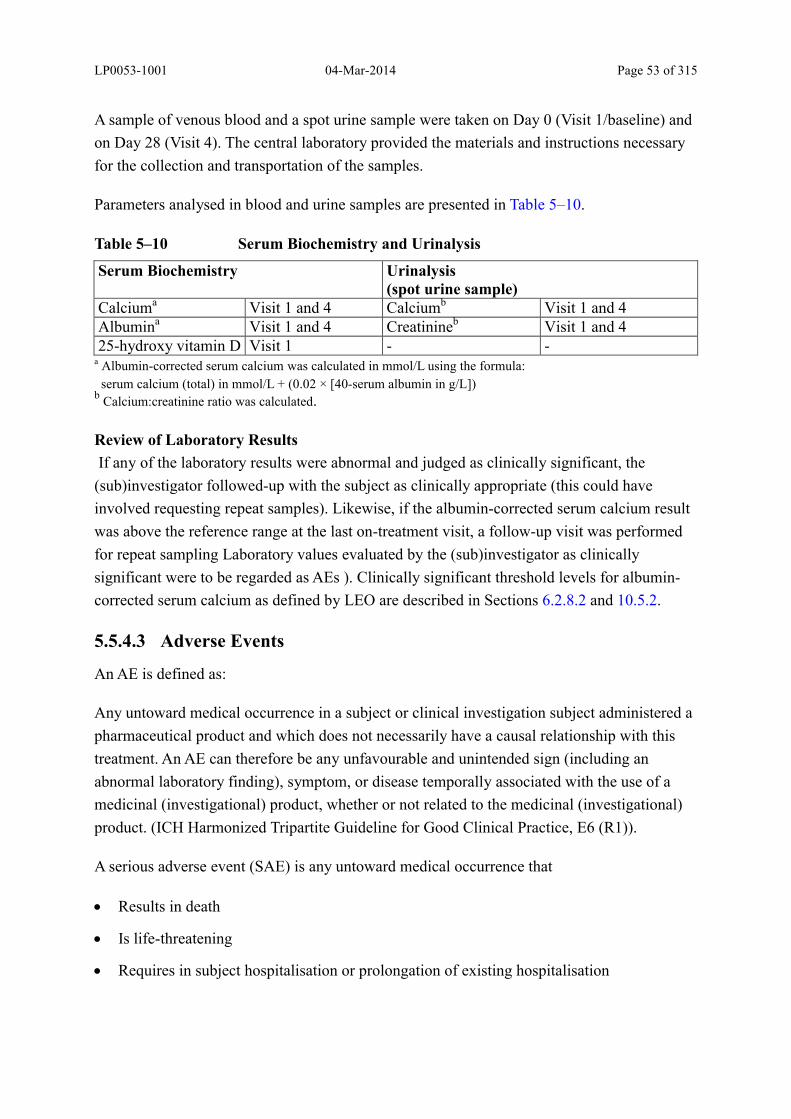
LP0053-1001 04-Mar-2014 Page 53 of 315
A sample of venous blood and a spot urine sample were taken on Day 0 (Visit 1/baseline) and
on Day 28 (Visit 4). The central laboratory provided the materials and instructions necessary
for the collection and transportation of the samples.
Parameters analysed in blood and urine samples are presented in Table 5–10.
Table 5–10 Serum Biochemistry and Urinalysis
Serum Biochemistry Urinalysis(spot urine sample)
Calciuma Visit 1 and 4 Calciumb Visit 1 and 4Albumina Visit 1 and 4 Creatinineb Visit 1 and 425-hydroxy vitamin D Visit 1 - -
a Albumin-corrected serum calcium was calculated in mmol/L using the formula:
serum calcium (total) in mmol/L + (0.02 × [40-serum albumin in g/L])b
Calcium:creatinine ratio was calculated.
Review of Laboratory Results
If any of the laboratory results were abnormal and judged as clinically significant, the
(sub)investigator followed-up with the subject as clinically appropriate (this could have
involved requesting repeat samples). Likewise, if the albumin-corrected serum calcium result
was above the reference range at the last on-treatment visit, a follow-up visit was performed
for repeat sampling Laboratory values evaluated by the (sub)investigator as clinically
significant were to be regarded as AEs ). Clinically significant threshold levels for albumin-
corrected serum calcium as defined by LEO are described in Sections 6.2.8.2 and 10.5.2.
5.5.4.3 Adverse Events
An AE is defined as:
Any untoward medical occurrence in a subject or clinical investigation subject administered a
pharmaceutical product and which does not necessarily have a causal relationship with this
treatment. An AE can therefore be any unfavourable and unintended sign (including an
abnormal laboratory finding), symptom, or disease temporally associated with the use of a
medicinal (investigational) product, whether or not related to the medicinal (investigational)
product. (ICH Harmonized Tripartite Guideline for Good Clinical Practice, E6 (R1)).
A serious adverse event (SAE) is any untoward medical occurrence that
Results in death
Is life-threatening
Requires in subject hospitalisation or prolongation of existing hospitalisation

LP0053-1001 04-Mar-2014 Page 54 of 315
Results in persistent or significant disability/incapacity
Is a congenital anomaly/birth defect
or
Other medically important conditions*)
*) Events that may not be immediately life-threatening or result in death or hospitalisation but
may jeopardise the subject or may require intervention to prevent one of the other out-comes
listed in the definition above. Examples of such events are allergic bronchospasm, blood
dyscrasias and convulsions.
Global Pharmacovigilance, LEO was responsible for the assessment of expectedness
according to LEO procedures. The relevant reference document for this clinical trial was the
Investigator’s Brochure for LEO 90100, edition 3 and subsequent updates as agreed between
the head of the Medical Department and the medical director, Global Pharmacovigilance,
LEO.
At all visits, the subject was asked a non-leading question by the investigator: “How have you
felt since I saw you last?” No specific symptoms were asked for.
If there were no AEs to record, no further questions were asked and “NO” was stated. In case
there were one or more AEs to record, “YES” was stated and the investigator recorded the
event term, intensity, duration, suspected causal relationship to the investigational product and
outcome.
The investigator also observed the subject for any changes not reported by the subject and
recorded these changes.
All treated lesions were examined by the investigator for any signs of AEs.
Only medically qualified personnel assessed AEs.
5.5.4.4 Reporting of Adverse Events
Events reported by the subject or observed by the (sub)investigator and that fell into any of
the above definitions were to be recorded on the AE page of the CRF and were described in
the following manner:
The nature of the event was described in precise English medical terminology (i.e. not
necessarily the exact words used by the subject). Whenever possible, a specific diagnosis was
to be stated (e.g. allergic contact dermatitis).
LP0053-1001 04-Mar-2014 Page 55 of 315
For cutaneous AEs the location had to be part of the AE description and was described using
the following terminology:
Lesional/perilesional (≤2 cm from the border of lesion(s) treated with investigational
product)
or
Distant (>2 cm from the lesion border)
The intensity of the event was described in terms of mild, moderate or severe according to the
investigator’s clinical judgement.
Mild: The AE does not interfere in a significant manner with the subject’s normal
functioning level and requires no medical intervention.
Moderate: The AE interferes with the subject’s normal functioning level and may or may
not require medical intervention.
Severe: The AE produces significant impairment of the subject’s functioning or requires
medical intervention.
The duration of the event was reported as the start date and stop date of the event.
The causal relation of the event to the use of the investigational product was described in
terms of probable, possible, not related or not assessable according to the following:
Probably related
Follows a reasonable temporal sequence from administration of the investigational
product
Could not be reasonably explained by the subject’s clinical state, environmental or toxic
factors or other therapies administered to the subject
Follows a known pattern of response to the investigational product
Disappears or decreases on cessation or reduction in dose of the investigational product
Reappears or worsens upon re-challenge
Possibly related
Follows a reasonable temporal sequence from administration of the investigational
product
LP0053-1001 04-Mar-2014 Page 56 of 315
Could also be reasonably explained by the subject’s clinical state, environmental or toxic
factors or other therapies administered to the subject
Follows a known pattern of response to the investigational product
Not related
Does not follow a reasonable temporal sequence from administration of the
investigational product
Is better explained by other factors like the subject’s clinical state, environmental or toxic
factors or other therapies administered to the subject
Does not follow a known pattern of response to the investigational product
Not assessable
The AE cannot yet be judged otherwise because present information is in-sufficient or
contradictory. A final assessment (i.e. probably, possibly or not related) shall be made as
more information becomes available, at the latest when the subject has completed the trial.
The outcome of the event was classified and handled as follows:
Recovered/resolved The event has stopped. The stop date of the event
must be recorded
Recovering/resolving The subject is clearly recovering from an event. The
event is, however, not yet completely resolved.
Follow-up on the event is required until final
outcome is established
Not recovered/not resolved Event is still on-going. Follow-up on the event is
required until final outcome is established
Recovered with sequelae The event has reached a state where no further
changes are expected and the residual symptoms are
assumed to persist. An example is hemiparesis after
stroke. The stop date of the event must be recorded
Fatal The subject has died as a consequence of the event.
Date of death is recorded as stop date for the AE
LP0053-1001 04-Mar-2014 Page 57 of 315
Unknown Unknown to investigator, e.g. subject lost to follow-
up
Once a subject completed the clinical trial, the investigator followed up for outcome on all
non-serious AEs classified as possibly/probably related to the investigational product or not
assessable until last follow-up visit or until final outcome was determined, whichever came
first.
5.5.4.5 Other Events to be Reported
Pregnancy
Pregnancy that occurred during the clinical trial was to be reported to LEO within 24 hours of
first knowledge using the (paper) LEO Pregnancy Follow-Up form Part I supplied by LEO.
Follow-up on pregnancy outcome was to be reported on the LEO Pregnancy Follow-Up form
Part II. All pregnancies were to be followed to delivery or termination. The completed LEO
Pregnancy Follow-Up form was to be reported to LEO and TKL in the same manner as an
SAE (see Section 5.5.4.3).
Overdose
Any overdose defined as any higher dose than prescribed for the individual subject was to be
reported on the AE form of the CRF book. AEs originating after the overdose were to be
documented on a separate line.
Aggravation of Condition
Any clinically significant aggravation/exacerbation/worsening of the initially treated
condition compared with baseline, judged by an overall medical assessment, was to be
reported as an AE.
5.5.4.6 Serious Adverse Events
Reporting of Serious Adverse Events
Any SAE, related or unrelated to the investigational product or any trial procedure after
signature of the Informed Consent Form, was reported to LEO on the (paper) Serious Adverse
Event Form – Clinical Trial within 24 hours.
Note: Planned hospitalisation or planned prolonged hospitalisation does not fulfil the criteria
for being an SAE. The elective nature of the event had to be clearly documented in the
subject’s medical record.
SAEs were reported on the AE form of the CRF book. Additionally reports were made using
the paper Serious Adverse Event Form – Clinical Trial, supplied by LEO. Apart from the

LP0053-1001 04-Mar-2014 Page 58 of 315
assessment of the intensity, causal relationship to the investigational product(s) and/or trial
procedures, the action taken and the outcome to date, this report contained a comprehensive
narrative description of the course of the event.
The completed Serious Adverse Event Form – Clinical Trial was faxed or scanned and
emailed to both LEO and TKL Research as specified in the clinical study protocol (Appendix
1.1).
All other relevant reports of diagnostic procedures, hospital records, autopsy reports etc. were
also forwarded, as applicable or upon request from Global Pharmacovigilance.
The IRBs, regulatory authorities, and concerned investigators were notified of SAEs
according to current regulation and local requirements.
All suspected, unexpected serious adverse reactions (SUSARs) were subject to expedited
reporting to regulatory authorities. Global Pharmacovigilance was to unblind such cases prior
to reporting. Investigators would remain blinded.
SAEs were followed indefinitely until a final outcome was established, i.e. the follow-up
could continue beyond the end of the clinical trial.
SAEs occurring after completion of the trial were not routinely sought or collected beyond the
last follow-up visit. However, if reported, such cases were to be regarded as expedited for
reporting purposes for other trial case reports. Therefore, a causality assessment and
determination of expectedness were made to determine whether or not expedited reporting
was required.
5.5.4.7 Vital Signs
Vital signs were evaluated at Visit 1 (Week 0) and at Visit 4 (Week 4).
5.5.5 Appropriateness of Measurements
The efficacy measures used in this trial (IGA, PASI) are standard in clinical trials of psoriasis.
The 5-point scale used for the IGA was developed in consultation (pre-IND meeting) with the
FDA. The DLQI is a validated dermatology specific questionnaire which measures specific
factors influencing the quality of life for subjects with skin disease. The generic EQ-5D-5L
questionnaire is a standardised instrument for use as a measure of health outcome. A VAS is a
commonly used method to quantify pruritus. All safety measures used in this trial were also
standard.
LP0053-1001 04-Mar-2014 Page 59 of 315
5.6 Endpoints/Response Criteria
5.6.1 Efficacy Evaluation
5.6.1.1 Primary Endpoint
The primary endpoint was subjects with ‘treatment success’ (‘clear’ or ‘almost clear’ for
subjects with at least moderate disease at baseline, ‘clear’ for subjects with mild disease at
baseline) according to the IGA at Week 4.
5.6.1.2 Secondary Endpoints
The secondary endpoints were
m-PASI at Week 4
m-PASI at Week 1
m-PASI was calculated using the formula given below based on the investigator’s assessment
of the extent and severity of the disease locally (trunk, arms, legs) (22).
Arms 0.2 (R + T + S)E = X
Trunk 0.3 (R + T + S)E = Y
Legs 0.4 (R + T + S)E = Z
where: R = score for redness; T = score for thickness; S = score for scaliness; E = score for
extent
Trunk and limbs: The sum of X + Y + Z gives the m-PASI, which can range from 0 to 64.8.
5.6.1.3 Additional (Tertiary) Endpoints
Investigator’s Assessments
Subjects achieving ‘treatment success’ (‘clear’ or ‘almost clear’ for subjects with at least
moderate disease at baseline, ‘clear’ for subjects with mild disease at baseline) according
to the IGA at Week 1 and Week 2
IGA at Week 1, Week 2, and Week 4
m-PASI at Week 2
Subjects achieving PASI-75 (at least 75% reduction in m- PASI from baseline) at Week 1,
Week 2, and Week 4
LP0053-1001 04-Mar-2014 Page 60 of 315
Subjects achieving PASI-50 (at least 50% reduction in m-PASI from baseline) at Week 1,
Week 2, and Week 4
Change in BSA involvement from baseline (Day 0; Visit 1) to Week 1, Week 2, and Week
4
Subject’s Assessments
Subjects achieving ‘treatment success’ (‘clear’ or ‘very mild’) according to the PaGA at
Week 1, Week 2, and Week 4
PaGA at Week 1, Week 2, and Week 4
Change in itch as assessed by VAS from baseline (Day 0; Visit 1) to Day 3, Day 5, Week
1, Week 2, and Week 4
Severity of itch as assessed by VAS at baseline (Day 0; Visit 1), Day 3, Day 5, Week 1,
Week 2, and Week 4
Change in itch-related sleep loss as assessed by VAS at baseline (Day 0; Visit 1) to Day 3,
Day 5, Week 1, Week 2, and Week 4
Change in DLQI from baseline (Day 0; Visit 1) to Week 1, Week 2 and Week 4
EQ-5D-5L; The five dimensions in the descriptive system at baseline (Day 0; Visit 1) and
Week 4 and the score according to EQ VAS at baseline (Day 0; Visit 1) and Week 4
5.6.2 Safety Evaluation
The evaluation of safety was based on the following parameters:
Any reported AE
Any reported ADR
Change in albumin-corrected serum calcium from baseline to Week 4
Change in urine calcium:creatinine ratio from baseline to Week 4
5.6.3 Evaluation of Other Observations
Reason for withdrawal from the trial
Change in vital signs (blood pressure, heart rate) from baseline to Week 4
Local safety and tolerability parameters.
Weight of investigational product used
LP0053-1001 04-Mar-2014 Page 61 of 315
Compliance with treatment instructions (treatment application missed)
5.7 Data Quality and Assurance
LEO has implemented a system of quality assurance, including all the elements described in
this report. Within this system company SOPs are implemented to ensure that clinical trials
are conducted in compliance with regulatory requirements and GCP. Quality control is
applied to each stage of data handling to ensure that data are accurate, reliable and processed
correctly.
Trial sites, facilities, laboratories and all data (including sources) and documentation were
available for GCP audit by LEO or inspection by competent authorities.
For this trial, two site audits were conducted. The audit certificates are provided in Appendix
1.8.
Training of Site Staff
LEO held a 2 day investigator meeting just prior to the start of the trial to familiarise the
investigators and other trial site personnel with the trial protocol and to provide training on
the clincial assessments, procedures, and GCP, if required. Additionally, an initiation visit was
performed in person for all sites. For those few sites that were unable to attend the
investigator meeting, the same training materials as used at the investigator meeting were
delivered with a LEO representative present to ensure adequate and consistent training across
sites.
Trial Monitoring
As sponsor of this clinical trial, LEO was responsible for assuring the proper conduct of the
clinical trial with regard to protocol adherence and validity of the data recorded in the CRFs.
Monitors were assigned to serve as the principal link between (sub)investigators and LEO and
advise the investigator on the collection and maintenance of accurate, complete, legible, well
organised and easily retrievable data for the clinical trial. In addition, they explained any
aspect of the (conduct of the) clinical trial to the investigators, including interpretation of the
protocol, the purpose of collecting the specified data and reporting responsibilities.
Case Report Forms
An electronic data capture system was used in this trial. Data were captured onto source
documents and were entered into the electronic data capture system by staff at the clinical
sites. Following data entry, the data were 100% monitored. Queries for discrepant data were
generated automatically by the system upon entry or generated manually by the monitor or the
trial data manager. All queries, whether generated by the system or by a user, were in an
LP0053-1001 04-Mar-2014 Page 62 of 315
electronic format. This systematic process ensured that a clean and consistent database was
provided prior to the statistical analysis being performed.
Following all data validation steps, the investigator, or designee, electronically signed each
eCRF prior to database lock. For archiving purposes each investigator was supplied with a
copy of the eCRFs, for all subjects enrolled at the trial site, via an electronic medium at
completion of the trial. Audit trail information was included. CRFs were available for
inspection by authorised representatives from LEO (e.g. audit by the quality assurance
department), from regulatory authorities and/or IRBs.
Data Handling
Subject data were entered into the eCRF by authorised site staff in a timely manner. Data were
entered by site staff and systematic data validation was performed through the discrepancy
management system within the data collection software.
For subject reported data captured via a subject diary (i.e. compliance data and VAS scores for
itch and itch-related sleep loss assessments) the diary was considered the source document.
The data were transcribed into the eCRF and handled as described above.
5.8 Changes to the Conduct of the Trial
Protocol Amendments
An amendment to the clinical study protocol was issued on the 12-Sep-2013 to specify
additional details regarding the handling of missing values and the methodology for multiple
imputation analysis. In addition, the protocol amendment updated the administrative
information on the sponsor’s responsible medical expert. The consolidated clinical study
protocol dated 12-Sep-2013 implemented the above changes (see Appendix 1.1). The protocol
amendment is also enclosed in Appendix 1.1.
Note on the Size of the Photography Cohort
The clinical study protocol required that 100 subjects were included in the photographic
cohort. Images were therefore not mandatory and could be performed as an assessment at
designated centres. It was identified during the trial that the proportion of subjects consenting
to the additional photographic images was lower than the expected rate. Actions were taken to
increase the number of subjects in the photo cohort, however, the overall subject recruitment
increased as an unintended consequence. The trial completed with 426 subjects randomised
representing an increase in the population by 6.5%. The number of subjects in the
photographic cohort ended on 73.
Protocol deviations are addressed in Sections 7.2 and 7.3.3.

LP0053-1001 04-Mar-2014 Page 63 of 315
6 Statistical Methods
6.1 Determination of Sample Size
In total, 400 subjects were planned to be randomised in a 3:1 ratio, i.e. 300 subjects in the
LEO 90100 treatment group and 100 in the vehicle group.
In clinical terms the hypothesis was as follows: LEO 90100 is superior to vehicle with respect
to the proportion of subjects achieving ‘treatment success’ according to the IGA.
The sample size calculation in the trial was based on the response rates obtained from 2
completed phase 2 trials with LEO 90100 in subjects with at least mild disease severity at
baseline. The percentage of subjects having ‘controlled disease/ treatment success’ at Week 4
according to the IGA was approximately 45% and 55% in the LEO 90100 group (18,19) and
8% in the vehicle group (19). The sample size calculation assumed that the true percentages
of subjects with ‘controlled disease/treatment success’ were the same as the observed
percentages in the phase 2 trials mentioned above and a two-tailed Fisher’s exact test was
used at a 5% significance level.
With 300 subjects in the LEO 90100 group and 100 subjects in the vehicle group, the Fisher's
exact test would have at least 95% power to reject the null hypothesis of no difference
between the two treatment groups regarding the primary endpoint.
The sample size calculations were carried out using Proc Power in SAS®, version 9.2.
6.2 Statistical and Analytical Plan
6.2.1 Summary
Overall, the statistical analyses were performed as outlined in the consolidated clinical study
protocol (Appendix 1.1). The applied statistical analyses are further detailed in the statistical
analysis plan update (SAPU) (Appendix 1.9), and relevant information therefrom is included
in the following sections. The SAPU was finalised before unblinding of the trial, but after a
blind review of the data.
6.2.2 General Principles
All significance tests were two-sided and all confidence intervals were presented with 95%
degree of confidence.
Each centre was planned to recruit a minimum of 10 subjects. Centres recruiting fewer than
16 subjects were pooled with one or more other centres to form a pooled centre of 16 or more
LP0053-1001 04-Mar-2014 Page 64 of 315
randomised subjects. Where possible, centres were pooled in order of geographical proximity.
No centre was allowed to recruit more than 50 subjects (approximately 12.5% of the total
sample size). The pooling of centres is detailed in the SAPU (Appendix 1.9).
An observed cases approach was used for tabulations of data by visit (i.e. involving only
those subjects who attended each specific visit).
6.2.3 Subject Qualification for Analysis
The statistical analysis was planned in the clinical study protocol (Appendix 1.1) and further
detailed in the SAPU (Appendix 1.9).
All enrolled subjects, defined as having signed the informed consent form and with a subject
number assigned, were accounted for. All randomised subjects were included in the full
analysis set and analysed for efficacy.
A per protocol analysis set was defined by excluding subjects from the full analysis set who
received no treatment with trial medication, who provided no efficacy data following start of
treatment, who were known to have taken the wrong investigational product throughout the
treatment phase of the trial and/or who did not fulfill the disease defining inclusion criteria
(i.e. inclusion criteria No. 7, 8, 9, 10, and 11; see Section 5.3.1). Further exclusion of subjects
or subject data were decided upon after a blind review of the data, reviewing all the remaining
in- and exclusion criteria, but focusing on concomitant medication that could affect psoriasis
and also considering compliance/adherence and violations of visit windows.
A safety analysis set was defined by excluding subjects from the full analysis set who
received no treatment with investigational product and for whom data on the presence or
confirmed absence of AEs were not available.
The decisions regarding inclusion/exclusion of subjects and/or subject data from the trial
analysis sets were documented in the SAPU before breaking the randomisation code.
6.2.4 Reasons for Leaving the Trial
The reasons for leaving the trial were presented for all randomised subjects, by last visit
attended, and by treatment group.
6.2.5 Demographics and Baseline Characteristics
Descriptive statistics of demographics (age, sex, race, ethnicity, and skin type) and other
baseline characteristics were presented for all randomised subjects and by treatment group.
Age, sex, ethnicity, race, and baseline IGA by treatment were also presented by centre.

LP0053-1001 04-Mar-2014 Page 65 of 315
Other baseline characteristics were weight, height, BMI, vital signs, duration of psoriasis,
other location(s) of psoriasis, concurrent diagnoses, concomitant medication(s), previous
psoriasis treatment(s), IGA, m-PASI (calculated from the investigator’s assessment of extent
and severity of clinical signs), and the investigator’s assessment of BSA involvement of
psoriasis vulgaris.
Categorical data were summarised using the number and percentage of subjects in each
category and treatment group. Continuous data were summarised using the mean, median,
standard deviation (SD), minimum, and maximum values.
6.2.6 Treatment Compliance and Extent of Exposure
Weight of Trial Medication Used
As described in Section 5.4.7, the average weight of 10 cans was used as an estimate of the
known filled weight for each can. For each subject, the weight of investigational product used
for a particular visit interval was determined by calculating the difference between the weight
of a set of full cans dispensed and the weight of the returned cans multiplied by the correction
factor 0.41 to subtract the propellant gasses.
If any subjects received investigational product cans for a particular visit interval, but did not
return them all, then the amount of investigational product used for that visit interval was not
calculated. If cans were not dispensed, they would not contribute to the weight of
investigational product used for that visit interval. If any cans were returned with their seal
unbroken, the weight of investigational product used from that can was assigned a value of
zero. If a returned can weighed more than the estimated mean weight of a full can, it was
assumed that zero grams were used.
The average weekly amount of investigational product used was calculated for each subject as
the amount of investigational product used for a particular visit interval, divided by the
duration (days) of the visit interval and then multiplied by 7. The amount and the average
weekly amount of investigational product used was summarised using mean, SD, median,
minimum, and maximum values for each treatment group.
If a subject used investigational product from the same kit over several visit intervals (for
example due to a missed visit) the amount of investigational product used over the total trial
period was still calculated, provided all cans were returned non-empty. The amount used
during the visit interval before and after the missed visit was not calculated as it could not be
determined.
LP0053-1001 04-Mar-2014 Page 66 of 315
Compliance with Treatment Instructions
Compliance with treatment instructions was summarised for each treatment group for all
randomised subjects. The percentage of missed applications for each visit interval (Visit 1 to
Visit 2, Visit 2 to Visit 3, and Visit 3 to Visit 4) was calculated as follows: the number of
applications of investigational product missed for a particular visit interval was divided by the
total number of days for the visit interval and multiplied by 100 to give a percentage.
The percentage of missed applications for the total treatment period was calculated as
follows: the total number of applications of investigational product missed between Visit 1
and the last on-treatment visit was divided by the total number of days between Visit 1 and the
last on-treatment visit and multiplied by 100 to give a percentage.
The percentage of missed applications was allocated to one of the following categories:
≤10%, >10% to ≤20%, >20% to ≤30%, >30% to ≤40%, >40% to ≤50%, and >50%.
Extent of Exposure
The duration of exposure to treatment was calculated as the number of days from Visit 1 to
the date of last application of investigational product. If this date was missing, the date of the
last visit (excluding follow-up visit) was used. If the subject only attended Visit 1, the
duration of exposure was set at one day.
The duration of exposure (weeks) was summarised using the mean, SD, median, minimum,
and maximum values. The extent of exposure was summarised as subject-treatment-weeks.
6.2.7 Analysis of Efficacy
The statistical analysis of efficacy was based on the defined endpoints (see Section 5.6.1).
6.2.7.1 Primary Endpoint
The primary endpoint was analysed for the full analysis set and the per protocol analysis set.
The analysis for the full analysis set was regarded as primary while the analysis for the per
protocol analysis set was supportive.
The number and proportion of subjects who achieved ‘treatment success’ according to the
IGA at Week 4 was tabulated for each treatment group and also presented for each centre by
treatment group.
Multiple imputation of IGA values was carried out as detailed in the protocol and described in
Section 6.2.7.4. For each imputated dataset, the odds ratio of ‘treatment success’ at Week 4 for
LEO 90100 relative to vehicle was estimated by calculating the Mantel-Haenszel odds ratio
LP0053-1001 04-Mar-2014 Page 67 of 315
adjusted for pooled centres and its 95% confidence interval. For combined inference using
Rubin’s pooling methodology (24) a log transformation was applied to the estimated odds
ratio, and the standard error of the transformed estimate was obtained from the log-
transformed lower and upper confidence limits for the odds ratio estimate as (log(upper)-
log(lower))/(2*1.96). Combined inference for the log transformed odds ratio was obtained
using SAS® PROC MIANALYZE and the combined estimate was back-transformed to the
original scale.
For each of the imputed datasets, the Breslow-Day chi-square statistic for testing
homogeneity of odds ratios across pooled centres was calculated and the multiple chi-square
statistics were combined into an overall p-value using the approach of Li et al. (25). If
significant at a 10% significance level; a sensitivity analysis was performed to identify
possible extreme centres, omitting centres with the smallest and highest odds ratios,
respectively. To investigate centre-to-centre variability, the primary efficacy criterion was
tabulated by (unpooled) centre.
6.2.7.2 Secondary Endpoints
The secondary endpoints were analysed for the full analysis set.
The investigator’s assessment of extent and severity of clinical signs was converted to an
m-PASI score.
Multiple imputation of m-PASI values was carried out as detailed in the protocol and
described in Section 6.2.7.4. Combined inference was obtained using Rubin’s methodology
(24). The secondary endpoints m-PASI at Week 4 and m-PASI at Week 1 were tested
sequentially, as the treatments initially first were compared at Week 4. Only if a statistically
significant result (p< 0.05) was obtained were the treatments compared at Week 1. For both
endpoints, LEO 90100 and vehicle were compared using an analysis of variance (ANOVA)
including (pooled) centre, treatment and baseline m-PASI in the model. The adjusted
difference between LEO 90100 and vehicle and the corresponding p-value as well as a 95%
confidence interval were calculated.
To investigate centre-to-centre variability, the secondary efficacy criteria were tabulated by
(unpooled) centre.
The m-PASI at each visit was summarised for each treatment group.
The principal investigator from one site confirmed by signature of a protocol deviation that
that the extent scores for the m-PASI assessment might not have been conducted as per
LP0053-1001 04-Mar-2014 Page 68 of 315
protocol at this site (Section 7.2). Consequently, sensitivity analyses excluding this site were
conducted for all PASI endpoints. For these sensitivity analyses, separate multiple imputation
datasets were generated excluding data from the site.
6.2.7.3 Further (Tertiary) Endpoints
6.2.7.3.1 Investigator’s Assessments
Investigator’s Global Assessment of Disease Severity (IGA)
The number and proportion of subjects who achieved ‘treatment success’ according to the
IGA at all visits were tabulated for each treatment group.
The number and proportion of subjects in each of the 5 categories (‘clear’ to ‘severe’) were
tabulated for each of the treatments, pooling all centres. These tabulations were intended for
descriptive purposes only and no statistical analyses of these data were undertaken.
PASI-50 and PASI-75
The number and proportion of subjects who achieved at least a 50% reduction in m-PASI
from baseline (PASI-50) were tabulated at each visit for each treatment group. The number
and proportion of subjects who achieved at least a 75% reduction in m-PASI from baseline
(PASI-75) were presented similarly.
The odds ratio of proportion of PASI-50 at Week 4 for LEO 90100 relative to vehicle was
estimated using the Cochran-Mantel-Haenszel method adjusting for (pooled) centre. The odds
ratio of proportion of PASI-75 at Week 4 for LEO 90100 relative to vehicle was estimated
similarly.
Investigator’s Assessment of Severity of the Target Lesion
The severity of clinical signs of the target lesion (redness, thickness, scaliness) was tabulated
by visit. These tabulations were intended for descriptive purposes only and no statistical
analyses of these data were undertaken.
Change in BSA Involvement from Baseline (Day 0; Visit 1) to Week 1, Week 2, and Week
4
The change in BSA involvement from baseline to each visit was summarised for each
treatment group. These tabulations were intended for descriptive purposes only and no statisti-
cal analyses of these data were undertaken.
LP0053-1001 04-Mar-2014 Page 69 of 315
6.2.7.3.2 Subject’s Assessments
For the analysis of the subject reported assessments described below no adjustments of p-
values for multiplicity were done.
Patient’s Global Assessment of Disease Severity (PaGA)
The number and proportion of subjects in each of the five categories (‘clear’ to ‘severe’) were
tabulated at each visit for each treatment group.
The number and proportion of subjects who achieved ‘treatment success’ according to the
PaGA at Week 1, Week 2, and Week 4 were tabulated for each treatment. The proportion of
subjects achieving ‘treatment success’ at week 4 was analysed similarly to analyses conducted
for PASI-50.
Subject’s Assessment of Itch by Use of a Visual Analogue Scale
The change in the VAS from baseline to each visit was summarised for each treatment group.
For the change in the VAS from baseline to Day 3, Day 5, Week 1, Week 2, and Week 4, the
LEO 90100 and the vehicle arms were compared using ANOVA including (pooled) centre,
treatment and baseline VAS score in the model. For the adjusted difference of LEO 90100 to
vehicle, the corresponding p-value as well as a 95% confidence interval was calculated for
each week.
The proportion of subjects who achieved at least a 50% itch reduction from baseline in the
VAS was tabulated by time-point and compared between treatment groups at each time-point
using the Cochran-Mantel-Haenszel method adjusting for (pooled) centre. The number of
subjects who achieved at least a 70% reduction was analysed similarly.
Subject’s Assessment of Itch-Related Sleep Loss by Use of a Visual Analogue Scale
The change in the VAS from baseline to each visit was summarised for each treatment group.
For the change in the VAS from baseline to Day 3, Day 5, Week 1, Week 2, and Week 4, the
LEO 90100 and the vehicle arms were compared using ANOVA including (pooled) centre,
treatment and baseline VAS score in the model. For the adjusted difference of LEO 90100 to
vehicle, the corresponding p-value as well as a 95% confidence interval was calculated for
each week.
The proportion of subjects who achieved at least a 50% reduction in itch-related sleep loss
from baseline in the VAS was tabulated by time-point and compared between treatment
groups at each time-point using the Cochran-Mantel-Haenszel method adjusting for (pooled)
centre. The number of subjects who achieved at least a 70% reduction was analysed similarly.
LP0053-1001 04-Mar-2014 Page 70 of 315
Subjects with no itch at baseline were excluded from these responder analyses of itch and
itch-related sleep loss.
Change in DLQI from Baseline (Day 0; Visit 1) to Week 1, Week 2 and Week 4
The change in DLQI score from baseline was analysed as the analysis of subject’s assessment
of itch.
Change in EQ-5D-5L from Baseline (Day 0; Visit 1) to Week 4
For each dimension, the number and proportion of subjects in each of the five categories
(scored as 1 to 5) were tabulated at baseline and Week 4 for each treatment group.
For each EQ-5D-5L dimension, the distribution of subjects in the 5 categories at Week 4 was
compared between treatment groups using a proportional odds model.
The change in EQ-5D-5L index score from baseline to Week 4 was calculated and analysed as
the analysis of subject’s assessment of itch.
The EQ VAS scores were summarised by visit and treatment group. The change in EQ VAS
from baseline to Week 4 was analysed as subject’s assessment of itch.
6.2.7.4 Handling of Drop-outs and Missing Values
Missing values for the primary and secondary endpoints were handled using a multiple
imputation method. The imputation method relied on an assumption that the missing data
were missing at random, i.e. that the probability that an observation was missing could
depend on observed data but was unrelated to the data not observed. Missing values for IGA
were imputed sequentially for Visits 2, 3, and 4 from an ordinal logistic regression model
using the IGA values at the previous visits, treatment group and (pooled) centre as covariates.
The outcome "treatment success" was derived from the imputed IGA values. Missing values
for m-PASI were imputed sequentially for Visits 2, 3 and 4 from a linear regression model
using the values of m-PASI at the previous visits, treatment group and (pooled) centre as
covariates.
Sensitivity analyses of the method of handling missing data were performed. As a sensitivity
analysis not relying on the missing at random (MAR) assumption, control-based pattern
imputation was used, i.e. a multiple imputation procedure where the imputation model was
estimated using data from vehicle treated subjects only (23). Also last observation carried
forward (LOCF), non-responder imputation and a complete case analysis were performed as
sensitivity analyses. For the non-responder imputation sensitivity analysis, missing values
LP0053-1001 04-Mar-2014 Page 71 of 315
were imputed as no treatment success for the IGA endpoint and imputed as the baseline m-
PASI value for the m-PASI endpoints.
If a monotone missing pattern did not exist (i.e. one or more subjects with missing data at
intermediate visits), data at intermediate visits were imputed using the Markov Chain Monte
Carlo (MCMC) method as implemented in SAS® PROC MI including treatment arm effect
and outcome at Visits 1 to 4 as continuous variables. For the IGA outcome, the MCMC
imputed missing values were rounded to nearest integer between 0 and 4. For the m-PASI
outcome, any negative MCMC imputed values were set to 0, and values above 64.8 were set
at 64.8. For each MCMC imputed dataset with monotone missingness structure, the remaining
data were imputed following the methods described above. For the control-based pattern
imputation, the imputation was performed in separate steps for each visit following the
method described in (23). In the final imputed datasets, any negative m-PASI values were set
to 0 and m-PASI values above 64.8 were set to 64.8.
For the primary endpoint, imputation was based on an ordinal logistic regression model.
Convergence of the models used for imputation was examined at each visit by fitting the
logistic model based on observed data with IGA at the current visit as outcome variable and
IGA at previous visits, treatment group and pooled site as covariates. Based on blinded data,
no convergence problems were seen when fitting these models using any random treatment
assignment as replacement for the unknown treatment group variable. The convergence
including actual treatment assignment as a covariate was confirmed after unblinding. For the
control-based pattern imputation sensitivity analysis, the imputation model was fit based on
vehicle treated subjects only, which may cause convergence problems due to increased
sparseness of the data. If convergence problems were seen, IGA values at one or more visits
were collapsed to the extent necessary to obtain model convergence.
After unblinding note: To obtain model convergence for the control-based pattern imputation
sensitivity analysis, IGA categories ‘moderate’ and ‘severe’ were collapsed at Visit 1 and Visit
2, and the ‘clear’, ‘almost clear’ and ‘mild’ categories were collapsed at Visit 2 for the
purpose of this analysis. Also pooled site was not used as an explanatory variable in the
imputation model for the control-based pattern imputation.
For PASI-50 and PASI-75, missing values were handled using multiple imputation. The
imputed PASI datasets were the same as those used for the analysis of the secondary
endpoints.
For the remaining endpoints (PaGA and quality of life), an observed cases approach was used.
LP0053-1001 04-Mar-2014 Page 72 of 315
For subjects withdrawing at Visit 2 or Visit 3 EQ-5D-5L data, laboratory data, and vital signs
from the last visit (if available) were presented together with Visit 4 data since these
assessments were not planned to be recorded at Visit 2 and Visit 3.
There were no attended visits with missing values of the primary and/or secondary endpoints.
Hence, the extent of missing values for the primary endpoint was 14/426=3.3% corresponding
to 14 withdrawn subjects, and the extent of missing values for the secondary endpoints were
8/426=1.9% (Week 1) and 14/426=3.3% (Week 4).
6.2.8 Analysis of Safety
The analysis of safety was based on the safety analysis set.
6.2.8.1 Adverse Events
Adverse events (AEs) were coded during the course of the trial in accordance with the current
version of the Medical Dictionary for Regulatory Activities (MedDRA) dictionary. The AEs
were presented by preferred terms and primary system organ class (SOC).
All AEs recorded during the course of the trial were included in the subject data listings. An
event was considered emergent with the trial treatment if started after the first application or if
started before the first application (applicable if subject had a wash-out) and worsened in
intensity after. One AE (abdominal discomfort, subject No. ) started before
randomisation and was excluded from tabulations. Two AEs (subject No. , contact
dermatitis, subject No. , psoriasis flare) started after Visit 4, but were included in
tabulations.
An overall summary table was prepared to show the number of subjects with any AEs, ADRs,
SAEs, AEs leading to withdrawal from the trial, AEs leading to discontinuation of treatment,
and/or lesional/perilesional AEs.
The number of subjects experiencing any type of AE (according to MedDRA Preferred Term
within primary SOC) was tabulated by treatment group regardless of the number of times
each AE was reported by each subject. The percentage of subjects with AEs was compared
between treatment groups by a chi-square test or Fisher’s exact test.
The intensity for each type of AE (according to the preferred term) was tabulated by treatment
group. If there were several recordings of intensity for a given type of AE (according to the
Preferred Term), intensity was taken as the most severe recording for that AE.
LP0053-1001 04-Mar-2014 Page 73 of 315
The causal relationship to investigational product for each type of AEs (according to the
coding system) was tabulated by treatment group. If there were several recordings of causal
relationship to investigational product for a given type of AE (according to the coding
system), causal relationship was taken as the worst recording from the last report of that AE,
since that is when the investigator was in possession of the most information and so was best
able to judge causal relationship.
ADRs were defined as AEs for which the investigator had not described the causal
relationship to trial medication as ‘not related’. The number of subjects who experienced each
type of ADR (according to the preferred term) was tabulated regardless of the number of
times each ADR was reported by each subject. The percentage of subjects with ADRs was
compared between treatment groups by a chi-square test or Fisher’s exact test.
Finally, tabulations by preferred term and SOC were given for SAEs, AEs leading to
withdrawal from the trial, AEs leading to discontinuation of treatment and
lesional/perilesional AEs.
6.2.8.2 Laboratory Safety Examinations
Biochemistry
The change in albumin-corrected serum calcium from baseline to Week 4 was summarised for
each treatment group.
The albumin-corrected serum calcium was classified as ‘low’, ‘normal’ or ‘high’, depending
on whether the value was below, within or above the reference range, respectively. A shift
table was produced showing the categories at baseline against those at Week 4. Subjects with
albumin-corrected serum calcium outside the reference range were listed. Laboratory
reference ranges are provided in Appendix 2.8 Listing 8-1.
Additionally a shift table as described above was produced based on LEO defined clinically
significant values. The low and high threshold level for concern for a clinically significant
change for albumin-corrected serum calcium was <2.0 mmol/L and >2.9 mmol/L,
respectively.
The Vitamin D level was classified as ‘low’, ‘normal’ or ‘high’, depending on whether the
value was below, within or above the reference range, respectively, at Visit 1.
Urinalysis
The change in the urinary calcium:creatinine ratio from baseline to Week 4 was summarised
for each treatment group.

LP0053-1001 04-Mar-2014 Page 74 of 315
The calcium:creatinine ratio was classified as ‘low’, ‘normal’ or ‘high’, depending on whether
the value was below, within or above the reference range, respectively. A shift table was
produced showing the categories at baseline against those at Week 4. Subjects with
calcium:creatinine ratio outside the reference range were listed. Laboratory reference ranges
are provided in Appendix 2.8 Listing 8-1.
6.2.8.3 Vital Signs
The change in vital signs (blood pressure, heart rate) from baseline to Week 4 was
summarised as mean, SD, median, minimum, and maximum values for each treatment group.
6.2.8.4 Evaluation of Local Safety and Tolerability
The five assessments of local safety and tolerability were summarised and presented
graphically for each treatment group as categorical data at all visits for the safety analysis set.
6.3 Changes to the Statistical Analysis Plan
There were no changes to the planned statistical analyses described in the clinical study
protocol (Appendix 1.1) and in the SAPU (Appendix 1.9).
6.4 Software and Dictionaries
SAS ® version 9.3 was used to create listings, tables, and figures, and for power calculations
and statistical analyses.
MedDRA version 16.0 was used for coding of AEs and medical history.
WHO-DD version 1.Q13 was used for coding concomitant medication.
LP0053-1001 04-Mar-2014 Page 75 of 315
7 Trial Population
7.1 Disposition of Subjects
In total, 491 subjects from 27 centres in the USA were enrolled into the trial (i.e., informed
consent form signed and subject number assigned) ((End-of-Text [EoT] Table 1-3). The first
subject was enrolled on 17-Jun-2013 and the last subject completed the trial (last visit) on 02-
Oct-2013.
All 491 subjects were screened, among whom 65 were screening failures. The most common
reasons for failing screening were not fulfilling inclusion criteria No. 7, 8, 9, and 11 (i.e,
criteria related to the required disease severity in terms of % BSA, IGA and m-PASI; see
Appendix 2.2 Listing 1-1). The remaining 426 subjects were randomised; 323 to LEO 90100
and 103 to vehicle (EoT Table 1-1).
In total, 14 of the randomised subjects withdrew from the trial and 412 (97%) subjects
completed the trial. The most common reason for withdrawal was ‘lost to follow-up’
(8 subjects).
The number of subjects who attended each visit is shown in Figure 7–1 and are presented by
treatment group in Figure 7–2 and Figure 7–3.
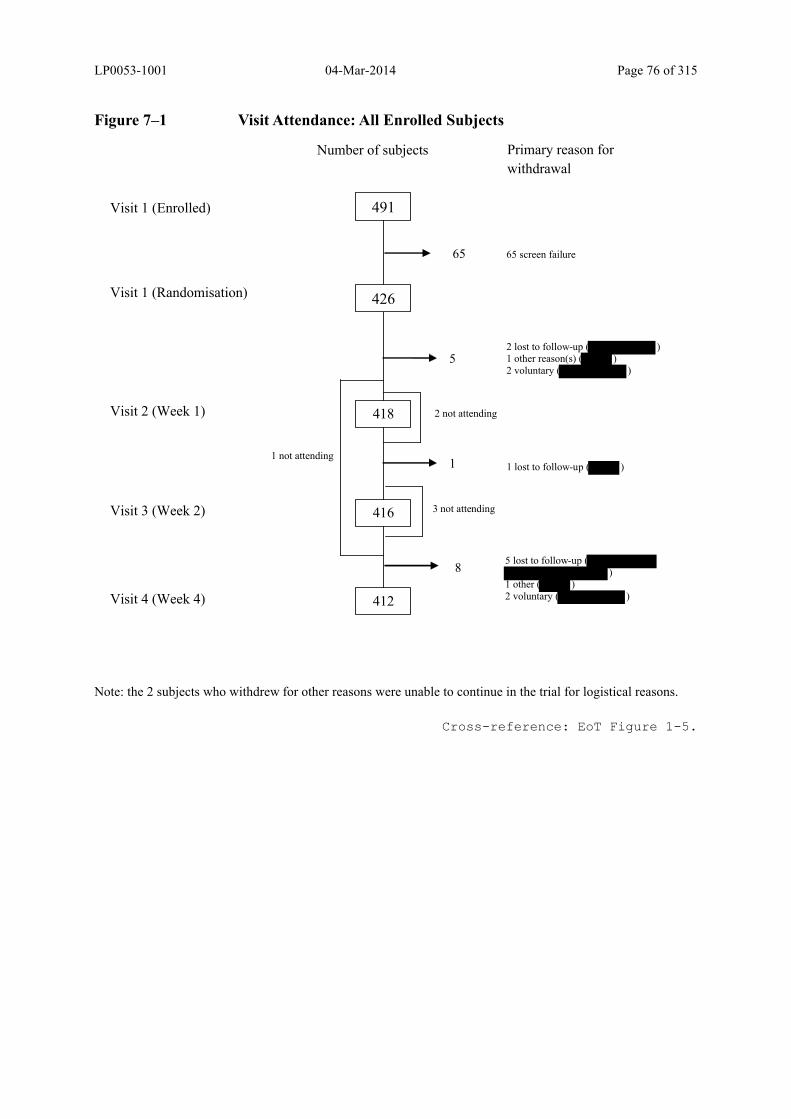
LP0053-1001 04-Mar-2014 Page 76 of 315
Figure 7–1 Visit Attendance: All Enrolled Subjects
Note: the 2 subjects who withdrew for other reasons were unable to continue in the trial for logistical reasons.
Cross-reference: EoT Figure 1-5.
418
416
412
5
1
Number of subjects
65
3 not attending
Primary reason for
withdrawal
Visit 1 (Randomisation)
Visit 1 (Enrolled)
Visit 2 (Week 1)
Visit 3 (Week 2)
Visit 4 (Week 4)
2 lost to follow-up ( )1 other reason(s) ( )2 voluntary ( )
426
491
8
1 lost to follow-up ( )
5 lost to follow-up ( )
1 other ( )2 voluntary ( )
1 not attending
2 not attending
65 screen failure
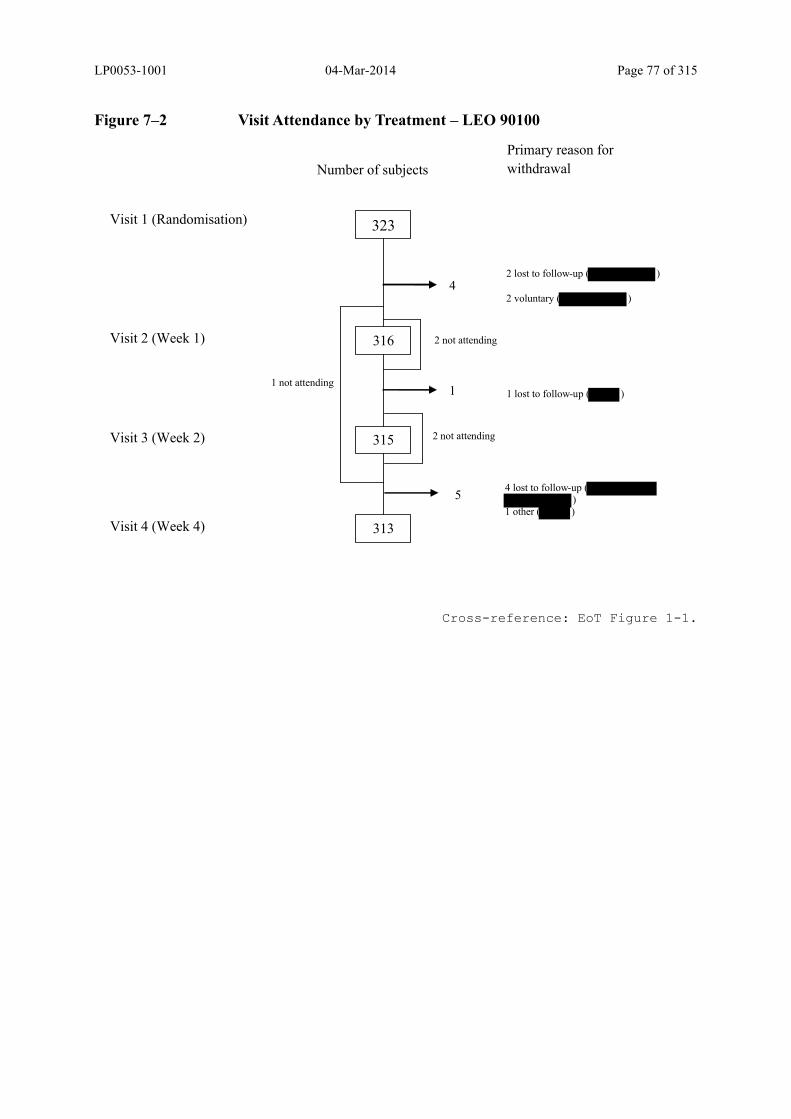
LP0053-1001 04-Mar-2014 Page 77 of 315
Figure 7–2 Visit Attendance by Treatment – LEO 90100
Cross-reference: EoT Figure 1-1.
316
315
313
4
1
Number of subjects
2 not attending
Primary reason for
withdrawal
Visit 1 (Randomisation)
Visit 2 (Week 1)
Visit 3 (Week 2)
Visit 4 (Week 4)
2 lost to follow-up ( )
2 voluntary ( )
323
5
1 lost to follow-up ( )
4 lost to follow-up ( )
1 other ( )
1 not attending
2 not attending
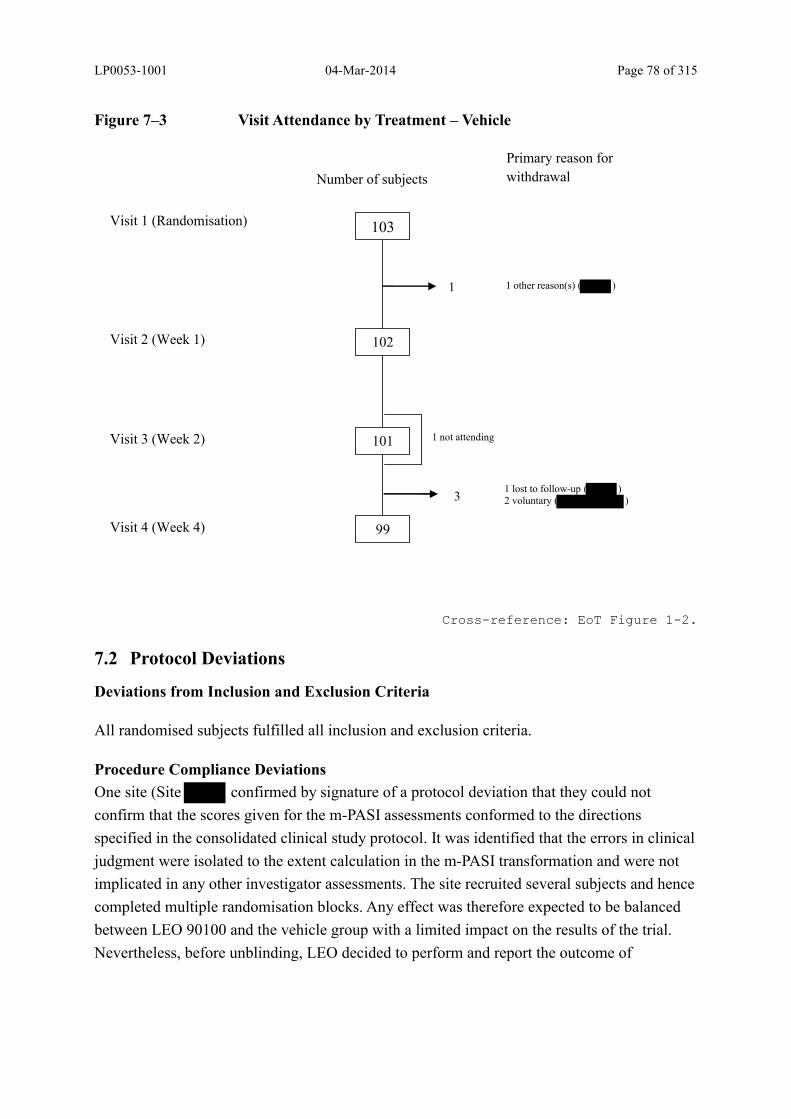
LP0053-1001 04-Mar-2014 Page 78 of 315
Figure 7–3 Visit Attendance by Treatment – Vehicle
Cross-reference: EoT Figure 1-2.
7.2 Protocol Deviations
Deviations from Inclusion and Exclusion Criteria
All randomised subjects fulfilled all inclusion and exclusion criteria.
Procedure Compliance Deviations
One site (Site confirmed by signature of a protocol deviation that they could not
confirm that the scores given for the m-PASI assessments conformed to the directions
specified in the consolidated clinical study protocol. It was identified that the errors in clinical
judgment were isolated to the extent calculation in the m-PASI transformation and were not
implicated in any other investigator assessments. The site recruited several subjects and hence
completed multiple randomisation blocks. Any effect was therefore expected to be balanced
between LEO 90100 and the vehicle group with a limited impact on the results of the trial.
Nevertheless, before unblinding, LEO decided to perform and report the outcome of
102
101
99
1
Number of subjects
1 not attending
Primary reason for
withdrawal
Visit 1 (Randomisation)
Visit 2 (Week 1)
Visit 3 (Week 2)
Visit 4 (Week 4)
1 other reason(s) ( )
103
31 lost to follow-up ( )2 voluntary ( )

LP0053-1001 04-Mar-2014 Page 79 of 315
sensitivity analyses excluding Site for all PASI endpoints as described in Section
6.2.7.2 and in the SAPU.
In total, 7 subjects were dispensed incorrect kits in error. For each of these subjects it was
determined after unblinding whether the dispensed kit contained the correct treatment (i.e. the
treatment the subject was randomised to). If not, the subject was to be excluded from the per
protocol analysis set (see Section 7.3.3).
In total, 8 subjects missed more than 7 treatment applications (corresponding to 25% of all
planned applications). For 7 subjects, these applications were all missed due to approved stop
(i.e. clearance). The last subject missed 8 applications, but exceeded also the allowed visit
window of 5 days for Visit 4 and was therefore excluded from the per protocol analysis set
(Section 7.3.3).
Additional protocol deviations in this trial were 14 subjects who did not attend Visit 4, 1
subject who received treatment with methylprednisolone from Day 8 to Day 12, and 12
subjects who attended Visit 4 more than 5 days after the scheduled visit date.
Important protocol deviations related to procedure compliance that led to exclusion from the
per protocol analysis set were identified for 28 subjects (see EoT Table 1-4 and Section 7.3.3)
For information regarding the criteria for exclusion of subjects from the per protocol analysis
set, see Section 7.3.3.
Protocol deviations are listed in Appendix 2.2 and are also detailed in the SAPU (Appendix
1.9).
7.3 Trial Analysis Sets
The analysis sets were determined based on the criteria defined in Section 6.2.3, according to
the consolidated clinical study protocol (Appendix 1.1) and the SAPU (Appendix 1.9). All
decisions on the inclusion and exclusion of subjects from analyses were made while the data
were still blinded.
7.3.1 Full Analysis Set
All 426 randomised subjects were included in the full analysis set.
7.3.2 Safety Analysis Set
All 426 randomised subjects received treatment with investigational product, had presence or
confirmed absence of AEs, and were therefore included in the safety analysis set.
LP0053-1001 04-Mar-2014 Page 80 of 315
7.3.3 Per Protocol Analysis Set
The per protocol analysis set was defined by excluding subjects from the full analysis set who
Provided no efficacy data following start of treatment
Received no treatment with investigational product
Took the wrong investigational product during the treatment phase of the trial
Did not fulfil the disease defining inclusion criteria (i.e. inclusion criteria 7, 8, 9, 10 and
11; see Section 5.3.1)
Violated Visit 4 (Day 28) extended visit window of +/- 5 days
Did not attend Visit 4
Missed more than 25% of applications of investigational product on the trunk/limbs
Received concomitant medication that could affect psoriasis
In total, 28 subjects were excluded from the per protocol analysis set for the reasons stated
above and were distributed as follows:
14 subjects who did not attend Visit 4
1 subject who received treatment with methylprednisolone from Day 8 to Day 12
12 subjects who attended Visit 4 more than 5 days after the scheduled visit date
1 subject who was dispensed an incorrect kit in error. The subject was randomised to
LEO 90100, but received vehicle at Visit 1. The subject received treatment according to
the randomisation at Visit 2 and Visit 3 and except for the per protocol analysis where the
subject was excluded, all data from this subject was analysed according to the
randomisation.
The per protocol analysis set thus comprised 398 subjects.
Individual data on subjects excluded from the analysis sets are listed in Appendix 2.3 Listing
3-1 and the reasons for exclusions from analysis sets are presented in Appendix 2.3 Listing 3-
2.
The number of subjects in the trials analysis sets is presented by treatment in Figure 7–4 and
Figure 7–5.
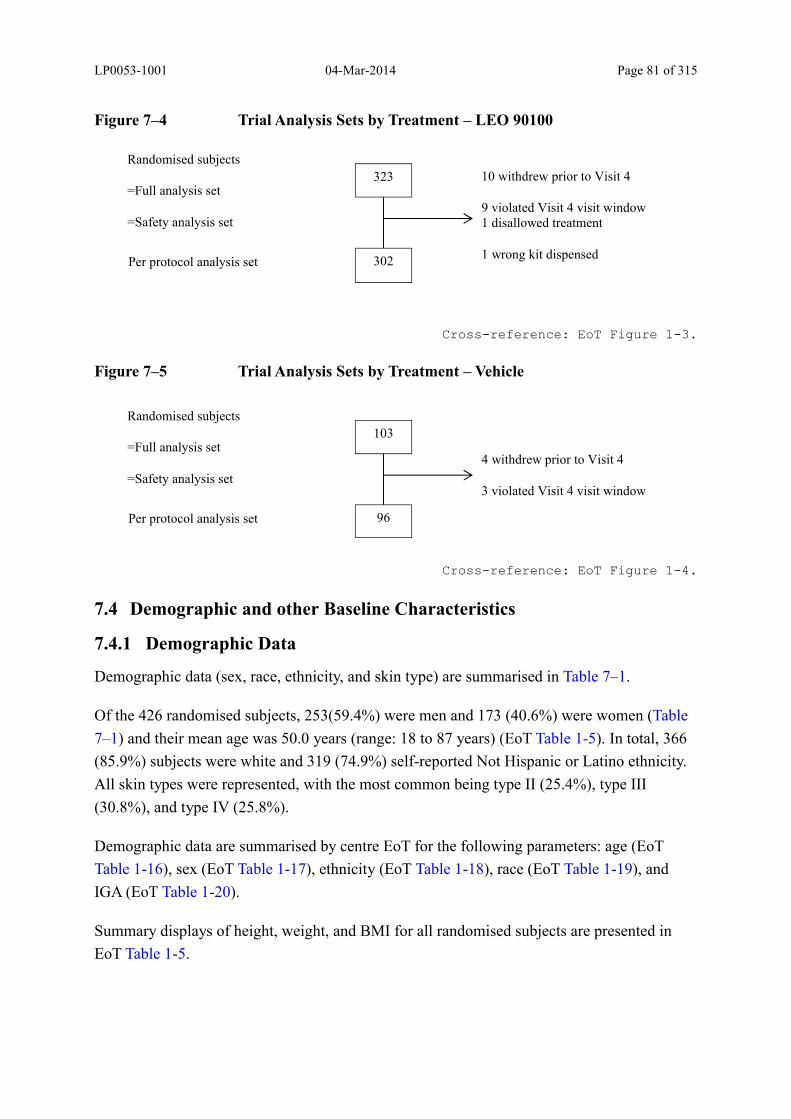
LP0053-1001 04-Mar-2014 Page 81 of 315
Figure 7–4 Trial Analysis Sets by Treatment – LEO 90100
Cross-reference: EoT Figure 1-3.
Figure 7–5 Trial Analysis Sets by Treatment – Vehicle
Cross-reference: EoT Figure 1-4.
7.4 Demographic and other Baseline Characteristics
7.4.1 Demographic Data
Demographic data (sex, race, ethnicity, and skin type) are summarised in Table 7–1.
Of the 426 randomised subjects, 253(59.4%) were men and 173 (40.6%) were women (Table
7–1) and their mean age was 50.0 years (range: 18 to 87 years) (EoT Table 1-5). In total, 366
(85.9%) subjects were white and 319 (74.9%) self-reported Not Hispanic or Latino ethnicity.
All skin types were represented, with the most common being type II (25.4%), type III
(30.8%), and type IV (25.8%).
Demographic data are summarised by centre EoT for the following parameters: age (EoT
Table 1-16), sex (EoT Table 1-17), ethnicity (EoT Table 1-18), race (EoT Table 1-19), and
IGA (EoT Table 1-20).
Summary displays of height, weight, and BMI for all randomised subjects are presented in
EoT Table 1-5.
Randomised subjects
=Full analysis set
=Safety analysis set
Per protocol analysis set
10 withdrew prior to Visit 4
9 violated Visit 4 visit window1 disallowed treatment
1 wrong kit dispensed302
323
Randomised subjects
=Full analysis set
=Safety analysis set
Per protocol analysis set
4 withdrew prior to Visit 4
3 violated Visit 4 visit window
96
103
LP0053-1001 04-Mar-2014 Page 82 of 315
Individual subject demographic, both disease-related and other baseline data, are enclosed in
Appendix 2.4.
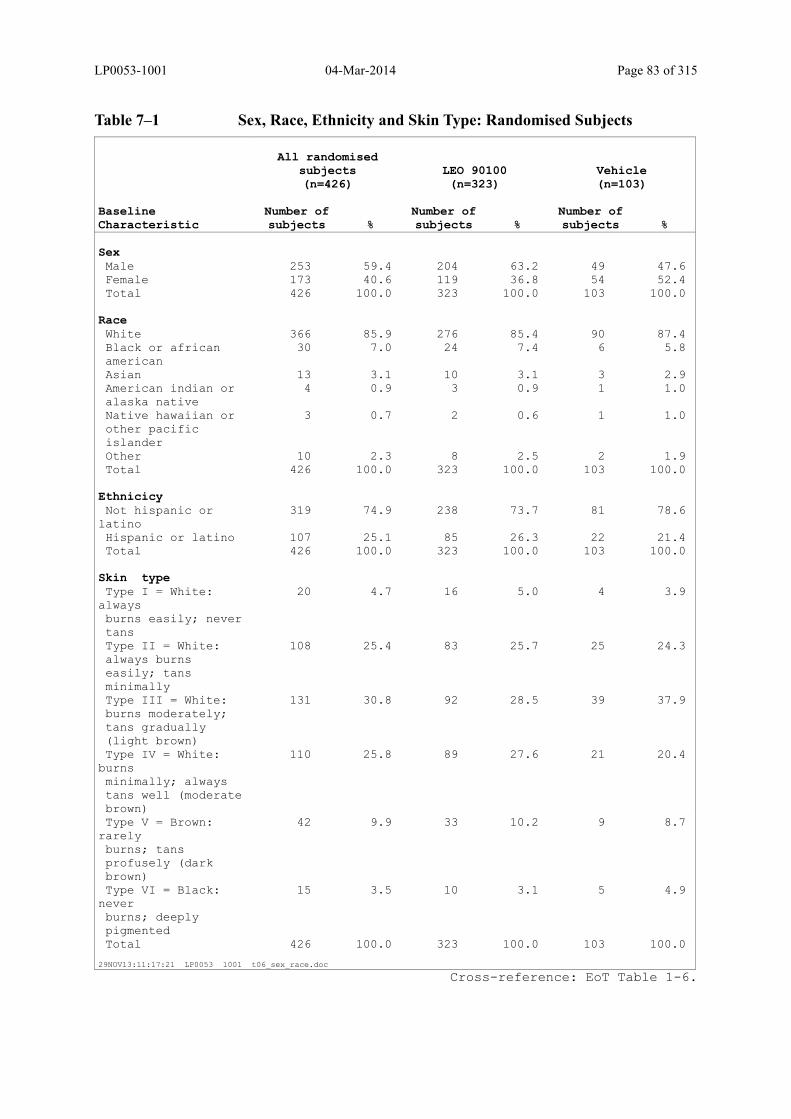
LP0053-1001 04-Mar-2014 Page 83 of 315
Table 7–1 Sex, Race, Ethnicity and Skin Type: Randomised Subjects
All randomised subjects(n=426)
LEO 90100(n=323)
Vehicle(n=103)
Baseline Characteristic
Number of subjects %
Number of subjects %
Number of subjects %
SexMale 253 59.4 204 63.2 49 47.6 Female 173 40.6 119 36.8 54 52.4 Total 426 100.0 323 100.0 103 100.0
RaceWhite 366 85.9 276 85.4 90 87.4 Black or african american
30 7.0 24 7.4 6 5.8
Asian 13 3.1 10 3.1 3 2.9 American indian or alaska native
4 0.9 3 0.9 1 1.0
Native hawaiian or other pacificislander
3 0.7 2 0.6 1 1.0
Other 10 2.3 8 2.5 2 1.9 Total 426 100.0 323 100.0 103 100.0
EthnicicyNot hispanic or
latino 319 74.9 238 73.7 81 78.6
Hispanic or latino 107 25.1 85 26.3 22 21.4 Total 426 100.0 323 100.0 103 100.0
Skin typeType I = White:
always burns easily; nevertans
20 4.7 16 5.0 4 3.9
Type II = White: always burnseasily; tansminimally
108 25.4 83 25.7 25 24.3
Type III = White: burns moderately;tans gradually(light brown)
131 30.8 92 28.5 39 37.9
Type IV = White: burns minimally; alwaystans well (moderatebrown)
110 25.8 89 27.6 21 20.4
Type V = Brown: rarely burns; tansprofusely (darkbrown)
42 9.9 33 10.2 9 8.7
Type VI = Black: never burns; deeplypigmented
15 3.5 10 3.1 5 4.9
Total 426 100.0 323 100.0 103 100.0
29NOV13:11:17:21 LP0053 1001 t06_sex_race.doc
Cross-reference: EoT Table 1-6.

LP0053-1001 04-Mar-2014 Page 84 of 315
7.4.2 Disease-Related Baseline Characteristics
The key disease-related baseline characteristics are summarised in Table 7–2 to Table 7–6.
Overall, disease-related characteristics at baseline were in line with the targeted trial
population. All subjects fulfilled eligibility requirements to a minimum duration of psoriasis
vulgaris of 6 months (range: 1-67 years), a BSA of 2 to 30% (range: 2-30%), an IGA of at
least ‘mild’ in severity, and an m-PASI score of at least 2 (range 2-47).
At baseline, the IGA of the psoriasis vulgaris on the trunk and limbs was ‘moderate’ in the
majority of subjects (74.9%), while 15.3% and 9.9%, respectively, had ‘mild’ and ‘severe’
disease (Table 7–3). Baseline IGA scores were comparable between treatment groups.
The assessment of the extent of psoriasis on other locations included the scalp (51.4% of
subjects), the nails (26.8%), the skin folds (25.6%), the face (23.2%), and the genitals (16.0%)
(Table 7–4). In total, 87.6% of subjects had previously received treatment for their psoriasis,
most frequently with topical corticosteroids (75.1% of subjects) (Table 7–5), none of which
had been used within 2 weeks prior to randomisation.
The majority of target lesions were located on the limbs (67.4%) and the trunk (20.7%), while
only a minority was located on the elbow (8.2%) or knee (3.8%) (Table 7–6).
Levels of 25-hydroxy vitamin D at baseline were ‘low’ in 311 (73.5%) and ‘normal’ in 112
(26.5%) of subjects, with no noteworthy differences between treatment groups (EoT Table 1-
14).
There were no clinically relevant observations with regard to vital signs at baseline (EoT
Table 1-15).
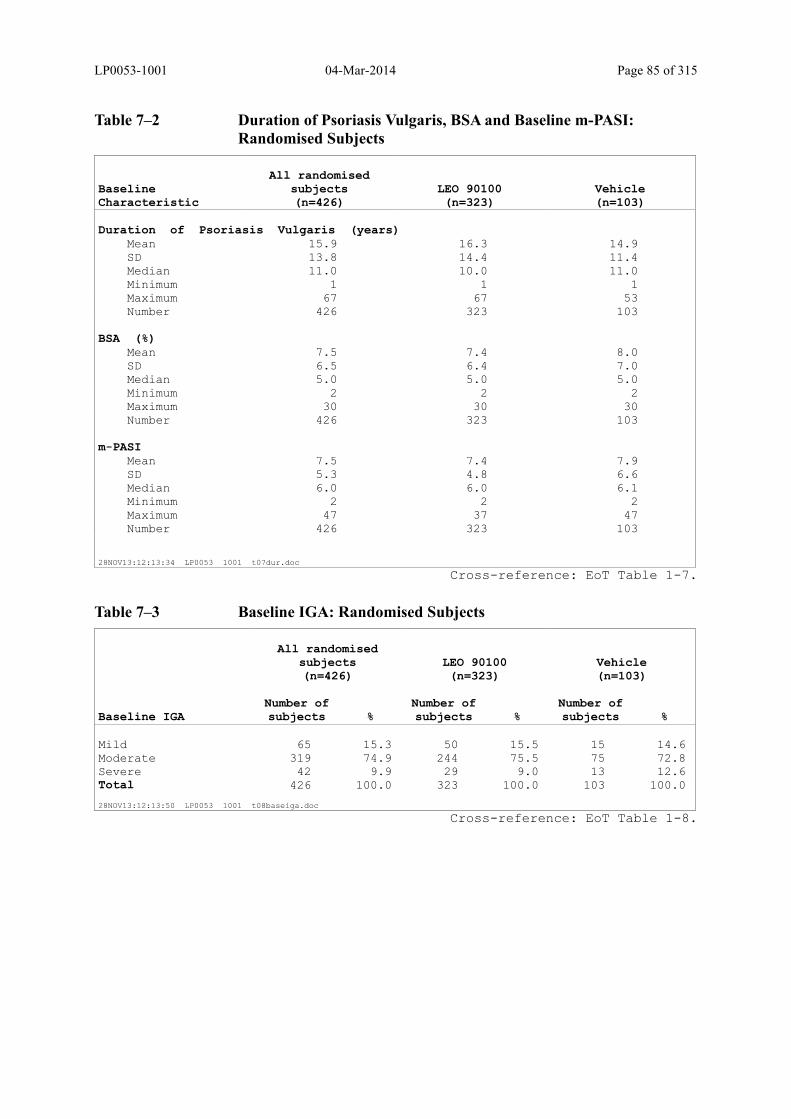
LP0053-1001 04-Mar-2014 Page 85 of 315
Table 7–2 Duration of Psoriasis Vulgaris, BSA and Baseline m-PASI: Randomised Subjects
Baseline Characteristic
All randomised subjects(n=426)
LEO 90100(n=323)
Vehicle(n=103)
Duration of Psoriasis Vulgaris (years) Mean 15.9 16.3 14.9 SD 13.8 14.4 11.4 Median 11.0 10.0 11.0 Minimum 1 1 1 Maximum 67 67 53 Number 426 323 103 BSA (%) Mean 7.5 7.4 8.0 SD 6.5 6.4 7.0 Median 5.0 5.0 5.0 Minimum 2 2 2 Maximum 30 30 30 Number 426 323 103 m-PASI Mean 7.5 7.4 7.9 SD 5.3 4.8 6.6 Median 6.0 6.0 6.1 Minimum 2 2 2 Maximum 47 37 47 Number 426 323 103
28NOV13:12:13:34 LP0053 1001 t07dur.doc
Cross-reference: EoT Table 1-7.
Table 7–3 Baseline IGA: Randomised Subjects
All randomised subjects(n=426)
LEO 90100(n=323)
Vehicle(n=103)
Baseline IGANumber of subjects %
Number of subjects %
Number of subjects %
Mild 65 15.3 50 15.5 15 14.6 Moderate 319 74.9 244 75.5 75 72.8 Severe 42 9.9 29 9.0 13 12.6 Total 426 100.0 323 100.0 103 100.0
28NOV13:12:13:50 LP0053 1001 t08baseiga.doc
Cross-reference: EoT Table 1-8.
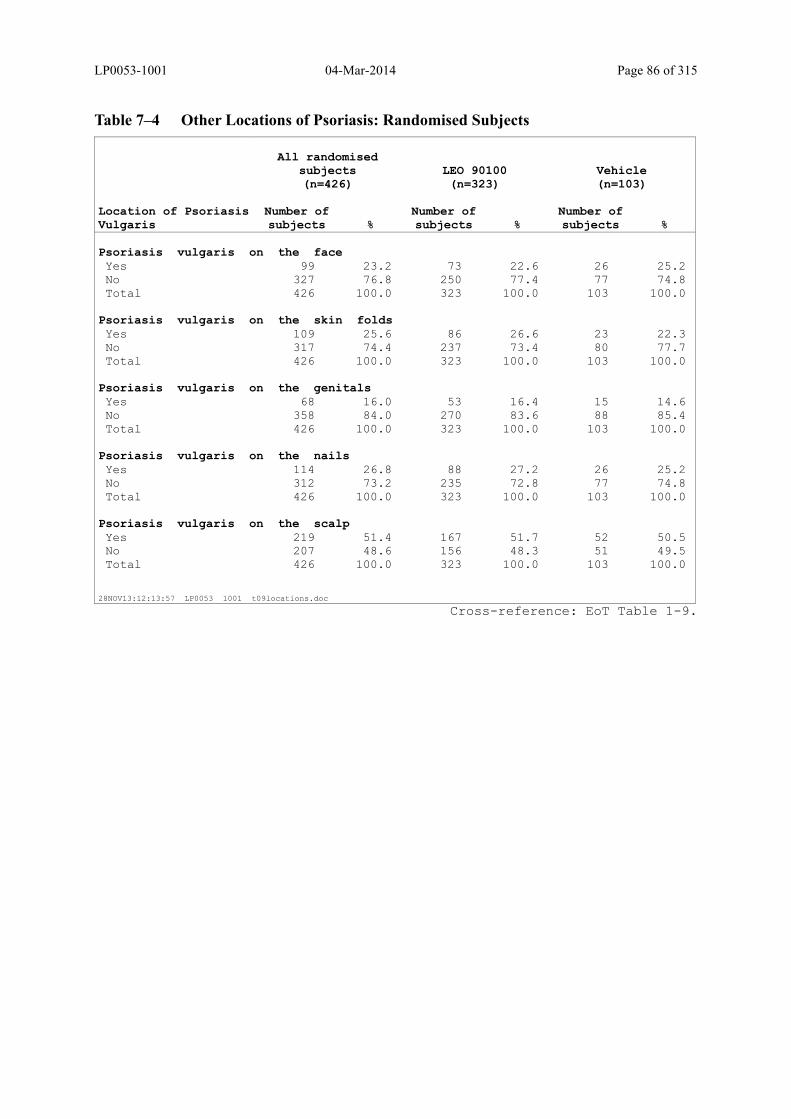
LP0053-1001 04-Mar-2014 Page 86 of 315
Table 7–4 Other Locations of Psoriasis: Randomised Subjects
All randomised subjects(n=426)
LEO 90100(n=323)
Vehicle(n=103)
Location of Psoriasis Vulgaris
Number of subjects %
Number of subjects %
Number of subjects %
Psoriasis vulgaris on the faceYes 99 23.2 73 22.6 26 25.2 No 327 76.8 250 77.4 77 74.8 Total 426 100.0 323 100.0 103 100.0
Psoriasis vulgaris on the skin foldsYes 109 25.6 86 26.6 23 22.3 No 317 74.4 237 73.4 80 77.7 Total 426 100.0 323 100.0 103 100.0
Psoriasis vulgaris on the genitalsYes 68 16.0 53 16.4 15 14.6 No 358 84.0 270 83.6 88 85.4 Total 426 100.0 323 100.0 103 100.0
Psoriasis vulgaris on the nailsYes 114 26.8 88 27.2 26 25.2 No 312 73.2 235 72.8 77 74.8 Total 426 100.0 323 100.0 103 100.0
Psoriasis vulgaris on the scalpYes 219 51.4 167 51.7 52 50.5 No 207 48.6 156 48.3 51 49.5 Total 426 100.0 323 100.0 103 100.0
28NOV13:12:13:57 LP0053 1001 t09locations.doc
Cross-reference: EoT Table 1-9.
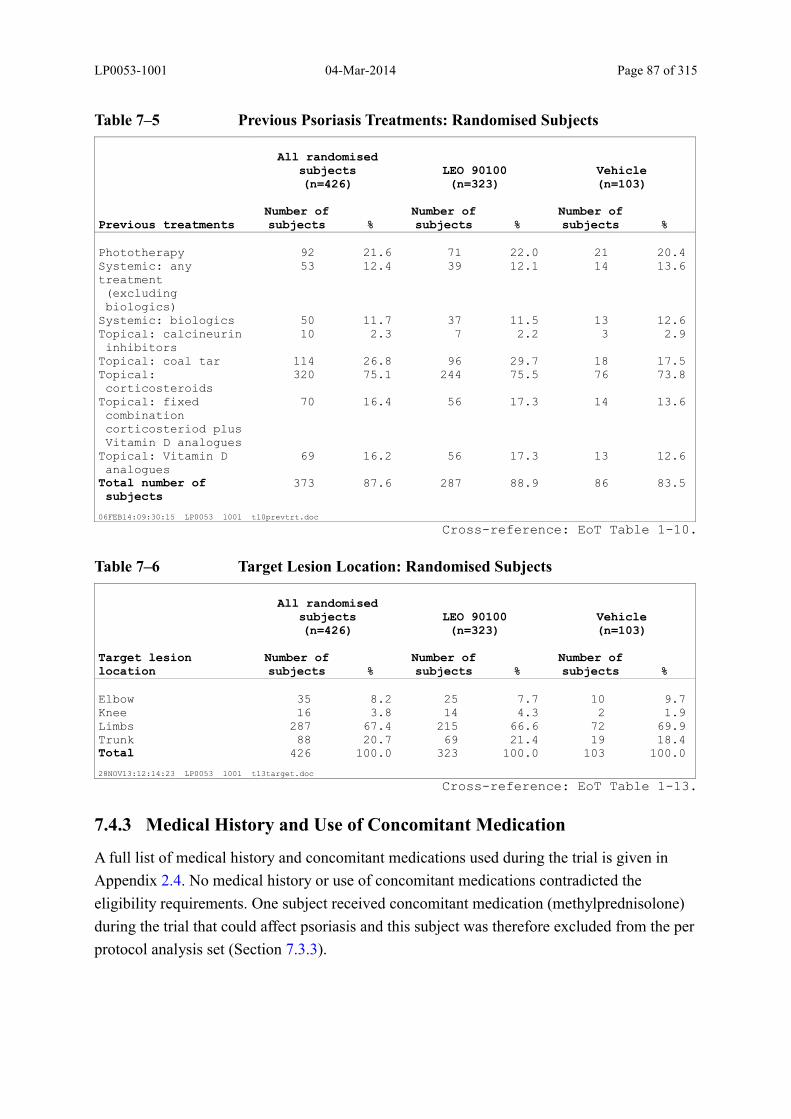
LP0053-1001 04-Mar-2014 Page 87 of 315
Table 7–5 Previous Psoriasis Treatments: Randomised Subjects
All randomised subjects(n=426)
LEO 90100(n=323)
Vehicle(n=103)
Previous treatmentsNumber of subjects %
Number of subjects %
Number of subjects %
Phototherapy 92 21.6 71 22.0 21 20.4 Systemic: any treatment (excludingbiologics)
53 12.4 39 12.1 14 13.6
Systemic: biologics 50 11.7 37 11.5 13 12.6 Topical: calcineurin inhibitors
10 2.3 7 2.2 3 2.9
Topical: coal tar 114 26.8 96 29.7 18 17.5 Topical: corticosteroids
320 75.1 244 75.5 76 73.8
Topical: fixed combinationcorticosteriod plusVitamin D analogues
70 16.4 56 17.3 14 13.6
Topical: Vitamin D analogues
69 16.2 56 17.3 13 12.6
Total number of subjects
373 87.6 287 88.9 86 83.5
06FEB14:09:30:15 LP0053 1001 t10prevtrt.doc
Cross-reference: EoT Table 1-10.
Table 7–6 Target Lesion Location: Randomised Subjects
All randomised subjects(n=426)
LEO 90100(n=323)
Vehicle(n=103)
Target lesion location
Number of subjects %
Number of subjects %
Number of subjects %
Elbow 35 8.2 25 7.7 10 9.7 Knee 16 3.8 14 4.3 2 1.9 Limbs 287 67.4 215 66.6 72 69.9 Trunk 88 20.7 69 21.4 19 18.4 Total 426 100.0 323 100.0 103 100.0
28NOV13:12:14:23 LP0053 1001 t13target.doc
Cross-reference: EoT Table 1-13.
7.4.3 Medical History and Use of Concomitant Medication
A full list of medical history and concomitant medications used during the trial is given in
Appendix 2.4. No medical history or use of concomitant medications contradicted the
eligibility requirements. One subject received concomitant medication (methylprednisolone)
during the trial that could affect psoriasis and this subject was therefore excluded from the per
protocol analysis set (Section 7.3.3).

LP0053-1001 04-Mar-2014 Page 88 of 315
8 Exposure and Treatment Compliance
8.1 Exposure
The duration of exposure to treatment was calculated as the number of days from Visit 1 to
the date of last application of investigational product (Section 6.2.6).
The duration and extent of exposure to treatment are summarised in Table 8–1 for the safety
analysis set. The average weekly amount of investigational product and the total amount of
investigational product used during each visit interval and over the entire trial period is shown
in Table 8–2 and Table 8–3, respectively.
The mean duration of treatment was approximately 4 weeks in both treatment groups (Table
8–1). The mean amount of investigational product used per week over the total treatment
period was comparable between LEO 90100 (29.8 g) and vehicle (32.1 g) and the mean
weekly amounts recorded during each visit interval were also similar (Table 8–2). The total
amount of exposure during the treatment period was well balanced between treatment groups
(LEO 90100:120.8 g; vehicle: 128.9 g) (Table 8–3).
Table 8–1 Duration and Extent of Exposure to Treatment: Safety Analysis Set
Exposure (weeks)LEO 90100(n=323)
Vehicle(n=103)
Mean 4.0 4.1 SD 0.6 0.6 Minimum 0.1 0.1 Maximum 6.0 6.3 Number 323 103 Extent of exposure to treatment(subject-treatment-weeks)
1290 418
28NOV13:12:11:54 LP0053 1001 t01expo.doc
Cross-reference: EoT Table 3-1.

LP0053-1001 04-Mar-2014 Page 89 of 315
Table 8–2 Average Weekly Amount of Trial Medication Used: Safety Analysis set
IntervalAmount (grams per week)
LEO 90100(n=323)
Vehicle(n=103)
Baseline to week 1Mean 29.9 32.9 SD 21.9 23.5 Median 22.5 25.5 Minimum 0.9 2.7 Maximum 97.3 87.7 Number 314 101
Week 1 to week 2Mean 28.5 32.6 SD 23.1 24.1 Median 20.4 23.4 Minimum 0.0 2.0 Maximum 121.5 89.0 Number 309 100
Week 2 to week 4Mean 30.2 32.7 SD 23.0 25.5 Median 24.1 23.7 Minimum 0.0 0.0 Maximum 106.4 100.4 Number 295 97
Total treatment periodMean 29.8 32.1 SD 21.2 23.6 Median 24.3 23.1 Minimum 2.1 2.5 Maximum 89.7 87.7 Number 293 98
28NOV13:14:52:09 LP0053 1001 t02amount.doc
Cross-reference: EoT Table 3-2.
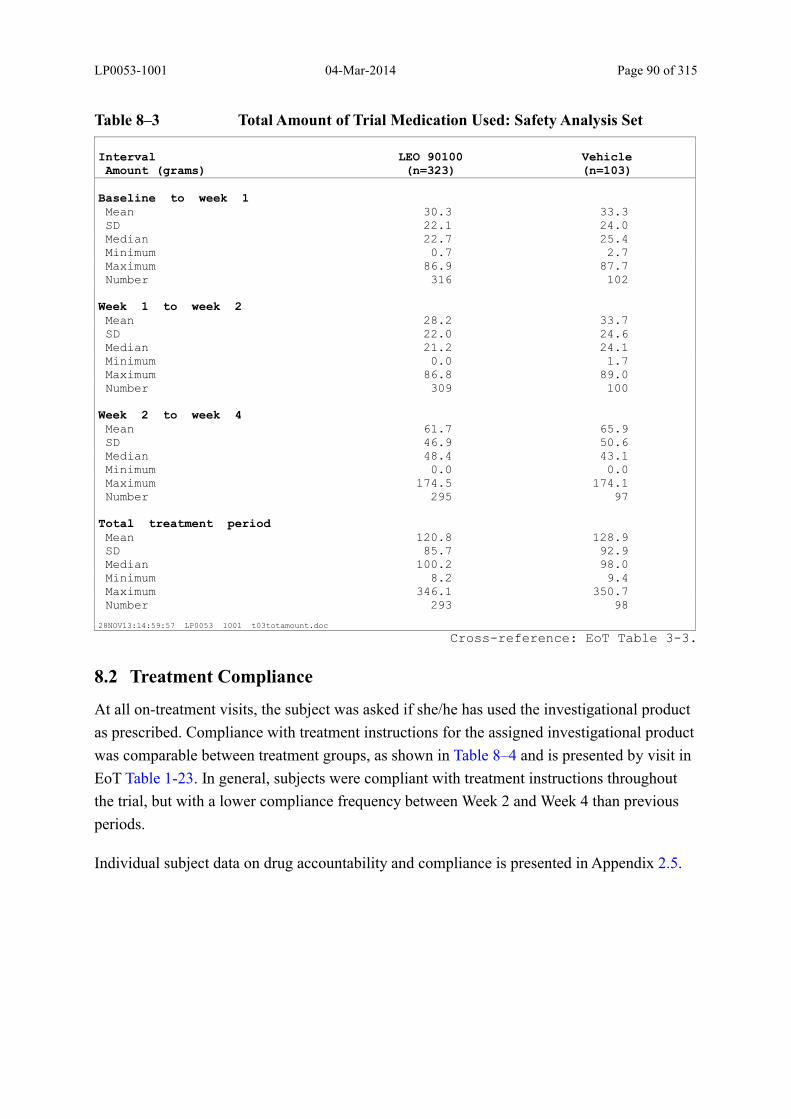
LP0053-1001 04-Mar-2014 Page 90 of 315
Table 8–3 Total Amount of Trial Medication Used: Safety Analysis Set
IntervalAmount (grams)
LEO 90100(n=323)
Vehicle(n=103)
Baseline to week 1Mean 30.3 33.3 SD 22.1 24.0 Median 22.7 25.4 Minimum 0.7 2.7 Maximum 86.9 87.7 Number 316 102
Week 1 to week 2Mean 28.2 33.7 SD 22.0 24.6 Median 21.2 24.1 Minimum 0.0 1.7 Maximum 86.8 89.0 Number 309 100
Week 2 to week 4Mean 61.7 65.9 SD 46.9 50.6 Median 48.4 43.1 Minimum 0.0 0.0 Maximum 174.5 174.1 Number 295 97
Total treatment periodMean 120.8 128.9 SD 85.7 92.9 Median 100.2 98.0 Minimum 8.2 9.4 Maximum 346.1 350.7 Number 293 98
28NOV13:14:59:57 LP0053 1001 t03totamount.doc
Cross-reference: EoT Table 3-3.
8.2 Treatment Compliance
At all on-treatment visits, the subject was asked if she/he has used the investigational product
as prescribed. Compliance with treatment instructions for the assigned investigational product
was comparable between treatment groups, as shown in Table 8–4 and is presented by visit in
EoT Table 1-23. In general, subjects were compliant with treatment instructions throughout
the trial, but with a lower compliance frequency between Week 2 and Week 4 than previous
periods.
Individual subject data on drug accountability and compliance is presented in Appendix 2.5.
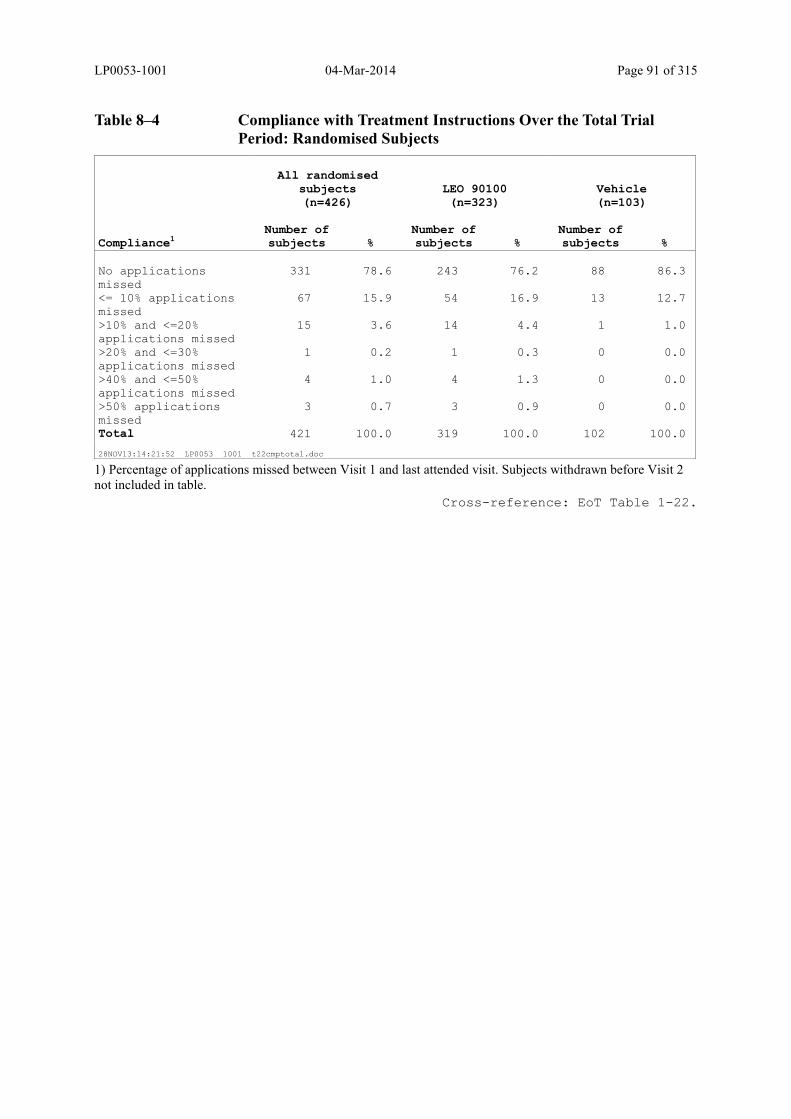
LP0053-1001 04-Mar-2014 Page 91 of 315
Table 8–4 Compliance with Treatment Instructions Over the Total Trial Period: Randomised Subjects
All randomised subjects(n=426)
LEO 90100(n=323)
Vehicle(n=103)
Compliance1Number of subjects %
Number of subjects %
Number of subjects %
No applications missed
331 78.6 243 76.2 88 86.3
<= 10% applications missed
67 15.9 54 16.9 13 12.7
>10% and <=20% applications missed
15 3.6 14 4.4 1 1.0
>20% and <=30% applications missed
1 0.2 1 0.3 0 0.0
>40% and <=50% applications missed
4 1.0 4 1.3 0 0.0
>50% applications missed
3 0.7 3 0.9 0 0.0
Total 421 100.0 319 100.0 102 100.0
28NOV13:14:21:52 LP0053 1001 t22cmptotal.doc
1) Percentage of applications missed between Visit 1 and last attended visit. Subjects withdrawn before Visit 2 not included in table.
Cross-reference: EoT Table 1-22.

LP0053-1001 04-Mar-2014 Page 92 of 315
9 Efficacy Evaluation
9.1 Primary Efficacy Endpoint
The outcome of the primary endpoint analysis, subjects with ‘treatment success’ according to
the IGA at Week 4, is presented in Table 9–1 for the full analysis set (applying multiple
imputation for missing data). The proportion of subjects achieving ‘treatment success’ at
Week 4 was 53.3% in the LEO 90100 group and 4.8% in the vehicle group. LEO 90100 was
statistically significantly more effective than vehicle (odds ratio [OR] 30.3; 95% CI 9.7 to
94.3; p<0.001).
Similar results were obtained for the sensitivity analyses applying LOCF for missing data, the
vehicle-based multiple imputation analysis, the non-responder imputation analysis, and the
analysis for observed cases (EoT Table 2-3). In summary, results were robust to the method of
handling missing data due to the high completion rate in the trial. The results for the per
protocol analysis set were similar and thus supported the primary analysis (Table 9–2).
Table 9–1 Statistical Analysis of Treatment Success According to the IGA at Week 4 (Multiple Imputation): Full Analysis Set
LEO 90100(n=323)
Vehicle(n=103)
Treatment success Week 4Number of subjects %
Number of subjects %
Yes1 172.1 53.3 4.9 4.8 No1 150.9 46.7 98.1 95.2 Total 323 100.0 103 100.0 Odds ratio2 30.27 95% CI 9.72 to
94.30
p-value < 0.001 Breslow-Day test p-value3 0.14
06FEB14:09:31:20 LP0053 1001 t01_succ_fas.doc
1) Mean number of subjects across imputations.
2) Mantel-Haenszel odds of treatment success in LEO 90100 group relative to vehicle group, adjusted for pooled
centres.
3) Breslow-Day test for homogeneity of odds ratios across pooled centres.
Cross-reference: EoT Table 2-1.
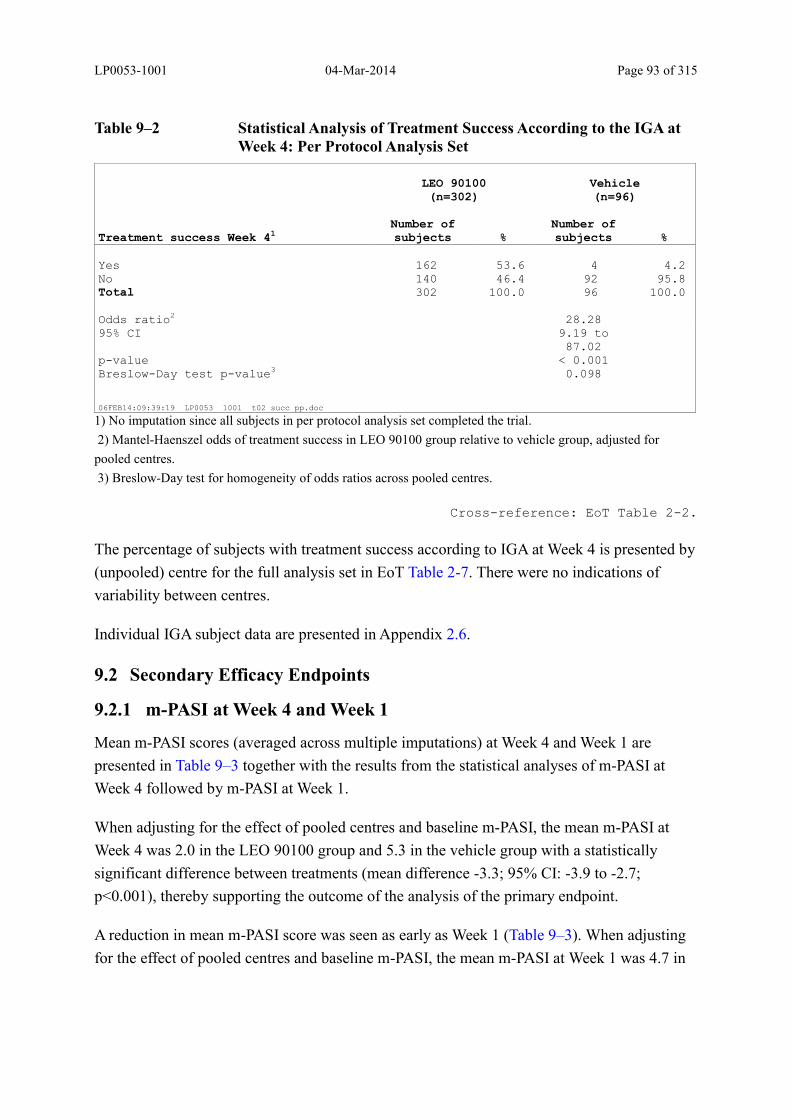
LP0053-1001 04-Mar-2014 Page 93 of 315
Table 9–2 Statistical Analysis of Treatment Success According to the IGA at Week 4: Per Protocol Analysis Set
LEO 90100(n=302)
Vehicle(n=96)
Treatment success Week 41Number of subjects %
Number of subjects %
Yes 162 53.6 4 4.2 No 140 46.4 92 95.8 Total 302 100.0 96 100.0 Odds ratio2 28.28 95% CI 9.19 to
87.02
p-value < 0.001 Breslow-Day test p-value3 0.098
06FEB14:09:39:19 LP0053 1001 t02 succ pp.doc
1) No imputation since all subjects in per protocol analysis set completed the trial.
2) Mantel-Haenszel odds of treatment success in LEO 90100 group relative to vehicle group, adjusted for
pooled centres.
3) Breslow-Day test for homogeneity of odds ratios across pooled centres.
Cross-reference: EoT Table 2-2.
The percentage of subjects with treatment success according to IGA at Week 4 is presented by
(unpooled) centre for the full analysis set in EoT Table 2-7. There were no indications of
variability between centres.
Individual IGA subject data are presented in Appendix 2.6.
9.2 Secondary Efficacy Endpoints
9.2.1 m-PASI at Week 4 and Week 1
Mean m-PASI scores (averaged across multiple imputations) at Week 4 and Week 1 are
presented in Table 9–3 together with the results from the statistical analyses of m-PASI at
Week 4 followed by m-PASI at Week 1.
When adjusting for the effect of pooled centres and baseline m-PASI, the mean m-PASI at
Week 4 was 2.0 in the LEO 90100 group and 5.3 in the vehicle group with a statistically
significant difference between treatments (mean difference -3.3; 95% CI: -3.9 to -2.7;
p<0.001), thereby supporting the outcome of the analysis of the primary endpoint.
A reduction in mean m-PASI score was seen as early as Week 1 (Table 9–3). When adjusting
for the effect of pooled centres and baseline m-PASI, the mean m-PASI at Week 1 was 4.7 in
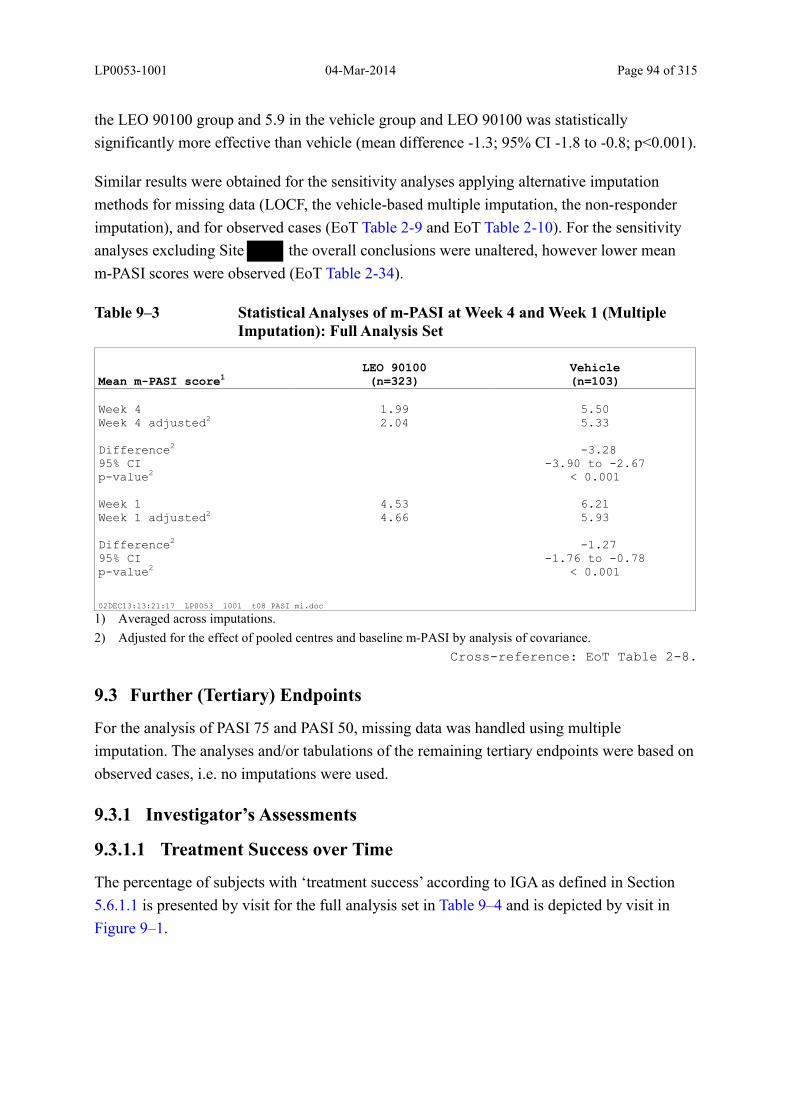
LP0053-1001 04-Mar-2014 Page 94 of 315
the LEO 90100 group and 5.9 in the vehicle group and LEO 90100 was statistically
significantly more effective than vehicle (mean difference -1.3; 95% CI -1.8 to -0.8; p<0.001).
Similar results were obtained for the sensitivity analyses applying alternative imputation
methods for missing data (LOCF, the vehicle-based multiple imputation, the non-responder
imputation), and for observed cases (EoT Table 2-9 and EoT Table 2-10). For the sensitivity
analyses excluding Site the overall conclusions were unaltered, however lower mean
m-PASI scores were observed (EoT Table 2-34).
Table 9–3 Statistical Analyses of m-PASI at Week 4 and Week 1 (Multiple Imputation): Full Analysis Set
Mean m-PASI score1LEO 90100(n=323)
Vehicle(n=103)
Week 4 1.99 5.50 Week 4 adjusted2 2.04 5.33 Difference2 -3.28 95% CI -3.90 to -2.67 p-value2 < 0.001 Week 1 4.53 6.21 Week 1 adjusted2 4.66 5.93 Difference2 -1.27 95% CI -1.76 to -0.78 p-value2 < 0.001
02DEC13:13:21:17 LP0053 1001 t08 PASI mi.doc
1) Averaged across imputations.
2) Adjusted for the effect of pooled centres and baseline m-PASI by analysis of covariance.
Cross-reference: EoT Table 2-8.
9.3 Further (Tertiary) Endpoints
For the analysis of PASI 75 and PASI 50, missing data was handled using multiple
imputation. The analyses and/or tabulations of the remaining tertiary endpoints were based on
observed cases, i.e. no imputations were used.
9.3.1 Investigator’s Assessments
9.3.1.1 Treatment Success over Time
The percentage of subjects with ‘treatment success’ according to IGA as defined in Section
5.6.1.1 is presented by visit for the full analysis set in Table 9–4 and is depicted by visit in
Figure 9–1.
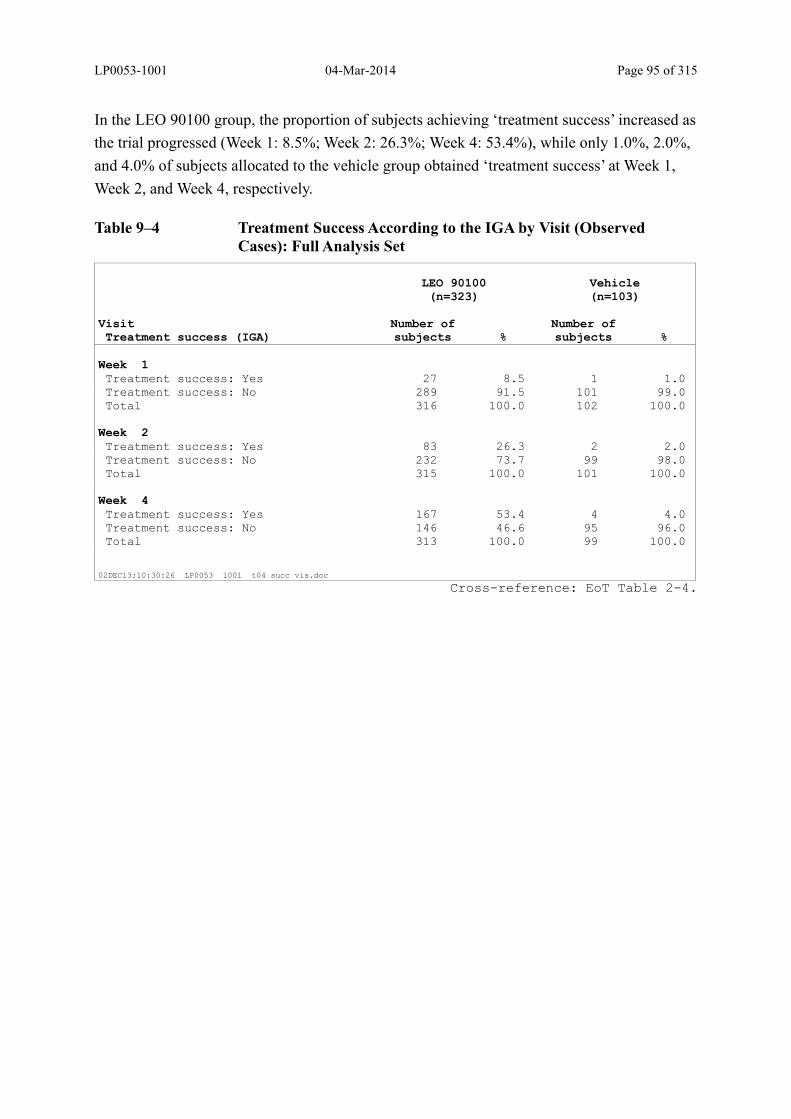
LP0053-1001 04-Mar-2014 Page 95 of 315
In the LEO 90100 group, the proportion of subjects achieving ‘treatment success’ increased as
the trial progressed (Week 1: 8.5%; Week 2: 26.3%; Week 4: 53.4%), while only 1.0%, 2.0%,
and 4.0% of subjects allocated to the vehicle group obtained ‘treatment success’ at Week 1,
Week 2, and Week 4, respectively.
Table 9–4 Treatment Success According to the IGA by Visit (Observed Cases): Full Analysis Set
LEO 90100(n=323)
Vehicle(n=103)
VisitTreatment success (IGA)
Number of subjects %
Number of subjects %
Week 1Treatment success: Yes 27 8.5 1 1.0 Treatment success: No 289 91.5 101 99.0 Total 316 100.0 102 100.0
Week 2Treatment success: Yes 83 26.3 2 2.0 Treatment success: No 232 73.7 99 98.0 Total 315 100.0 101 100.0
Week 4Treatment success: Yes 167 53.4 4 4.0 Treatment success: No 146 46.6 95 96.0 Total 313 100.0 99 100.0
02DEC13:10:30:26 LP0053 1001 t04 succ vis.doc
Cross-reference: EoT Table 2-4.
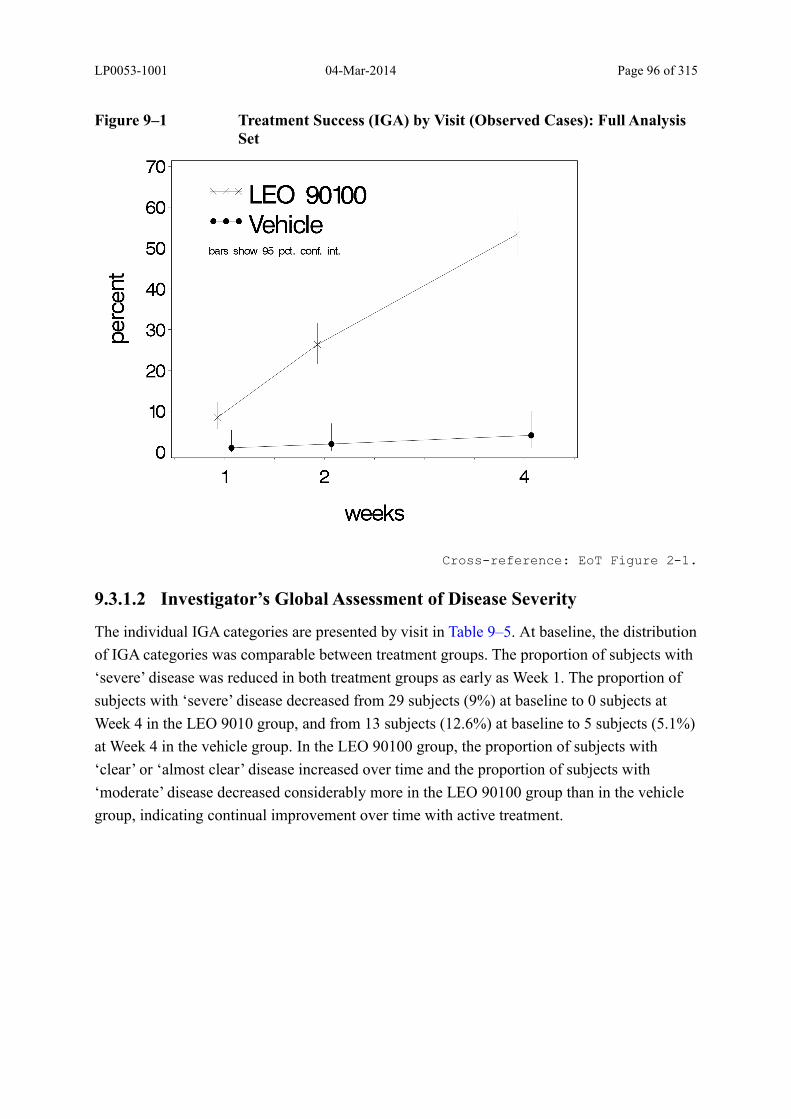
LP0053-1001 04-Mar-2014 Page 96 of 315
Figure 9–1 Treatment Success (IGA) by Visit (Observed Cases): Full Analysis Set
Cross-reference: EoT Figure 2-1.
9.3.1.2 Investigator’s Global Assessment of Disease Severity
The individual IGA categories are presented by visit in Table 9–5. At baseline, the distribution
of IGA categories was comparable between treatment groups. The proportion of subjects with
‘severe’ disease was reduced in both treatment groups as early as Week 1. The proportion of
subjects with ‘severe’ disease decreased from 29 subjects (9%) at baseline to 0 subjects at
Week 4 in the LEO 9010 group, and from 13 subjects (12.6%) at baseline to 5 subjects (5.1%)
at Week 4 in the vehicle group. In the LEO 90100 group, the proportion of subjects with
‘clear’ or ‘almost clear’ disease increased over time and the proportion of subjects with
‘moderate’ disease decreased considerably more in the LEO 90100 group than in the vehicle
group, indicating continual improvement over time with active treatment.
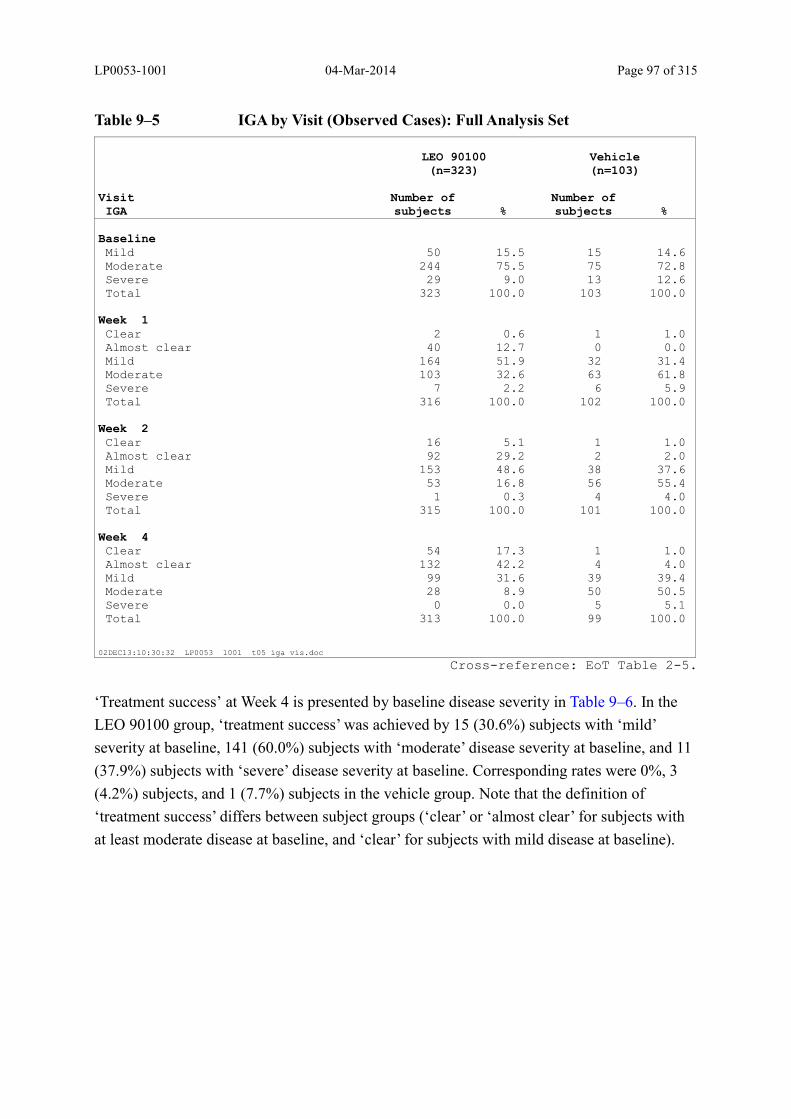
LP0053-1001 04-Mar-2014 Page 97 of 315
Table 9–5 IGA by Visit (Observed Cases): Full Analysis Set
LEO 90100(n=323)
Vehicle(n=103)
VisitIGA
Number of subjects %
Number of subjects %
BaselineMild 50 15.5 15 14.6 Moderate 244 75.5 75 72.8 Severe 29 9.0 13 12.6 Total 323 100.0 103 100.0
Week 1Clear 2 0.6 1 1.0 Almost clear 40 12.7 0 0.0 Mild 164 51.9 32 31.4 Moderate 103 32.6 63 61.8 Severe 7 2.2 6 5.9 Total 316 100.0 102 100.0
Week 2Clear 16 5.1 1 1.0 Almost clear 92 29.2 2 2.0 Mild 153 48.6 38 37.6 Moderate 53 16.8 56 55.4 Severe 1 0.3 4 4.0 Total 315 100.0 101 100.0
Week 4Clear 54 17.3 1 1.0 Almost clear 132 42.2 4 4.0 Mild 99 31.6 39 39.4 Moderate 28 8.9 50 50.5 Severe 0 0.0 5 5.1 Total 313 100.0 99 100.0
02DEC13:10:30:32 LP0053 1001 t05 iga vis.doc
Cross-reference: EoT Table 2-5.
‘Treatment success’ at Week 4 is presented by baseline disease severity in Table 9–6. In the
LEO 90100 group, ‘treatment success’ was achieved by 15 (30.6%) subjects with ‘mild’
severity at baseline, 141 (60.0%) subjects with ‘moderate’ disease severity at baseline, and 11
(37.9%) subjects with ‘severe’ disease severity at baseline. Corresponding rates were 0%, 3
(4.2%) subjects, and 1 (7.7%) subjects in the vehicle group. Note that the definition of
‘treatment success’ differs between subject groups (‘clear’ or ‘almost clear’ for subjects with
at least moderate disease at baseline, and ‘clear’ for subjects with mild disease at baseline).

LP0053-1001 04-Mar-2014 Page 98 of 315
Table 9–6 Treatment Success According to the IGA at Week 4 by Baseline Disease Severity (Observed Cases): Full Analysis Set
LEO 90100(n=323)
Vehicle(n=103)
Baseline IGATreatment success (IGA)
Number of subjects %
Number of subjects %
MildTreatment success: Yes 15 30.6 0 0.0 Treatment success: No 34 69.4 14 100.0 Total 49 100.0 14 100.0
ModerateTreatment success: Yes 141 60.0 3 4.2 Treatment success: No 94 40.0 69 95.8 Total 235 100.0 72 100.0
SevereTreatment success: Yes 11 37.9 1 7.7 Treatment success: No 18 62.1 12 92.3 Total 29 100.0 13 100.0
02DEC13:10:30:37 LP0053 1001 t06 succ bas.doc
Cross-reference: EoT Table 2-6.
9.3.1.3 m-PASI over Time
The m-PASI was calculated from investigator’s assessment of extent and severity of the
disease locally (trunk, arms, legs) (Section 5.6.1.2).
m-PASI scores are summarised by visit in Table 9–7 and depicted in Figure 9–2. The
percentage changes in m-PASI scores compared to baseline (Week 0) are presented in Table
9–8. Decreasing m-PASI scores (indicating improvements) were observed successively during
the course of the trial. In the LEO 90100 group, the mean percentage decreases from baseline
were 38.3%, 58.3% and 72.3% at Week 1, Week 2, and Week 4, respectively (Table 9–8). In
the vehicle group, the mean percentage decreases at corresponding visits were 20.0%, 27.0%,
and 26.2%, respectively.
Slightly lower mean m-PASI scores were observed when excluding Site from the
dataset (Section 6.2.7.2, EoT Table 2-35, EoT Table 2-40, and EoT Figure 2-3).
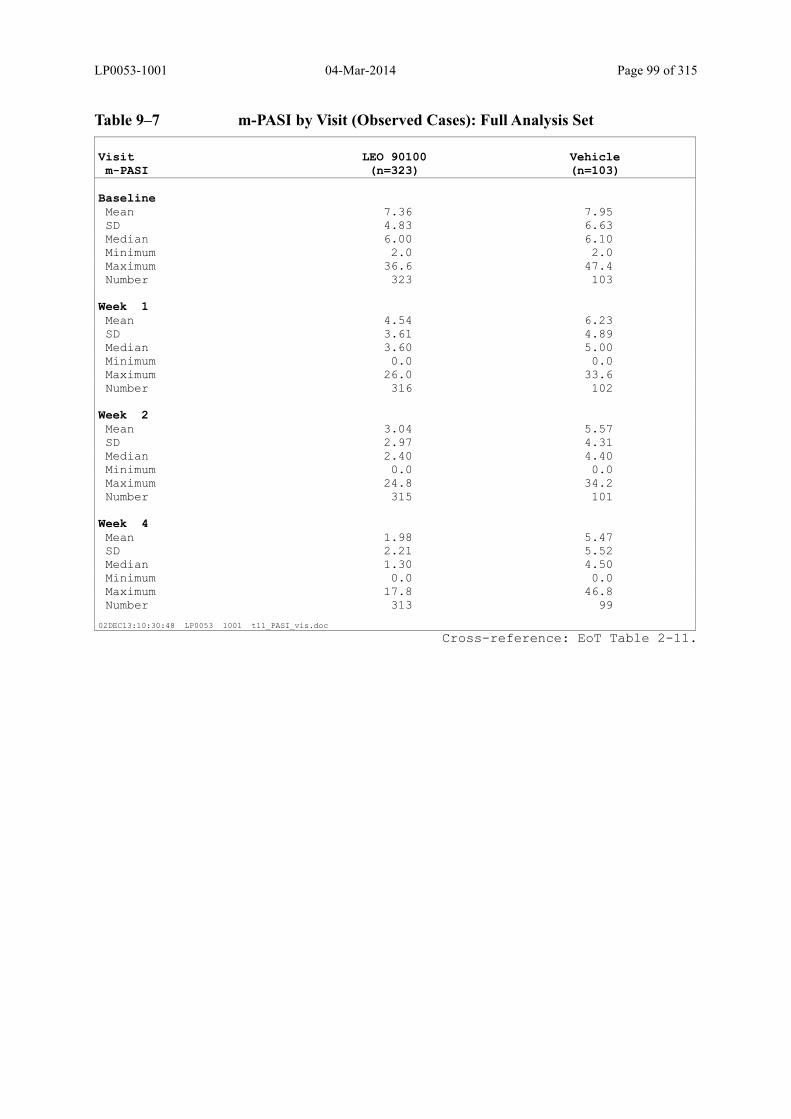
LP0053-1001 04-Mar-2014 Page 99 of 315
Table 9–7 m-PASI by Visit (Observed Cases): Full Analysis Set
Visitm-PASI
LEO 90100(n=323)
Vehicle(n=103)
BaselineMean 7.36 7.95 SD 4.83 6.63 Median 6.00 6.10 Minimum 2.0 2.0 Maximum 36.6 47.4 Number 323 103
Week 1Mean 4.54 6.23 SD 3.61 4.89 Median 3.60 5.00 Minimum 0.0 0.0 Maximum 26.0 33.6 Number 316 102
Week 2Mean 3.04 5.57 SD 2.97 4.31 Median 2.40 4.40 Minimum 0.0 0.0 Maximum 24.8 34.2 Number 315 101
Week 4Mean 1.98 5.47 SD 2.21 5.52 Median 1.30 4.50 Minimum 0.0 0.0 Maximum 17.8 46.8 Number 313 99
02DEC13:10:30:48 LP0053 1001 t11_PASI_vis.doc
Cross-reference: EoT Table 2-11.
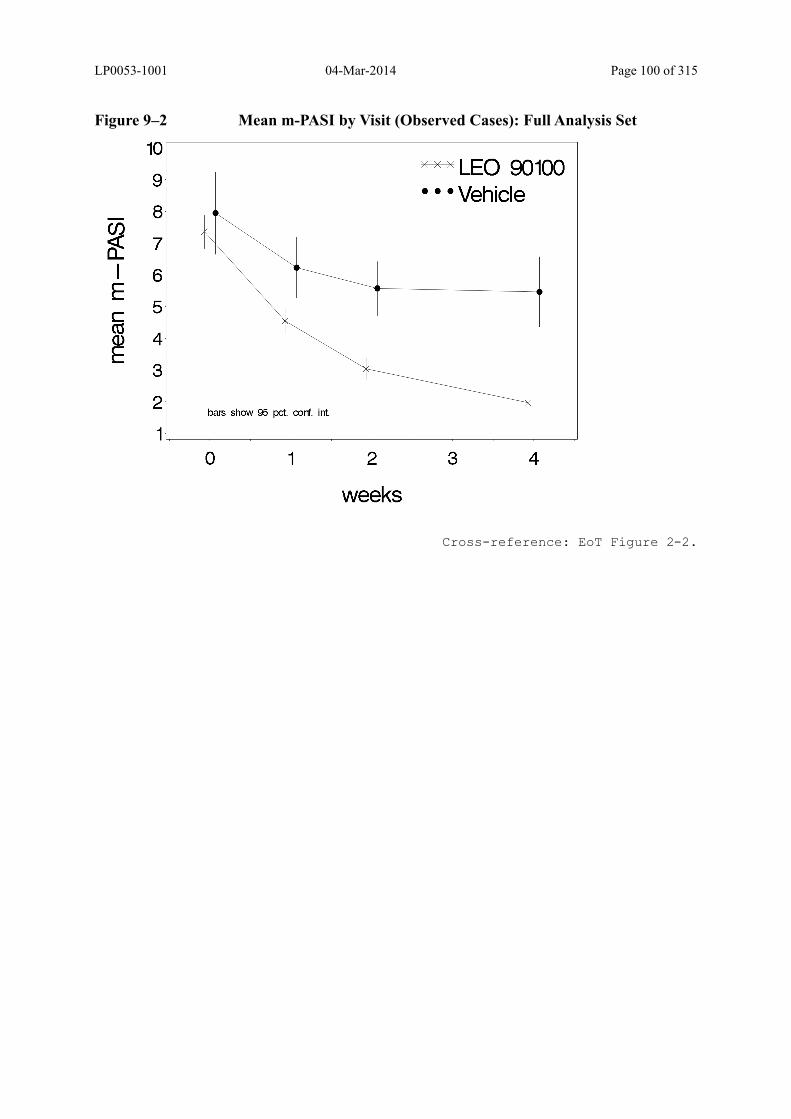
LP0053-1001 04-Mar-2014 Page 100 of 315
Figure 9–2 Mean m-PASI by Visit (Observed Cases): Full Analysis Set
Cross-reference: EoT Figure 2-2.

LP0053-1001 04-Mar-2014 Page 101 of 315
Table 9–8 Percentage Change in m-PASI by Visit (Observed Cases): Full Analysis Set
VisitPercentage change in m-
PASILEO 90100(n=323)
Vehicle(n=103)
Week 1Mean -38.3 -20.0 SD 24.8 25.7 Median -36.3 -18.9 Minimum -100.0 -100.0 Maximum 27.8 80.0 Number 316 102
Week 2Mean -58.3 -27.0 SD 25.8 27.3 Median -61.5 -23.1 Minimum -100.0 -100.0 Maximum 55.6 50.0 Number 315 101
Week 4Mean -72.3 -26.2 SD 24.9 39.7 Median -76.7 -22.2 Minimum -100.0 -100.0 Maximum 25.0 177.2 Number 313 99
02DEC13:10:33:13 LP0053 1001 t29 pchg PASI.doc
Cross-reference: EoT Table 2-29.
9.3.1.4 PASI-50 and PASI-75
The percentage of subjects with a 50% reduction in m-PASI is summarised by visit in Table
9–9. In the LEO 90100 group, the proportions of subjects achieving PASI-50 increased during
the course of the trial and were 32.6%, 65.7%, and 82.7% at Week 1, Week 2, and Week 4,
respectively. In the vehicle group, the proportion of subjects achieving PASI-50 at
corresponding visits were 13.7%, 20.8%, and 28.3%, respectively.
The percentage of subjects with a 50% reduction in m-PASI at Week 4 (applying multiple
imputation for missing data) was 82.3% in the LEO 90100 group and 28.0% in the vehicle
group (Table 9–10). LEO 90100 was statistically significantly more effective than vehicle
(OR 13.9; 95% CI 7.6 to 25.7; p<0.001).
Similar findings were obtained for the sensitivity analyses excluding Site (EoT Table 2-
36 and EoT Table 2-38).
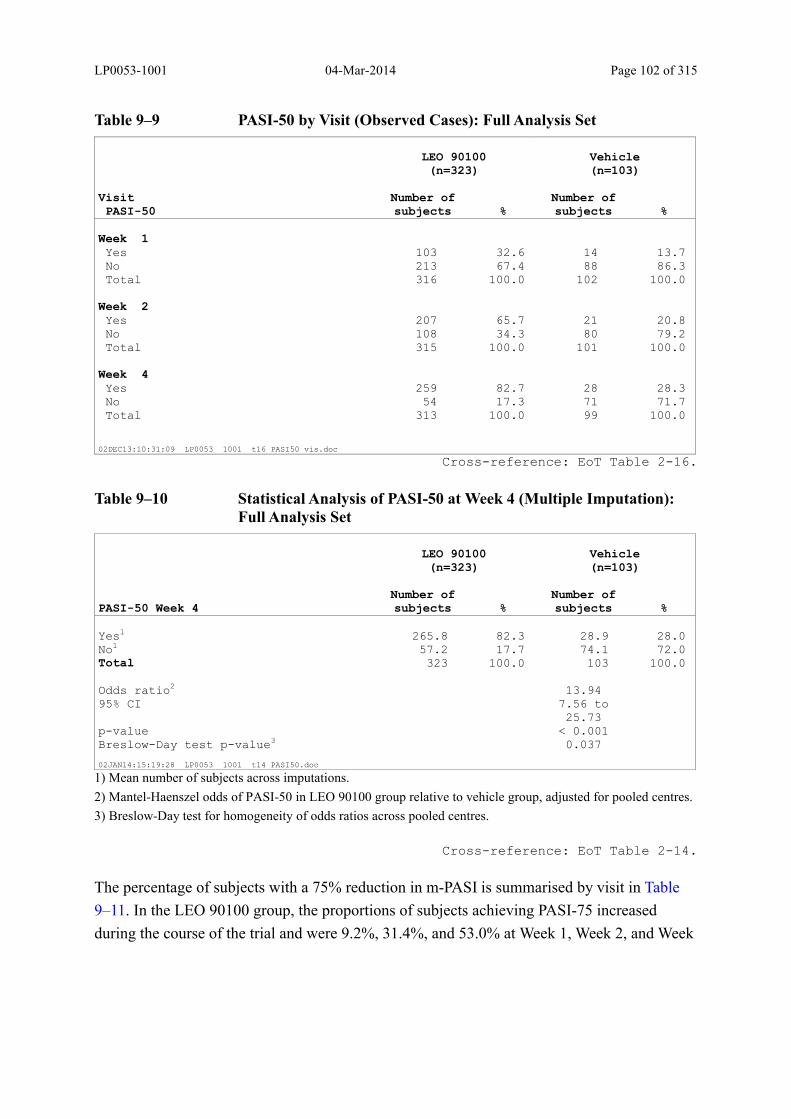
LP0053-1001 04-Mar-2014 Page 102 of 315
Table 9–9 PASI-50 by Visit (Observed Cases): Full Analysis Set
LEO 90100(n=323)
Vehicle(n=103)
VisitPASI-50
Number of subjects %
Number of subjects %
Week 1Yes 103 32.6 14 13.7 No 213 67.4 88 86.3 Total 316 100.0 102 100.0
Week 2Yes 207 65.7 21 20.8 No 108 34.3 80 79.2 Total 315 100.0 101 100.0
Week 4Yes 259 82.7 28 28.3 No 54 17.3 71 71.7 Total 313 100.0 99 100.0
02DEC13:10:31:09 LP0053 1001 t16 PASI50 vis.doc
Cross-reference: EoT Table 2-16.
Table 9–10 Statistical Analysis of PASI-50 at Week 4 (Multiple Imputation): Full Analysis Set
LEO 90100(n=323)
Vehicle(n=103)
PASI-50 Week 4Number of subjects %
Number of subjects %
Yes1 265.8 82.3 28.9 28.0 No1 57.2 17.7 74.1 72.0 Total 323 100.0 103 100.0 Odds ratio2 13.94 95% CI 7.56 to
25.73
p-value < 0.001 Breslow-Day test p-value3 0.037
02JAN14:15:19:28 LP0053 1001 t14 PASI50.doc
1) Mean number of subjects across imputations.
2) Mantel-Haenszel odds of PASI-50 in LEO 90100 group relative to vehicle group, adjusted for pooled centres.
3) Breslow-Day test for homogeneity of odds ratios across pooled centres.
Cross-reference: EoT Table 2-14.
The percentage of subjects with a 75% reduction in m-PASI is summarised by visit in Table
9–11. In the LEO 90100 group, the proportions of subjects achieving PASI-75 increased
during the course of the trial and were 9.2%, 31.4%, and 53.0% at Week 1, Week 2, and Week

LP0053-1001 04-Mar-2014 Page 103 of 315
4, respectively. In the vehicle group, the proportion of subjects achieving PASI-75 at
corresponding visits were 1.0%, 2.0%, and 8.1%, respectively.
The percentage of subjects with a 75% reduction in m-PASI at Week 4 (applying multiple
imputation for missing data) was 52.9% in the LEO 90100 group and 8.2% in the vehicle
group (Table 9–12). LEO 90100 was statistically significantly more effective than vehicle
(OR 14.9; 95% CI 6.5 to 34.0; p<0.001).
Similar findings were obtained for the sensitivity analyses excluding Site (EoT Table 2-
37 and EoT Table 2-39).
Table 9–11 PASI-75 by Visit (Observed Cases): Full Analysis Set
LEO 90100(n=323)
Vehicle(n=103)
VisitPASI-75
Number of subjects %
Number of subjects %
Week 1Yes 29 9.2 1 1.0 No 287 90.8 101 99.0 Total 316 100.0 102 100.0
Week 2Yes 99 31.4 2 2.0 No 216 68.6 99 98.0 Total 315 100.0 101 100.0
Week 4Yes 166 53.0 8 8.1 No 147 47.0 91 91.9 Total 313 100.0 99 100.0
02DEC13:10:31:14 LP0053 1001 t17 PASI75 vis.doc
Cross-reference: EoT Table 2-17.
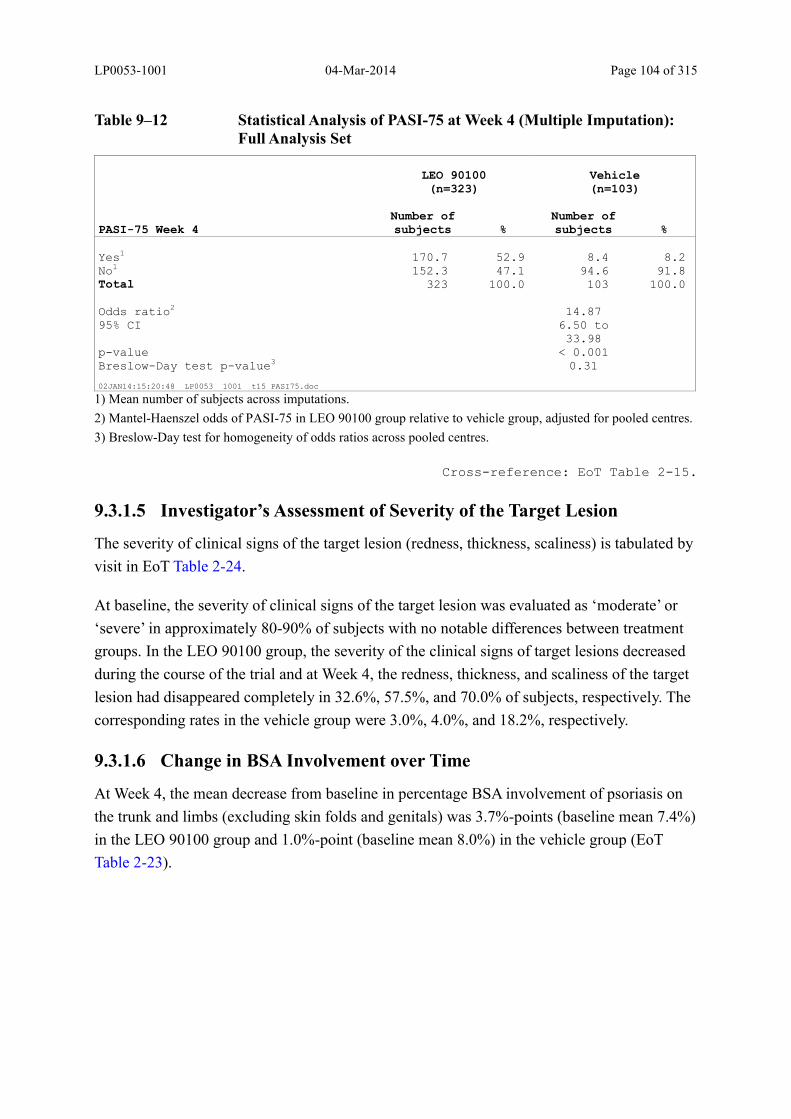
LP0053-1001 04-Mar-2014 Page 104 of 315
Table 9–12 Statistical Analysis of PASI-75 at Week 4 (Multiple Imputation): Full Analysis Set
LEO 90100(n=323)
Vehicle(n=103)
PASI-75 Week 4Number of subjects %
Number of subjects %
Yes1 170.7 52.9 8.4 8.2 No1 152.3 47.1 94.6 91.8 Total 323 100.0 103 100.0 Odds ratio2 14.87 95% CI 6.50 to
33.98
p-value < 0.001 Breslow-Day test p-value3 0.31
02JAN14:15:20:48 LP0053 1001 t15 PASI75.doc
1) Mean number of subjects across imputations.
2) Mantel-Haenszel odds of PASI-75 in LEO 90100 group relative to vehicle group, adjusted for pooled centres.
3) Breslow-Day test for homogeneity of odds ratios across pooled centres.
Cross-reference: EoT Table 2-15.
9.3.1.5 Investigator’s Assessment of Severity of the Target Lesion
The severity of clinical signs of the target lesion (redness, thickness, scaliness) is tabulated by
visit in EoT Table 2-24.
At baseline, the severity of clinical signs of the target lesion was evaluated as ‘moderate’ or
‘severe’ in approximately 80-90% of subjects with no notable differences between treatment
groups. In the LEO 90100 group, the severity of the clinical signs of target lesions decreased
during the course of the trial and at Week 4, the redness, thickness, and scaliness of the target
lesion had disappeared completely in 32.6%, 57.5%, and 70.0% of subjects, respectively. The
corresponding rates in the vehicle group were 3.0%, 4.0%, and 18.2%, respectively.
9.3.1.6 Change in BSA Involvement over Time
At Week 4, the mean decrease from baseline in percentage BSA involvement of psoriasis on
the trunk and limbs (excluding skin folds and genitals) was 3.7%-points (baseline mean 7.4%)
in the LEO 90100 group and 1.0%-point (baseline mean 8.0%) in the vehicle group (EoT
Table 2-23).
LP0053-1001 04-Mar-2014 Page 105 of 315
9.3.2 Subject’s Assessments
9.3.2.1 Patient’s Global Assessment of Disease Severity
Overall, the results for subject’s assessments of disease severity were in line with those of the
investigator. The individual PaGA categories are presented by visit in Table 9–13. At baseline,
the distribution of PaGA categories was comparable between treatment groups. The
proportion of subjects with ‘severe’ disease was reduced in both treatment groups as early as
Week 1. The proportion of subjects with ‘severe’ disease decreased from 61 subjects (18.9%)
at baseline to 4 subjects (1.3%) Week 4 in the LEO 9010 group, and from 22 subjects (21.4%)
at baseline to 10 subjects (10.1%) at Week 4 in the vehicle group. In the LEO 90100 group,
the proportion of subjects with ‘clear’ or ‘very mild’ disease increased over time and the
proportion of subjects with ‘moderate’ disease decreased considerably more in the LEO
90100 group than in the vehicle group, indicating continual improvement over time with
active treatment.
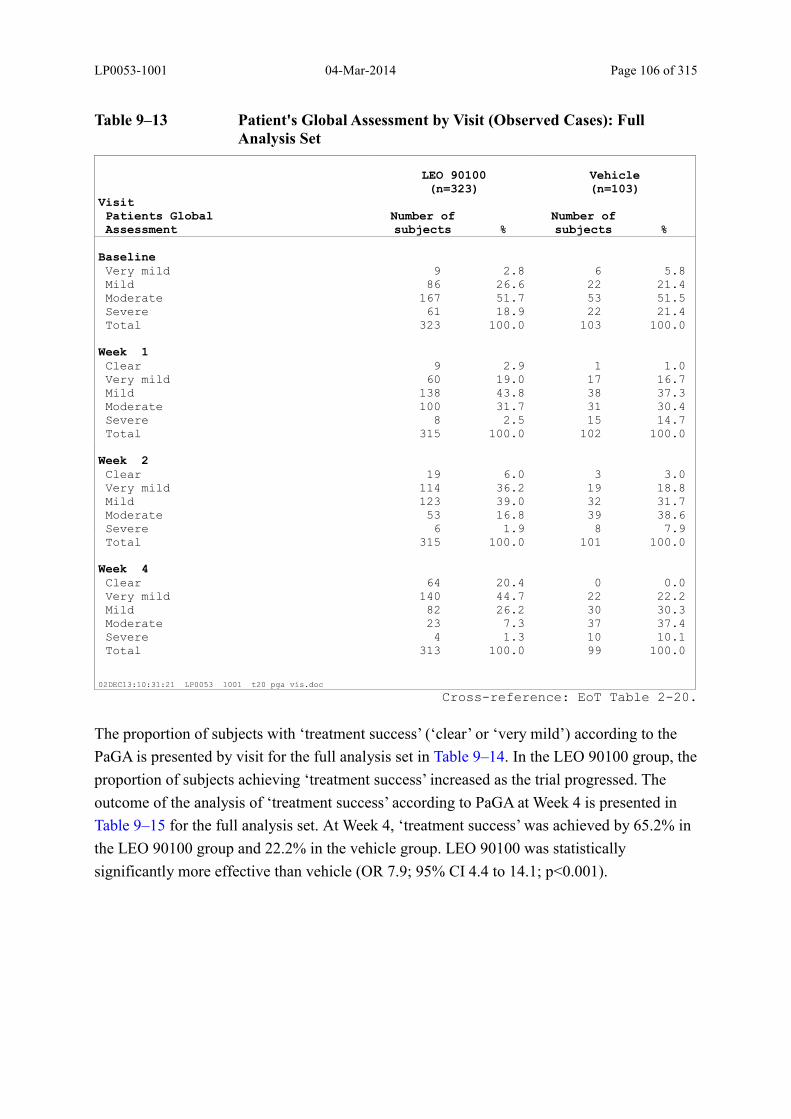
LP0053-1001 04-Mar-2014 Page 106 of 315
Table 9–13 Patient's Global Assessment by Visit (Observed Cases): Full Analysis Set
LEO 90100(n=323)
Vehicle(n=103)
VisitPatients GlobalAssessment
Number of subjects %
Number of subjects %
BaselineVery mild 9 2.8 6 5.8 Mild 86 26.6 22 21.4 Moderate 167 51.7 53 51.5 Severe 61 18.9 22 21.4 Total 323 100.0 103 100.0
Week 1Clear 9 2.9 1 1.0 Very mild 60 19.0 17 16.7 Mild 138 43.8 38 37.3 Moderate 100 31.7 31 30.4 Severe 8 2.5 15 14.7 Total 315 100.0 102 100.0
Week 2Clear 19 6.0 3 3.0 Very mild 114 36.2 19 18.8 Mild 123 39.0 32 31.7 Moderate 53 16.8 39 38.6 Severe 6 1.9 8 7.9 Total 315 100.0 101 100.0
Week 4Clear 64 20.4 0 0.0 Very mild 140 44.7 22 22.2 Mild 82 26.2 30 30.3 Moderate 23 7.3 37 37.4 Severe 4 1.3 10 10.1 Total 313 100.0 99 100.0
02DEC13:10:31:21 LP0053 1001 t20 pga vis.doc
Cross-reference: EoT Table 2-20.
The proportion of subjects with ‘treatment success’ (‘clear’ or ‘very mild’) according to the
PaGA is presented by visit for the full analysis set in Table 9–14. In the LEO 90100 group, the
proportion of subjects achieving ‘treatment success’ increased as the trial progressed. The
outcome of the analysis of ‘treatment success’ according to PaGA at Week 4 is presented in
Table 9–15 for the full analysis set. At Week 4, ‘treatment success’ was achieved by 65.2% in
the LEO 90100 group and 22.2% in the vehicle group. LEO 90100 was statistically
significantly more effective than vehicle (OR 7.9; 95% CI 4.4 to 14.1; p<0.001).
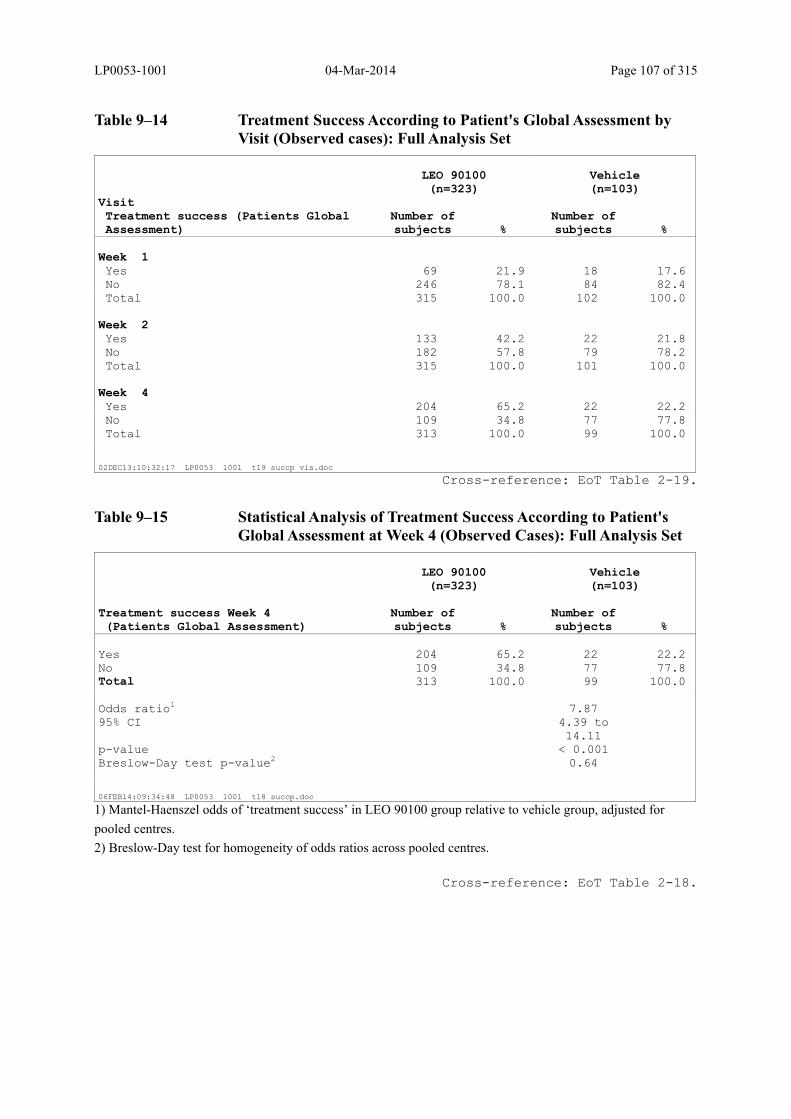
LP0053-1001 04-Mar-2014 Page 107 of 315
Table 9–14 Treatment Success According to Patient's Global Assessment by Visit (Observed cases): Full Analysis Set
LEO 90100(n=323)
Vehicle(n=103)
VisitTreatment success (Patients GlobalAssessment)
Number of subjects %
Number of subjects %
Week 1Yes 69 21.9 18 17.6 No 246 78.1 84 82.4 Total 315 100.0 102 100.0
Week 2Yes 133 42.2 22 21.8 No 182 57.8 79 78.2 Total 315 100.0 101 100.0
Week 4Yes 204 65.2 22 22.2 No 109 34.8 77 77.8 Total 313 100.0 99 100.0
02DEC13:10:32:17 LP0053 1001 t19 succp vis.doc
Cross-reference: EoT Table 2-19.
Table 9–15 Statistical Analysis of Treatment Success According to Patient's Global Assessment at Week 4 (Observed Cases): Full Analysis Set
LEO 90100(n=323)
Vehicle(n=103)
Treatment success Week 4(Patients Global Assessment)
Number of subjects %
Number of subjects %
Yes 204 65.2 22 22.2 No 109 34.8 77 77.8 Total 313 100.0 99 100.0 Odds ratio1 7.87 95% CI 4.39 to
14.11
p-value < 0.001 Breslow-Day test p-value2 0.64
06FEB14:09:34:48 LP0053 1001 t18 succp.doc
1) Mantel-Haenszel odds of ‘treatment success’ in LEO 90100 group relative to vehicle group, adjusted for
pooled centres.
2) Breslow-Day test for homogeneity of odds ratios across pooled centres.
Cross-reference: EoT Table 2-18.
LP0053-1001 04-Mar-2014 Page 108 of 315
9.3.2.2 Subject’s Assessment of Itch as Assessed by Use of a Visual
Analogue Scale
Itch severity was assessed by subjects by means of a VAS (scale range 0 to 100 mm) as
described in Section 5.5.3.2. Subjects assessed itching as increasingly less severe during the
course of the trial, particularly in the LEO 90100 group. The results from the ANOVA for the
change from baseline (adjusted for baseline score and pooled centres) in the VAS are
presented in Table 9–16. At Week 4, the mean change from baseline (adjusted for pooled
centres and baseline score) was -43.1 in the LEO 90100 group and -22.7 in the vehicle group.
LEO 90100 was statistically significantly more effective than vehicle at all time-points
analysed.
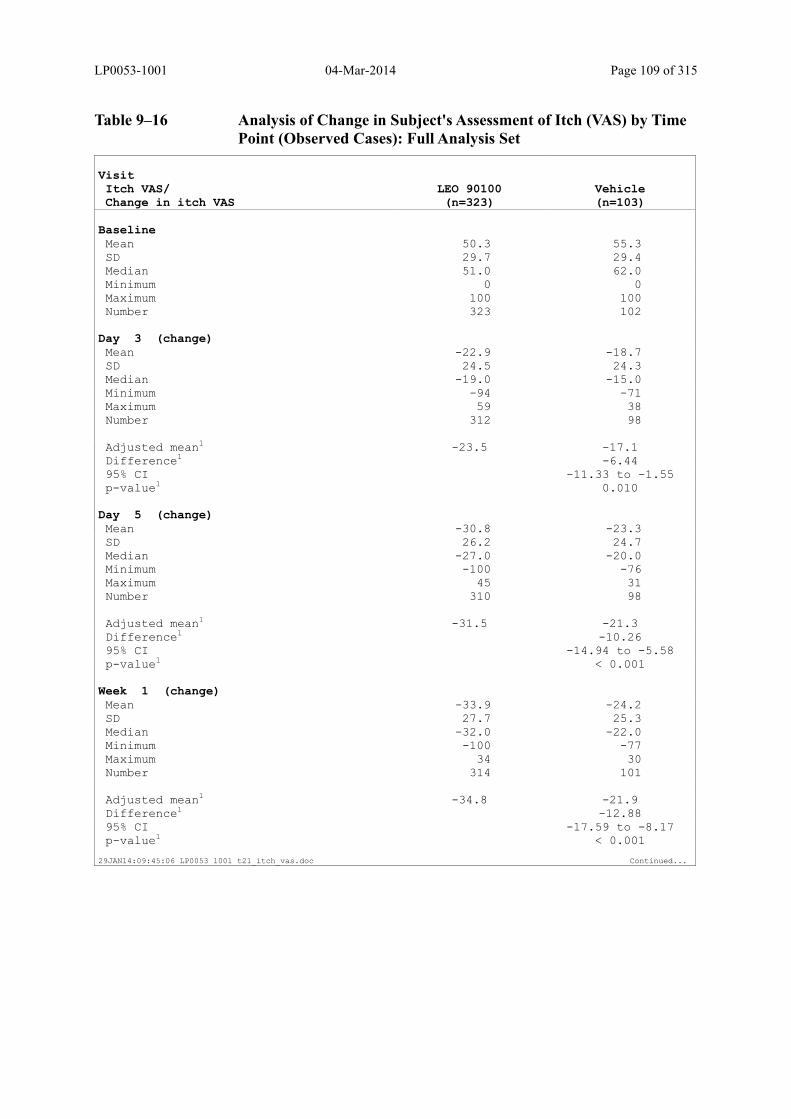
LP0053-1001 04-Mar-2014 Page 109 of 315
Table 9–16 Analysis of Change in Subject's Assessment of Itch (VAS) by Time Point (Observed Cases): Full Analysis Set
VisitItch VAS/Change in itch VAS
LEO 90100(n=323)
Vehicle(n=103)
BaselineMean 50.3 55.3 SD 29.7 29.4 Median 51.0 62.0 Minimum 0 0 Maximum 100 100 Number 323 102
Day 3 (change)Mean -22.9 -18.7 SD 24.5 24.3 Median -19.0 -15.0 Minimum -94 -71 Maximum 59 38 Number 312 98 Adjusted mean1 -23.5 -17.1 Difference1 -6.44 95% CI -11.33 to -1.55 p-value1 0.010
Day 5 (change)Mean -30.8 -23.3 SD 26.2 24.7 Median -27.0 -20.0 Minimum -100 -76 Maximum 45 31 Number 310 98 Adjusted mean1 -31.5 -21.3 Difference1 -10.26 95% CI -14.94 to -5.58 p-value1 < 0.001
Week 1 (change)Mean -33.9 -24.2 SD 27.7 25.3 Median -32.0 -22.0 Minimum -100 -77 Maximum 34 30 Number 314 101 Adjusted mean1 -34.8 -21.9 Difference1 -12.88 95% CI -17.59 to -8.17 p-value1 < 0.001
29JAN14:09:45:06 LP0053 1001 t21_itch_vas.doc Continued...
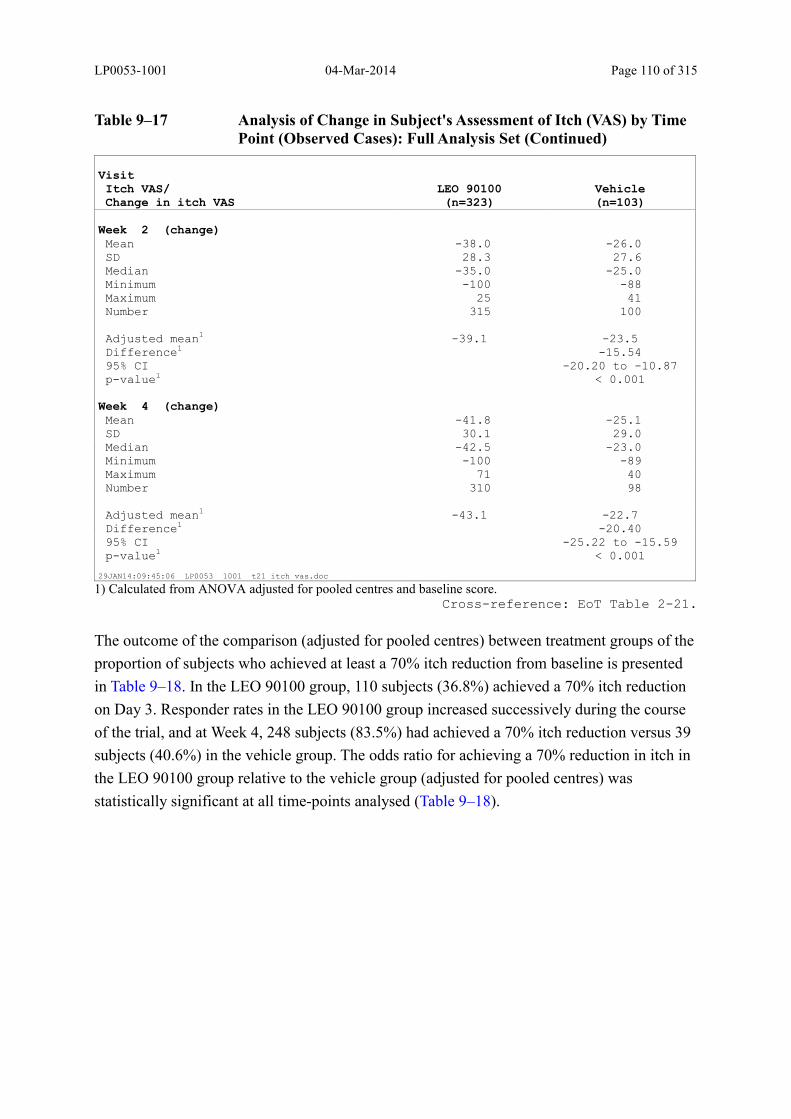
LP0053-1001 04-Mar-2014 Page 110 of 315
Table 9–17 Analysis of Change in Subject's Assessment of Itch (VAS) by Time Point (Observed Cases): Full Analysis Set (Continued)
VisitItch VAS/Change in itch VAS
LEO 90100(n=323)
Vehicle(n=103)
Week 2 (change)Mean -38.0 -26.0 SD 28.3 27.6 Median -35.0 -25.0 Minimum -100 -88 Maximum 25 41 Number 315 100 Adjusted mean1 -39.1 -23.5 Difference1 -15.54 95% CI -20.20 to -10.87 p-value1 < 0.001
Week 4 (change)Mean -41.8 -25.1 SD 30.1 29.0 Median -42.5 -23.0 Minimum -100 -89 Maximum 71 40 Number 310 98 Adjusted mean1 -43.1 -22.7 Difference1 -20.40 95% CI -25.22 to -15.59 p-value1 < 0.001
29JAN14:09:45:06 LP0053 1001 t21 itch vas.doc
1) Calculated from ANOVA adjusted for pooled centres and baseline score.Cross-reference: EoT Table 2-21.
The outcome of the comparison (adjusted for pooled centres) between treatment groups of the
proportion of subjects who achieved at least a 70% itch reduction from baseline is presented
in Table 9–18. In the LEO 90100 group, 110 subjects (36.8%) achieved a 70% itch reduction
on Day 3. Responder rates in the LEO 90100 group increased successively during the course
of the trial, and at Week 4, 248 subjects (83.5%) had achieved a 70% itch reduction versus 39
subjects (40.6%) in the vehicle group. The odds ratio for achieving a 70% reduction in itch in
the LEO 90100 group relative to the vehicle group (adjusted for pooled centres) was
statistically significant at all time-points analysed (Table 9–18).
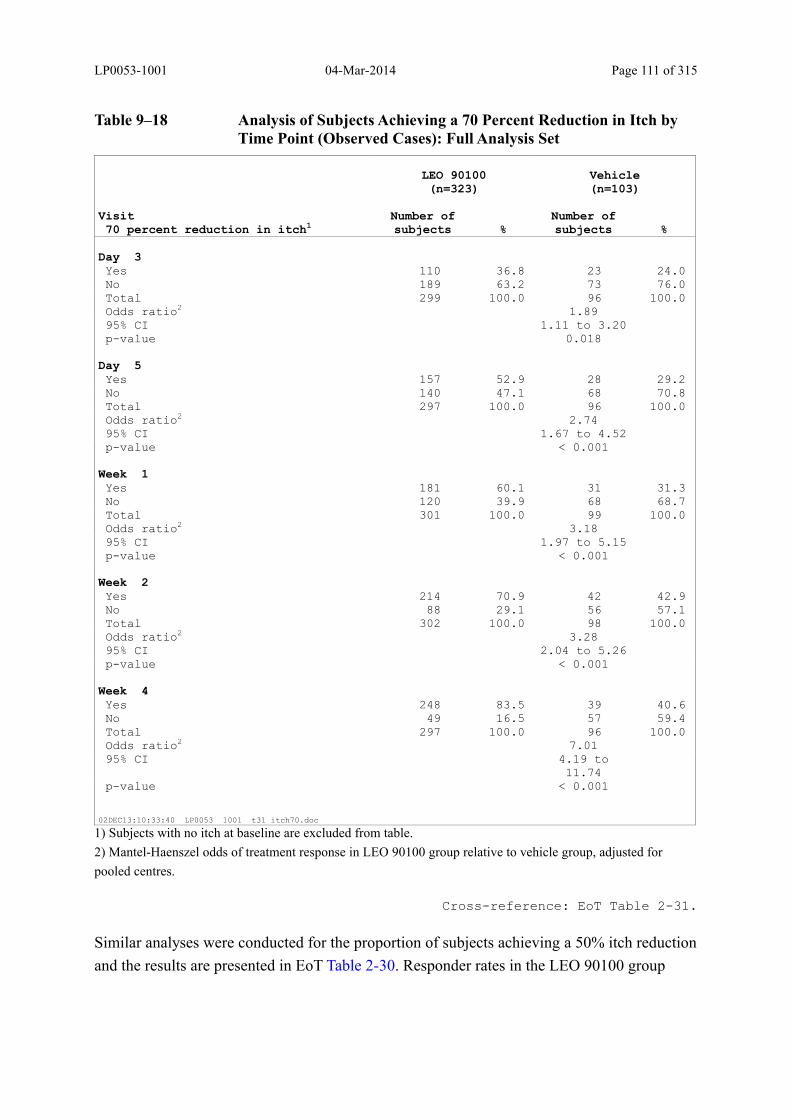
LP0053-1001 04-Mar-2014 Page 111 of 315
Table 9–18 Analysis of Subjects Achieving a 70 Percent Reduction in Itch by Time Point (Observed Cases): Full Analysis Set
LEO 90100(n=323)
Vehicle(n=103)
Visit70 percent reduction in itch1
Number of subjects %
Number of subjects %
Day 3Yes 110 36.8 23 24.0 No 189 63.2 73 76.0 Total 299 100.0 96 100.0 Odds ratio2 1.89 95% CI 1.11 to 3.20 p-value 0.018
Day 5Yes 157 52.9 28 29.2 No 140 47.1 68 70.8 Total 297 100.0 96 100.0 Odds ratio2 2.74 95% CI 1.67 to 4.52 p-value < 0.001
Week 1Yes 181 60.1 31 31.3 No 120 39.9 68 68.7 Total 301 100.0 99 100.0 Odds ratio2 3.18 95% CI 1.97 to 5.15 p-value < 0.001
Week 2Yes 214 70.9 42 42.9 No 88 29.1 56 57.1 Total 302 100.0 98 100.0 Odds ratio2 3.28 95% CI 2.04 to 5.26 p-value < 0.001
Week 4Yes 248 83.5 39 40.6 No 49 16.5 57 59.4 Total 297 100.0 96 100.0 Odds ratio2 7.01 95% CI 4.19 to
11.74
p-value < 0.001
02DEC13:10:33:40 LP0053 1001 t31 itch70.doc
1) Subjects with no itch at baseline are excluded from table.
2) Mantel-Haenszel odds of treatment response in LEO 90100 group relative to vehicle group, adjusted for
pooled centres.
Cross-reference: EoT Table 2-31.
Similar analyses were conducted for the proportion of subjects achieving a 50% itch reduction
and the results are presented in EoT Table 2-30. Responder rates in the LEO 90100 group

LP0053-1001 04-Mar-2014 Page 112 of 315
increased successively during the course of the trial and, at Week 4, 264 subjects (88.9%) had
obtained a 50% itch reduction. The odds ratio for achieving a 50% itch reduction in the LEO
90100 group relative to vehicle group (adjusted for pooled centres) was statistically
significant at all time-points analysed (p=0.004 on Day 3 and p<0.001 at all subsequent visits)
(EoT Table 2-30).
9.3.2.3 Subject’s Assessment of Itch-Related Sleep Loss by Use of a Visual
Analogue Scale
Itch- related sleep loss was assessed by subjects by means of a VAS (scale range 0 to 100 mm)
as described in Section 5.5.3.2. Subjects assessed itch-related sleep loss as increasingly less
severe during the course of the trial, particularly in the LEO 90100 group. The results from
the ANOVA for the change from baseline (adjusted for baseline score and pooled centres) in
the VAS are presented in Table 9–19. At Week 4, the mean change from baseline (adjusted for
pooled centres and baseline score) was -21.9 in the LEO 90100 group and -10.0 in the vehicle
group. LEO 90100 was statistically significantly more effective than vehicle at all time-points
analysed (Table 9–19).

LP0053-1001 04-Mar-2014 Page 113 of 315
Table 9–19 Analysis of Change in Subject's Assessment of Itch-Related Sleep Loss (VAS) by Time Point (Observed Cases): Full Analysis Set
VisitSleep loss VAS/Change in Sleep lossVAS
LEO 90100(n=323)
Vehicle(n=103)
BaselineMean 26.9 33.1 SD 29.8 32.3 Median 14.5 24.0 Minimum 0 0 Maximum 100 100 Number 322 102
Day 3 (change)Mean -10.8 -7.5 SD 23.6 26.6 Median -2.0 -1.0 Minimum -100 -88 Maximum 73 86 Number 313 98 Adjusted mean1 -11.6 -5.6 Difference1 -5.97 95% CI -10.45 to -1.50 p-value1 0.009
Day 5 (change)Mean -14.2 -11.5 SD 24.8 26.7 Median -5.0 -4.0 Minimum -100 -88 Maximum 48 73 Number 313 98 Adjusted mean1 -15.1 -9.1 Difference1 -5.97 95% CI -10.05 to -1.89 p-value1 0.004
Week 1 (change)Mean -16.2 -12.0 SD 25.4 26.1 Median -6.5 -3.0 Minimum -100 -89 Maximum 48 74 Number 314 101 Adjusted mean1 -17.2 -9.4 Difference1 -7.83 95% CI -11.84 to -3.83 p-value1 < 0.001
29JAN14:09:42:12 LP0053 1001 t22_sleep_vas.doc Continued...

LP0053-1001 04-Mar-2014 Page 114 of 315
Table 9–19 Analysis of Change in Subject's Assessment of Itch-Related Sleep Loss (VAS) by Time Point (Observed Cases): Full Analysis Set (Continued)
VisitSleep loss VAS/Change in Sleep lossVAS
LEO 90100(n=323)
Vehicle(n=103)
Week 2 (change)Mean -18.6 -13.7 SD 26.3 27.6 Median -8.0 -4.5 Minimum -100 -82 Maximum 43 76 Number 314 100 Adjusted mean1 -19.6 -10.8 Difference1 -8.80 95% CI -12.67 to -4.92 p-value1 < 0.001
Week 4 (change)Mean -20.5 -13.2 SD 27.7 29.9 Median -10.0 -4.5 Minimum -100 -87 Maximum 72 79 Number 310 98 Adjusted mean1 -21.9 -10.0 Difference1 -11.85 95% CI -16.01 to -7.68 p-value1 < 0.001
29JAN14:09:42:12 LP0053 1001 t22 sleep vas.doc
1) Calculated from ANOVA adjusted for pooled centres and baseline score.
Cross-reference: EoT Table 2-22.
The outcome of the comparison (adjusted for pooled centres) between treatment groups of the
proportion of subjects who achieved at least a 70% reduction from baseline in itch-related
sleep loss is presented in Table 9–20. In the LEO 90100 group, 87 subjects (35.5%) achieved
a 70% reduction on Day 3. Responder rates in the LEO 90100 group increased successively
during the course of the trial, and at Week 4, 172 subjects (70.8%) had obtained a 70%
reduction in itch-related sleep loss versus 33 (39.8%) in the vehicle group. The odds ratio for
achieving a 70% reduction in itch-related sleep loss in the LEO 90100 group relative to the
vehicle group (adjusted for pooled centres) was statistically significant at all time-points
analysed (Table 9–20).
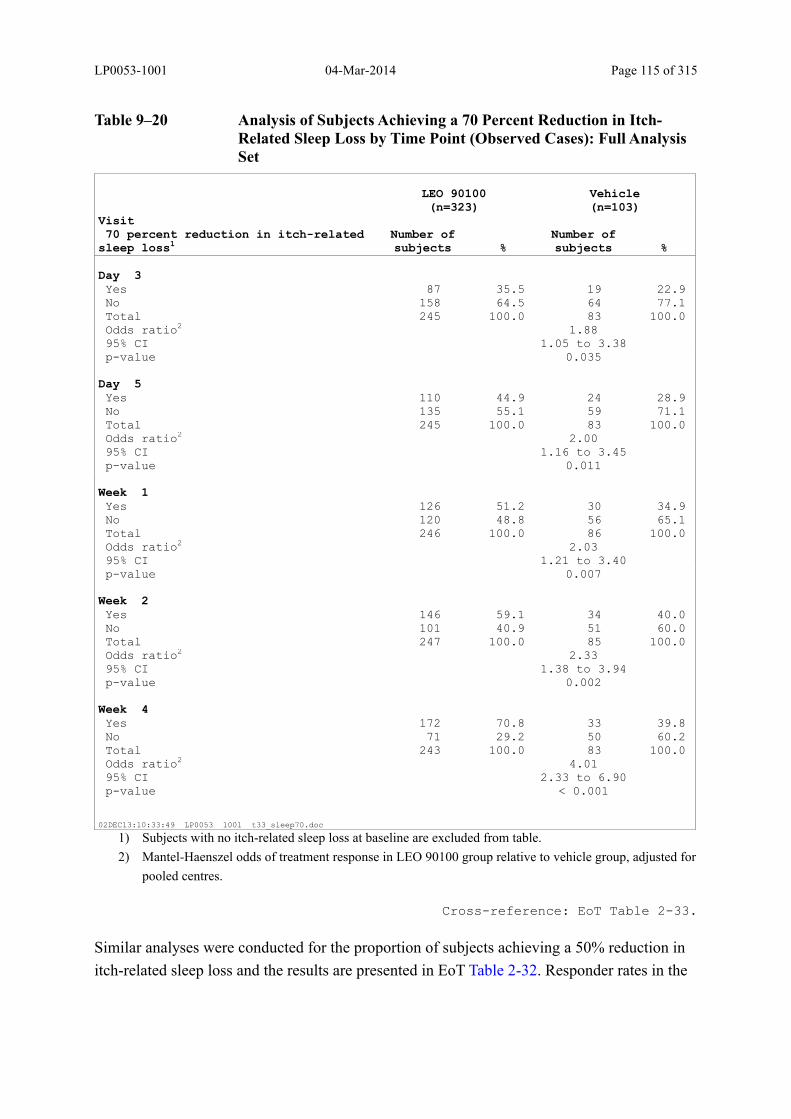
LP0053-1001 04-Mar-2014 Page 115 of 315
Table 9–20 Analysis of Subjects Achieving a 70 Percent Reduction in Itch-Related Sleep Loss by Time Point (Observed Cases): Full Analysis Set
LEO 90100(n=323)
Vehicle(n=103)
Visit70 percent reduction in itch-related
sleep loss1Number of subjects %
Number of subjects %
Day 3Yes 87 35.5 19 22.9 No 158 64.5 64 77.1 Total 245 100.0 83 100.0 Odds ratio2 1.88 95% CI 1.05 to 3.38 p-value 0.035
Day 5Yes 110 44.9 24 28.9 No 135 55.1 59 71.1 Total 245 100.0 83 100.0 Odds ratio2 2.00 95% CI 1.16 to 3.45 p-value 0.011
Week 1Yes 126 51.2 30 34.9 No 120 48.8 56 65.1 Total 246 100.0 86 100.0 Odds ratio2 2.03 95% CI 1.21 to 3.40 p-value 0.007
Week 2Yes 146 59.1 34 40.0 No 101 40.9 51 60.0 Total 247 100.0 85 100.0 Odds ratio2 2.33 95% CI 1.38 to 3.94 p-value 0.002
Week 4Yes 172 70.8 33 39.8 No 71 29.2 50 60.2 Total 243 100.0 83 100.0 Odds ratio2 4.01 95% CI 2.33 to 6.90 p-value < 0.001
02DEC13:10:33:49 LP0053 1001 t33_sleep70.doc
1) Subjects with no itch-related sleep loss at baseline are excluded from table.
2) Mantel-Haenszel odds of treatment response in LEO 90100 group relative to vehicle group, adjusted for
pooled centres.
Cross-reference: EoT Table 2-33.
Similar analyses were conducted for the proportion of subjects achieving a 50% reduction in
itch-related sleep loss and the results are presented in EoT Table 2-32. Responder rates in the
LP0053-1001 04-Mar-2014 Page 116 of 315
LEO 90100 group increased successively during the course of the trial, and at Week 4, 193
subjects (79.4%) had achieved a 50% reduction in itch-related sleep loss. The odds ratio for
achieving a 50% reduction in itch in the LEO 90100 group relative to vehicle group (adjusted
for pooled centres) was statistically significant at all time-points analysed (p=0.012 on Day 3,
p=0.005 on Day 5, and p<0.001 at subsequent visits) (EoT Table 2-32).
9.3.2.4 Change in DLQI over Time
A DLQI total score is the sum of the 10 equal-weighted items and ranges from 0 to 30, with
higher scores indicating poorer quality of life.
The change in DLQI score from baseline (Day 0) to Week 1, Week 2, and Week 4 is
summarised in Table 9–21 together with the statistical comparison between treatment groups.
Statistically significantly greater improvement in quality of life was demonstrated for LEO
90100 versus vehicle at all visits (p<0.001) (Table 9–21).
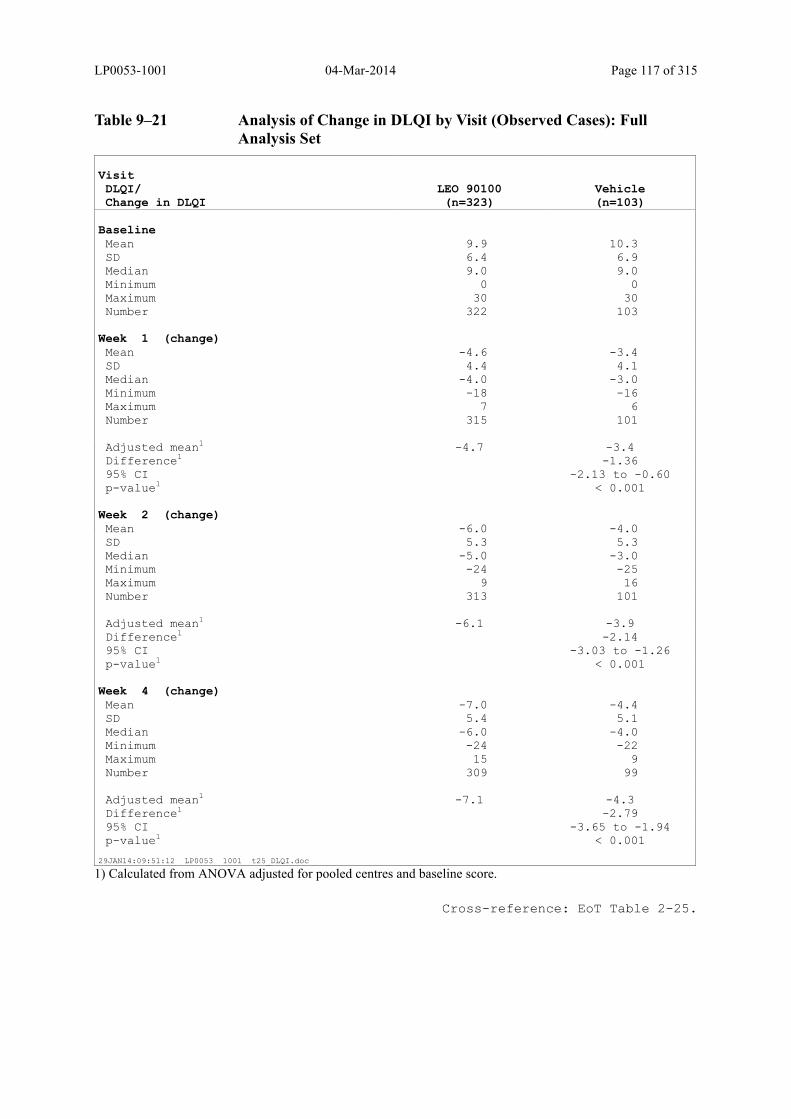
LP0053-1001 04-Mar-2014 Page 117 of 315
Table 9–21 Analysis of Change in DLQI by Visit (Observed Cases): Full Analysis Set
VisitDLQI/Change in DLQI
LEO 90100(n=323)
Vehicle(n=103)
BaselineMean 9.9 10.3 SD 6.4 6.9 Median 9.0 9.0 Minimum 0 0 Maximum 30 30 Number 322 103
Week 1 (change)Mean -4.6 -3.4 SD 4.4 4.1 Median -4.0 -3.0 Minimum -18 -16 Maximum 7 6 Number 315 101 Adjusted mean1 -4.7 -3.4 Difference1 -1.36 95% CI -2.13 to -0.60 p-value1 < 0.001
Week 2 (change)Mean -6.0 -4.0 SD 5.3 5.3 Median -5.0 -3.0 Minimum -24 -25 Maximum 9 16 Number 313 101 Adjusted mean1 -6.1 -3.9 Difference1 -2.14 95% CI -3.03 to -1.26 p-value1 < 0.001
Week 4 (change)Mean -7.0 -4.4 SD 5.4 5.1 Median -6.0 -4.0 Minimum -24 -22 Maximum 15 9 Number 309 99 Adjusted mean1 -7.1 -4.3 Difference1 -2.79 95% CI -3.65 to -1.94 p-value1 < 0.001
29JAN14:09:51:12 LP0053 1001 t25_DLQI.doc
1) Calculated from ANOVA adjusted for pooled centres and baseline score.
Cross-reference: EoT Table 2-25.
LP0053-1001 04-Mar-2014 Page 118 of 315
9.3.2.5 Change in EQ-5D-5L over Time
The subject’s assessments of quality of life were assessed by means of the generic EQ-5D-5L
questionnaire at Visit 1 (Day 0), and at Week 4, or the last on-treatment visit, as applicable.
Change in EQ-5D-5L from Baseline (Day 0; Visit 1) to Week 4
For each of the dimensions ‘mobility’, ‘self-care’, ‘usual activities’, ‘pain/discomfort’,
‘anxiety/depression’, the number and proportion of subjects in each of the five categories
(scored as 1 to 5) are tabulated by treatment group at baseline and Week 4 in EoT Table 2-26.
In the LEO 90100 group, the proportion of subjects evaluating their pain/discomfort as non-
existing (‘I have no pain or discomfort’) increased from 30.1% at baseline to 68.4% at Week
4, and the difference between treatment groups at Week 4 was statistically significant
(p<0.001) (EoT Table 2-26).
For the dimension ‘usual activities’, the proportion of subjects in the LEO 90100 group
reporting ‘I have no problems doing my usual activities’ increased from 71.1% at baseline to
86.1% at Week 4. For the dimension ‘anxiety/depression the proportion of subjects in the
LEO 90100 reporting ‘I am not anxious or depressed’ increased from 54.7% at baseline to
71.9% at Week 4. These incidences were higher than those observed in the vehicle group, but
there was no statistically significant difference between treatment groups for either
dimension. For the remaining 2 dimensions (‘mobility’ and ’self-care’), only minor
improvements were observed from baseline to Week 4 and there was no statistically
significant difference between treatment groups (EoT Table 2-26).
The observed EQ-5D-5L index scores at baseline and Week 4/end of treatment visit and the
change in EQ-5D-5L index score from baseline to Week 4 are presented together with the
statistical comparison between treatment groups in EoT Table 2-28. When adjusting for the
effect of pooled centres and baseline score, the mean change in EQ-5D-5L index score from
baseline to Week 4 was 0.08 in the LEO 90100 group and 0.04 in the vehicle group. The
comparison of LEO 90100 to vehicle was statistically significant (mean difference 0.04; 95%
CI 0.01 to 0.07; p=0.005) (EoT Table 2-28).
The observed EQ VAS scores at baseline and Week 4/end of treatment visit and the change in
EQ VAS scores from baseline to Week 4 are presented together with the statistical comparison
between treatment groups in EoT Table 2-27. When adjusting for the effect of pooled centres
and baseline score, the mean change in EQ VAS score from baseline to Week 4 was 5.1 in the
LEO 90100 group and 0.9 in the vehicle group. The comparison of LEO 90100 to vehicle was
statistically significant (mean difference 4.3; 95% CI 1.4 to 7.1; p=0.004) (EoT Table 2-27).
LP0053-1001 04-Mar-2014 Page 119 of 315
9.4 Efficacy Conclusions
Primary Endpoint
The proportion of subjects achieving ‘treatment success’ at Week 4 was 53.3% in the LEO
90100 group and 4.8% in the vehicle group (applying multiple imputation for missing
data). LEO 90100 was statistically significantly more effective than vehicle (OR 30.3;
95% CI 9.7 to 94.3; p<0.001). The sensitivity analyses applying LOCF for missing data,
the vehicle-based multiple imputation analysis, the non-responder imputation analysis, the
analysis for observed cases, and the per protocol analysis supported the results of the
primary analysis.
Secondary Endpoints
When adjusting for the effect of pooled centres and baseline m-PASI, the mean m -PASI at
Week 4 was 2.0 in the LEO 90100 group and 5.3 in the vehicle group (applying multiple
imputation for missing data) with a statistically significant difference between treatments
(mean difference -3.3; 95% CI: -3.9 to -2.7; p<0.001), thereby supporting the outcome of
the analysis of the primary endpoint.
A reduction in mean m-PASI score was seen as early as Week 1 and LEO 90100 was
statistically significantly more effective than vehicle (mean difference -1.3; 95% CI -1.8 to
-0.8; p<0.001) at this time-point (applying multiple imputation for missing data).
The sensitivity analyses applying LOCF for missing data, the vehicle-based multiple
imputation analysis, the non-responder imputation analysis and the analysis for observed
cases supported the results of the primary analysis. For the sensitivity analyses excluding
Site the overall conclusions were unaltered.
Tertiary Endpoints – Investigator’s Assessments
In the LEO 90100 group, the proportion of subjects achieving ‘treatment success’
increased as the trial progressed (Week 1: 8.5%; Week 2: 26.3%; Week 4: 53.4%), while
1.0%, 2.0%, and 4.0% of subjects allocated to the vehicle group obtained ‘treatment
success’ at Week 1, Week 2, and Week 4, respectively.
The percentage of subjects with a 50% reduction in PASI at Week 4 was estimated at
82.3% in the LEO 90100 group and 28.0% in the vehicle group. LEO 90100 was
statistically significantly more effective than vehicle (OR 13.9; 95% CI 7.6 to 25.7;
p<0.001). Similar findings were obtained for the sensitivity analyses excluding Site
LP0053-1001 04-Mar-2014 Page 120 of 315
The percentage of subjects with a 75% reduction in PASI at Week 4 was estimated as
52.9% in the LEO 90100 group and 8.2% in the vehicle group. LEO 90100 was
statistically significantly more effective than vehicle (OR 14.9; 95% CI 6.5 to 34.0;
p<0.001). Similar findings were obtained for the sensitivity analyses excluding Site
At baseline, the severity of clinical signs of the target lesion was evaluated as 'moderate'
or 'severe' in approximately 80-90% of subjects with no notable differences between
treatment groups. In the LEO 90100 group, the severity of target lesions decreased during
the course of the trial and at Week 4, the redness, thickness, and scaliness of the target
lesion had disappeared completely in 32.6%, 57.5%, and 70.0% of subjects, respectively.
The corresponding rates in the vehicle group were 3.0%, 4.0%, and 18.2%, respectively.
At Week 4, the mean decrease from baseline in percentage BSA involvement of psoriasis
on the trunk and limbs (excluding skin folds and genitals) was 3.7%-points (baseline mean
7.4%) in the LEO 90100 group and 1.0%-points (baseline mean 8.0%) in the vehicle
group.
Tertiary Endpoints – Subject’s Assessments
Overall, the results for subject’s assessments of disease severity were in line with those of
the investigator. In the LEO 90100 group, the proportion of subjects achieving ‘treatment
success’ increased as the trial progressed (Week 1: 21.9%; Week 2: 42.2%; Week 4:
65.2%), while 17.6%, 21.8%, and 22.2% of subjects allocated to the vehicle group
obtained ‘treatment success’ at Week 1, Week 2, and Week 4, respectively. At Week 4,
LEO 90100 was statistically significantly more effective than vehicle (OR 7.9; 95% CI 4.4
to 14.1; p<0.001).
Subjects assessed itching as increasingly less severe during the course of the trial,
particularly in the LEO 90100 group. At Week 4, the mean change from baseline (adjusted
for pooled centres and baseline score) in itch (VAS) was -43.1 in the LEO 90100 group
and -22.7 in the vehicle group. LEO 90100 was statistically significantly more effective
than vehicle at all visits. In the LEO 90100 group, 110 subjects (36.8%) achieved 70%
itch reduction on Day 3. Responder rates in the LEO 90100 group increased successively
during the course of the trial, and at Week 4, 248 subjects (83.5%) had obtained 70% itch
reduction versus 39 subjects (40.6%) in the vehicle group. The odds ratio for achieving
70% reduction in itch in the LEO 90100 group relative to the vehicle group (adjusted for
pooled centres) was statistically significant at all visits.
LP0053-1001 04-Mar-2014 Page 121 of 315
Subjects assessed itch-related sleep loss as increasingly less severe during the course of
the trial, particularly in the LEO 90100 group. At Week 4, the mean change from baseline
(adjusted for pooled centres and baseline score) in itch-related sleep loss (VAS) was -21.9
in the LEO 90100 group and -10.0 in the vehicle group. LEO 90100 was statistically
significantly more effective than vehicle at all visits. In the LEO 90100 group, 87 subjects
(35.5%) achieved 70% reduction on Day 3. Responder rates in the LEO 90100 group
increased successively during the course of the trial, and at Week 4, 172 subjects (70.8%)
had obtained 70% reduction in itch-related sleep loss versus 33 (39.8%) in the vehicle
group. The odds ratio for achieving 70% reduction in itch-related sleep loss in the LEO
90100 group relative to the vehicle group (adjusted for pooled centres) was statistically
significant at all visits.
Statistically significantly greater improvement in quality of life (as measured by DLQI)
was demonstrated for LEO 90100 versus vehicle at all visits (p<0.001).
For EQ-5D-5L, subjects evaluated significantly improvements for the dimension
pain/discomfort. In the LEO 90100 group, the proportion of subjects evaluating their
pain/discomfort as non-existing increased from 30.1% at baseline to 68.4% at Week 4, and
the difference between treatment groups was statistically significant (p<0.001) at Week 4.
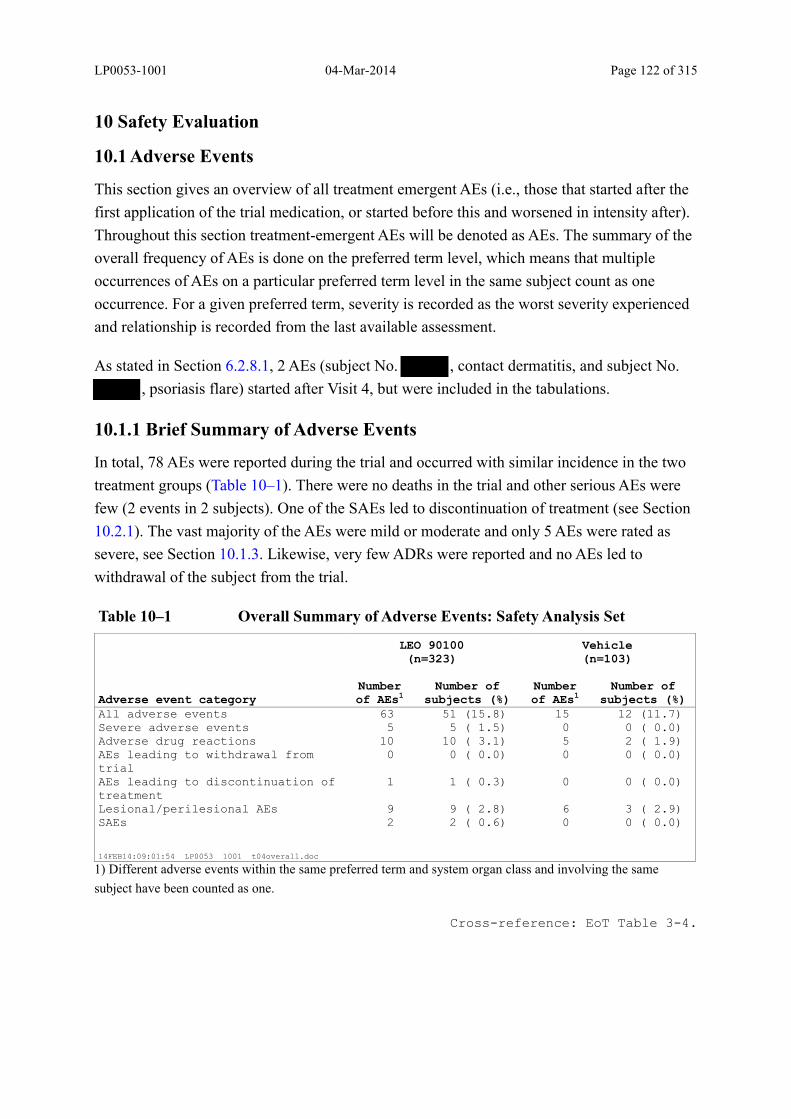
LP0053-1001 04-Mar-2014 Page 122 of 315
10 Safety Evaluation
10.1 Adverse Events
This section gives an overview of all treatment emergent AEs (i.e., those that started after the
first application of the trial medication, or started before this and worsened in intensity after).
Throughout this section treatment-emergent AEs will be denoted as AEs. The summary of the
overall frequency of AEs is done on the preferred term level, which means that multiple
occurrences of AEs on a particular preferred term level in the same subject count as one
occurrence. For a given preferred term, severity is recorded as the worst severity experienced
and relationship is recorded from the last available assessment.
As stated in Section 6.2.8.1, 2 AEs (subject No. , contact dermatitis, and subject No.
, psoriasis flare) started after Visit 4, but were included in the tabulations.
10.1.1 Brief Summary of Adverse Events
In total, 78 AEs were reported during the trial and occurred with similar incidence in the two
treatment groups (Table 10–1). There were no deaths in the trial and other serious AEs were
few (2 events in 2 subjects). One of the SAEs led to discontinuation of treatment (see Section
10.2.1). The vast majority of the AEs were mild or moderate and only 5 AEs were rated as
severe, see Section 10.1.3. Likewise, very few ADRs were reported and no AEs led to
withdrawal of the subject from the trial.
Table 10–1 Overall Summary of Adverse Events: Safety Analysis Set
LEO 90100(n=323)
Vehicle(n=103)
Adverse event categoryNumberof AEs1
Number of subjects (%)
Numberof AEs1
Number of subjects (%)
All adverse events 63 51 (15.8) 15 12 (11.7) Severe adverse events 5 5 ( 1.5) 0 0 ( 0.0) Adverse drug reactions 10 10 ( 3.1) 5 2 ( 1.9) AEs leading to withdrawal from trial
0 0 ( 0.0) 0 0 ( 0.0)
AEs leading to discontinuation of treatment
1 1 ( 0.3) 0 0 ( 0.0)
Lesional/perilesional AEs 9 9 ( 2.8) 6 3 ( 2.9) SAEs 2 2 ( 0.6) 0 0 ( 0.0)
14FEB14:09:01:54 LP0053 1001 t04overall.doc
1) Different adverse events within the same preferred term and system organ class and involving the same
subject have been counted as one.
Cross-reference: EoT Table 3-4.

LP0053-1001 04-Mar-2014 Page 123 of 315
10.1.2 Incidence of Adverse Events
The incidence of AEs is presented by MedDRA SOC in Table 10–2 and by MedDRA SOC
and preferred term in Table 10–3.
The overall incidence of AEs was low and comparable between treatment groups, with 51
(15.8%) of subjects in the LEO 90100 group and 12 (11.7%) subjects in the vehicle group.
AEs were most frequently reported in the SOCs ‘Infections and infestations’, and ‘General
disorders and administration site conditions’. In these 2 SOCs, ‘nasopharyngitis’ was reported
by 6 subjects (1.9%) in the LEO 90100 group and ‘application site pain’ was reported by 3
subjects (0.9%) in the LEO 90100 group and 2 subjects (1.9%) in the vehicle group (Table
10–3). The remaining individual AEs in the 2 SOCs were reported by single subjects.
Few AEs were reported in the remaining SOCs.
Individual AE data are listed in Appendix 2.7.
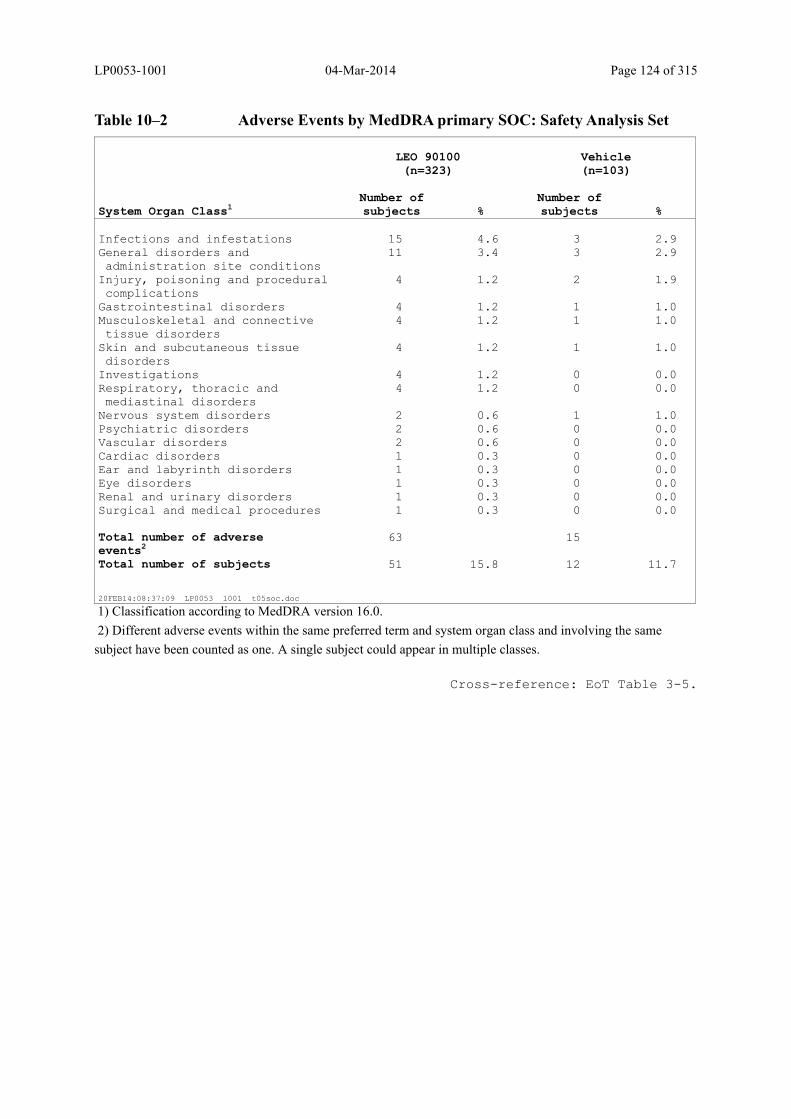
LP0053-1001 04-Mar-2014 Page 124 of 315
Table 10–2 Adverse Events by MedDRA primary SOC: Safety Analysis Set
LEO 90100(n=323)
Vehicle(n=103)
System Organ Class1Number of subjects %
Number of subjects %
Infections and infestations 15 4.6 3 2.9General disorders andadministration site conditions
11 3.4 3 2.9
Injury, poisoning and proceduralcomplications
4 1.2 2 1.9
Gastrointestinal disorders 4 1.2 1 1.0Musculoskeletal and connectivetissue disorders
4 1.2 1 1.0
Skin and subcutaneous tissuedisorders
4 1.2 1 1.0
Investigations 4 1.2 0 0.0Respiratory, thoracic andmediastinal disorders
4 1.2 0 0.0
Nervous system disorders 2 0.6 1 1.0Psychiatric disorders 2 0.6 0 0.0Vascular disorders 2 0.6 0 0.0Cardiac disorders 1 0.3 0 0.0Ear and labyrinth disorders 1 0.3 0 0.0Eye disorders 1 0.3 0 0.0Renal and urinary disorders 1 0.3 0 0.0Surgical and medical procedures 1 0.3 0 0.0 Total number of adverseevents2
63 15
Total number of subjects 51 15.8 12 11.7
20FEB14:08:37:09 LP0053 1001 t05soc.doc
1) Classification according to MedDRA version 16.0.
2) Different adverse events within the same preferred term and system organ class and involving the same
subject have been counted as one. A single subject could appear in multiple classes.
Cross-reference: EoT Table 3-5.

LP0053-1001 04-Mar-2014 Page 125 of 315
Table 10–3 Adverse Events by SOC and Preferred Term: Safety Analysis Set
LEO 90100(n=323)
Vehicle(n=103)
System Organ Class (SOC)Preferred Term1
Number of subjects %
Number of subjects %
Infections and infestationsNasopharyngitis 6 1.9 0 0.0Cellulitis 1 0.3 0 0.0Eye infection 0 0.0 1 1.0Folliculitis 1 0.3 0 0.0Fungal skin infection 1 0.3 0 0.0Gastroenteritis viral 0 0.0 1 1.0Groin abscess 1 0.3 0 0.0Hordeolum 1 0.3 0 0.0Rhinitis 1 0.3 0 0.0Streptococcal infection 0 0.0 1 1.0Tinea cruris 1 0.3 0 0.0Tooth abscess 1 0.3 0 0.0Upper respiratory tractinfection
1 0.3 0 0.0
SOC total 15 4.6 3 2.9General disorders and administration siteconditionsApplication site pain 3 0.9 2 1.9Application sitediscolouration
1 0.3 0 0.0
Application site dryness 0 0.0 1 1.0Application site erosion 0 0.0 1 1.0Application siteerythema
0 0.0 1 1.0
Application siteirritation
1 0.3 0 0.0
Application site oedema 0 0.0 1 1.0Application sitepruritus
1 0.3 0 0.0
Application sitereaction
1 0.3 0 0.0
Influenza like illness 1 0.3 0 0.0Oedema peripheral 1 0.3 0 0.0Pain 1 0.3 0 0.0Thirst 1 0.3 0 0.0SOC total 11 3.4 3 2.9
14FEB14:08:56:03 LP0053 1001 t06socterm.doc Continued...
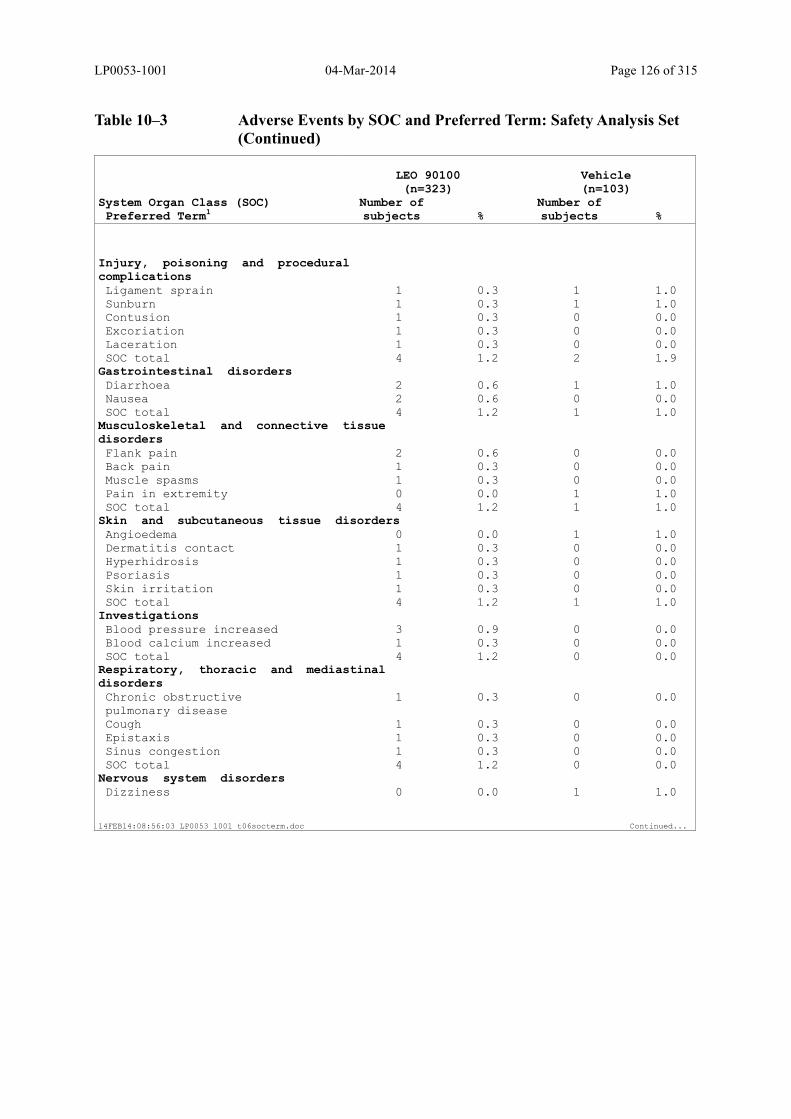
LP0053-1001 04-Mar-2014 Page 126 of 315
Table 10–3 Adverse Events by SOC and Preferred Term: Safety Analysis Set (Continued)
LEO 90100(n=323)
Vehicle(n=103)
System Organ Class (SOC)Preferred Term1
Number of subjects %
Number of subjects %
Injury, poisoning and proceduralcomplicationsLigament sprain 1 0.3 1 1.0Sunburn 1 0.3 1 1.0Contusion 1 0.3 0 0.0Excoriation 1 0.3 0 0.0Laceration 1 0.3 0 0.0SOC total 4 1.2 2 1.9
Gastrointestinal disordersDiarrhoea 2 0.6 1 1.0Nausea 2 0.6 0 0.0SOC total 4 1.2 1 1.0
Musculoskeletal and connective tissuedisordersFlank pain 2 0.6 0 0.0Back pain 1 0.3 0 0.0Muscle spasms 1 0.3 0 0.0Pain in extremity 0 0.0 1 1.0SOC total 4 1.2 1 1.0
Skin and subcutaneous tissue disordersAngioedema 0 0.0 1 1.0Dermatitis contact 1 0.3 0 0.0Hyperhidrosis 1 0.3 0 0.0Psoriasis 1 0.3 0 0.0Skin irritation 1 0.3 0 0.0SOC total 4 1.2 1 1.0
InvestigationsBlood pressure increased 3 0.9 0 0.0Blood calcium increased 1 0.3 0 0.0SOC total 4 1.2 0 0.0
Respiratory, thoracic and mediastinaldisordersChronic obstructivepulmonary disease
1 0.3 0 0.0
Cough 1 0.3 0 0.0Epistaxis 1 0.3 0 0.0Sinus congestion 1 0.3 0 0.0SOC total 4 1.2 0 0.0
Nervous system disordersDizziness 0 0.0 1 1.0
14FEB14:08:56:03 LP0053 1001 t06socterm.doc Continued...
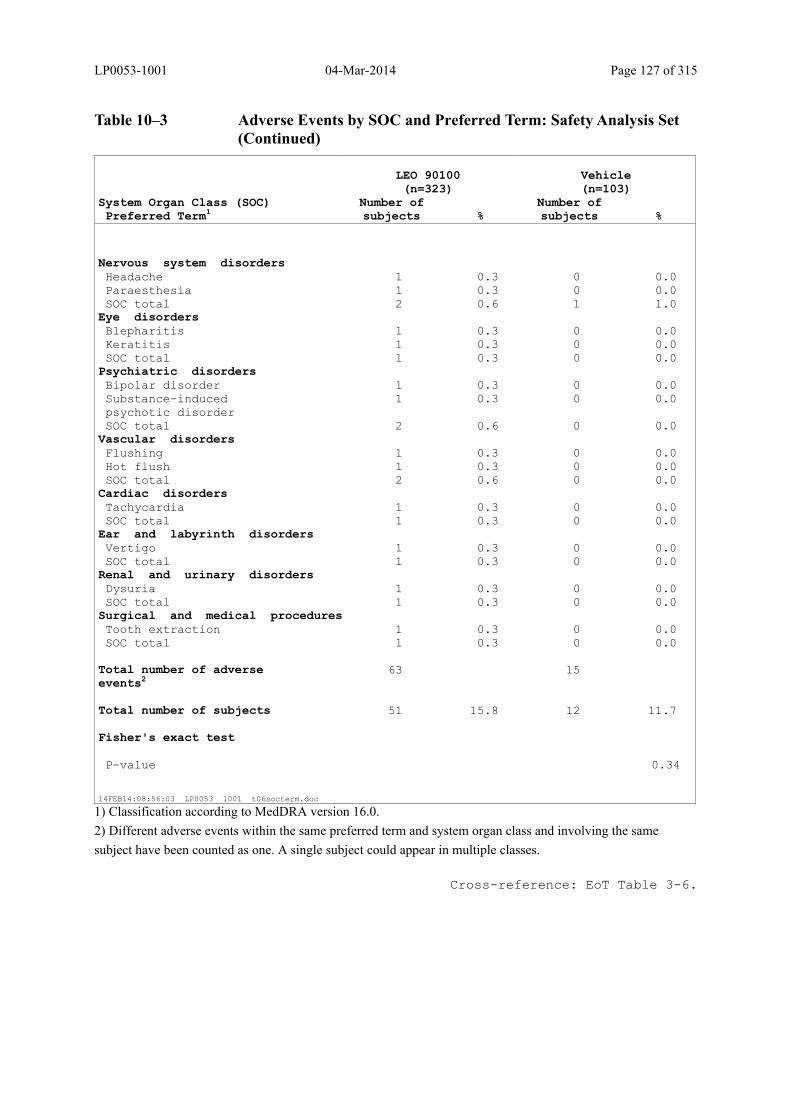
LP0053-1001 04-Mar-2014 Page 127 of 315
Table 10–3 Adverse Events by SOC and Preferred Term: Safety Analysis Set (Continued)
LEO 90100(n=323)
Vehicle(n=103)
System Organ Class (SOC)Preferred Term1
Number of subjects %
Number of subjects %
Nervous system disordersHeadache 1 0.3 0 0.0Paraesthesia 1 0.3 0 0.0SOC total 2 0.6 1 1.0
Eye disordersBlepharitis 1 0.3 0 0.0Keratitis 1 0.3 0 0.0SOC total 1 0.3 0 0.0
Psychiatric disordersBipolar disorder 1 0.3 0 0.0Substance-inducedpsychotic disorder
1 0.3 0 0.0
SOC total 2 0.6 0 0.0Vascular disordersFlushing 1 0.3 0 0.0Hot flush 1 0.3 0 0.0SOC total 2 0.6 0 0.0
Cardiac disordersTachycardia 1 0.3 0 0.0SOC total 1 0.3 0 0.0
Ear and labyrinth disordersVertigo 1 0.3 0 0.0SOC total 1 0.3 0 0.0
Renal and urinary disordersDysuria 1 0.3 0 0.0SOC total 1 0.3 0 0.0
Surgical and medical proceduresTooth extraction 1 0.3 0 0.0SOC total 1 0.3 0 0.0
Total number of adverseevents2
63 15
Total number of subjects 51 15.8 12 11.7
Fisher's exact test
P-value 0.34
14FEB14:08:56:03 LP0053 1001 t06socterm.doc
1) Classification according to MedDRA version 16.0.
2) Different adverse events within the same preferred term and system organ class and involving the same
subject have been counted as one. A single subject could appear in multiple classes.
Cross-reference: EoT Table 3-6.
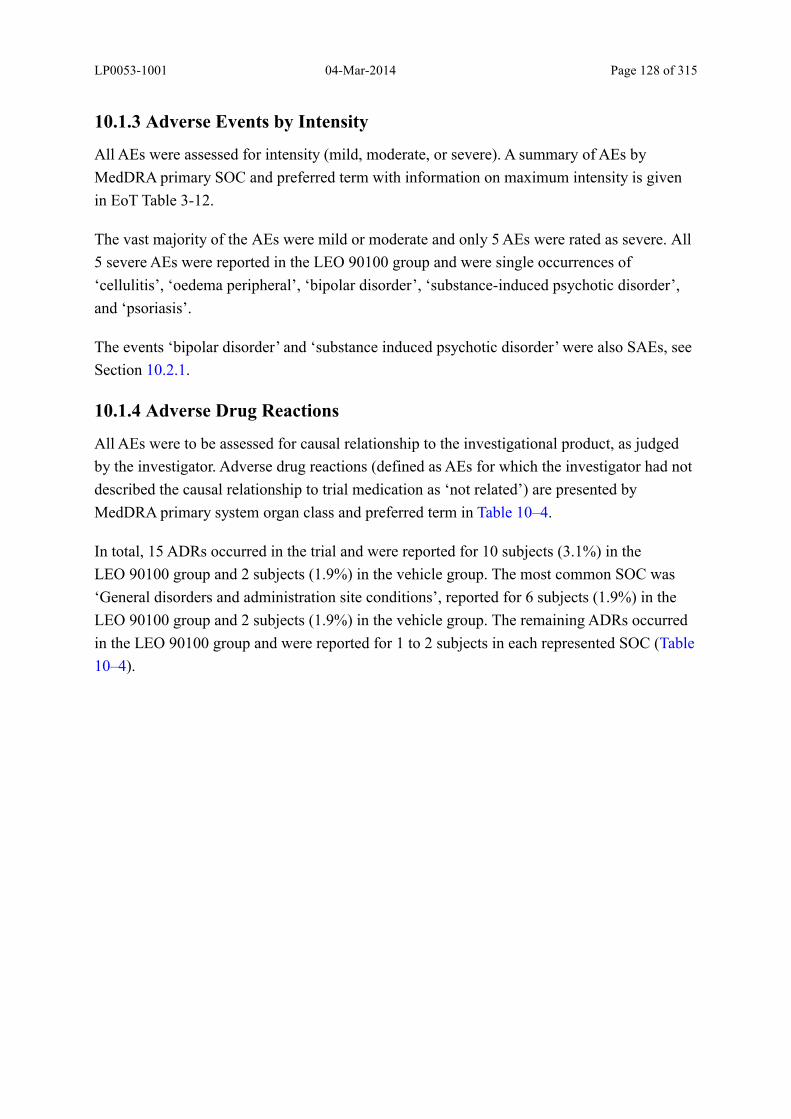
LP0053-1001 04-Mar-2014 Page 128 of 315
10.1.3 Adverse Events by Intensity
All AEs were assessed for intensity (mild, moderate, or severe). A summary of AEs by
MedDRA primary SOC and preferred term with information on maximum intensity is given
in EoT Table 3-12.
The vast majority of the AEs were mild or moderate and only 5 AEs were rated as severe. All
5 severe AEs were reported in the LEO 90100 group and were single occurrences of
‘cellulitis’, ‘oedema peripheral’, ‘bipolar disorder’, ‘substance-induced psychotic disorder’,
and ‘psoriasis’.
The events ‘bipolar disorder’ and ‘substance induced psychotic disorder’ were also SAEs, see
Section 10.2.1.
10.1.4 Adverse Drug Reactions
All AEs were to be assessed for causal relationship to the investigational product, as judged
by the investigator. Adverse drug reactions (defined as AEs for which the investigator had not
described the causal relationship to trial medication as ‘not related’) are presented by
MedDRA primary system organ class and preferred term in Table 10–4.
In total, 15 ADRs occurred in the trial and were reported for 10 subjects (3.1%) in the
LEO 90100 group and 2 subjects (1.9%) in the vehicle group. The most common SOC was
‘General disorders and administration site conditions’, reported for 6 subjects (1.9%) in the
LEO 90100 group and 2 subjects (1.9%) in the vehicle group. The remaining ADRs occurred
in the LEO 90100 group and were reported for 1 to 2 subjects in each represented SOC (Table
10–4).
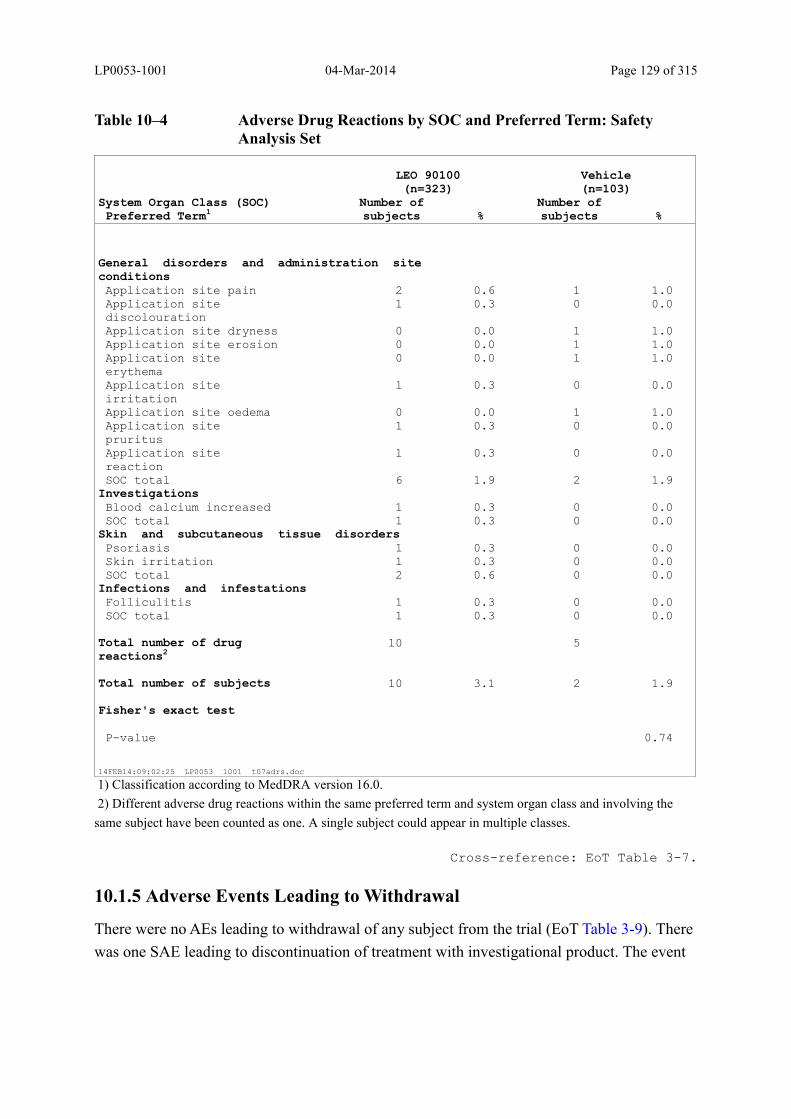
LP0053-1001 04-Mar-2014 Page 129 of 315
Table 10–4 Adverse Drug Reactions by SOC and Preferred Term: Safety Analysis Set
LEO 90100(n=323)
Vehicle(n=103)
System Organ Class (SOC)Preferred Term1
Number of subjects %
Number of subjects %
General disorders and administration siteconditionsApplication site pain 2 0.6 1 1.0Application sitediscolouration
1 0.3 0 0.0
Application site dryness 0 0.0 1 1.0Application site erosion 0 0.0 1 1.0Application siteerythema
0 0.0 1 1.0
Application siteirritation
1 0.3 0 0.0
Application site oedema 0 0.0 1 1.0Application sitepruritus
1 0.3 0 0.0
Application sitereaction
1 0.3 0 0.0
SOC total 6 1.9 2 1.9InvestigationsBlood calcium increased 1 0.3 0 0.0SOC total 1 0.3 0 0.0
Skin and subcutaneous tissue disordersPsoriasis 1 0.3 0 0.0Skin irritation 1 0.3 0 0.0SOC total 2 0.6 0 0.0
Infections and infestationsFolliculitis 1 0.3 0 0.0SOC total 1 0.3 0 0.0
Total number of drugreactions2
10 5
Total number of subjects 10 3.1 2 1.9
Fisher's exact test
P-value 0.74
14FEB14:09:02:25 LP0053 1001 t07adrs.doc
1) Classification according to MedDRA version 16.0.
2) Different adverse drug reactions within the same preferred term and system organ class and involving the
same subject have been counted as one. A single subject could appear in multiple classes.
Cross-reference: EoT Table 3-7.
10.1.5 Adverse Events Leading to Withdrawal
There were no AEs leading to withdrawal of any subject from the trial (EoT Table 3-9). There
was one SAE leading to discontinuation of treatment with investigational product. The event
LP0053-1001 04-Mar-2014 Page 130 of 315
was assessed as unrelated to trial medication by the investigator and is further described in
Section 10.2.1.
10.2 Deaths, other Serious Adverse Events, and other Significant Adverse
Events
10.2.1 Narratives of Serious Adverse Events
There were no deaths in the trial. Two SAEs were reported. Narratives are given below.
Subject number: Treatment group: LEO 90100
SAE: Substance induced psychotic disorder/ severe
This case concerns a diagnosed with psoriasis vulgaris and topically
treated with LEO 90100 once daily from to . Relevant medical
history included post-traumatic stress disorder from . Relevant current
medical conditions included bipolar disorder from insomnia from obsessive
compulsive disorder from depression, anxiety, and sciatica. Concomitant medication
included duloxetine hydrochloride 90mg once daily from for depression; esomeprazole
magnesium 40mg as required from for GERD; propranolol 40mg twice daily from
for anxiety and ibuprofen 220mg, as required from for left shoulder tendonitis and
sciatica. On , the subject had a nervous breakdown and was overdosed with an
unknown drug. The subject was hospitalised on the same day and remained in the psychiatric
ward for evaluation. Treatment with investigational product was discontinued. It was reported
that the subject did not attend the scheduled follow up appointment. Several attempts were
made to contact the subject, but the subject was lost to follow up. The outcome of the AE is
unknown as the subject was lost to follow-up. Causality per investigator: not related.
Causality per sponsor: not related.
Subject number: Treatment group: LEO 90100
SAE: Bipolar disorder/ severe
This case concerns a diagnosed with psoriasis vulgaris and topically treated
with LEO 90100 once daily from to . Relevant current medical
conditions included bipolar disorder from . Concomitant medication included
alprazolam 1 mg daily from for sleep disorder; trazodone 50 mg daily from for
sleep disorder; methadone 20 mg daily from to aid weaning off pain medication;
methadone 10 mg daily, from an unknown date in for pain management; doxepin 25 mg
from for insomnia; and risperidone 2 mg from for bipolar disorder.
LP0053-1001 04-Mar-2014 Page 131 of 315
On , the subject was hospitalised with an episode of psychiatric instability.
Initially the subject was suspected of having an opioid induced mood disorder, but the final
diagnosis was 'bipolar disorder not otherwise specified'. , the subject was
discharged from the hospital as recovered and the subject continued in the trial. Causality per
investigator: not related. Causality per sponsor: not related.
10.2.2 Lesional/Perilesional Adverse Events
In total, 15 lesional/perilesional AEs occurred in the trial and were reported in 9 subjects
(2.8%) in the LEO 90100 group and 3 subjects (2.9%) in the vehicle group. The most
commonly reported lesional/perilesional AE was‘application site pain’, reported by 3 subjects
(0.9%) in the LEO 90100 group and 2 subjects (1.9%) in the vehicle group. The remaining
individual lesional/perilesional AEs were reported by single subjects. (Table 10–5).
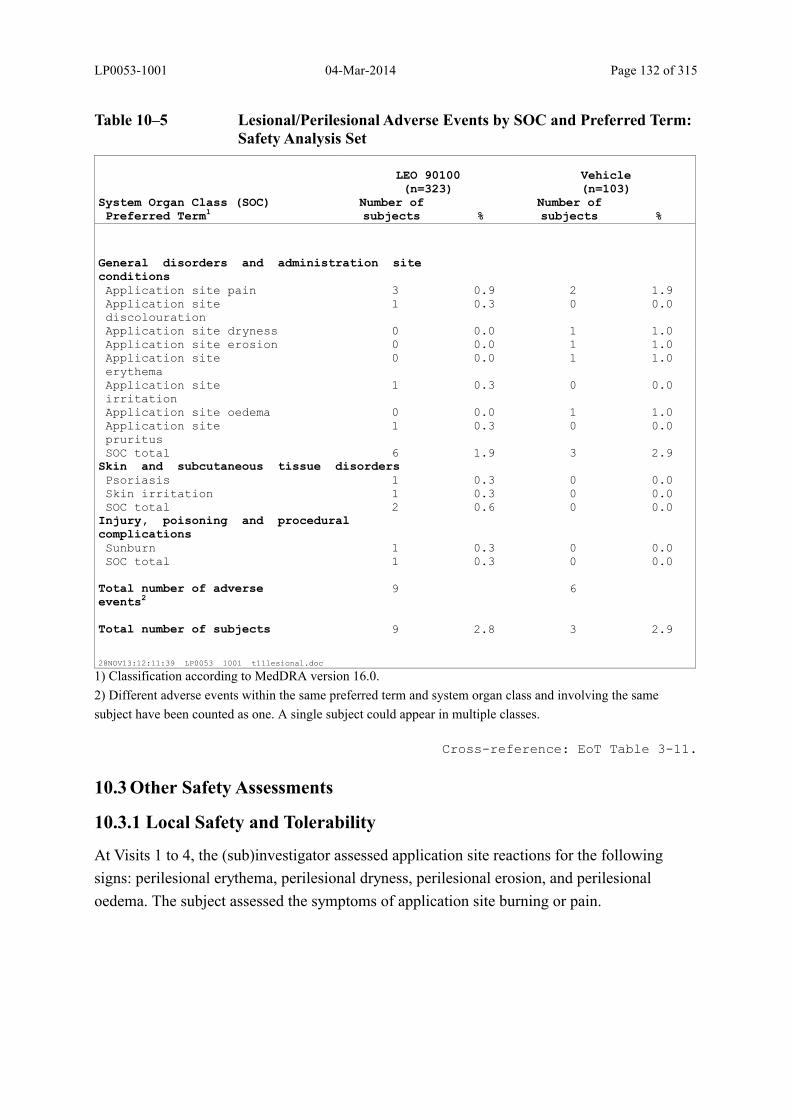
LP0053-1001 04-Mar-2014 Page 132 of 315
Table 10–5 Lesional/Perilesional Adverse Events by SOC and Preferred Term: Safety Analysis Set
LEO 90100(n=323)
Vehicle(n=103)
System Organ Class (SOC)Preferred Term1
Number of subjects %
Number of subjects %
General disorders and administration siteconditionsApplication site pain 3 0.9 2 1.9Application sitediscolouration
1 0.3 0 0.0
Application site dryness 0 0.0 1 1.0Application site erosion 0 0.0 1 1.0Application siteerythema
0 0.0 1 1.0
Application siteirritation
1 0.3 0 0.0
Application site oedema 0 0.0 1 1.0Application sitepruritus
1 0.3 0 0.0
SOC total 6 1.9 3 2.9Skin and subcutaneous tissue disordersPsoriasis 1 0.3 0 0.0Skin irritation 1 0.3 0 0.0SOC total 2 0.6 0 0.0
Injury, poisoning and proceduralcomplicationsSunburn 1 0.3 0 0.0SOC total 1 0.3 0 0.0
Total number of adverseevents2
9 6
Total number of subjects 9 2.8 3 2.9
28NOV13:12:11:39 LP0053 1001 t11lesional.doc
1) Classification according to MedDRA version 16.0.
2) Different adverse events within the same preferred term and system organ class and involving the same
subject have been counted as one. A single subject could appear in multiple classes.
Cross-reference: EoT Table 3-11.
10.3 Other Safety Assessments
10.3.1 Local Safety and Tolerability
At Visits 1 to 4, the (sub)investigator assessed application site reactions for the following
signs: perilesional erythema, perilesional dryness, perilesional erosion, and perilesional
oedema. The subject assessed the symptoms of application site burning or pain.

LP0053-1001 04-Mar-2014 Page 133 of 315
The five assessments of local safety and tolerability are summarised by severity for each
treatment group and by visit in Table 10–6. The assessments are presented graphically in
Figure 10–1.
Local reactions were few and occurred with similar frequency in the two treatment groups.
The most frequently reported local reactions were erythema, dryness, and burning/pain
(Figure 10–1). The majority of local reactions were mild or moderate (Table 10–6).

LP0053-1001 04-Mar-2014 Page 134 of 315
Table 10–6 Local Safety and Tolerability by Visit: Safety Analysis Set
LEO 90100(n=323)
Vehicle(n=103)
VisitAssessment
Number of subjects %
Number of subjects %
Perilesional erythemaBaseline
Absent 300 92.9 98 95.1 Mild 15 4.6 1 1.0 Moderate 8 2.5 4 3.9 Severe 0 0.0 0 0.0 Total 323 100.0 103 100.0 Week 1
Absent 295 93.4 90 88.2 Mild 17 5.4 8 7.8 Moderate 3 0.9 3 2.9 Severe 1 0.3 1 1.0 Total 316 100.0 102 100.0 Week 2
Absent 301 95.6 93 92.1 Mild 10 3.2 5 5.0 Moderate 3 1.0 2 2.0 Severe 1 0.3 1 1.0 Total 315 100.0 101 100.0 Week 4
Absent 307 98.1 97 98.0 Mild 6 1.9 2 2.0 Moderate 0 0.0 0 0.0 Severe 0 0.0 0 0.0 Total 313 100.0 99 100.0
Perilesional drynessBaseline
Absent 293 90.7 96 93.2 Mild 18 5.6 3 2.9 Moderate 10 3.1 4 3.9 Severe 2 0.6 0 0.0 Total 323 100.0 103 100.0 Week 1
Absent 286 90.5 91 89.2 Mild 22 7.0 8 7.8 Moderate 8 2.5 2 2.0 Severe 0 0.0 1 1.0 Total 316 100.0 102 100.0
29NOV13:10:16:28 LP0053 1001 t14local.doc Continued...
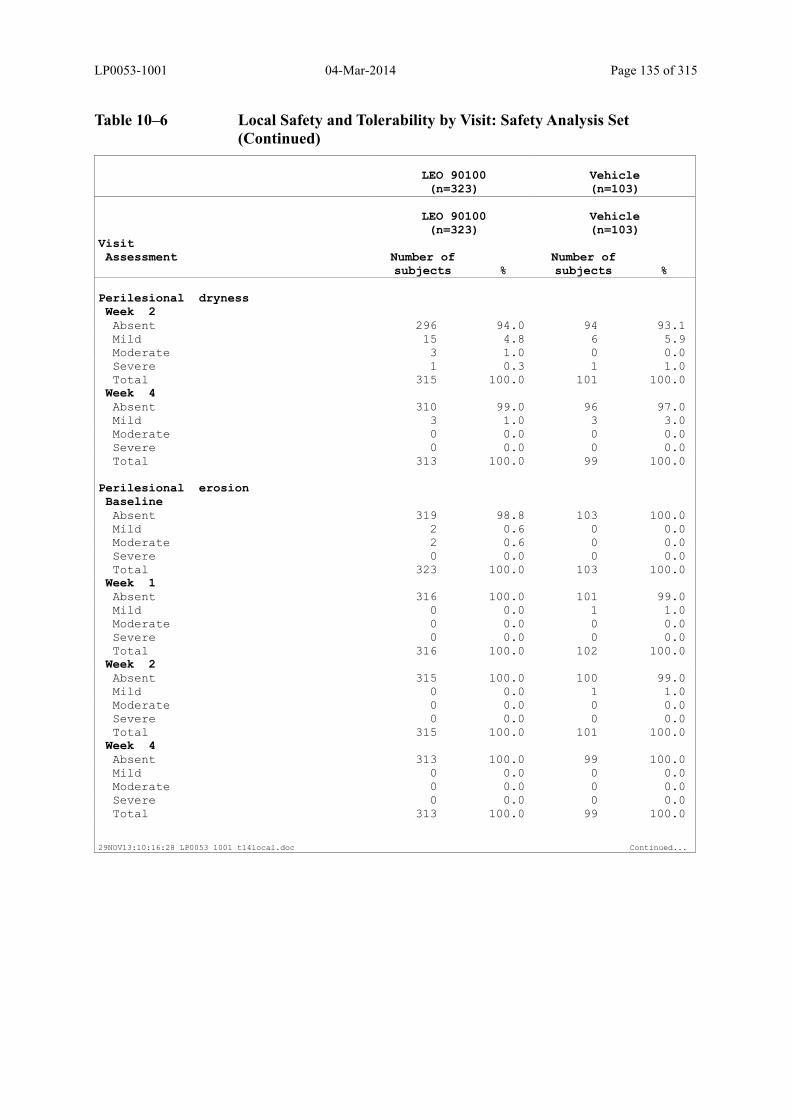
LP0053-1001 04-Mar-2014 Page 135 of 315
Table 10–6 Local Safety and Tolerability by Visit: Safety Analysis Set (Continued)
LEO 90100(n=323)
Vehicle(n=103)
LEO 90100(n=323)
Vehicle(n=103)
VisitAssessment
Number of subjects %
Number of subjects %
Perilesional drynessWeek 2
Absent 296 94.0 94 93.1 Mild 15 4.8 6 5.9 Moderate 3 1.0 0 0.0 Severe 1 0.3 1 1.0 Total 315 100.0 101 100.0 Week 4
Absent 310 99.0 96 97.0 Mild 3 1.0 3 3.0 Moderate 0 0.0 0 0.0 Severe 0 0.0 0 0.0 Total 313 100.0 99 100.0
Perilesional erosionBaseline
Absent 319 98.8 103 100.0 Mild 2 0.6 0 0.0 Moderate 2 0.6 0 0.0 Severe 0 0.0 0 0.0 Total 323 100.0 103 100.0 Week 1
Absent 316 100.0 101 99.0 Mild 0 0.0 1 1.0 Moderate 0 0.0 0 0.0 Severe 0 0.0 0 0.0 Total 316 100.0 102 100.0 Week 2
Absent 315 100.0 100 99.0 Mild 0 0.0 1 1.0 Moderate 0 0.0 0 0.0 Severe 0 0.0 0 0.0 Total 315 100.0 101 100.0 Week 4
Absent 313 100.0 99 100.0 Mild 0 0.0 0 0.0 Moderate 0 0.0 0 0.0 Severe 0 0.0 0 0.0 Total 313 100.0 99 100.0
29NOV13:10:16:28 LP0053 1001 t14local.doc Continued...
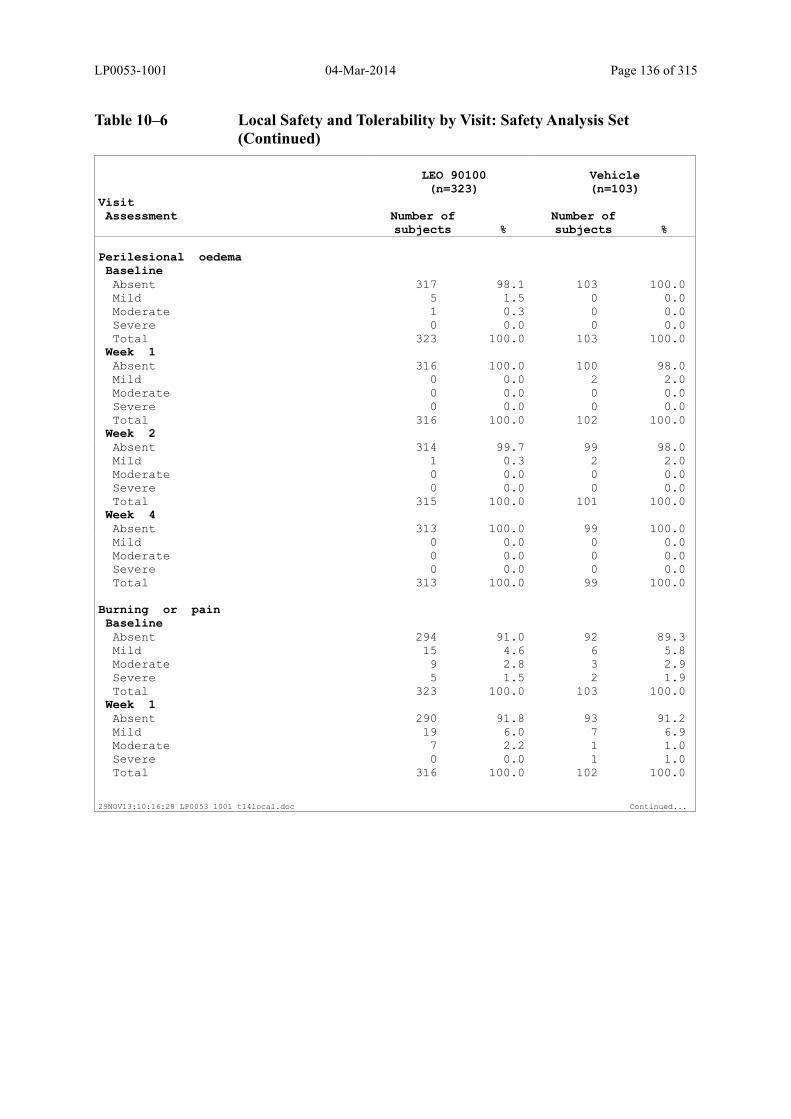
LP0053-1001 04-Mar-2014 Page 136 of 315
Table 10–6 Local Safety and Tolerability by Visit: Safety Analysis Set (Continued)
LEO 90100(n=323)
Vehicle(n=103)
VisitAssessment
Number of subjects %
Number of subjects %
Perilesional oedemaBaseline
Absent 317 98.1 103 100.0 Mild 5 1.5 0 0.0 Moderate 1 0.3 0 0.0 Severe 0 0.0 0 0.0 Total 323 100.0 103 100.0 Week 1
Absent 316 100.0 100 98.0 Mild 0 0.0 2 2.0 Moderate 0 0.0 0 0.0 Severe 0 0.0 0 0.0 Total 316 100.0 102 100.0 Week 2
Absent 314 99.7 99 98.0 Mild 1 0.3 2 2.0 Moderate 0 0.0 0 0.0 Severe 0 0.0 0 0.0 Total 315 100.0 101 100.0 Week 4
Absent 313 100.0 99 100.0 Mild 0 0.0 0 0.0 Moderate 0 0.0 0 0.0 Severe 0 0.0 0 0.0 Total 313 100.0 99 100.0
Burning or painBaseline
Absent 294 91.0 92 89.3 Mild 15 4.6 6 5.8 Moderate 9 2.8 3 2.9 Severe 5 1.5 2 1.9 Total 323 100.0 103 100.0 Week 1
Absent 290 91.8 93 91.2 Mild 19 6.0 7 6.9 Moderate 7 2.2 1 1.0 Severe 0 0.0 1 1.0 Total 316 100.0 102 100.0
29NOV13:10:16:28 LP0053 1001 t14local.doc Continued...
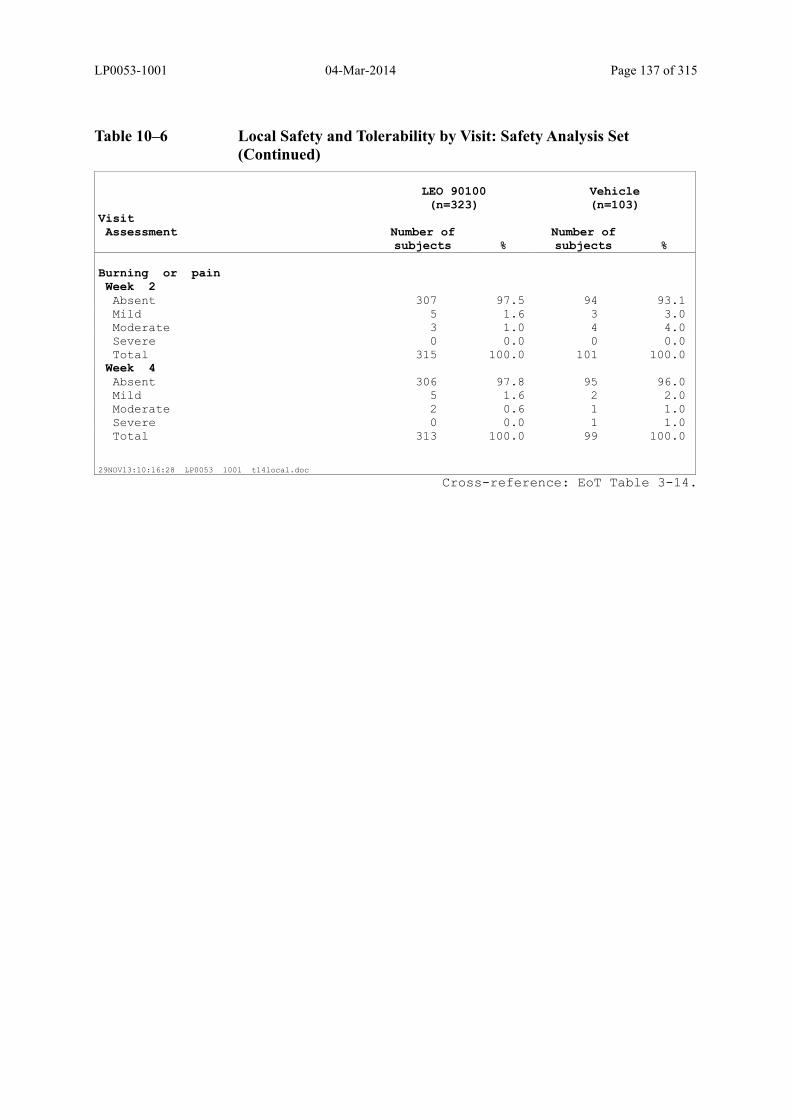
LP0053-1001 04-Mar-2014 Page 137 of 315
Table 10–6 Local Safety and Tolerability by Visit: Safety Analysis Set (Continued)
LEO 90100(n=323)
Vehicle(n=103)
VisitAssessment
Number of subjects %
Number of subjects %
Burning or painWeek 2
Absent 307 97.5 94 93.1 Mild 5 1.6 3 3.0 Moderate 3 1.0 4 4.0 Severe 0 0.0 0 0.0 Total 315 100.0 101 100.0 Week 4
Absent 306 97.8 95 96.0 Mild 5 1.6 2 2.0 Moderate 2 0.6 1 1.0 Severe 0 0.0 1 1.0 Total 313 100.0 99 100.0
29NOV13:10:16:28 LP0053 1001 t14local.doc
Cross-reference: EoT Table 3-14.
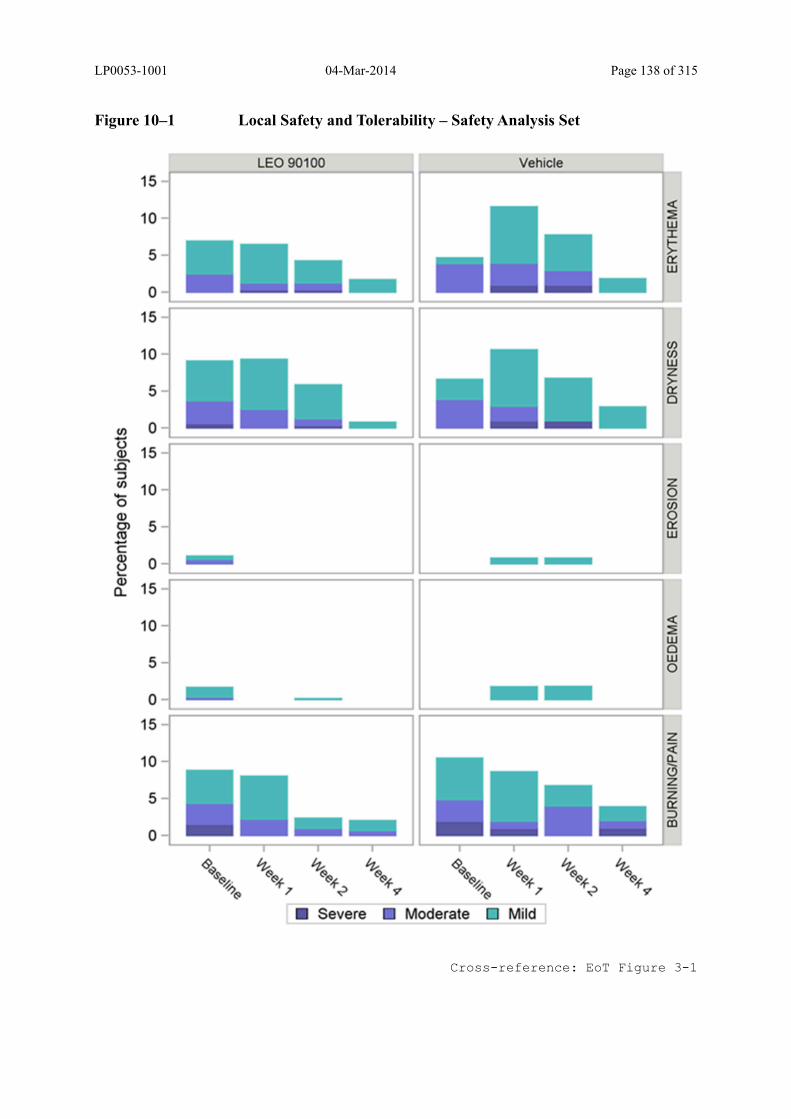
LP0053-1001 04-Mar-2014 Page 138 of 315
Figure 10–1 Local Safety and Tolerability – Safety Analysis Set
Cross-reference: EoT Figure 3-1
LEO 90100 Vehicle
15 <(
10 ~ w :I:
5 >= cr w
0
15
10 (/) (/) w z >-
5 0:: 0
(/) 0 --() 15 (1)
'E :J z (/) 10 - 0 0 u; (1) 0 0> 5 cr ('0 w 4J c (1) 0 () \... (1)
15 Q..
10 <( ~ w 0
5 w 0
0
15 z <(
10 Cl. -(!) z
5 z 0:: ::> m
0 T
~ % % % s~ % % % ~ ~ ~~ ~.f ~.f ~.f ~~ ~.f ~.f ~.f
"~ 7 .? v "~ 7 .;> v
Severe Moderate Mild
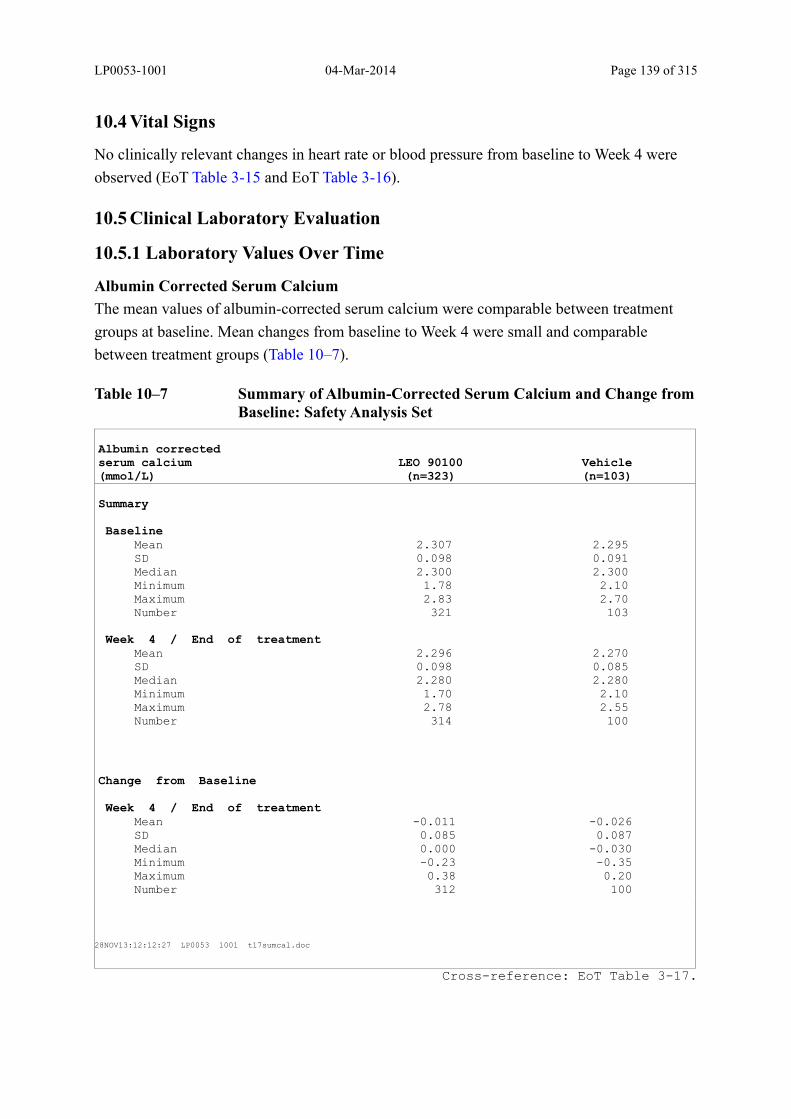
LP0053-1001 04-Mar-2014 Page 139 of 315
10.4 Vital Signs
No clinically relevant changes in heart rate or blood pressure from baseline to Week 4 were
observed (EoT Table 3-15 and EoT Table 3-16).
10.5 Clinical Laboratory Evaluation
10.5.1 Laboratory Values Over Time
Albumin Corrected Serum Calcium
The mean values of albumin-corrected serum calcium were comparable between treatment
groups at baseline. Mean changes from baseline to Week 4 were small and comparable
between treatment groups (Table 10–7).
Table 10–7 Summary of Albumin-Corrected Serum Calcium and Change from Baseline: Safety Analysis Set
Albumin correctedserum calcium(mmol/L)
LEO 90100(n=323)
Vehicle(n=103)
Summary
Baseline Mean 2.307 2.295 SD 0.098 0.091 Median 2.300 2.300 Minimum 1.78 2.10 Maximum 2.83 2.70 Number 321 103
Week 4 / End of treatment Mean 2.296 2.270 SD 0.098 0.085 Median 2.280 2.280 Minimum 1.70 2.10 Maximum 2.78 2.55 Number 314 100
Change from Baseline
Week 4 / End of treatment Mean -0.011 -0.026 SD 0.085 0.087 Median 0.000 -0.030 Minimum -0.23 -0.35 Maximum 0.38 0.20 Number 312 100
28NOV13:12:12:27 LP0053 1001 t17sumcal.doc
Cross-reference: EoT Table 3-17.
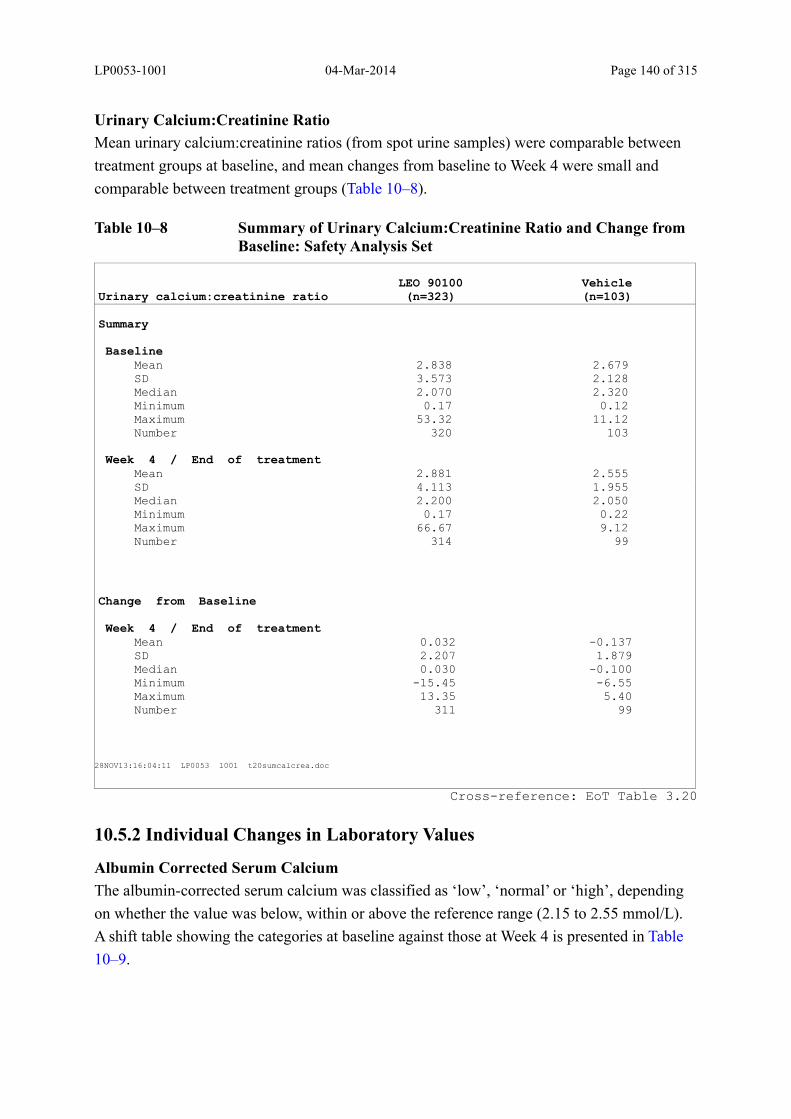
LP0053-1001 04-Mar-2014 Page 140 of 315
Urinary Calcium:Creatinine Ratio
Mean urinary calcium:creatinine ratios (from spot urine samples) were comparable between
treatment groups at baseline, and mean changes from baseline to Week 4 were small and
comparable between treatment groups (Table 10–8).
Table 10–8 Summary of Urinary Calcium:Creatinine Ratio and Change from Baseline: Safety Analysis Set
Urinary calcium:creatinine ratioLEO 90100(n=323)
Vehicle(n=103)
Summary
Baseline Mean 2.838 2.679 SD 3.573 2.128 Median 2.070 2.320 Minimum 0.17 0.12 Maximum 53.32 11.12 Number 320 103
Week 4 / End of treatment Mean 2.881 2.555 SD 4.113 1.955 Median 2.200 2.050 Minimum 0.17 0.22 Maximum 66.67 9.12 Number 314 99
Change from Baseline
Week 4 / End of treatment Mean 0.032 -0.137 SD 2.207 1.879 Median 0.030 -0.100 Minimum -15.45 -6.55 Maximum 13.35 5.40 Number 311 99
28NOV13:16:04:11 LP0053 1001 t20sumcalcrea.doc
Cross-reference: EoT Table 3.20
10.5.2 Individual Changes in Laboratory Values
Albumin Corrected Serum Calcium
The albumin-corrected serum calcium was classified as ‘low’, ‘normal’ or ‘high’, depending
on whether the value was below, within or above the reference range (2.15 to 2.55 mmol/L).
A shift table showing the categories at baseline against those at Week 4 is presented in Table
10–9.
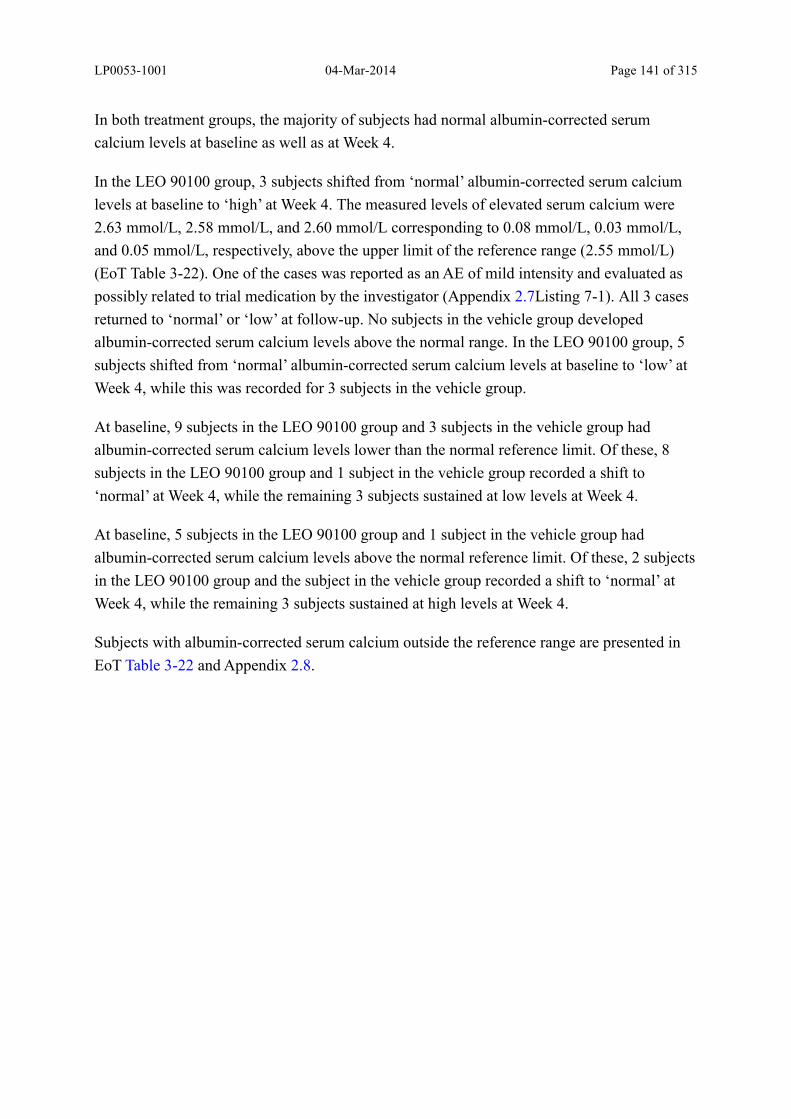
LP0053-1001 04-Mar-2014 Page 141 of 315
In both treatment groups, the majority of subjects had normal albumin-corrected serum
calcium levels at baseline as well as at Week 4.
In the LEO 90100 group, 3 subjects shifted from ‘normal’ albumin-corrected serum calcium
levels at baseline to ‘high’ at Week 4. The measured levels of elevated serum calcium were
2.63 mmol/L, 2.58 mmol/L, and 2.60 mmol/L corresponding to 0.08 mmol/L, 0.03 mmol/L,
and 0.05 mmol/L, respectively, above the upper limit of the reference range (2.55 mmol/L)
(EoT Table 3-22). One of the cases was reported as an AE of mild intensity and evaluated as
possibly related to trial medication by the investigator (Appendix 2.7Listing 7-1). All 3 cases
returned to ‘normal’ or ‘low’ at follow-up. No subjects in the vehicle group developed
albumin-corrected serum calcium levels above the normal range. In the LEO 90100 group, 5
subjects shifted from ‘normal’ albumin-corrected serum calcium levels at baseline to ‘low’ at
Week 4, while this was recorded for 3 subjects in the vehicle group.
At baseline, 9 subjects in the LEO 90100 group and 3 subjects in the vehicle group had
albumin-corrected serum calcium levels lower than the normal reference limit. Of these, 8
subjects in the LEO 90100 group and 1 subject in the vehicle group recorded a shift to
‘normal’ at Week 4, while the remaining 3 subjects sustained at low levels at Week 4.
At baseline, 5 subjects in the LEO 90100 group and 1 subject in the vehicle group had
albumin-corrected serum calcium levels above the normal reference limit. Of these, 2 subjects
in the LEO 90100 group and the subject in the vehicle group recorded a shift to ‘normal’ at
Week 4, while the remaining 3 subjects sustained at high levels at Week 4.
Subjects with albumin-corrected serum calcium outside the reference range are presented in
EoT Table 3-22 and Appendix 2.8.
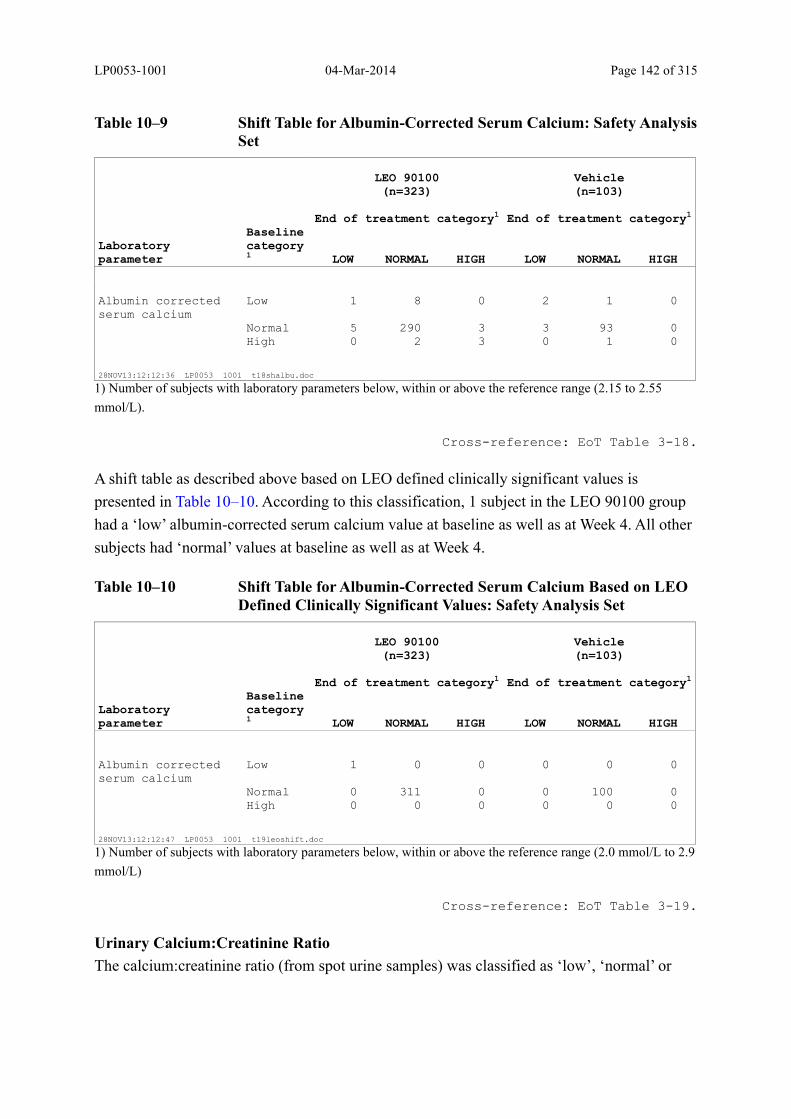
LP0053-1001 04-Mar-2014 Page 142 of 315
Table 10–9 Shift Table for Albumin-Corrected Serum Calcium: Safety Analysis Set
LEO 90100(n=323)
End of treatment category1
Vehicle(n=103)
End of treatment category1
Laboratory parameter
Baseline category1 LOW NORMAL HIGH LOW NORMAL HIGH
Albumin corrected serum calcium
Low 1 8 0 2 1 0
Normal 5 290 3 3 93 0High 0 2 3 0 1 0
28NOV13:12:12:36 LP0053 1001 t18shalbu.doc
1) Number of subjects with laboratory parameters below, within or above the reference range (2.15 to 2.55
mmol/L).
Cross-reference: EoT Table 3-18.
A shift table as described above based on LEO defined clinically significant values is
presented in Table 10–10. According to this classification, 1 subject in the LEO 90100 group
had a ‘low’ albumin-corrected serum calcium value at baseline as well as at Week 4. All other
subjects had ‘normal’ values at baseline as well as at Week 4.
Table 10–10 Shift Table for Albumin-Corrected Serum Calcium Based on LEO Defined Clinically Significant Values: Safety Analysis Set
LEO 90100(n=323)
End of treatment category1
Vehicle(n=103)
End of treatment category1
Laboratory parameter
Baseline category1 LOW NORMAL HIGH LOW NORMAL HIGH
Albumin corrected serum calcium
Low 1 0 0 0 0 0
Normal 0 311 0 0 100 0High 0 0 0 0 0 0
28NOV13:12:12:47 LP0053 1001 t19leoshift.doc
1) Number of subjects with laboratory parameters below, within or above the reference range (2.0 mmol/L to 2.9
mmol/L)
Cross-reference: EoT Table 3-19.
Urinary Calcium:Creatinine Ratio
The calcium:creatinine ratio (from spot urine samples) was classified as ‘low’, ‘normal’ or
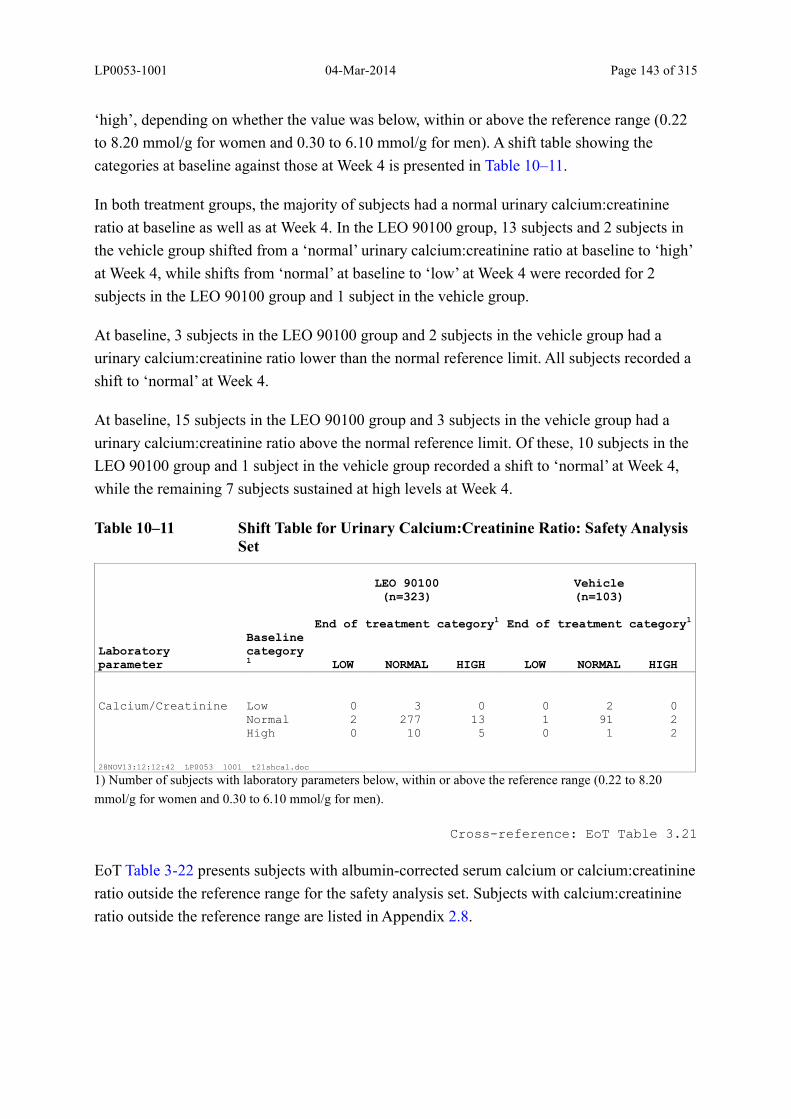
LP0053-1001 04-Mar-2014 Page 143 of 315
‘high’, depending on whether the value was below, within or above the reference range (0.22
to 8.20 mmol/g for women and 0.30 to 6.10 mmol/g for men). A shift table showing the
categories at baseline against those at Week 4 is presented in Table 10–11.
In both treatment groups, the majority of subjects had a normal urinary calcium:creatinine
ratio at baseline as well as at Week 4. In the LEO 90100 group, 13 subjects and 2 subjects in
the vehicle group shifted from a ‘normal’ urinary calcium:creatinine ratio at baseline to ‘high’
at Week 4, while shifts from ‘normal’ at baseline to ‘low’ at Week 4 were recorded for 2
subjects in the LEO 90100 group and 1 subject in the vehicle group.
At baseline, 3 subjects in the LEO 90100 group and 2 subjects in the vehicle group had a
urinary calcium:creatinine ratio lower than the normal reference limit. All subjects recorded a
shift to ‘normal’ at Week 4.
At baseline, 15 subjects in the LEO 90100 group and 3 subjects in the vehicle group had a
urinary calcium:creatinine ratio above the normal reference limit. Of these, 10 subjects in the
LEO 90100 group and 1 subject in the vehicle group recorded a shift to ‘normal’ at Week 4,
while the remaining 7 subjects sustained at high levels at Week 4.
Table 10–11 Shift Table for Urinary Calcium:Creatinine Ratio: Safety Analysis Set
LEO 90100(n=323)
End of treatment category1
Vehicle(n=103)
End of treatment category1
Laboratory parameter
Baseline category1 LOW NORMAL HIGH LOW NORMAL HIGH
Calcium/Creatinine Low 0 3 0 0 2 0Normal 2 277 13 1 91 2High 0 10 5 0 1 2
28NOV13:12:12:42 LP0053 1001 t21shcal.doc
1) Number of subjects with laboratory parameters below, within or above the reference range (0.22 to 8.20
mmol/g for women and 0.30 to 6.10 mmol/g for men).
Cross-reference: EoT Table 3.21
EoT Table 3-22 presents subjects with albumin-corrected serum calcium or calcium:creatinine
ratio outside the reference range for the safety analysis set. Subjects with calcium:creatinine
ratio outside the reference range are listed in Appendix 2.8.

LP0053-1001 04-Mar-2014 Page 144 of 315
10.5.3 Pregnancies
No pregnancies occurred during the trial.
10.6 Safety Conclusions
There were no deaths in the trial. Two SAEs occurred in the trial and were reported in the
LEO 90100 group, both assessed as having no relation to investigational product. One of
the SAEs led to discontinuation of treatment. There were no AEs leading to withdrawal of
the subject from the trial. The vast majority of the AEs were mild or moderate and only 5
AEs were rated as severe. The severe AEs were reported in the LEO 90100 group.
The overall incidence of AEs was low and comparable between treatment groups, with 51
(15.8%) subjects in the LEO 90100 group and 12 (11.7%) subjects in the vehicle group.
ADRs (i.e. AEs for which the causal relationship to the drug cannot be ruled out) were
reported for 10 subjects (3.1%) in the LEO 90100 group and 2 subjects (1.9%) in the
vehicle group. Lesional/perilesional AEs were reported for 9 subjects (2.8%) in the LEO
90100 group and 3 subjects (2.9%) in the vehicle group. Local reactions, as assessed by
application site scores, were few and occurred with similar frequency in the 2 treatment
groups. The majority of local reactions were erythema, dryness, and burning/pain of mild
to moderate intensity.
There were no significant changes in albumin-corrected serum calcium and spot urinary
calcium:creatinine ratio.

LP0053-1001 04-Mar-2014 Page 145 of 315
11 Discussion and Overall Conclusions
11.1 Discussion
The primary objective of this phase 3 trial was to compare the efficacy of treatment with
LEO 90100 to that of treatment with vehicle for up to 4 weeks in subjects with psoriasis
vulgaris. The trial was conducted to provide confirmatory evidence of efficacy and safety
results obtained in two phase 2 trials (LEO 90100-35 and LEO 90100-7).
The primary endpoint was subjects with ‘treatment success’, (‘clear’ or ‘almost clear’ for
subjects with at least moderate disease at baseline and ‘clear’ for subjects with mild disease at
baseline, equivalent to the term ‘controlled disease’ in the phase 2 trials) according to the IGA
at Week 4.
The trial was conducted as planned in the clinical study protocol. Demographics and subject
characteristics of the 426 randomised and treated subjects were well balanced between
treatment groups and complied with the targeted trial population. The completion rate was
high (above 96% in both treatment groups) and no bias as a result of subject withdrawals
would therefore be expected.
Overall, LEO 90100 was demonstrated to be effective in the treatment of psoriasis vulgaris on
the body (trunk and limbs) for all endpoints, with successive improvements in the disease
status of subjects during the course of the trial. In the primary analysis based on multiple
imputation of missing values, LEO 90100 was superior to vehicle in the proportion of
subjects achieving ‘treatment success’ at Week 4 (OR 30.3; 95% CI 9.7 to 94.3; p<0.001),
with response rates of 53.3% in the LEO 90100 groups and 4.8% in the vehicle group. These
results were supported by the m-PASI scores at Week 4 (secondary endpoint), which showed a
significantly greater improvement for LEO 90100 versus vehicle (p<0.001). Response to
treatment with LEO 90100 was rapid; with LEO 90100 being more effective than vehicle as
assessed by m-PASI as early as Week 1 (p<0.001). The results for PASI-50 and PASI-75 at
Week 4 also supported the results for the primary endpoint, as LEO 90100 was more effective
than vehicle for both these endpoints (p<0.001). Improvements for subjects treated with LEO
90100 were observed in all subgroups of baseline disease severity (IGA). In the LEO 90100
group, ‘treatment success’ rates at Week 4 were 30.6% in subjects with ‘mild’ severity at
baseline and 60.0% in subjects with ‘moderate’ disease severity at baseline, and even 37.9%
of subjects with ‘severe’ disease at baseline achieved ‘treatment success’, while the
corresponding rates in the vehicle group were only 0%, 4.2%, and 7.7%, respectively.
Finally, in the LEO 90100 group, the severity of the clinical signs of target lesions decreased
during the course of the trial and at Week 4, the redness, thickness, and scaliness of the target
LP0053-1001 04-Mar-2014 Page 146 of 315
lesion had disappeared completely in 32.6%, 57.5%, and 70.0% subjects, respectively, while
the corresponding rates in the vehicle group were only 3.0%, 4.0%, and 18.2%, respectively,
BSA involvement of psoriasis on the trunk and limbs also decreased during the course of the
trial and at Week 4, the mean decrease from baseline in percentage BSA involvement was
3.7%-points in the LEO 90100 group and 1.0%-point in the vehicle group.
Overall, the results of subject’s assessments of disease severity were in line with those of the
investigator. Analyses of ‘treatment success’ demonstrated superiority of LEO 90100
compared to vehicle. Subjects assessed itching and itch-related sleep loss as increasingly less
severe during the course of the trial and LEO 90100 was superior to vehicle at all visits for
both VAS parameters. In the LEO 90100 group, a high proportion of subjects achieved the
treatment goal of a 70% itch reduction (from 36.8% on Day 3 to 83.5% on Week 4).
Comparable findings were achieved for itch-related sleep loss. There was a statistically
significantly greater improvement in quality of life (as measured by DLQI) for LEO 90100
versus vehicle at all visits (p<0.001) and for the EQ-5D-5L dimension pain/discomfort
(p<0.001).
The efficacy results in the present trial showed a high reproducibility of findings from the
phase 2 trials LEO 90100-35 and LEO 90100-7. The proportion of subjects achieving
‘treatment success’ (LOCF) in the LEO 90100 group was 52.0% in the present trial, while the
corresponding responder rates for controlled disease’ (equivalent to ‘treatment success’) was
54.6% and 45.0% in the phase 2 trials. Furthermore, at Week 4, the mean m-PASI (LOCF)
was 2.07 (1.99 and 2.37 in the phase 2 trials), the proportion of subjects with PASI-75
(LOCF) was 51.4% (50.4% and 49.0% in the phase 2 trials), and the mean change compared
to baseline in itch VAS score was -41.8 (-39.8 and -43.4 in the phase 2 trials).
The incidence of AEs, ADRs, local reactions, and lesional/perilesional AEs in this trial was
low and comparable between LEO 90100 and vehicle. AEs were most frequently reported in
the SOCs ‘Infections and infestations’, and ‘General disorders and administration site
conditions’. Two SAEs occurred in the trial, both in the LEO 90100 group, and both assessed
as having no relation to investigational product. One of the SAEs led to discontinuation of
treatment. There were no AEs leading to withdrawal of the subject from the trial.
A potential concern of systemic exposure to calcipotriol is its effects on calcium metabolism
including increased blood and urine calcium levels. In this trial, the majority of subjects had
albumin-corrected serum calcium levels as well as spot urinary calcium:creatinine ratios
within the normal range both at baseline and at Week 4. In the LEO 90100 group, 3 subjects
shifted from a ‘normal’ albumin-corrected serum calcium level at baseline to ‘high’ at Week 4.
LP0053-1001 04-Mar-2014 Page 147 of 315
The levels were only 0.08 mmol/L, 0.03 mmol/L, and 0.05 mmol/L above the upper limit of
the reference range (2.55 mmol/L) and all returned to ‘normal’ or ‘low’ at follow-up. None of
these subjects experienced a concurrent increase in the urinary calcium/creatinine ratio Shifts
from a ‘normal’ urinary calcium/creatinine ratio at baseline to ‘high’ at Week 4 were observed
for 13 subjects in the LEO 90100 group and 2 subjects in the vehicle group, however, shifts in
the opposite direction (from ‘high’ at baseline to ‘normal’ at Week 4) were also observed in a
comparable number of subjects (10 subjects in the LEO 90100 group and 1 subject in the
vehicle group) suggesting that these changes may be non-specific rather than related to the
use of LEO 90100. In conclusion, the present trial did not indicate a significant effect of LEO
90100 on calcium homeostasis.
Vitamin D has a well-known role in calcium metabolism. In this trial levels of 25-hydroxy
vitamin D were measured at baseline and 73.5% of all randomised subjects had levels below
the normal reference range. This is not an unexpected finding given the fact that vitamin D
insufficiency is very common in the USA and Europe where its prevalence is estimated to be
as high as 50-80% in the general population, and there are studies to suggest that vitamin D
deficiency may be even more common in patients with psoriasis (26,27,28).
11.2 Overall Conclusions
Superiority of LEO 90100 compared to vehicle in the treatment of psoriasis vulgaris on
the trunk and limbs over 4 weeks was confirmed.
It was confirmed that LEO 90100 was safe and well tolerated in the treatment of psoriasis
vulgaris on the trunk and limbs over 4 weeks.

LP0053-1001 04-Mar-2014 Page 148 of 315
12 References
1. ICH E3. Structure and Content of Clinical Study Reports. November 1995
2. ICH E3 (R1). ICH E3 Guideline: Structure and Content of Clinical Study Reports
Questions and Answers. July 2012
3. ICH E6 (R1). Guideline for Good Clinical Practice. June 1996
4. ICH E9. Statistical Principles for Clinical Trials. February 1998
5. M4E(R1). The Common Technical Document for the Registration of Pharmaceuticals
for Human Use Efficacy. September 2002
6. Menter A, Gottlieb A, Feldman SR, van Voorhees AS, Leonardi CL, Gordon KB et al.
Guidelines of care for the management of psoriasis and psoriatic arthritis. Section 1.
Overview of psoriasis and guidelines of care for the treatment of psoriasis with
biologics. J Am Acad Dermatol; 58: 826-50.
7. National Center for Health Statistics. Current estimates from the National Health Inter-
view Survey: United States, 1996, Vital Health Stat 1999; 10(200): 81-6.
8. Farber EM, Nall L. Epidemiology: Natural history and genetics. In: Roenigk HHJ,
Maibach HI, editors. Psoriasis. New York: Marcel Dekker, 1998: 107-57.
9. Gottlieb AB. Psoriasis. Dis Manag Clin Outcomes 1998; 1(6): 195-202.
10. Douglas WS, Poulin Y, Decroix J, Ortonne JP, Mrowietz U, Gulliver W et al. A new
calcipotriol/betamethasone formulation with rapid onset of action was superior to
monotherapy with BDP or calcipotriol in psoriasis vulgaris. Acta Derm Venereol.
2002;82(2):131-5.
11. Guenther L, van de Kerkhof PC, Snellman E, Kragballe K, Chu AC, Tegner E et al.
Efficacy and safety of a new combination of calcipotriol and betamethasone
dipropionate (one or twice daily) compared to calcipotriol (twice daily) in the treatment
of psoriasis vulgaris: a randomized, double-blind, vehicle-controlled clinical trial. Br J
Dermatol. 2002;147(2):316-23.
12. Kaufmann R, Bibby AJ, Bissonnette R, Cambazard F, Chu AC, Decroix J et al. A new
calcipotriol/betamethasone dipropionate formulation (Daivobet) is an effective once-
daily treatment for psoriasis vulgaris. Dermatology. 2002;205(4):389-93.
13. Papp KA, Guenther L, Boyden B, Larsen FG, Harvima RJ, Guilhou JJ et al. Early
onset of action and efficacy of a combination of calcipotriene and betamethasone
dipropionate in the treatment of psoriasis. J Am Acad Dermatol. 2003;48(1):48-54.
LP0053-1001 04-Mar-2014 Page 149 of 315
14. Jemec GBE, Ganslandt C, Ortonne JP, Poulin Y, Burden AD, de Unamuno P et al. A
new scalp formulation of calcipotriene plus betamethasone compared with its active
ingredients and the vehicle in the treatment of scalp psoriasis. J Am Acad Dermatol
2008; 59 (3); 455-63.
15. van de Kerkhof PCM, Hoffman V, Anstey A, Barnes L, Bolduc C, Reich K et al. A
new scalp formulation of calcipotriol plus betamethasone dipropionate compared with
each of its active ingredients in the same vehicle for the treatment of scalp psoriasis: a
randomised, double-blind, controlled trial. Br J Dermatol 2009; 160; 170-76.
16. Kragballe K, Hoffmann V, Ortonne JP, Tan J, Nordin P, Segaert S. Efficacy and safety
of calcipotriol plus betamethasone dipropionate scalp formulation compared with
calcipotriol scalp solution in the treatment of scalp psoriasis. Br J Dermatol 2009; 161:
159-166 .
17. Fleming C, Ganslandt C, Guenther L, Johannesson A, Buckley C, Simon JC et al.
Calciopotriol plus betamethasone dipropionate gel compared with its active
components in the same vehicle and the vehicle alone in the treatment of psoriasis
vulgaris: a randomised, parallel group, double-blind, exploratory study. Eur J Dermatol
2010; 20 (4): 465-71.
18. Clinical Study Report. A phase 2 study comparing treatment with LEO 90100 with
betamethasone dipropionate in LEO 90100 vehicle and calcipotriol in LEO 90100
vehicle in subjects with psoriasis vulgaris. A multi-centre, prospective, randomised,
double-blind, 3-arm, parallel group, 4-week study in subjects with psoriasis vulgaris
Ballerup. Denmark: LEO Pharma, Clinical Development; LEO 90100-7. 19-Apr-2013.
19. Clinical Study Report. LEO 90100 Compared with Calcipotriol plus Betamethasone
Dipropionate Ointment, LEO 90100 Vehicle and Ointment Vehicle in Subjects with
Psoriasis Vulgaris. A phase 2 study comparing treatment with LEO 90100 with
calcipotriol plus betamethasone ointment, LEO 90100 vehicle and ointment vehicle in
subjects with psoriasis vulgaris. Ballerup. Denmark: LEO Pharma, Clinical
Development; LEO 90100-35. 10-Jun-2013.
20. CHMP, 18 November 2004: Guideline on Clinical Investigation of Medicinal Products
Indicated for the Treatment of Psoriasis.
21. Fitzpatrick TB: Soleil et peau. J Med Esthet 1975; 2:330-34.
22. Fredriksson T, Pettersson U. Dermatologica 1978;157:238-44.
23. Ratitch B, O'Kelly M, Tosiello R: Missing data in clinical trials: from clinical
assumptions to statistical analysis using pattern mixture models. Pharm. Stat 2013.
LP0053-1001 04-Mar-2014 Page 150 of 315
24. Rubin D.B. 1987. Multiple Imputation for Nonresponse in Surveys. New York: John
Wiley and Sons.
25. Li, Meng et al.. 1991. Significance levels from repeated p-values with multiply-
imputed data. Statistica Sinica, 1 (1991), 65-92.
26. Van der Wielen RP, Lowik MR, Van den Berg H et al. Serum vitamin D concentrations
among elderly people in Europe. Lancet. 1995;346:207–10.
27. Thacher TD, Clarke BL. Vitamin D insufficiency. Mayo Clin Proc. 2011;86:50–60.
28. Adami S, Viapiana O, Gatti D et al. Relationship between serum parathyroid hormone,
vitamin D sufficiency, age, and calcium intake. Bone. 2008;42:267–70.
Trial ID: LP0053-1001 04-Mar-2014 Page 151 of 315
1 Tables and Figures, Baseline Characteristics and Investigational Product
Data
List of Tables
Table 1–1: Reasons for withdrawal from trial: randomised subjects ..................................... 153
Table 1–2: Reasons for withdrawal from trial by last visit attended: randomised subjects ... 154
Table 1–3: Subject enrolment and randomisation by centre: enrolled and randomised subjects........................................................................................................................ 155
Table 1–4: Protocol deviations: randomised subjects ............................................................ 156
Table 1–5: Age, height, weight and BMI: randomised subjects ............................................ 157
Table 1–6: Sex, race, ethnicity and skin type: randomised subjects ...................................... 158
Table 1–7: Duration of psoriasis, BSA and baseline m-PASI: randomised subjects.............. 159
Table 1–8: Baseline IGA: randomised subjects ..................................................................... 160
Table 1–9: Other locations of psoriasis: randomised subjects ............................................... 161
Table 1–10: Previous psoriasis treatments: randomised subjects........................................... 162
Table 1–11: Concurrent diagnoses: randomised subjects....................................................... 163
Table 1–12: Concomitant medication at baseline: randomised subjects................................ 165
Table 1–13: Target lesion location: randomised subjects....................................................... 166
Table 1–14: 25-hydroxy vitamin D categorised as low, normal or high: randomised subjects........................................................................................................................ 167
Table 1–15: Vital signs at baseline: randomised subjects ...................................................... 168
Table 1–16: Age by centre: randomised subjects ................................................................... 169
Table 1–17: Sex by centre: randomised subjects.................................................................... 175
Table 1–18: Ethnicity by centre: randomised subjects........................................................... 179
Table 1–19: Race by centre: randomised subjects.................................................................. 183
Table 1–20: Baseline IGA by centre: randomised subjects.................................................... 188
Trial ID: LP0053-1001 04-Mar-2014 Page 152 of 315
Table 1–21: Subjects with photographs by centre: randomised subjects ............................... 192
Table 1–22: Compliance with treatment instructions over the total trial period: randomised subjects ........................................................................................................... 196
Table 1–23: Compliance with treatment instructions by visit: randomised subjects ............. 197
Table 1–24: Baseline m-PASI: randomised subjects excluding site ................................. 199
List of Figures
Figure 1–1: Visit attendance by treatment: active .................................................................. 200
Figure 1–2: Visit attendance by treatment: vehicle ................................................................ 201
Figure 1–3: Trial analysis sets by treatment: active ............................................................... 202
Figure 1–4: Trial analysis sets by treatment: vehicle ............................................................. 203
Figure 1–5: Visit attendance: enrolled subjects...................................................................... 204
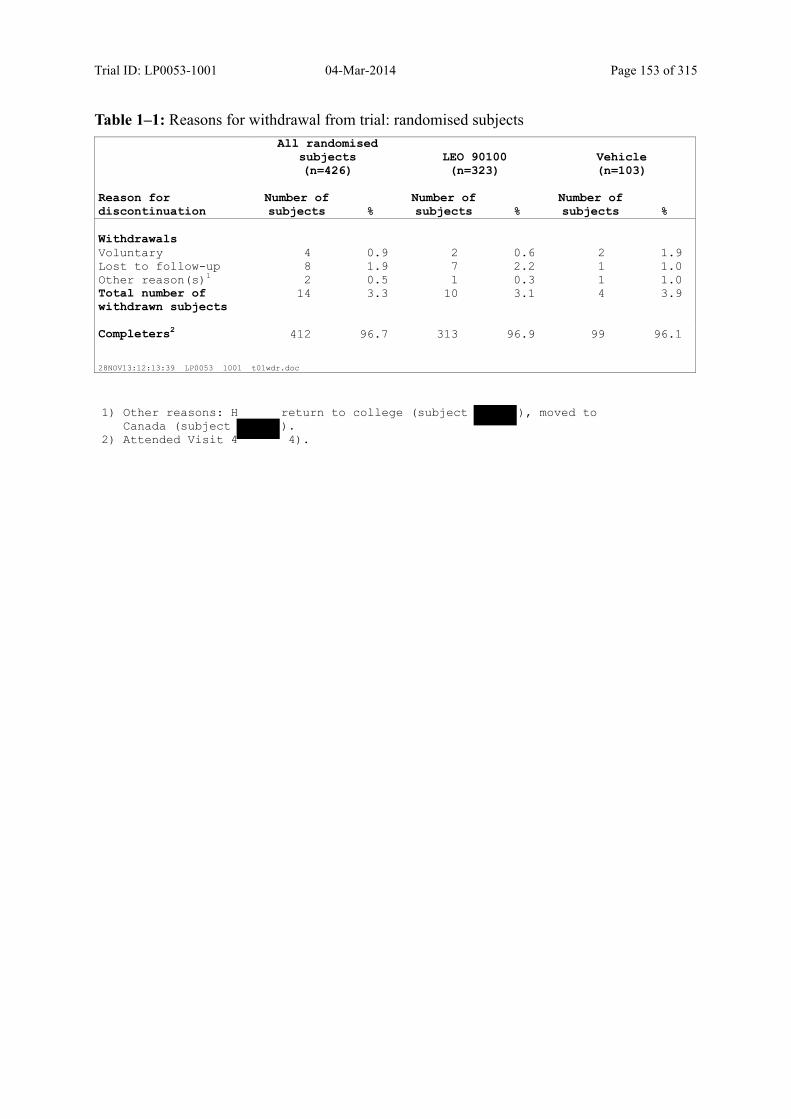
Trial ID: LP0053-1001 04-Mar-2014 Page 153 of 315
Table 1–1: Reasons for withdrawal from trial: randomised subjects
All randomised subjects(n=426)
LEO 90100(n=323)
Vehicle(n=103)
Reason for discontinuation
Number of subjects %
Number of subjects %
Number of subjects %
WithdrawalsVoluntary 4 0.9 2 0.6 2 1.9 Lost to follow-up 8 1.9 7 2.2 1 1.0 Other reason(s)1 2 0.5 1 0.3 1 1.0 Total number of withdrawn subjects
14 3.3 10 3.1 4 3.9
Completers2 412 96.7 313 96.9 99 96.1
28NOV13:12:13:39 LP0053 1001 t01wdr.doc
1) Other reasons: H return to college (subject ), moved to Canada (subject ).2) Attended Visit 4 4).
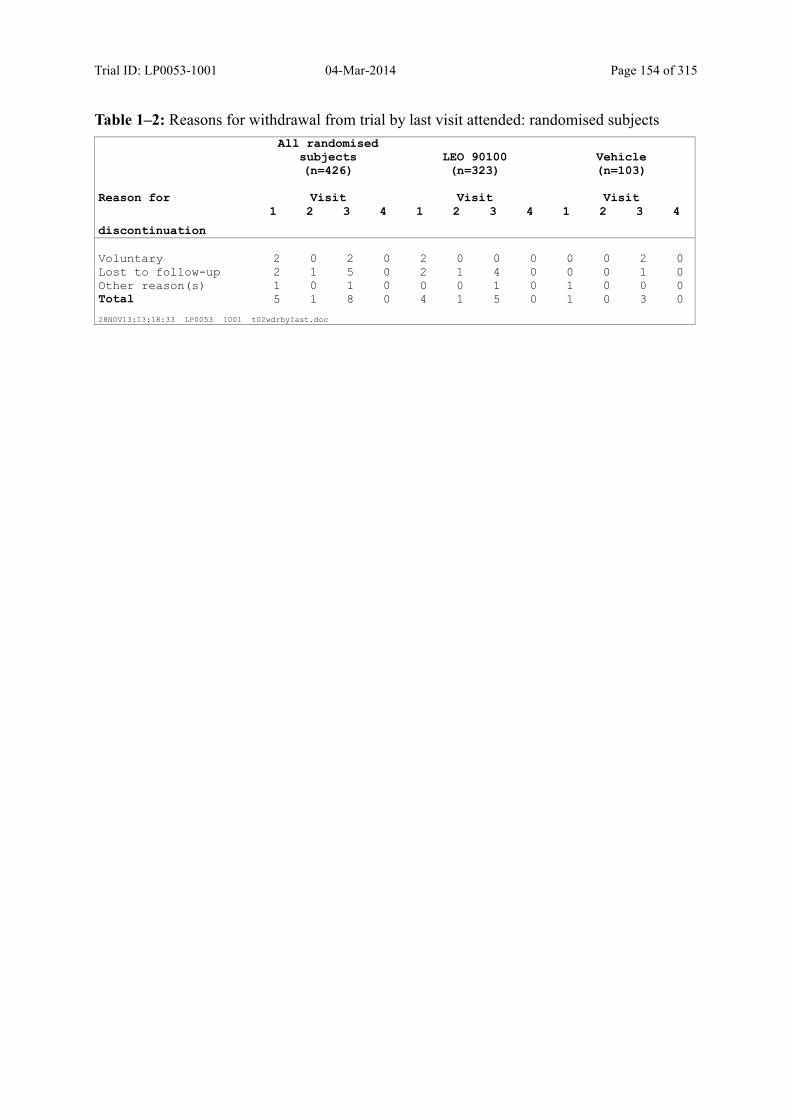
Trial ID: LP0053-1001 04-Mar-2014 Page 154 of 315
Table 1–2: Reasons for withdrawal from trial by last visit attended: randomised subjects
Reason for
All randomised subjects(n=426)
Visit
LEO 90100(n=323)
Visit
Vehicle(n=103)
Visit
discontinuation
1 2 3 4 1 2 3 4 1 2 3 4
Voluntary 2 0 2 0 2 0 0 0 0 0 2 0 Lost to follow-up 2 1 5 0 2 1 4 0 0 0 1 0 Other reason(s) 1 0 1 0 0 0 1 0 1 0 0 0 Total 5 1 8 0 4 1 5 0 1 0 3 0
28NOV13:13:18:33 LP0053 1001 t02wdrbylast.doc
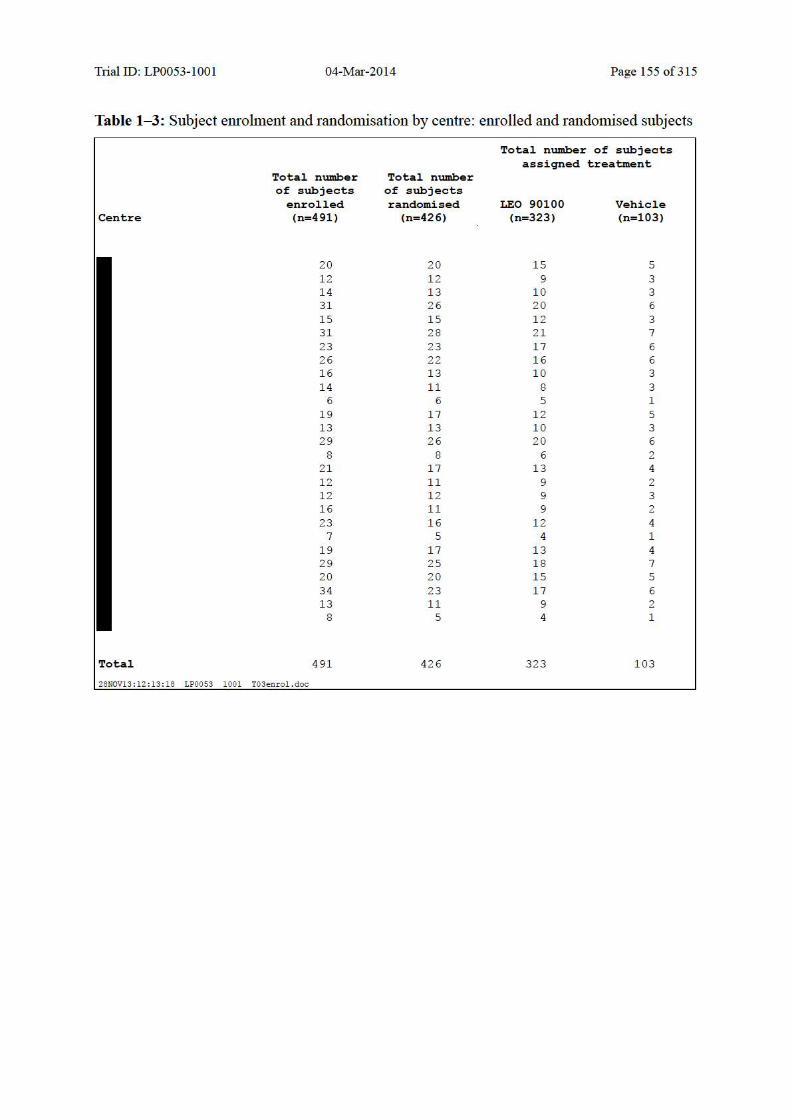
Trial ID: LP0053-1001 04-Mar-2014 Page 155 of315
Table 1-3: Subject emolment and randomisation by centre: emolled and randomised subjects
Total number of subject s a ssigne d t r eatment
Total numbe r Total numbe r of subje cts of subje cts
enrolle d randomise d LEO 90100 Vehicle Cent r e (n=4 91) (n=426) (n=323) (n=l03)
20 20 15 5 12 12 9 3 14 13 10 3 31 26 20 6 15 15 12 3 31 28 21 7 23 23 17 6 26 22 16 6 16 13 10 3 14 11 8 3
6 6 5 1 19 17 12 5 13 13 10 3 29 26 20 6
8 8 6 2 21 17 13 4 12 11 9 2 12 12 9 3 16 11 9 2 23 16 12 4
7 5 4 1 19 17 13 4 29 25 18 7 20 20 15 5 34 23 17 6 13 11 9 2
8 5 4 1
Tot al 4 91 426 323 1 03
28NOV13: 12 : 13 : 18 LP0053 1001 I 0 3enrol. doc

Trial ID: LP0053-1001 04-Mar-2014 Page 156 of 315
Table 1–4: Protocol deviations: randomised subjects
All randomised subjects(n=426)
LEO 90100(n=323)
Vehicle(n=103)
Deviation1Number of subjects %
Number of subjects %
Number of subjects %
Early withdrawal 14 3.3 10 3.1 4 3.9 Exclusionary medication taken
1 0.2 1 0.3 0 0.0
Incorrect kit dispensed2
1 0.2 1 0.3 0 0.0
Visit 4 conducted outside of window
12 2.8 9 2.8 3 2.9
Total number of deviations
28 21 7
Total number of subjects withdeviations
28 6.6 21 6.5 7 6.8
09DEC13:11:41:31 LP0053 1001 t04dev.doc
1) Only deviations leading to exclusion from per protocol analysis set are shown in table.2) Six other subjects were dispensed incorrect kit that however contained correct
medication.
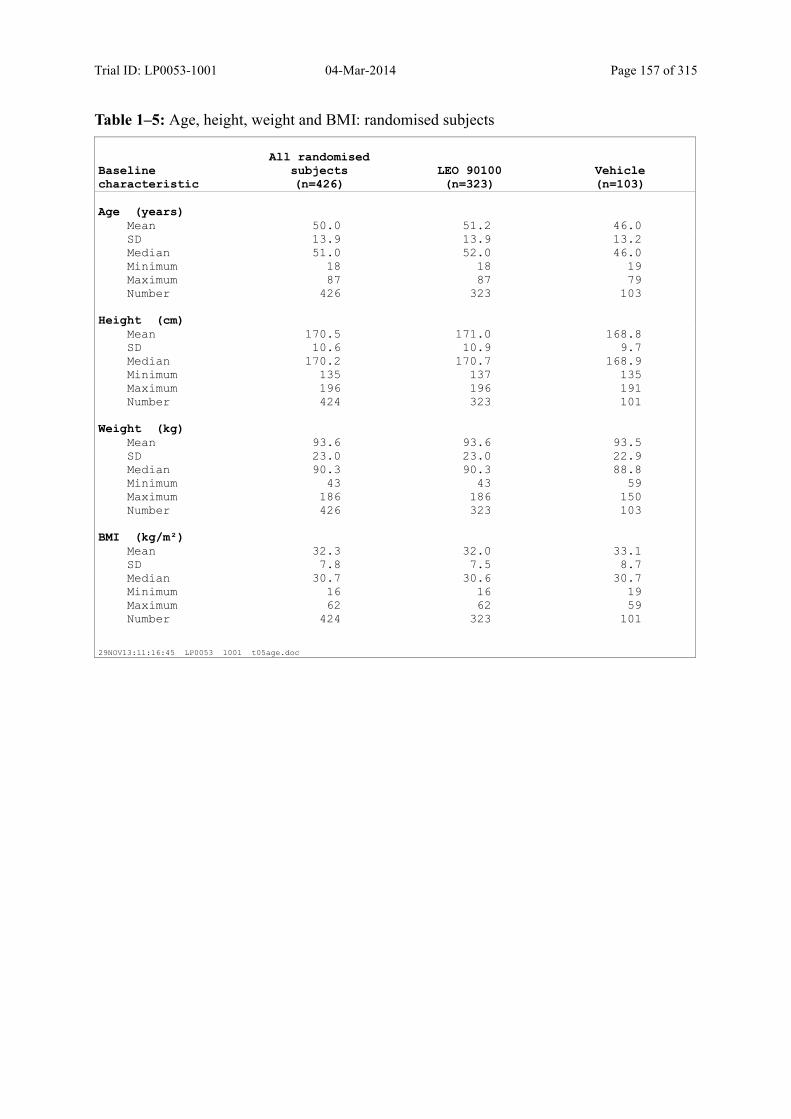
Trial ID: LP0053-1001 04-Mar-2014 Page 157 of 315
Table 1–5: Age, height, weight and BMI: randomised subjects
Baseline characteristic
All randomised subjects(n=426)
LEO 90100(n=323)
Vehicle(n=103)
Age (years) Mean 50.0 51.2 46.0 SD 13.9 13.9 13.2 Median 51.0 52.0 46.0 Minimum 18 18 19 Maximum 87 87 79 Number 426 323 103 Height (cm) Mean 170.5 171.0 168.8 SD 10.6 10.9 9.7 Median 170.2 170.7 168.9 Minimum 135 137 135 Maximum 196 196 191 Number 424 323 101 Weight (kg) Mean 93.6 93.6 93.5 SD 23.0 23.0 22.9 Median 90.3 90.3 88.8 Minimum 43 43 59 Maximum 186 186 150 Number 426 323 103 BMI (kg/m²) Mean 32.3 32.0 33.1 SD 7.8 7.5 8.7 Median 30.7 30.6 30.7 Minimum 16 16 19 Maximum 62 62 59 Number 424 323 101
29NOV13:11:16:45 LP0053 1001 t05age.doc
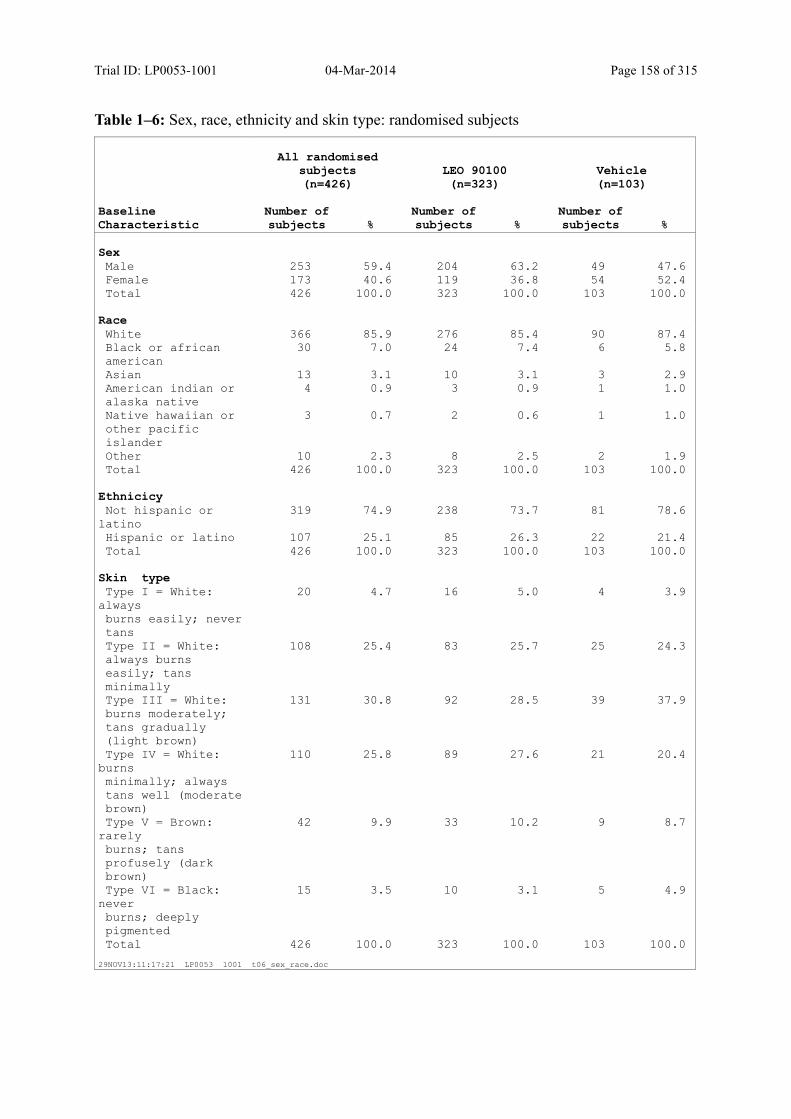
Trial ID: LP0053-1001 04-Mar-2014 Page 158 of 315
Table 1–6: Sex, race, ethnicity and skin type: randomised subjects
All randomised subjects(n=426)
LEO 90100(n=323)
Vehicle(n=103)
Baseline Characteristic
Number of subjects %
Number of subjects %
Number of subjects %
SexMale 253 59.4 204 63.2 49 47.6 Female 173 40.6 119 36.8 54 52.4 Total 426 100.0 323 100.0 103 100.0
RaceWhite 366 85.9 276 85.4 90 87.4 Black or african american
30 7.0 24 7.4 6 5.8
Asian 13 3.1 10 3.1 3 2.9 American indian or alaska native
4 0.9 3 0.9 1 1.0
Native hawaiian or other pacificislander
3 0.7 2 0.6 1 1.0
Other 10 2.3 8 2.5 2 1.9 Total 426 100.0 323 100.0 103 100.0
EthnicicyNot hispanic or
latino 319 74.9 238 73.7 81 78.6
Hispanic or latino 107 25.1 85 26.3 22 21.4 Total 426 100.0 323 100.0 103 100.0
Skin typeType I = White:
always burns easily; nevertans
20 4.7 16 5.0 4 3.9
Type II = White: always burnseasily; tansminimally
108 25.4 83 25.7 25 24.3
Type III = White: burns moderately;tans gradually(light brown)
131 30.8 92 28.5 39 37.9
Type IV = White: burns minimally; alwaystans well (moderatebrown)
110 25.8 89 27.6 21 20.4
Type V = Brown: rarely burns; tansprofusely (darkbrown)
42 9.9 33 10.2 9 8.7
Type VI = Black: never burns; deeplypigmented
15 3.5 10 3.1 5 4.9
Total 426 100.0 323 100.0 103 100.0
29NOV13:11:17:21 LP0053 1001 t06_sex_race.doc
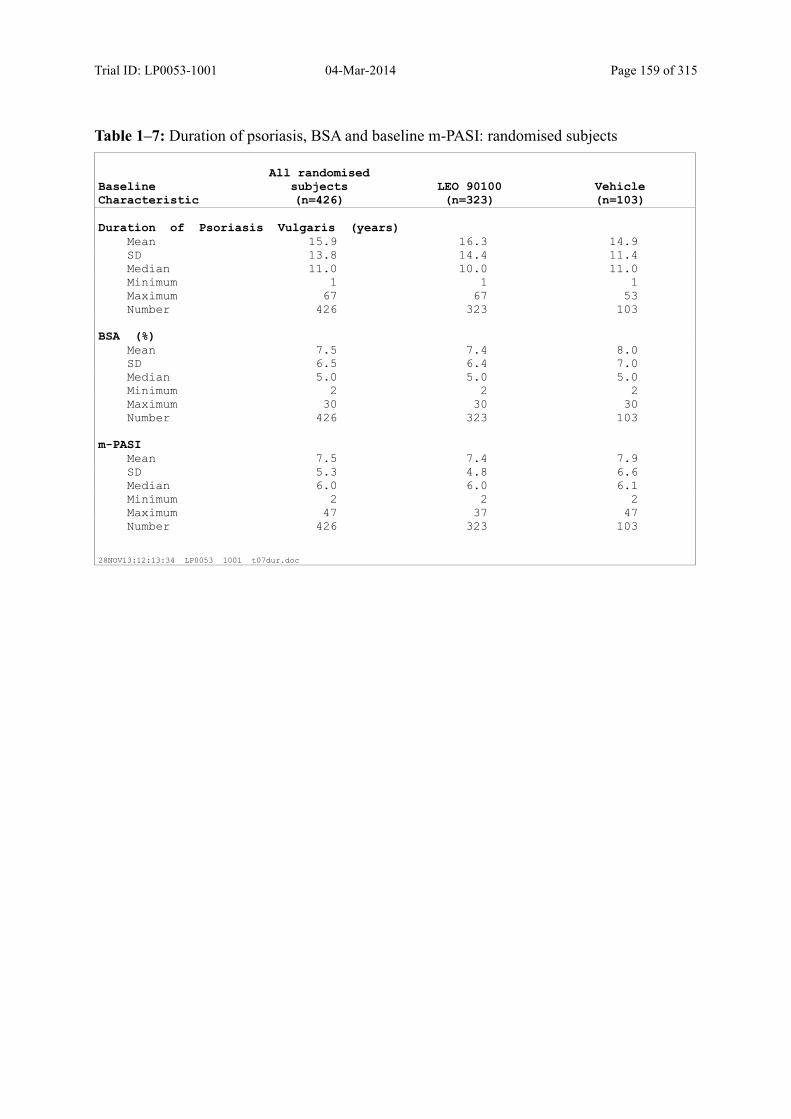
Trial ID: LP0053-1001 04-Mar-2014 Page 159 of 315
Table 1–7: Duration of psoriasis, BSA and baseline m-PASI: randomised subjects
Baseline Characteristic
All randomised subjects(n=426)
LEO 90100(n=323)
Vehicle(n=103)
Duration of Psoriasis Vulgaris (years) Mean 15.9 16.3 14.9 SD 13.8 14.4 11.4 Median 11.0 10.0 11.0 Minimum 1 1 1 Maximum 67 67 53 Number 426 323 103 BSA (%) Mean 7.5 7.4 8.0 SD 6.5 6.4 7.0 Median 5.0 5.0 5.0 Minimum 2 2 2 Maximum 30 30 30 Number 426 323 103 m-PASI Mean 7.5 7.4 7.9 SD 5.3 4.8 6.6 Median 6.0 6.0 6.1 Minimum 2 2 2 Maximum 47 37 47 Number 426 323 103
28NOV13:12:13:34 LP0053 1001 t07dur.doc
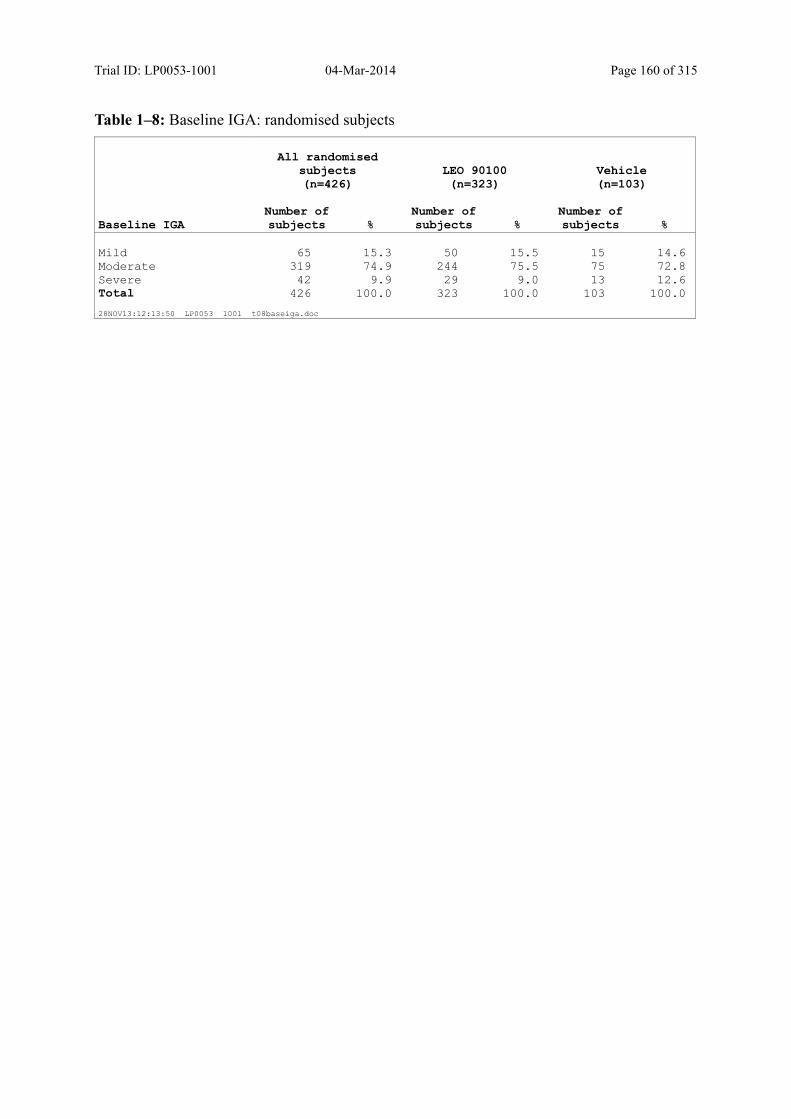
Trial ID: LP0053-1001 04-Mar-2014 Page 160 of 315
Table 1–8: Baseline IGA: randomised subjects
All randomised subjects(n=426)
LEO 90100(n=323)
Vehicle(n=103)
Baseline IGANumber of subjects %
Number of subjects %
Number of subjects %
Mild 65 15.3 50 15.5 15 14.6 Moderate 319 74.9 244 75.5 75 72.8 Severe 42 9.9 29 9.0 13 12.6 Total 426 100.0 323 100.0 103 100.0
28NOV13:12:13:50 LP0053 1001 t08baseiga.doc
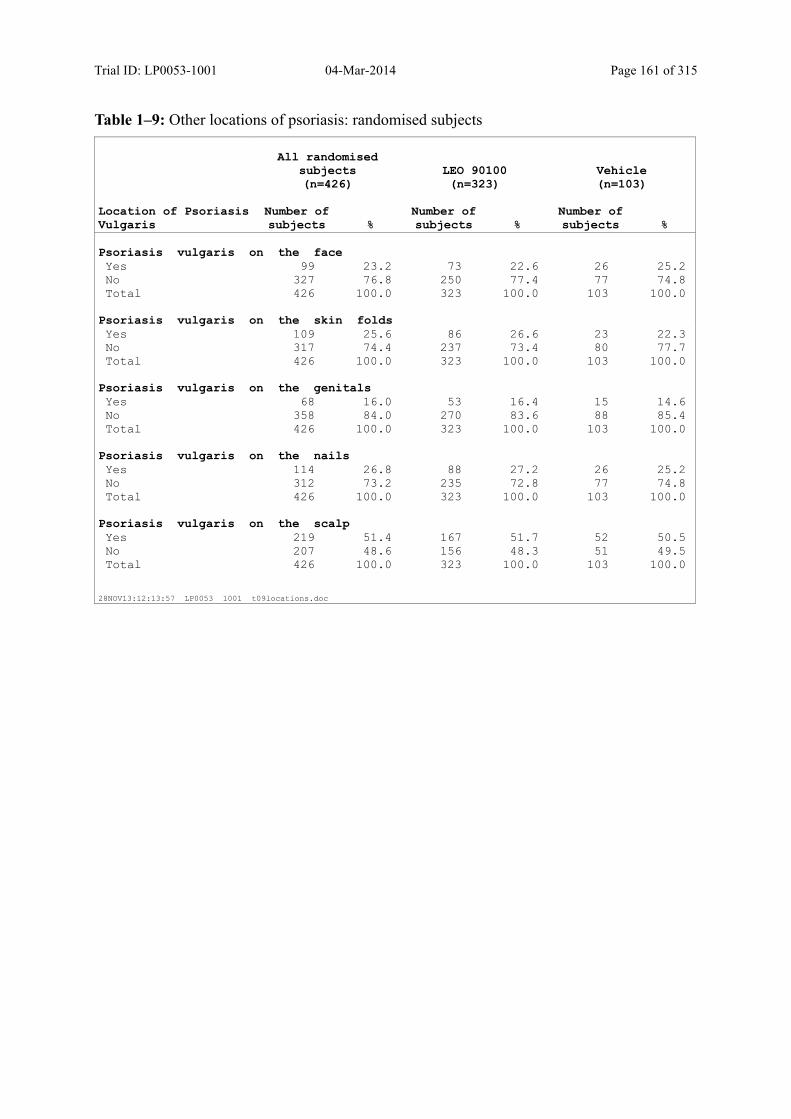
Trial ID: LP0053-1001 04-Mar-2014 Page 161 of 315
Table 1–9: Other locations of psoriasis: randomised subjects
All randomised subjects(n=426)
LEO 90100(n=323)
Vehicle(n=103)
Location of Psoriasis Vulgaris
Number of subjects %
Number of subjects %
Number of subjects %
Psoriasis vulgaris on the faceYes 99 23.2 73 22.6 26 25.2 No 327 76.8 250 77.4 77 74.8 Total 426 100.0 323 100.0 103 100.0
Psoriasis vulgaris on the skin foldsYes 109 25.6 86 26.6 23 22.3 No 317 74.4 237 73.4 80 77.7 Total 426 100.0 323 100.0 103 100.0
Psoriasis vulgaris on the genitalsYes 68 16.0 53 16.4 15 14.6 No 358 84.0 270 83.6 88 85.4 Total 426 100.0 323 100.0 103 100.0
Psoriasis vulgaris on the nailsYes 114 26.8 88 27.2 26 25.2 No 312 73.2 235 72.8 77 74.8 Total 426 100.0 323 100.0 103 100.0
Psoriasis vulgaris on the scalpYes 219 51.4 167 51.7 52 50.5 No 207 48.6 156 48.3 51 49.5 Total 426 100.0 323 100.0 103 100.0
28NOV13:12:13:57 LP0053 1001 t09locations.doc
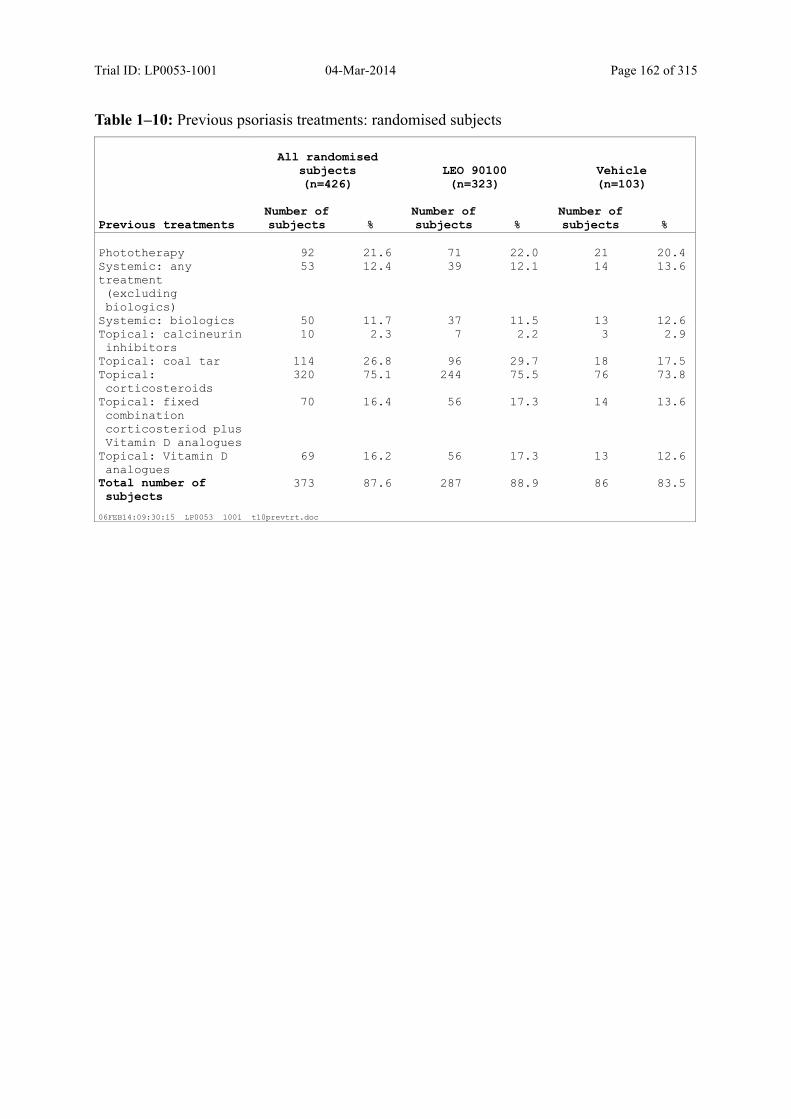
Trial ID: LP0053-1001 04-Mar-2014 Page 162 of 315
Table 1–10: Previous psoriasis treatments: randomised subjects
All randomised subjects(n=426)
LEO 90100(n=323)
Vehicle(n=103)
Previous treatmentsNumber of subjects %
Number of subjects %
Number of subjects %
Phototherapy 92 21.6 71 22.0 21 20.4 Systemic: any treatment (excludingbiologics)
53 12.4 39 12.1 14 13.6
Systemic: biologics 50 11.7 37 11.5 13 12.6 Topical: calcineurin inhibitors
10 2.3 7 2.2 3 2.9
Topical: coal tar 114 26.8 96 29.7 18 17.5 Topical: corticosteroids
320 75.1 244 75.5 76 73.8
Topical: fixed combinationcorticosteriod plusVitamin D analogues
70 16.4 56 17.3 14 13.6
Topical: Vitamin D analogues
69 16.2 56 17.3 13 12.6
Total number of subjects
373 87.6 287 88.9 86 83.5
06FEB14:09:30:15 LP0053 1001 t10prevtrt.doc
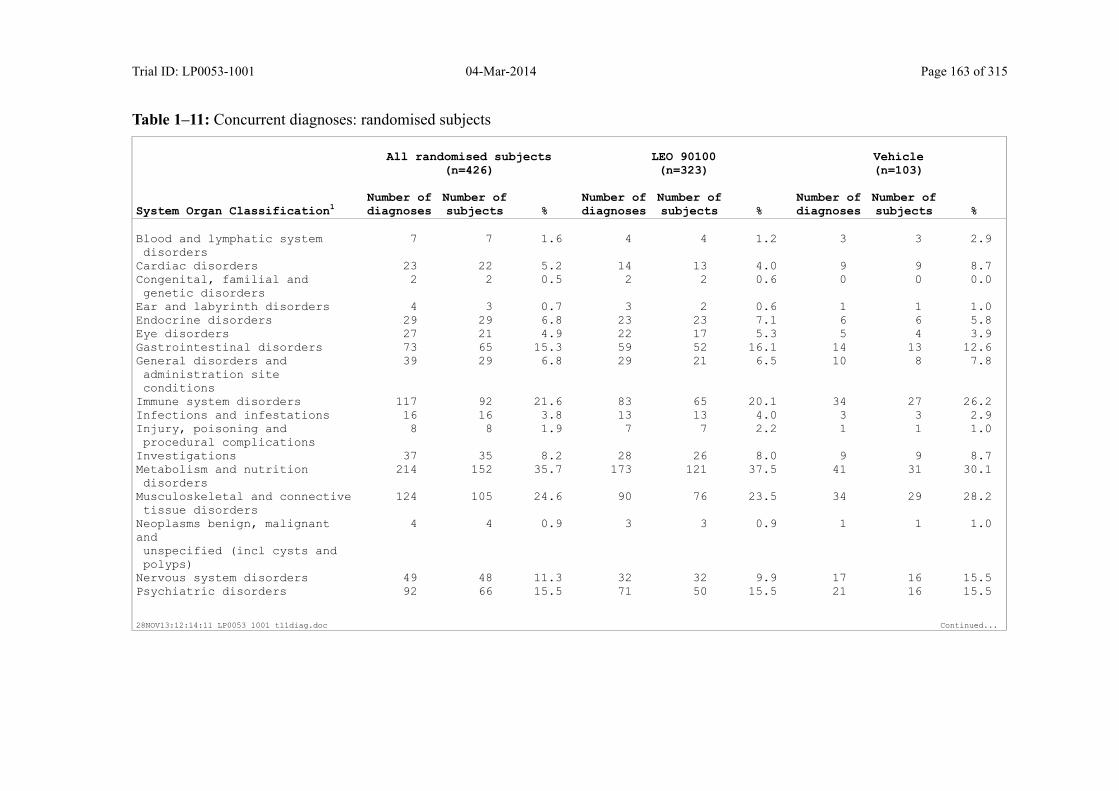
Trial ID: LP0053-1001 04-Mar-2014 Page 163 of 315
Table 1–11: Concurrent diagnoses: randomised subjects
All randomised subjects(n=426)
LEO 90100(n=323)
Vehicle(n=103)
System Organ Classification1Number ofdiagnoses
Number ofsubjects %
Number ofdiagnoses
Number ofsubjects %
Number ofdiagnoses
Number ofsubjects %
Blood and lymphatic system disorders
7 7 1.6 4 4 1.2 3 3 2.9
Cardiac disorders 23 22 5.2 14 13 4.0 9 9 8.7 Congenital, familial and genetic disorders
2 2 0.5 2 2 0.6 0 0 0.0
Ear and labyrinth disorders 4 3 0.7 3 2 0.6 1 1 1.0 Endocrine disorders 29 29 6.8 23 23 7.1 6 6 5.8 Eye disorders 27 21 4.9 22 17 5.3 5 4 3.9 Gastrointestinal disorders 73 65 15.3 59 52 16.1 14 13 12.6 General disorders and administration siteconditions
39 29 6.8 29 21 6.5 10 8 7.8
Immune system disorders 117 92 21.6 83 65 20.1 34 27 26.2 Infections and infestations 16 16 3.8 13 13 4.0 3 3 2.9 Injury, poisoning and procedural complications
8 8 1.9 7 7 2.2 1 1 1.0
Investigations 37 35 8.2 28 26 8.0 9 9 8.7 Metabolism and nutrition disorders
214 152 35.7 173 121 37.5 41 31 30.1
Musculoskeletal and connective tissue disorders
124 105 24.6 90 76 23.5 34 29 28.2
Neoplasms benign, malignant and unspecified (incl cysts andpolyps)
4 4 0.9 3 3 0.9 1 1 1.0
Nervous system disorders 49 48 11.3 32 32 9.9 17 16 15.5 Psychiatric disorders 92 66 15.5 71 50 15.5 21 16 15.5
28NOV13:12:14:11 LP0053 1001 t11diag.doc Continued...
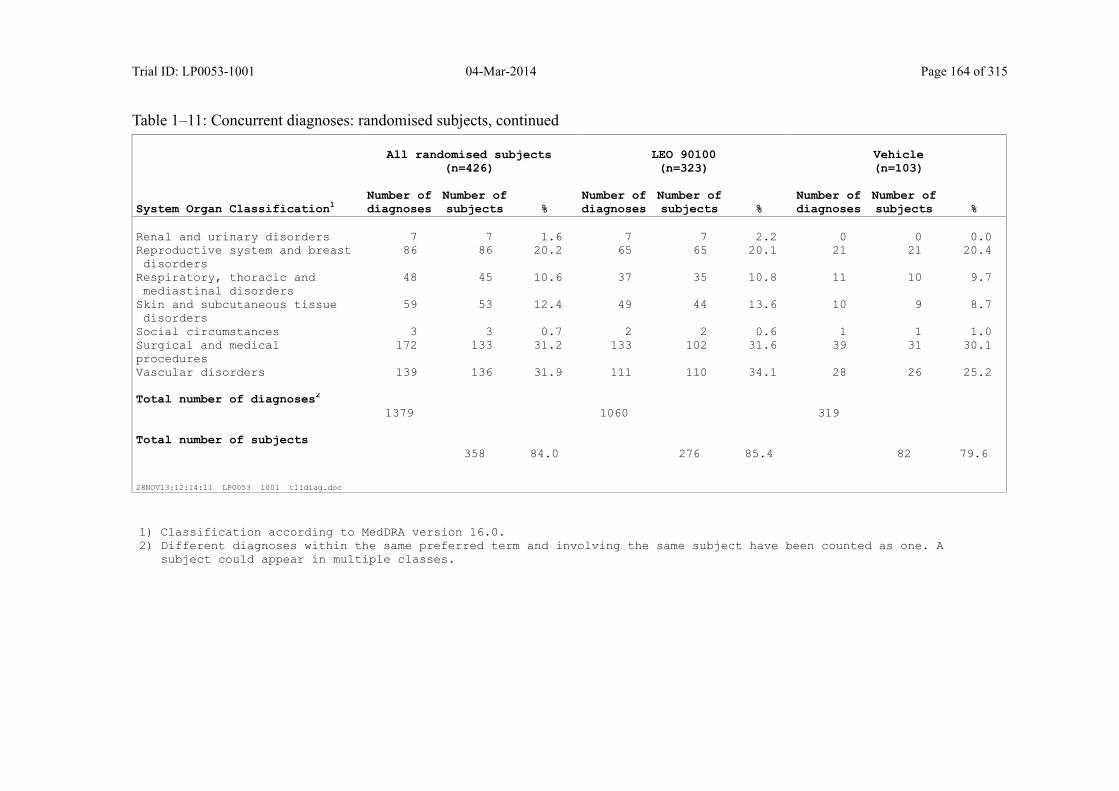
Trial ID: LP0053-1001 04-Mar-2014 Page 164 of 315
Table 1–11: Concurrent diagnoses: randomised subjects, continued
All randomised subjects(n=426)
LEO 90100(n=323)
Vehicle(n=103)
System Organ Classification1Number ofdiagnoses
Number ofsubjects %
Number ofdiagnoses
Number ofsubjects %
Number ofdiagnoses
Number ofsubjects %
Renal and urinary disorders 7 7 1.6 7 7 2.2 0 0 0.0 Reproductive system and breast disorders
86 86 20.2 65 65 20.1 21 21 20.4
Respiratory, thoracic and mediastinal disorders
48 45 10.6 37 35 10.8 11 10 9.7
Skin and subcutaneous tissue disorders
59 53 12.4 49 44 13.6 10 9 8.7
Social circumstances 3 3 0.7 2 2 0.6 1 1 1.0 Surgical and medical procedures
172 133 31.2 133 102 31.6 39 31 30.1
Vascular disorders 139 136 31.9 111 110 34.1 28 26 25.2 Total number of diagnoses2
1379 1060 319 Total number of subjects
358 84.0 276 85.4 82 79.6
28NOV13:12:14:11 LP0053 1001 t11diag.doc
1) Classification according to MedDRA version 16.0.2) Different diagnoses within the same preferred term and involving the same subject have been counted as one. A
subject could appear in multiple classes.
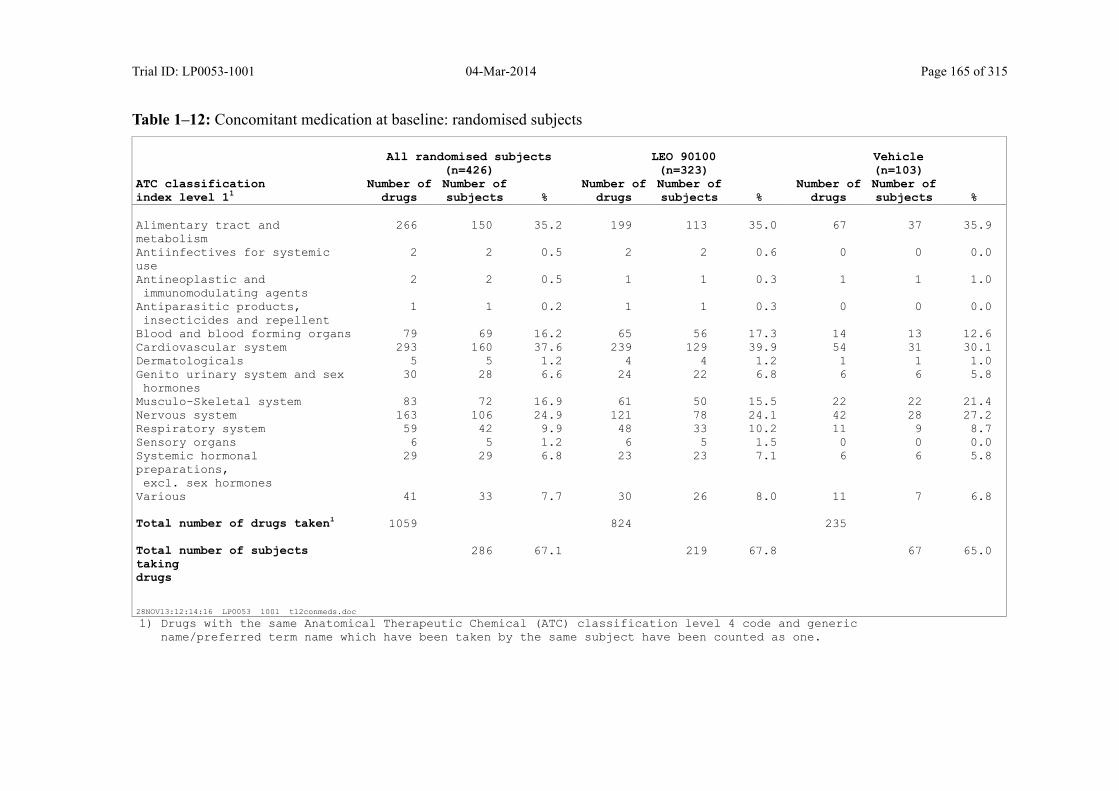
Trial ID: LP0053-1001 04-Mar-2014 Page 165 of 315
Table 1–12: Concomitant medication at baseline: randomised subjects
All randomised subjects(n=426)
LEO 90100(n=323)
Vehicle(n=103)
ATC classificationindex level 11
Number of drugs
Number ofsubjects %
Number of drugs
Number ofsubjects %
Number of drugs
Number ofsubjects %
Alimentary tract and metabolism
266 150 35.2 199 113 35.0 67 37 35.9
Antiinfectives for systemic use
2 2 0.5 2 2 0.6 0 0 0.0
Antineoplastic and immunomodulating agents
2 2 0.5 1 1 0.3 1 1 1.0
Antiparasitic products, insecticides and repellent
1 1 0.2 1 1 0.3 0 0 0.0
Blood and blood forming organs 79 69 16.2 65 56 17.3 14 13 12.6 Cardiovascular system 293 160 37.6 239 129 39.9 54 31 30.1 Dermatologicals 5 5 1.2 4 4 1.2 1 1 1.0 Genito urinary system and sex hormones
30 28 6.6 24 22 6.8 6 6 5.8
Musculo-Skeletal system 83 72 16.9 61 50 15.5 22 22 21.4 Nervous system 163 106 24.9 121 78 24.1 42 28 27.2 Respiratory system 59 42 9.9 48 33 10.2 11 9 8.7 Sensory organs 6 5 1.2 6 5 1.5 0 0 0.0 Systemic hormonal preparations, excl. sex hormones
29 29 6.8 23 23 7.1 6 6 5.8
Various 41 33 7.7 30 26 8.0 11 7 6.8 Total number of drugs taken1 1059 824 235 Total number of subjects taking drugs
286 67.1 219 67.8 67 65.0
28NOV13:12:14:16 LP0053 1001 t12conmeds.doc
1) Drugs with the same Anatomical Therapeutic Chemical (ATC) classification level 4 code and generic name/preferred term name which have been taken by the same subject have been counted as one.
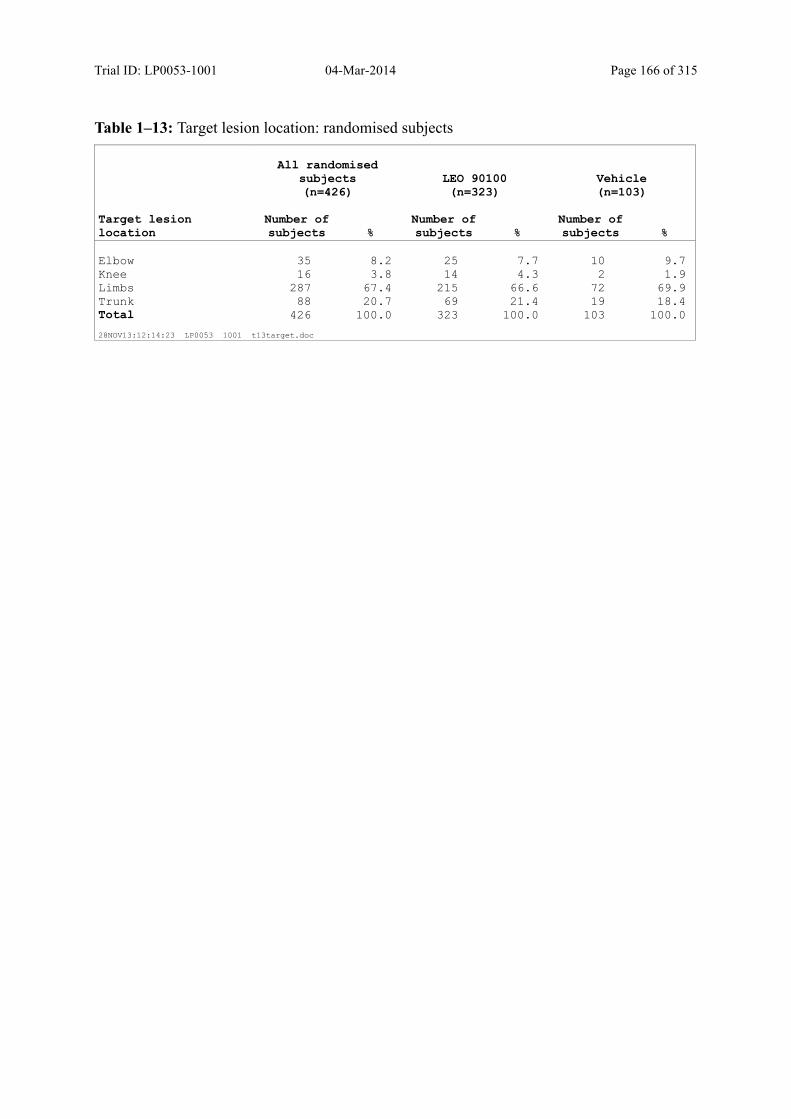
Trial ID: LP0053-1001 04-Mar-2014 Page 166 of 315
Table 1–13: Target lesion location: randomised subjects
All randomised subjects(n=426)
LEO 90100(n=323)
Vehicle(n=103)
Target lesion location
Number of subjects %
Number of subjects %
Number of subjects %
Elbow 35 8.2 25 7.7 10 9.7 Knee 16 3.8 14 4.3 2 1.9 Limbs 287 67.4 215 66.6 72 69.9 Trunk 88 20.7 69 21.4 19 18.4 Total 426 100.0 323 100.0 103 100.0
28NOV13:12:14:23 LP0053 1001 t13target.doc
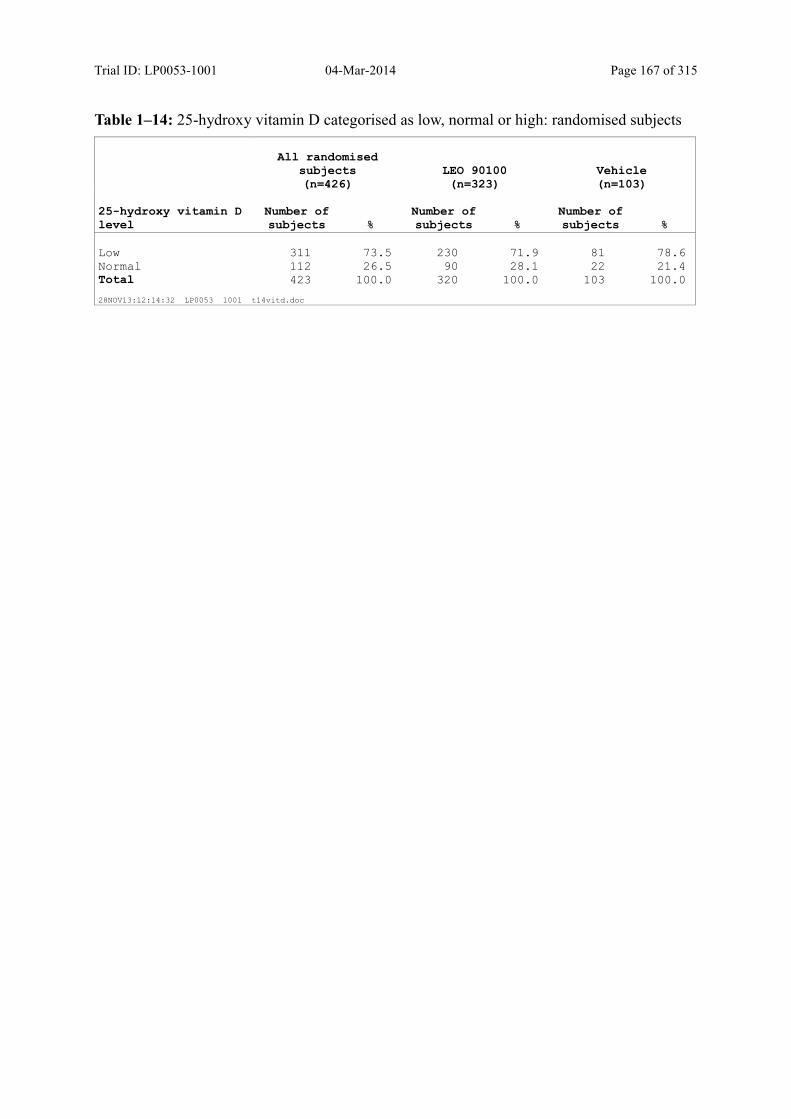
Trial ID: LP0053-1001 04-Mar-2014 Page 167 of 315
Table 1–14: 25-hydroxy vitamin D categorised as low, normal or high: randomised subjects
All randomised subjects(n=426)
LEO 90100(n=323)
Vehicle(n=103)
25-hydroxy vitamin D level
Number of subjects %
Number of subjects %
Number of subjects %
Low 311 73.5 230 71.9 81 78.6 Normal 112 26.5 90 28.1 22 21.4 Total 423 100.0 320 100.0 103 100.0
28NOV13:12:14:32 LP0053 1001 t14vitd.doc

Trial ID: LP0053-1001 04-Mar-2014 Page 168 of 315
Table 1–15: Vital signs at baseline: randomised subjects
Vital sign
All randomised subjects(n=426)
LEO 90100(n=323)
Vehicle(n=103)
Heart Rate (Beats/Minute) Mean 73.6 73.2 74.8 SD 11.0 11.1 10.6 Median 73.0 72.0 74.0 Minimum 47 47 48 Maximum 106 106 98 Number 426 323 103 Systolic Blood Pressure (mmHg) Mean 129.9 130.0 129.8 SD 15.0 14.8 15.8 Median 130.0 130.0 130.0 Minimum 87 87 95 Maximum 185 185 182 Number 426 323 103 Diastolic Blood Pressure (mmHg) Mean 81.1 81.0 81.3 SD 9.1 8.8 10.2 Median 82.0 82.0 81.0 Minimum 54 56 54 Maximum 108 108 108 Number 426 323 103
29NOV13:13:06:11 LP0053 1001 t15vital.doc
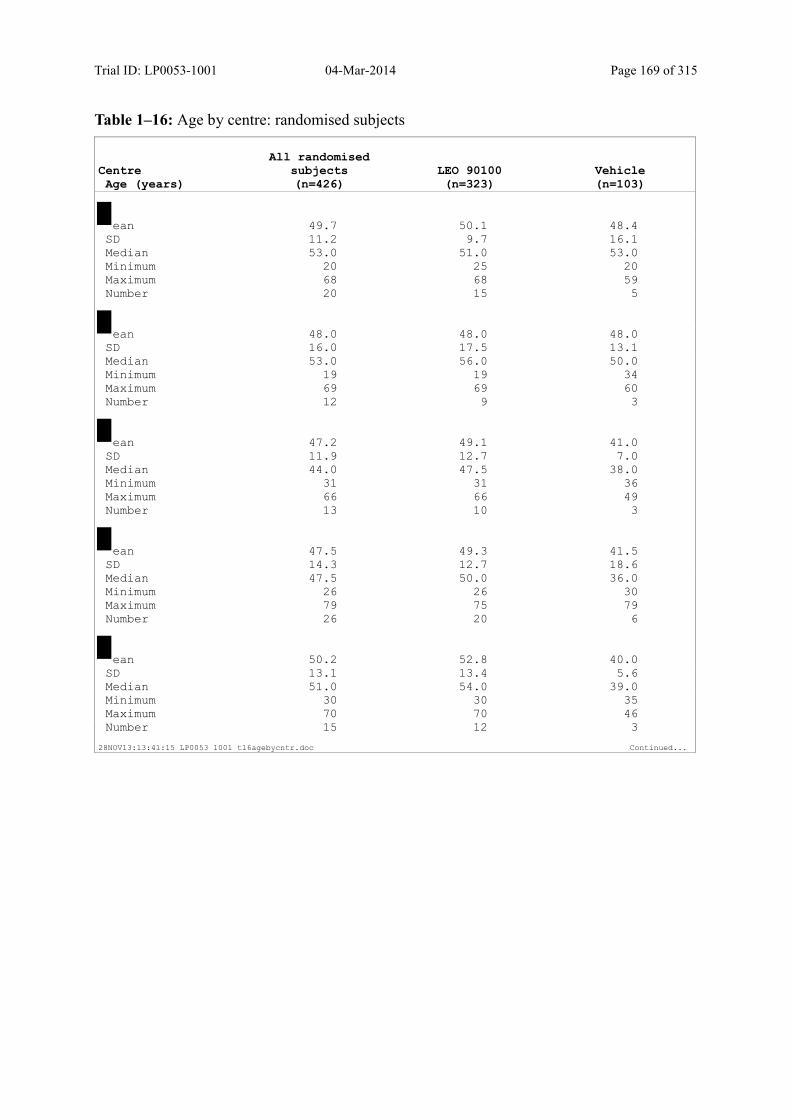
Trial ID: LP0053-1001 04-Mar-2014 Page 169 of 315
Table 1–16: Age by centre: randomised subjects
CentreAge (years)
All randomised subjects(n=426)
LEO 90100(n=323)
Vehicle(n=103)
ean 49.7 50.1 48.4 SD 11.2 9.7 16.1 Median 53.0 51.0 53.0 Minimum 20 25 20 Maximum 68 68 59 Number 20 15 5
ean 48.0 48.0 48.0 SD 16.0 17.5 13.1 Median 53.0 56.0 50.0 Minimum 19 19 34 Maximum 69 69 60 Number 12 9 3
ean 47.2 49.1 41.0 SD 11.9 12.7 7.0 Median 44.0 47.5 38.0 Minimum 31 31 36 Maximum 66 66 49 Number 13 10 3
ean 47.5 49.3 41.5 SD 14.3 12.7 18.6 Median 47.5 50.0 36.0 Minimum 26 26 30 Maximum 79 75 79 Number 26 20 6
ean 50.2 52.8 40.0 SD 13.1 13.4 5.6 Median 51.0 54.0 39.0 Minimum 30 30 35 Maximum 70 70 46 Number 15 12 3
28NOV13:13:41:15 LP0053 1001 t16agebycntr.doc Continued...

Trial ID: LP0053-1001 04-Mar-2014 Page 170 of 315
Table 1–16: Age by centre: randomised subjects, continued
CentreAge (years)
All randomised subjects(n=426)
LEO 90100(n=323)
Vehicle(n=103)
ean 56.4 58.0 51.6 SD 14.1 13.2 16.7 Median 51.0 55.0 46.0 Minimum 32 32 33 Maximum 78 78 75 Number 28 21 7
ean 43.5 44.9 39.3 SD 12.4 13.1 10.0 Median 44.0 46.0 37.5 Minimum 23 23 30 Maximum 66 66 54 Number 23 17 6
ean 49.0 49.5 47.8 SD 10.3 10.8 9.3 Median 50.0 50.0 50.0 Minimum 24 24 34 Maximum 75 75 57 Number 22 16 6
ean 48.1 49.4 43.7 SD 17.5 17.8 19.3 Median 50.0 48.0 50.0 Minimum 20 20 22 Maximum 80 80 59 Number 13 10 3
ean 51.9 54.6 44.7 SD 15.7 14.5 19.5 Median 60.0 60.0 36.0 Minimum 31 32 31 Maximum 70 70 67 Number 11 8 3
28NOV13:13:41:15 LP0053 1001 t16agebycntr.doc Continued...

Trial ID: LP0053-1001 04-Mar-2014 Page 171 of 315
Table 1–16: Age by centre: randomised subjects, continued
CentreAge (years)
All randomised subjects(n=426)
LEO 90100(n=323)
Vehicle(n=103)
ean 62.3 62.4 62.0 SD 12.1 13.6 Median 64.5 65.0 62.0 Minimum 40 40 62 Maximum 77 77 62 Number 6 5 1
ean 51.2 57.1 37.2 SD 15.6 11.9 15.2 Median 54.0 58.0 33.0 Minimum 20 37 20 Maximum 71 71 54 Number 17 12 5
ean 50.8 52.6 44.7 SD 11.0 9.7 15.0 Median 52.0 52.5 46.0 Minimum 29 35 29 Maximum 71 71 59 Number 13 10 3
ean 54.7 55.0 53.8 SD 10.9 12.3 4.0 Median 56.0 56.0 54.0 Minimum 31 31 48 Maximum 81 81 59 Number 26 20 6
ean 47.4 50.8 37.0 SD 14.3 15.1 0.0 Median 41.5 44.5 37.0 Minimum 37 38 37 Maximum 75 75 37 Number 8 6 2
28NOV13:13:41:15 LP0053 1001 t16agebycntr.doc Continued...

Trial ID: LP0053-1001 04-Mar-2014 Page 172 of 315
Table 1–16: Age by centre: randomised subjects, continued
CentreAge (years)
All randomised subjects(n=426)
LEO 90100(n=323)
Vehicle(n=103)
ean 44.3 44.5 43.8 SD 12.5 14.3 4.3 Median 46.0 48.0 44.5 Minimum 18 18 38 Maximum 67 67 48 Number 17 13 4
ean 50.1 48.4 57.5 SD 13.1 12.8 16.3 Median 50.0 50.0 57.5 Minimum 31 31 46 Maximum 70 70 69 Number 11 9 2
ean 60.5 61.3 58.0 SD 12.7 13.1 13.9 Median 59.5 62.0 50.0 Minimum 37 37 50 Maximum 79 79 74 Number 12 9 3
ean 48.2 43.9 67.5 SD 15.4 13.4 0.7 Median 46.0 45.0 67.5 Minimum 18 18 67 Maximum 68 61 68 Number 11 9 2
ean 49.5 53.3 38.0 SD 14.3 12.7 14.0 Median 50.5 55.5 42.0 Minimum 19 31 19 Maximum 69 69 49 Number 16 12 4
28NOV13:13:41:15 LP0053 1001 t16agebycntr.doc Continued...
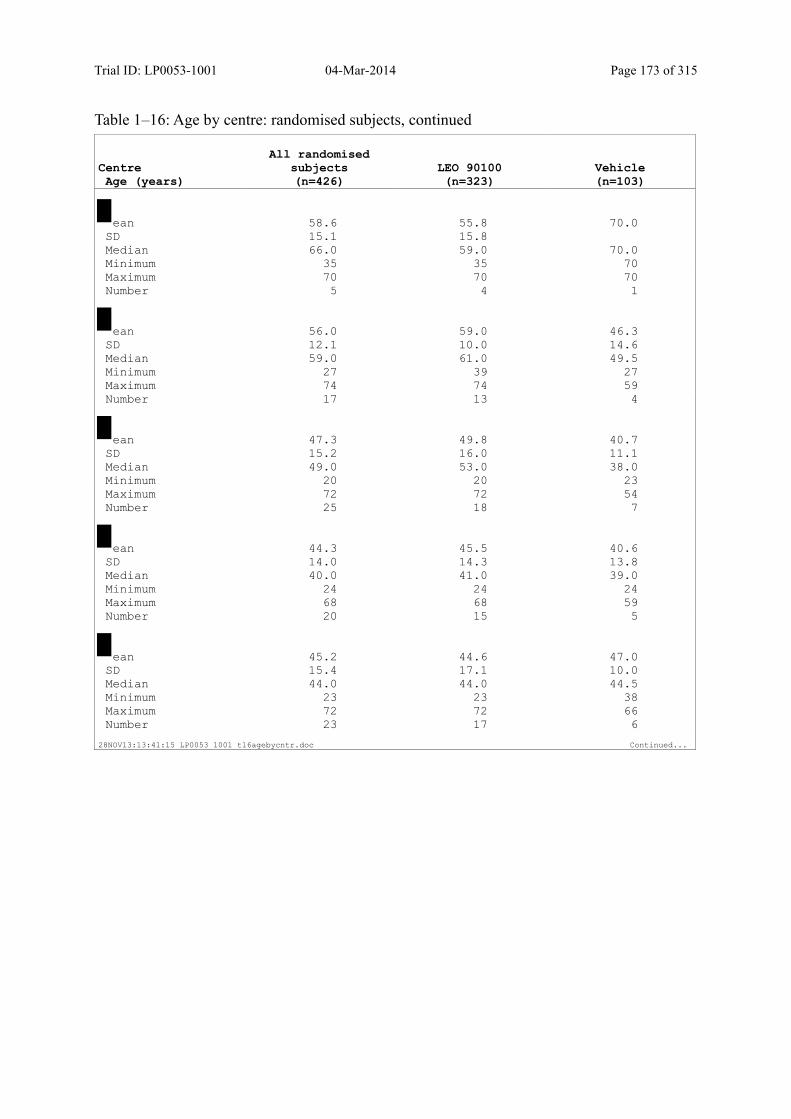
Trial ID: LP0053-1001 04-Mar-2014 Page 173 of 315
Table 1–16: Age by centre: randomised subjects, continued
CentreAge (years)
All randomised subjects(n=426)
LEO 90100(n=323)
Vehicle(n=103)
ean 58.6 55.8 70.0 SD 15.1 15.8 Median 66.0 59.0 70.0 Minimum 35 35 70 Maximum 70 70 70 Number 5 4 1
ean 56.0 59.0 46.3 SD 12.1 10.0 14.6 Median 59.0 61.0 49.5 Minimum 27 39 27 Maximum 74 74 59 Number 17 13 4
ean 47.3 49.8 40.7 SD 15.2 16.0 11.1 Median 49.0 53.0 38.0 Minimum 20 20 23 Maximum 72 72 54 Number 25 18 7
ean 44.3 45.5 40.6 SD 14.0 14.3 13.8 Median 40.0 41.0 39.0 Minimum 24 24 24 Maximum 68 68 59 Number 20 15 5
ean 45.2 44.6 47.0 SD 15.4 17.1 10.0 Median 44.0 44.0 44.5 Minimum 23 23 38 Maximum 72 72 66 Number 23 17 6
28NOV13:13:41:15 LP0053 1001 t16agebycntr.doc Continued...
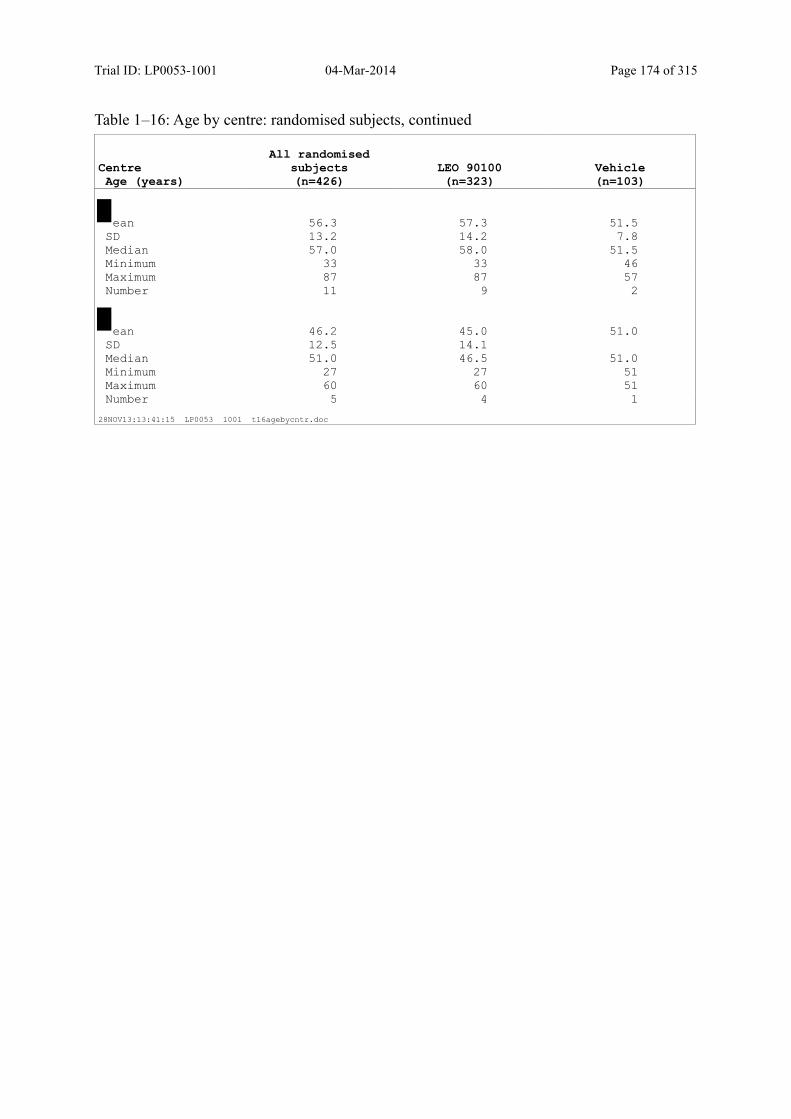
Trial ID: LP0053-1001 04-Mar-2014 Page 174 of 315
Table 1–16: Age by centre: randomised subjects, continued
CentreAge (years)
All randomised subjects(n=426)
LEO 90100(n=323)
Vehicle(n=103)
ean 56.3 57.3 51.5 SD 13.2 14.2 7.8 Median 57.0 58.0 51.5 Minimum 33 33 46 Maximum 87 87 57 Number 11 9 2
ean 46.2 45.0 51.0 SD 12.5 14.1 Median 51.0 46.5 51.0 Minimum 27 27 51 Maximum 60 60 51 Number 5 4 1
28NOV13:13:41:15 LP0053 1001 t16agebycntr.doc
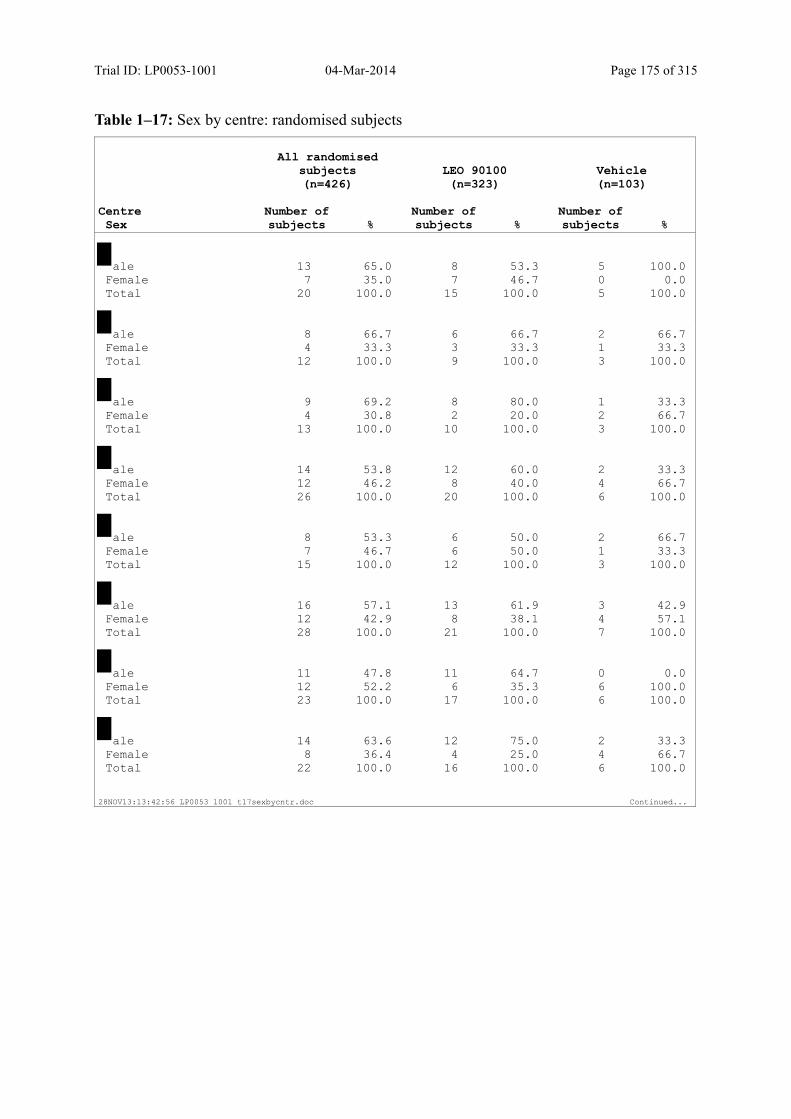
Trial ID: LP0053-1001 04-Mar-2014 Page 175 of 315
Table 1–17: Sex by centre: randomised subjects
All randomised subjects(n=426)
LEO 90100(n=323)
Vehicle(n=103)
CentreSex
Number of subjects %
Number of subjects %
Number of subjects %
ale 13 65.0 8 53.3 5 100.0 Female 7 35.0 7 46.7 0 0.0 Total 20 100.0 15 100.0 5 100.0
ale 8 66.7 6 66.7 2 66.7 Female 4 33.3 3 33.3 1 33.3 Total 12 100.0 9 100.0 3 100.0
ale 9 69.2 8 80.0 1 33.3 Female 4 30.8 2 20.0 2 66.7 Total 13 100.0 10 100.0 3 100.0
ale 14 53.8 12 60.0 2 33.3 Female 12 46.2 8 40.0 4 66.7 Total 26 100.0 20 100.0 6 100.0
ale 8 53.3 6 50.0 2 66.7 Female 7 46.7 6 50.0 1 33.3 Total 15 100.0 12 100.0 3 100.0
ale 16 57.1 13 61.9 3 42.9 Female 12 42.9 8 38.1 4 57.1 Total 28 100.0 21 100.0 7 100.0
ale 11 47.8 11 64.7 0 0.0 Female 12 52.2 6 35.3 6 100.0 Total 23 100.0 17 100.0 6 100.0
ale 14 63.6 12 75.0 2 33.3 Female 8 36.4 4 25.0 4 66.7 Total 22 100.0 16 100.0 6 100.0
28NOV13:13:42:56 LP0053 1001 t17sexbycntr.doc Continued...
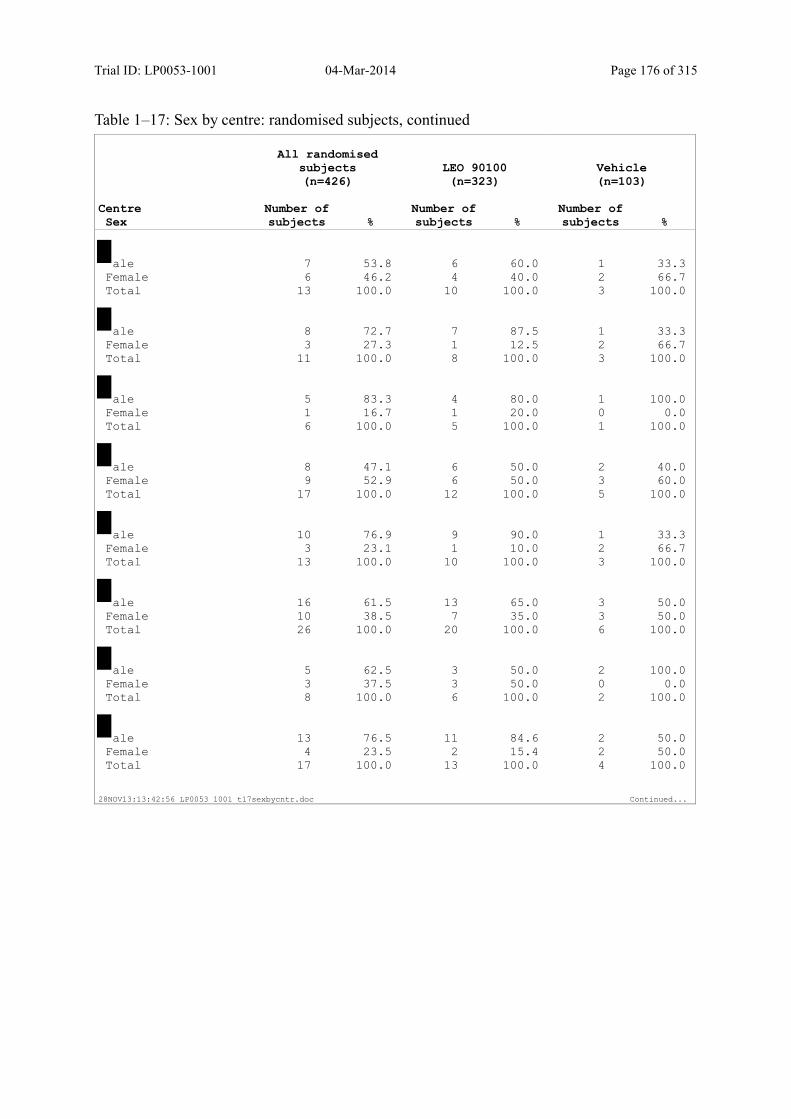
Trial ID: LP0053-1001 04-Mar-2014 Page 176 of 315
Table 1–17: Sex by centre: randomised subjects, continued
All randomised subjects(n=426)
LEO 90100(n=323)
Vehicle(n=103)
CentreSex
Number of subjects %
Number of subjects %
Number of subjects %
ale 7 53.8 6 60.0 1 33.3 Female 6 46.2 4 40.0 2 66.7 Total 13 100.0 10 100.0 3 100.0
ale 8 72.7 7 87.5 1 33.3 Female 3 27.3 1 12.5 2 66.7 Total 11 100.0 8 100.0 3 100.0
ale 5 83.3 4 80.0 1 100.0 Female 1 16.7 1 20.0 0 0.0 Total 6 100.0 5 100.0 1 100.0
ale 8 47.1 6 50.0 2 40.0 Female 9 52.9 6 50.0 3 60.0 Total 17 100.0 12 100.0 5 100.0
ale 10 76.9 9 90.0 1 33.3 Female 3 23.1 1 10.0 2 66.7 Total 13 100.0 10 100.0 3 100.0
ale 16 61.5 13 65.0 3 50.0 Female 10 38.5 7 35.0 3 50.0 Total 26 100.0 20 100.0 6 100.0
ale 5 62.5 3 50.0 2 100.0 Female 3 37.5 3 50.0 0 0.0 Total 8 100.0 6 100.0 2 100.0
ale 13 76.5 11 84.6 2 50.0 Female 4 23.5 2 15.4 2 50.0 Total 17 100.0 13 100.0 4 100.0
28NOV13:13:42:56 LP0053 1001 t17sexbycntr.doc Continued...

Trial ID: LP0053-1001 04-Mar-2014 Page 177 of 315
Table 1–17: Sex by centre: randomised subjects, continued
All randomised subjects(n=426)
LEO 90100(n=323)
Vehicle(n=103)
CentreSex
Number of subjects %
Number of subjects %
Number of subjects %
ale 6 54.5 5 55.6 1 50.0 Female 5 45.5 4 44.4 1 50.0 Total 11 100.0 9 100.0 2 100.0
ale 12 100.0 9 100.0 3 100.0 Total 12 100.0 9 100.0 3 100.0
ale 8 72.7 6 66.7 2 100.0 Female 3 27.3 3 33.3 0 0.0 Total 11 100.0 9 100.0 2 100.0
ale 13 81.3 10 83.3 3 75.0 Female 3 18.8 2 16.7 1 25.0 Total 16 100.0 12 100.0 4 100.0
ale 4 80.0 3 75.0 1 100.0 Female 1 20.0 1 25.0 0 0.0 Total 5 100.0 4 100.0 1 100.0
ale 10 58.8 7 53.8 3 75.0 Female 7 41.2 6 46.2 1 25.0 Total 17 100.0 13 100.0 4 100.0
ale 7 28.0 6 33.3 1 14.3 Female 18 72.0 12 66.7 6 85.7 Total 25 100.0 18 100.0 7 100.0
Male 5 25.0 4 26.7 1 20.0 Female 15 75.0 11 73.3 4 80.0 Total 20 100.0 15 100.0 5 100.0
28NOV13:13:42:56 LP0053 1001 t17sexbycntr.doc Continued...
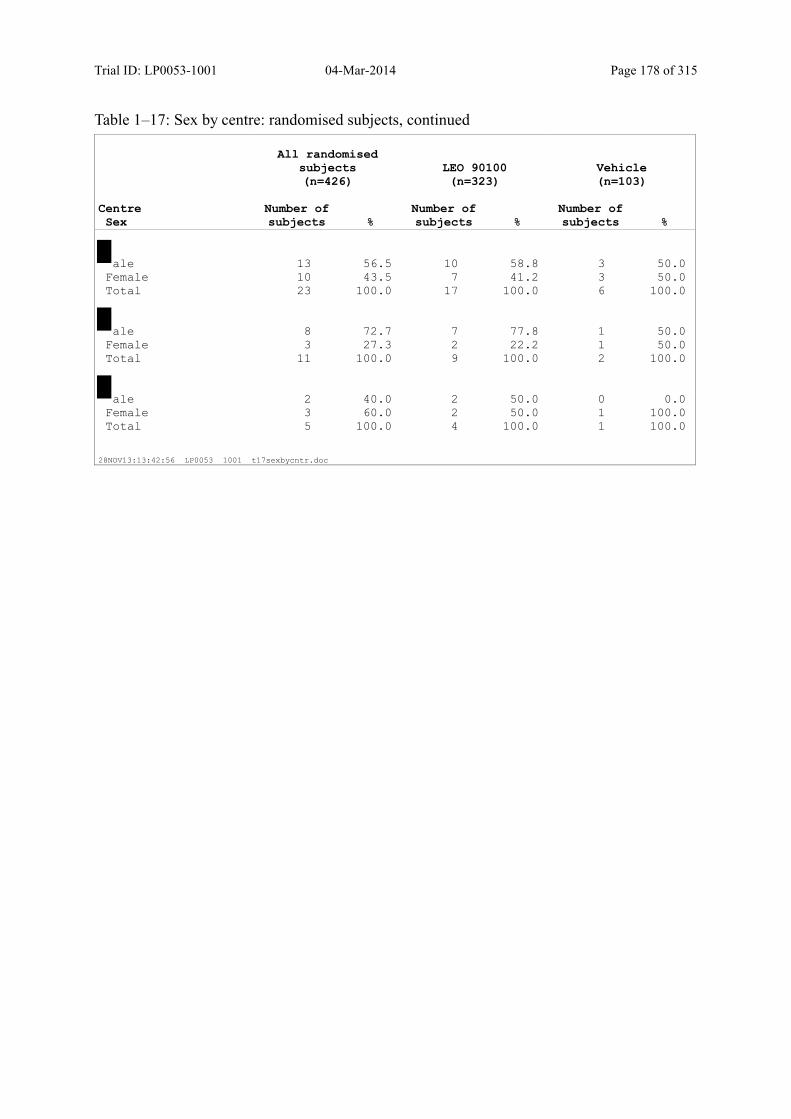
Trial ID: LP0053-1001 04-Mar-2014 Page 178 of 315
Table 1–17: Sex by centre: randomised subjects, continued
All randomised subjects(n=426)
LEO 90100(n=323)
Vehicle(n=103)
CentreSex
Number of subjects %
Number of subjects %
Number of subjects %
ale 13 56.5 10 58.8 3 50.0 Female 10 43.5 7 41.2 3 50.0 Total 23 100.0 17 100.0 6 100.0
ale 8 72.7 7 77.8 1 50.0 Female 3 27.3 2 22.2 1 50.0 Total 11 100.0 9 100.0 2 100.0
ale 2 40.0 2 50.0 0 0.0 Female 3 60.0 2 50.0 1 100.0 Total 5 100.0 4 100.0 1 100.0
28NOV13:13:42:56 LP0053 1001 t17sexbycntr.doc
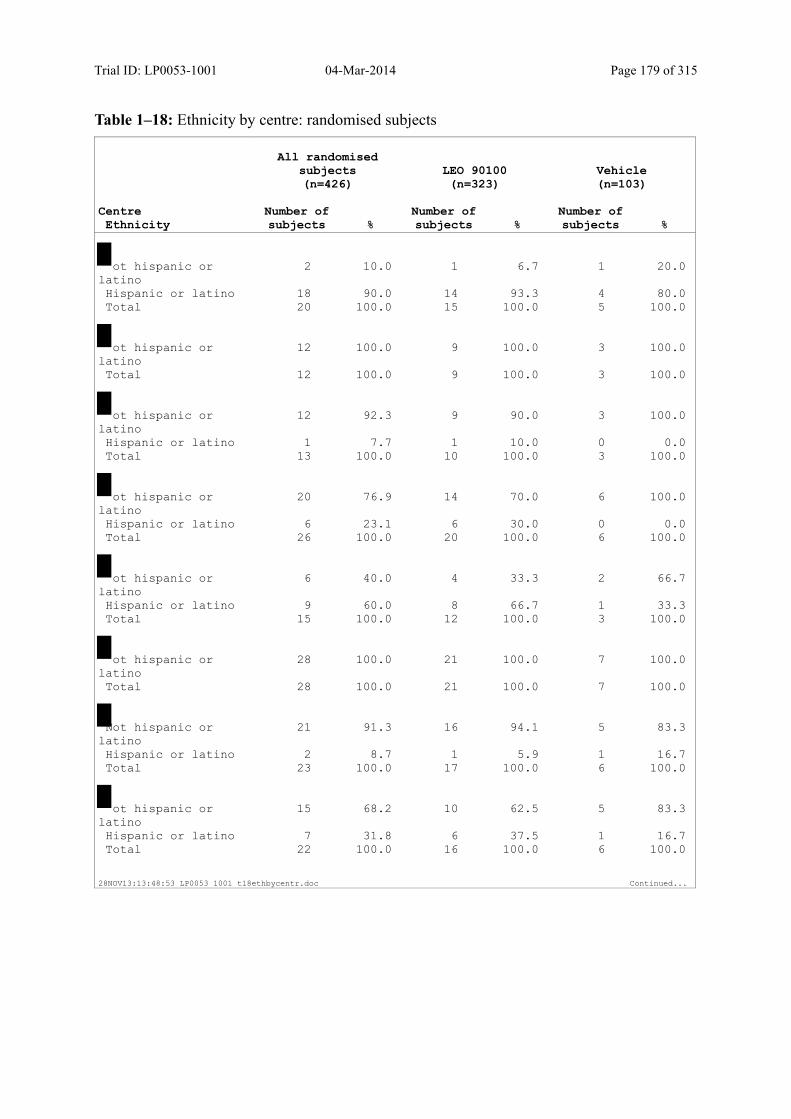
Trial ID: LP0053-1001 04-Mar-2014 Page 179 of 315
Table 1–18: Ethnicity by centre: randomised subjects
All randomised subjects(n=426)
LEO 90100(n=323)
Vehicle(n=103)
CentreEthnicity
Number of subjects %
Number of subjects %
Number of subjects %
ot hispanic or latino
2 10.0 1 6.7 1 20.0
Hispanic or latino 18 90.0 14 93.3 4 80.0 Total 20 100.0 15 100.0 5 100.0
ot hispanic or latino
12 100.0 9 100.0 3 100.0
Total 12 100.0 9 100.0 3 100.0
ot hispanic or latino
12 92.3 9 90.0 3 100.0
Hispanic or latino 1 7.7 1 10.0 0 0.0 Total 13 100.0 10 100.0 3 100.0
ot hispanic or latino
20 76.9 14 70.0 6 100.0
Hispanic or latino 6 23.1 6 30.0 0 0.0 Total 26 100.0 20 100.0 6 100.0
ot hispanic or latino
6 40.0 4 33.3 2 66.7
Hispanic or latino 9 60.0 8 66.7 1 33.3 Total 15 100.0 12 100.0 3 100.0
ot hispanic or latino
28 100.0 21 100.0 7 100.0
Total 28 100.0 21 100.0 7 100.0
Not hispanic or latino
21 91.3 16 94.1 5 83.3
Hispanic or latino 2 8.7 1 5.9 1 16.7 Total 23 100.0 17 100.0 6 100.0
ot hispanic or latino
15 68.2 10 62.5 5 83.3
Hispanic or latino 7 31.8 6 37.5 1 16.7 Total 22 100.0 16 100.0 6 100.0
28NOV13:13:48:53 LP0053 1001 t18ethbycentr.doc Continued...
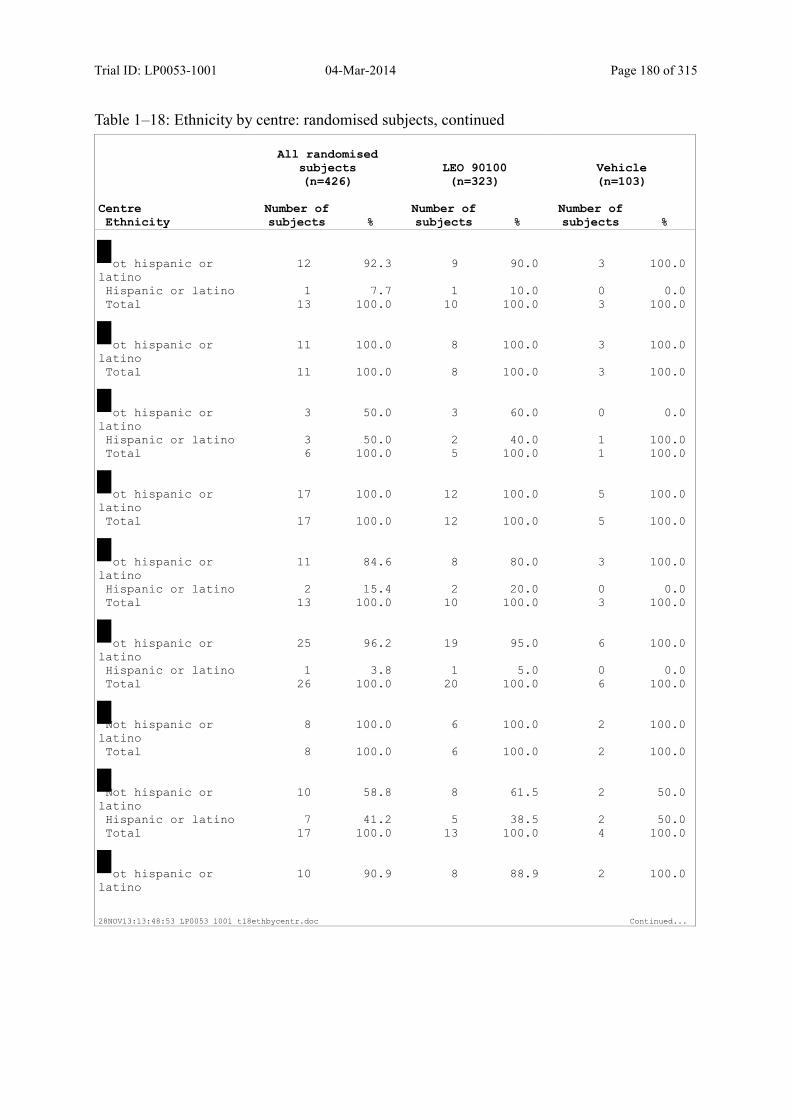
Trial ID: LP0053-1001 04-Mar-2014 Page 180 of 315
Table 1–18: Ethnicity by centre: randomised subjects, continued
All randomised subjects(n=426)
LEO 90100(n=323)
Vehicle(n=103)
CentreEthnicity
Number of subjects %
Number of subjects %
Number of subjects %
ot hispanic or latino
12 92.3 9 90.0 3 100.0
Hispanic or latino 1 7.7 1 10.0 0 0.0 Total 13 100.0 10 100.0 3 100.0
ot hispanic or latino
11 100.0 8 100.0 3 100.0
Total 11 100.0 8 100.0 3 100.0
ot hispanic or latino
3 50.0 3 60.0 0 0.0
Hispanic or latino 3 50.0 2 40.0 1 100.0 Total 6 100.0 5 100.0 1 100.0
ot hispanic or latino
17 100.0 12 100.0 5 100.0
Total 17 100.0 12 100.0 5 100.0
ot hispanic or latino
11 84.6 8 80.0 3 100.0
Hispanic or latino 2 15.4 2 20.0 0 0.0 Total 13 100.0 10 100.0 3 100.0
ot hispanic or latino
25 96.2 19 95.0 6 100.0
Hispanic or latino 1 3.8 1 5.0 0 0.0 Total 26 100.0 20 100.0 6 100.0
Not hispanic or latino
8 100.0 6 100.0 2 100.0
Total 8 100.0 6 100.0 2 100.0
Not hispanic or latino
10 58.8 8 61.5 2 50.0
Hispanic or latino 7 41.2 5 38.5 2 50.0 Total 17 100.0 13 100.0 4 100.0
ot hispanic or latino
10 90.9 8 88.9 2 100.0
28NOV13:13:48:53 LP0053 1001 t18ethbycentr.doc Continued...
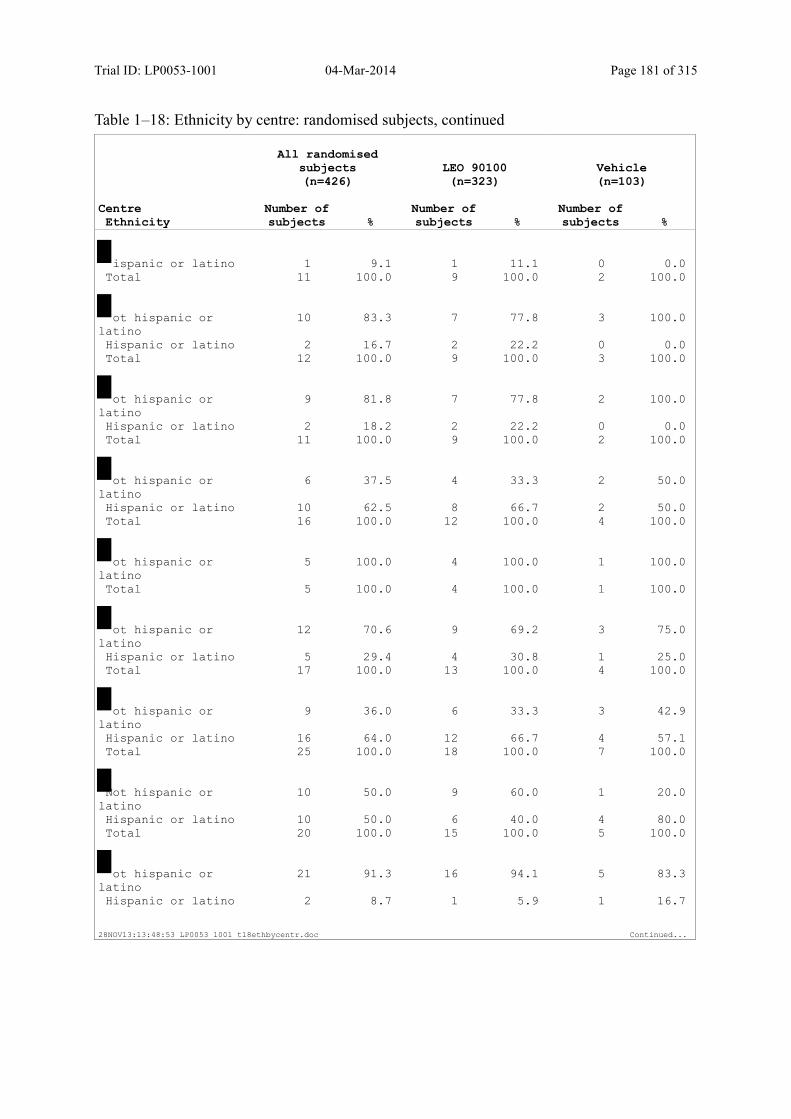
Trial ID: LP0053-1001 04-Mar-2014 Page 181 of 315
Table 1–18: Ethnicity by centre: randomised subjects, continued
All randomised subjects(n=426)
LEO 90100(n=323)
Vehicle(n=103)
CentreEthnicity
Number of subjects %
Number of subjects %
Number of subjects %
ispanic or latino 1 9.1 1 11.1 0 0.0 Total 11 100.0 9 100.0 2 100.0
ot hispanic or latino
10 83.3 7 77.8 3 100.0
Hispanic or latino 2 16.7 2 22.2 0 0.0 Total 12 100.0 9 100.0 3 100.0
ot hispanic or latino
9 81.8 7 77.8 2 100.0
Hispanic or latino 2 18.2 2 22.2 0 0.0 Total 11 100.0 9 100.0 2 100.0
ot hispanic or latino
6 37.5 4 33.3 2 50.0
Hispanic or latino 10 62.5 8 66.7 2 50.0 Total 16 100.0 12 100.0 4 100.0
ot hispanic or latino
5 100.0 4 100.0 1 100.0
Total 5 100.0 4 100.0 1 100.0
ot hispanic or latino
12 70.6 9 69.2 3 75.0
Hispanic or latino 5 29.4 4 30.8 1 25.0 Total 17 100.0 13 100.0 4 100.0
ot hispanic or latino
9 36.0 6 33.3 3 42.9
Hispanic or latino 16 64.0 12 66.7 4 57.1 Total 25 100.0 18 100.0 7 100.0
Not hispanic or latino
10 50.0 9 60.0 1 20.0
Hispanic or latino 10 50.0 6 40.0 4 80.0 Total 20 100.0 15 100.0 5 100.0
ot hispanic or latino
21 91.3 16 94.1 5 83.3
Hispanic or latino 2 8.7 1 5.9 1 16.7
28NOV13:13:48:53 LP0053 1001 t18ethbycentr.doc Continued...

Trial ID: LP0053-1001 04-Mar-2014 Page 182 of 315
Table 1–18: Ethnicity by centre: randomised subjects, continued
All randomised subjects(n=426)
LEO 90100(n=323)
Vehicle(n=103)
CentreEthnicity
Number of subjects %
Number of subjects %
Number of subjects %
otal 23 100.0 17 100.0 6 100.0
Not hispanic or latino
9 81.8 7 77.8 2 100.0
Hispanic or latino 2 18.2 2 22.2 0 0.0 Total 11 100.0 9 100.0 2 100.0
ot hispanic or latino
5 100.0 4 100.0 1 100.0
Total 5 100.0 4 100.0 1 100.0
28NOV13:13:48:53 LP0053 1001 t18ethbycentr.doc
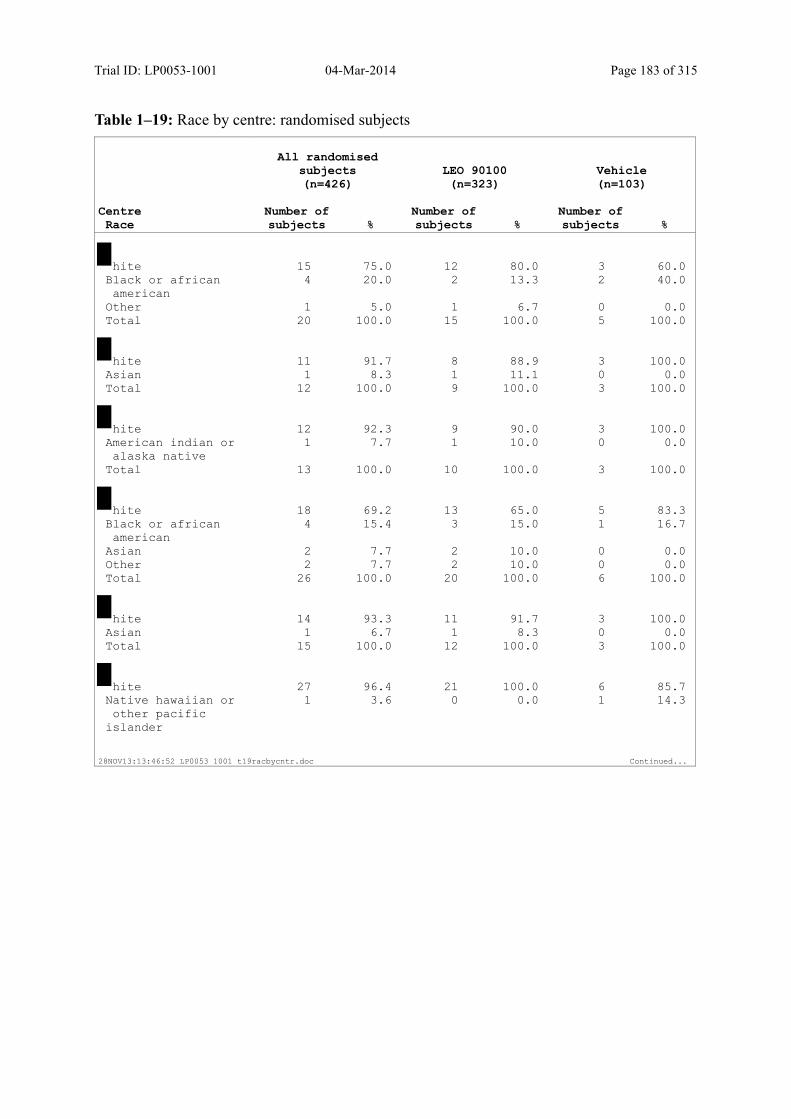
Trial ID: LP0053-1001 04-Mar-2014 Page 183 of 315
Table 1–19: Race by centre: randomised subjects
All randomised subjects(n=426)
LEO 90100(n=323)
Vehicle(n=103)
CentreRace
Number of subjects %
Number of subjects %
Number of subjects %
hite 15 75.0 12 80.0 3 60.0 Black or african american
4 20.0 2 13.3 2 40.0
Other 1 5.0 1 6.7 0 0.0 Total 20 100.0 15 100.0 5 100.0
hite 11 91.7 8 88.9 3 100.0 Asian 1 8.3 1 11.1 0 0.0 Total 12 100.0 9 100.0 3 100.0
hite 12 92.3 9 90.0 3 100.0 American indian or alaska native
1 7.7 1 10.0 0 0.0
Total 13 100.0 10 100.0 3 100.0
hite 18 69.2 13 65.0 5 83.3 Black or african american
4 15.4 3 15.0 1 16.7
Asian 2 7.7 2 10.0 0 0.0 Other 2 7.7 2 10.0 0 0.0 Total 26 100.0 20 100.0 6 100.0
hite 14 93.3 11 91.7 3 100.0 Asian 1 6.7 1 8.3 0 0.0 Total 15 100.0 12 100.0 3 100.0
hite 27 96.4 21 100.0 6 85.7 Native hawaiian or other pacific
islander
1 3.6 0 0.0 1 14.3
28NOV13:13:46:52 LP0053 1001 t19racbycntr.doc Continued...

Trial ID: LP0053-1001 04-Mar-2014 Page 184 of 315
Table 1–19: Race by centre: randomised subjects, continued
All randomised subjects(n=426)
LEO 90100(n=323)
Vehicle(n=103)
CentreRace
Number of subjects %
Number of subjects %
Number of subjects %
otal 28 100.0 21 100.0 7 100.0
White 20 87.0 15 88.2 5 83.3 Black or african american
3 13.0 2 11.8 1 16.7
Total 23 100.0 17 100.0 6 100.0
hite 18 81.8 14 87.5 4 66.7 Asian 2 9.1 0 0.0 2 33.3 Native hawaiian or other pacific
islander
1 4.5 1 6.3 0 0.0
Other 1 4.5 1 6.3 0 0.0 Total 22 100.0 16 100.0 6 100.0
hite 12 92.3 9 90.0 3 100.0 Black or african american
1 7.7 1 10.0 0 0.0
Total 13 100.0 10 100.0 3 100.0
hite 10 90.9 8 100.0 2 66.7 Black or african american
1 9.1 0 0.0 1 33.3
Total 11 100.0 8 100.0 3 100.0
hite 2 33.3 2 40.0 0 0.0 Native hawaiian or other pacific
islander
1 16.7 1 20.0 0 0.0
Other 3 50.0 2 40.0 1 100.0 Total 6 100.0 5 100.0 1 100.0
28NOV13:13:46:52 LP0053 1001 t19racbycntr.doc Continued...
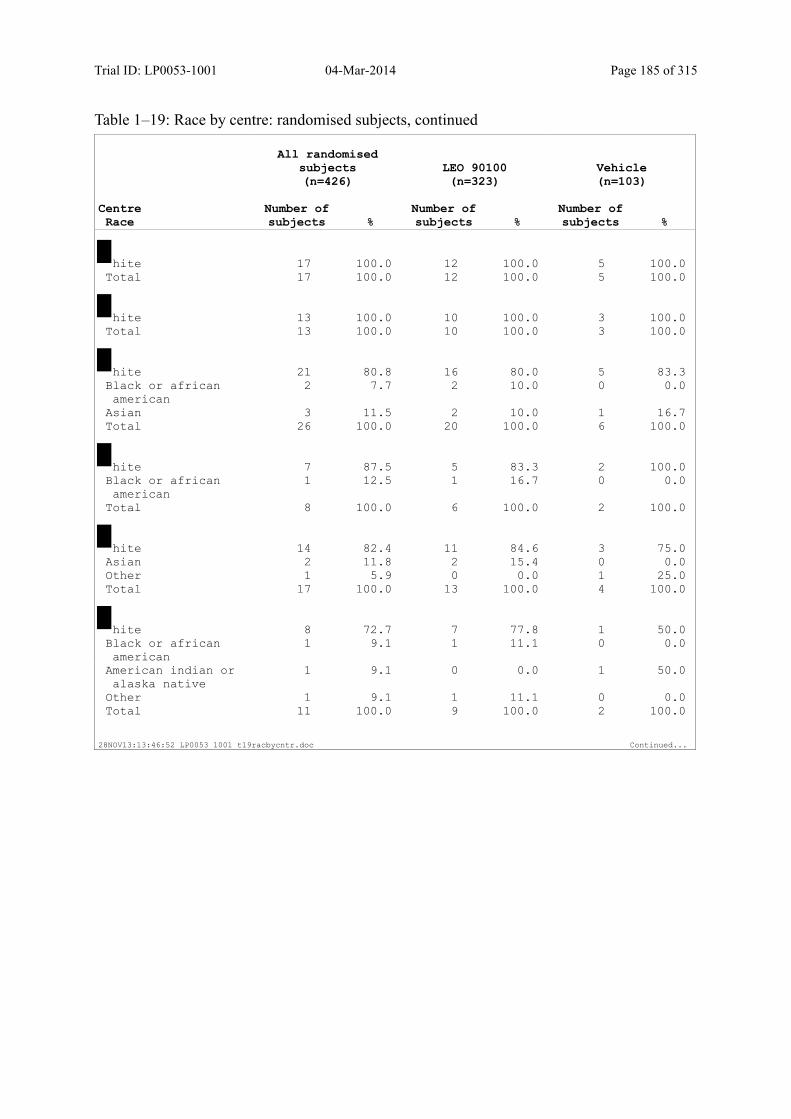
Trial ID: LP0053-1001 04-Mar-2014 Page 185 of 315
Table 1–19: Race by centre: randomised subjects, continued
All randomised subjects(n=426)
LEO 90100(n=323)
Vehicle(n=103)
CentreRace
Number of subjects %
Number of subjects %
Number of subjects %
hite 17 100.0 12 100.0 5 100.0 Total 17 100.0 12 100.0 5 100.0
hite 13 100.0 10 100.0 3 100.0 Total 13 100.0 10 100.0 3 100.0
hite 21 80.8 16 80.0 5 83.3 Black or african american
2 7.7 2 10.0 0 0.0
Asian 3 11.5 2 10.0 1 16.7 Total 26 100.0 20 100.0 6 100.0
hite 7 87.5 5 83.3 2 100.0 Black or african american
1 12.5 1 16.7 0 0.0
Total 8 100.0 6 100.0 2 100.0
hite 14 82.4 11 84.6 3 75.0 Asian 2 11.8 2 15.4 0 0.0 Other 1 5.9 0 0.0 1 25.0 Total 17 100.0 13 100.0 4 100.0
hite 8 72.7 7 77.8 1 50.0 Black or african american
1 9.1 1 11.1 0 0.0
American indian or alaska native
1 9.1 0 0.0 1 50.0
Other 1 9.1 1 11.1 0 0.0 Total 11 100.0 9 100.0 2 100.0
28NOV13:13:46:52 LP0053 1001 t19racbycntr.doc Continued...
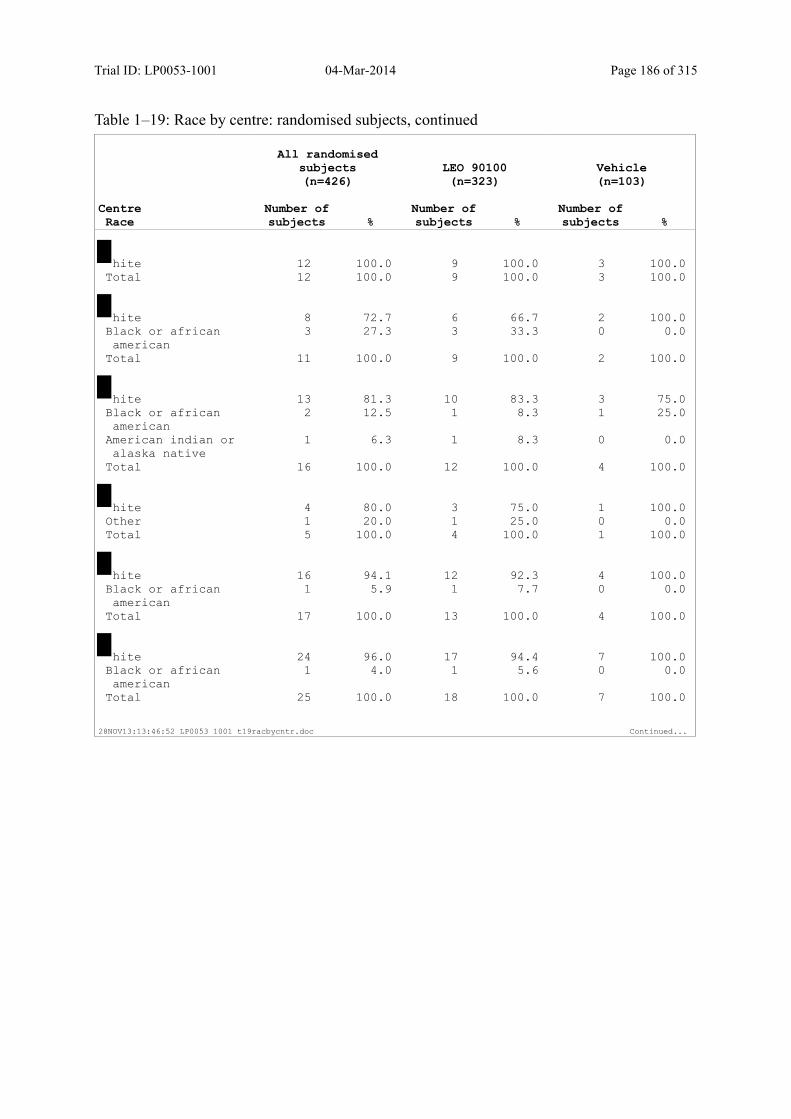
Trial ID: LP0053-1001 04-Mar-2014 Page 186 of 315
Table 1–19: Race by centre: randomised subjects, continued
All randomised subjects(n=426)
LEO 90100(n=323)
Vehicle(n=103)
CentreRace
Number of subjects %
Number of subjects %
Number of subjects %
hite 12 100.0 9 100.0 3 100.0 Total 12 100.0 9 100.0 3 100.0
hite 8 72.7 6 66.7 2 100.0 Black or african american
3 27.3 3 33.3 0 0.0
Total 11 100.0 9 100.0 2 100.0
hite 13 81.3 10 83.3 3 75.0 Black or african american
2 12.5 1 8.3 1 25.0
American indian or alaska native
1 6.3 1 8.3 0 0.0
Total 16 100.0 12 100.0 4 100.0
hite 4 80.0 3 75.0 1 100.0 Other 1 20.0 1 25.0 0 0.0 Total 5 100.0 4 100.0 1 100.0
hite 16 94.1 12 92.3 4 100.0 Black or african american
1 5.9 1 7.7 0 0.0
Total 17 100.0 13 100.0 4 100.0
hite 24 96.0 17 94.4 7 100.0 Black or african american
1 4.0 1 5.6 0 0.0
Total 25 100.0 18 100.0 7 100.0
28NOV13:13:46:52 LP0053 1001 t19racbycntr.doc Continued...

Trial ID: LP0053-1001 04-Mar-2014 Page 187 of 315
Table 1–19: Race by centre: randomised subjects, continued
All randomised subjects(n=426)
LEO 90100(n=323)
Vehicle(n=103)
CentreRace
Number of subjects %
Number of subjects %
Number of subjects %
hite 15 75.0 10 66.7 5 100.0 Black or african american
4 20.0 4 26.7 0 0.0
Asian 1 5.0 1 6.7 0 0.0 Total 20 100.0 15 100.0 5 100.0
hite 22 95.7 16 94.1 6 100.0 American indian or alaska native
1 4.3 1 5.9 0 0.0
Total 23 100.0 17 100.0 6 100.0
hite 9 81.8 7 77.8 2 100.0 Black or african american
1 9.1 1 11.1 0 0.0
Asian 1 9.1 1 11.1 0 0.0 Total 11 100.0 9 100.0 2 100.0
hite 4 80.0 3 75.0 1 100.0 Black or african american
1 20.0 1 25.0 0 0.0
Total 5 100.0 4 100.0 1 100.0
28NOV13:13:46:52 LP0053 1001 t19racbycntr.doc

Trial ID: LP0053-1001 04-Mar-2014 Page 188 of 315
Table 1–20: Baseline IGA by centre: randomised subjects
All randomised subjects(n=426)
LEO 90100(n=323)
Vehicle(n=103)
CentreIGA
Number of subjects %
Number of subjects %
Number of subjects %
ild 11 55.0 9 60.0 2 40.0 Moderate 9 45.0 6 40.0 3 60.0 Total 20 100.0 15 100.0 5 100.0
ild 1 8.3 1 11.1 0 0.0 Moderate 9 75.0 6 66.7 3 100.0 Severe 2 16.7 2 22.2 0 0.0 Total 12 100.0 9 100.0 3 100.0
ild 4 30.8 2 20.0 2 66.7 Moderate 9 69.2 8 80.0 1 33.3 Total 13 100.0 10 100.0 3 100.0
ild 2 7.7 2 10.0 0 0.0 Moderate 21 80.8 16 80.0 5 83.3 Severe 3 11.5 2 10.0 1 16.7 Total 26 100.0 20 100.0 6 100.0
ild 1 6.7 1 8.3 0 0.0 Moderate 14 93.3 11 91.7 3 100.0 Total 15 100.0 12 100.0 3 100.0
ild 1 3.6 1 4.8 0 0.0 Moderate 20 71.4 14 66.7 6 85.7 Severe 7 25.0 6 28.6 1 14.3 Total 28 100.0 21 100.0 7 100.0
ild 2 8.7 1 5.9 1 16.7 Moderate 17 73.9 15 88.2 2 33.3 Severe 4 17.4 1 5.9 3 50.0 Total 23 100.0 17 100.0 6 100.0
28NOV13:13:53:57 LP0053 1001 t20igabycntr.doc Continued...
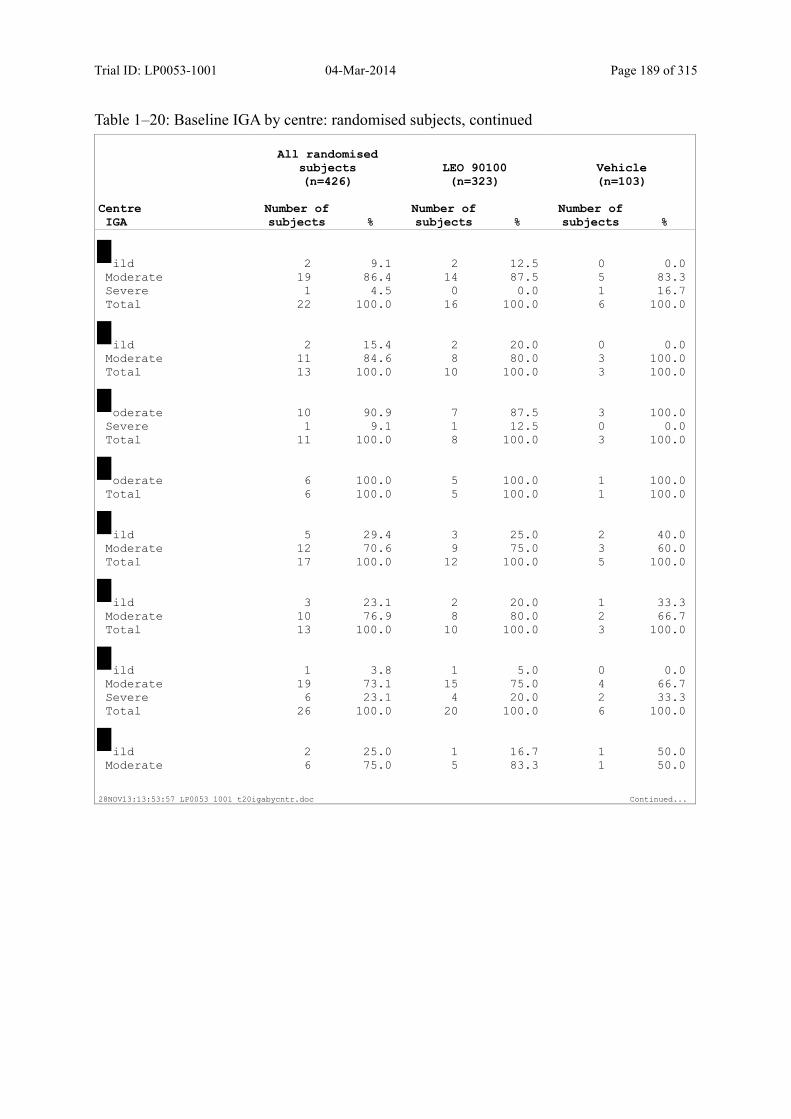
Trial ID: LP0053-1001 04-Mar-2014 Page 189 of 315
Table 1–20: Baseline IGA by centre: randomised subjects, continued
All randomised subjects(n=426)
LEO 90100(n=323)
Vehicle(n=103)
CentreIGA
Number of subjects %
Number ofsubjects %
Number of subjects %
ild 2 9.1 2 12.5 0 0.0 Moderate 19 86.4 14 87.5 5 83.3 Severe 1 4.5 0 0.0 1 16.7 Total 22 100.0 16 100.0 6 100.0
ild 2 15.4 2 20.0 0 0.0 Moderate 11 84.6 8 80.0 3 100.0 Total 13 100.0 10 100.0 3 100.0
oderate 10 90.9 7 87.5 3 100.0 Severe 1 9.1 1 12.5 0 0.0 Total 11 100.0 8 100.0 3 100.0
oderate 6 100.0 5 100.0 1 100.0 Total 6 100.0 5 100.0 1 100.0
ild 5 29.4 3 25.0 2 40.0 Moderate 12 70.6 9 75.0 3 60.0 Total 17 100.0 12 100.0 5 100.0
ild 3 23.1 2 20.0 1 33.3 Moderate 10 76.9 8 80.0 2 66.7 Total 13 100.0 10 100.0 3 100.0
ild 1 3.8 1 5.0 0 0.0 Moderate 19 73.1 15 75.0 4 66.7 Severe 6 23.1 4 20.0 2 33.3 Total 26 100.0 20 100.0 6 100.0
ild 2 25.0 1 16.7 1 50.0 Moderate 6 75.0 5 83.3 1 50.0
28NOV13:13:53:57 LP0053 1001 t20igabycntr.doc Continued...
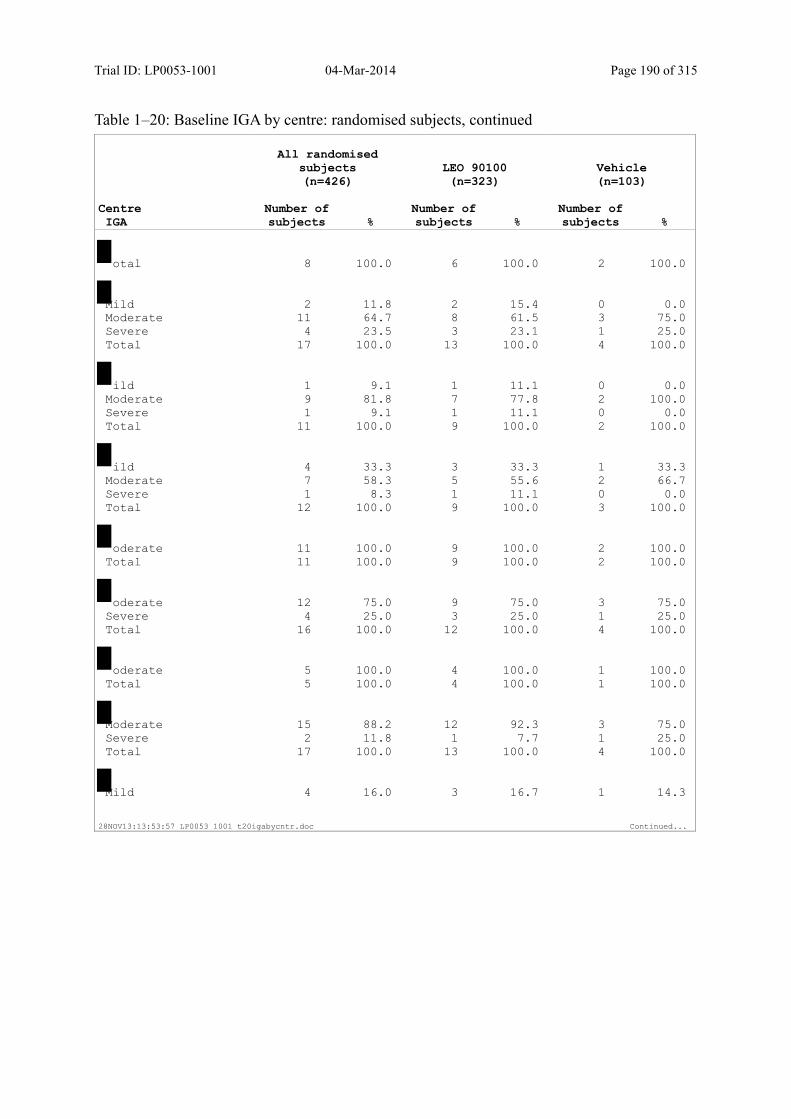
Trial ID: LP0053-1001 04-Mar-2014 Page 190 of 315
Table 1–20: Baseline IGA by centre: randomised subjects, continued
All randomised subjects(n=426)
LEO 90100(n=323)
Vehicle(n=103)
CentreIGA
Number of subjects %
Number of subjects %
Number of subjects %
otal 8 100.0 6 100.0 2 100.0
Mild 2 11.8 2 15.4 0 0.0 Moderate 11 64.7 8 61.5 3 75.0 Severe 4 23.5 3 23.1 1 25.0 Total 17 100.0 13 100.0 4 100.0
ild 1 9.1 1 11.1 0 0.0 Moderate 9 81.8 7 77.8 2 100.0 Severe 1 9.1 1 11.1 0 0.0 Total 11 100.0 9 100.0 2 100.0
ild 4 33.3 3 33.3 1 33.3 Moderate 7 58.3 5 55.6 2 66.7 Severe 1 8.3 1 11.1 0 0.0 Total 12 100.0 9 100.0 3 100.0
oderate 11 100.0 9 100.0 2 100.0 Total 11 100.0 9 100.0 2 100.0
oderate 12 75.0 9 75.0 3 75.0 Severe 4 25.0 3 25.0 1 25.0 Total 16 100.0 12 100.0 4 100.0
oderate 5 100.0 4 100.0 1 100.0 Total 5 100.0 4 100.0 1 100.0
Moderate 15 88.2 12 92.3 3 75.0 Severe 2 11.8 1 7.7 1 25.0 Total 17 100.0 13 100.0 4 100.0
Mild 4 16.0 3 16.7 1 14.3
28NOV13:13:53:57 LP0053 1001 t20igabycntr.doc Continued...
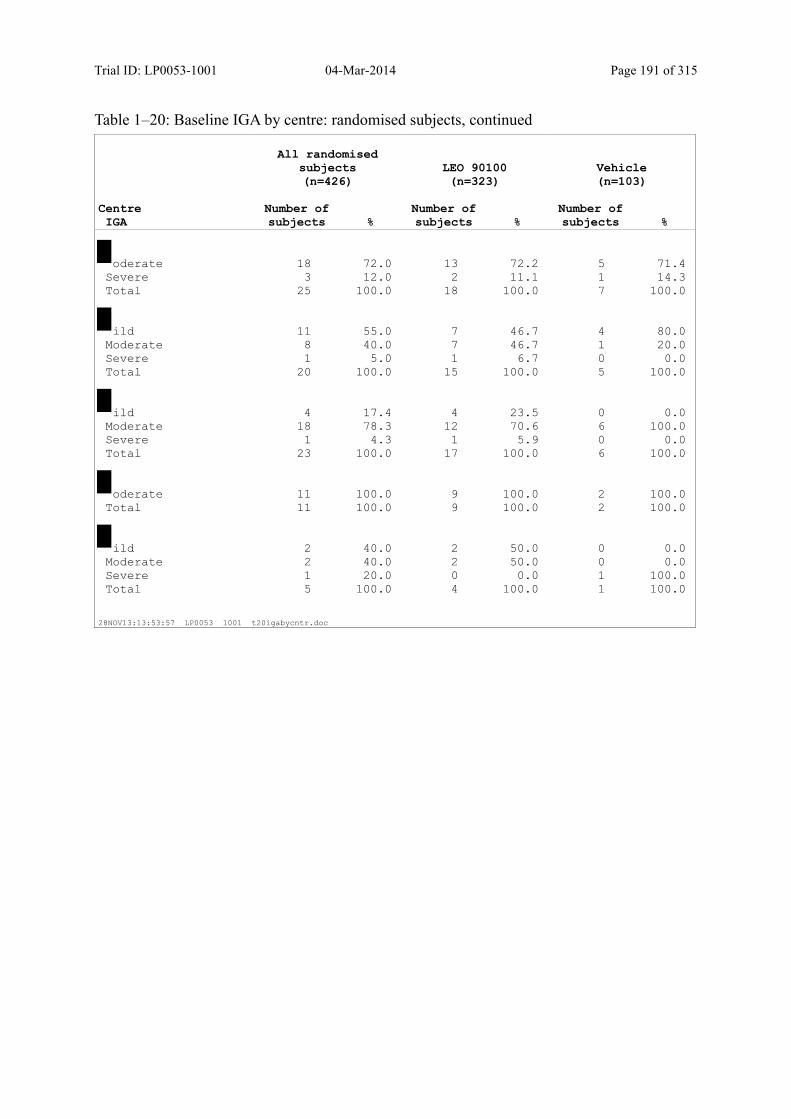
Trial ID: LP0053-1001 04-Mar-2014 Page 191 of 315
Table 1–20: Baseline IGA by centre: randomised subjects, continued
All randomised subjects(n=426)
LEO 90100(n=323)
Vehicle(n=103)
CentreIGA
Number of subjects %
Number of subjects %
Number of subjects %
oderate 18 72.0 13 72.2 5 71.4 Severe 3 12.0 2 11.1 1 14.3 Total 25 100.0 18 100.0 7 100.0
ild 11 55.0 7 46.7 4 80.0 Moderate 8 40.0 7 46.7 1 20.0 Severe 1 5.0 1 6.7 0 0.0 Total 20 100.0 15 100.0 5 100.0
ild 4 17.4 4 23.5 0 0.0 Moderate 18 78.3 12 70.6 6 100.0 Severe 1 4.3 1 5.9 0 0.0 Total 23 100.0 17 100.0 6 100.0
oderate 11 100.0 9 100.0 2 100.0 Total 11 100.0 9 100.0 2 100.0
ild 2 40.0 2 50.0 0 0.0 Moderate 2 40.0 2 50.0 0 0.0 Severe 1 20.0 0 0.0 1 100.0 Total 5 100.0 4 100.0 1 100.0
28NOV13:13:53:57 LP0053 1001 t20igabycntr.doc

Trial ID: LP0053-1001 04-Mar-2014 Page 192 of 315
Table 1–21: Subjects with photographs by centre: randomised subjects
All randomised subjects(n=426)
LEO 90100(n=323)
Vehicle(n=103)
CentrePhotos taken
Number of subjects %
Number of subjects %
Number of subjects %
o 20 100.0 15 100.0 5 100.0 Total 20 100.0 15 100.0 5 100.0
o 12 100.0 9 100.0 3 100.0 Total 12 100.0 9 100.0 3 100.0
o 13 100.0 10 100.0 3 100.0 Total 13 100.0 10 100.0 3 100.0
es 22 84.6 17 85.0 5 83.3 No 4 15.4 3 15.0 1 16.7 Total 26 100.0 20 100.0 6 100.0
o 15 100.0 12 100.0 3 100.0 Total 15 100.0 12 100.0 3 100.0
o 28 100.0 21 100.0 7 100.0 Total 28 100.0 21 100.0 7 100.0
es 3 13.0 3 17.6 0 0.0 No 20 87.0 14 82.4 6 100.0 Total 23 100.0 17 100.0 6 100.0
o 22 100.0 16 100.0 6 100.0 Total 22 100.0 16 100.0 6 100.0
Yes 1 7.7 0 0.0 1 33.3 No 12 92.3 10 100.0 2 66.7 Total 13 100.0 10 100.0 3 100.0
28NOV13:12:49:04 LP0053 1001 t21photo.doc Continued...
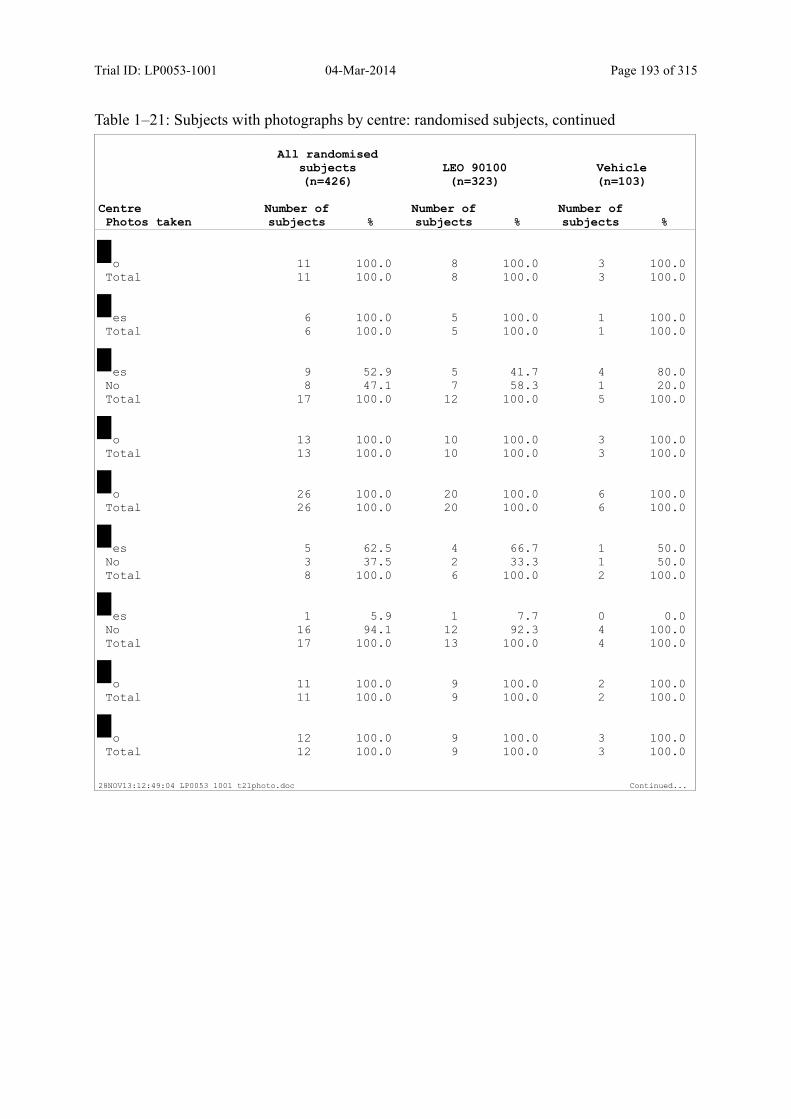
Trial ID: LP0053-1001 04-Mar-2014 Page 193 of 315
Table 1–21: Subjects with photographs by centre: randomised subjects, continued
All randomised subjects(n=426)
LEO 90100(n=323)
Vehicle(n=103)
CentrePhotos taken
Number of subjects %
Number of subjects %
Number of subjects %
o 11 100.0 8 100.0 3 100.0 Total 11 100.0 8 100.0 3 100.0
es 6 100.0 5 100.0 1 100.0 Total 6 100.0 5 100.0 1 100.0
es 9 52.9 5 41.7 4 80.0 No 8 47.1 7 58.3 1 20.0 Total 17 100.0 12 100.0 5 100.0
o 13 100.0 10 100.0 3 100.0 Total 13 100.0 10 100.0 3 100.0
o 26 100.0 20 100.0 6 100.0 Total 26 100.0 20 100.0 6 100.0
es 5 62.5 4 66.7 1 50.0 No 3 37.5 2 33.3 1 50.0 Total 8 100.0 6 100.0 2 100.0
es 1 5.9 1 7.7 0 0.0 No 16 94.1 12 92.3 4 100.0 Total 17 100.0 13 100.0 4 100.0
o 11 100.0 9 100.0 2 100.0 Total 11 100.0 9 100.0 2 100.0
o 12 100.0 9 100.0 3 100.0 Total 12 100.0 9 100.0 3 100.0
28NOV13:12:49:04 LP0053 1001 t21photo.doc Continued...
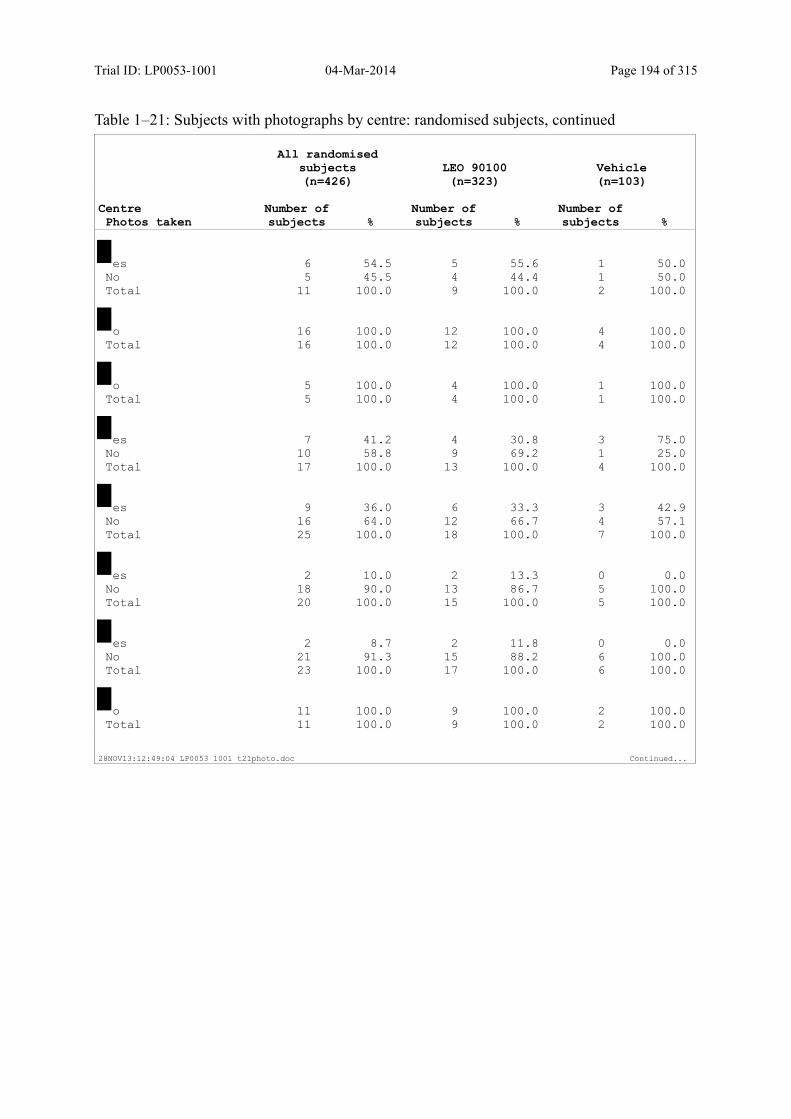
Trial ID: LP0053-1001 04-Mar-2014 Page 194 of 315
Table 1–21: Subjects with photographs by centre: randomised subjects, continued
All randomisedsubjects(n=426)
LEO 90100(n=323)
Vehicle(n=103)
CentrePhotos taken
Number of subjects %
Number of subjects %
Number of subjects %
es 6 54.5 5 55.6 1 50.0 No 5 45.5 4 44.4 1 50.0 Total 11 100.0 9 100.0 2 100.0
o 16 100.0 12 100.0 4 100.0 Total 16 100.0 12 100.0 4 100.0
o 5 100.0 4 100.0 1 100.0 Total 5 100.0 4 100.0 1 100.0
es 7 41.2 4 30.8 3 75.0 No 10 58.8 9 69.2 1 25.0 Total 17 100.0 13 100.0 4 100.0
es 9 36.0 6 33.3 3 42.9 No 16 64.0 12 66.7 4 57.1 Total 25 100.0 18 100.0 7 100.0
es 2 10.0 2 13.3 0 0.0 No 18 90.0 13 86.7 5 100.0 Total 20 100.0 15 100.0 5 100.0
es 2 8.7 2 11.8 0 0.0 No 21 91.3 15 88.2 6 100.0 Total 23 100.0 17 100.0 6 100.0
o 11 100.0 9 100.0 2 100.0 Total 11 100.0 9 100.0 2 100.0
28NOV13:12:49:04 LP0053 1001 t21photo.doc Continued...
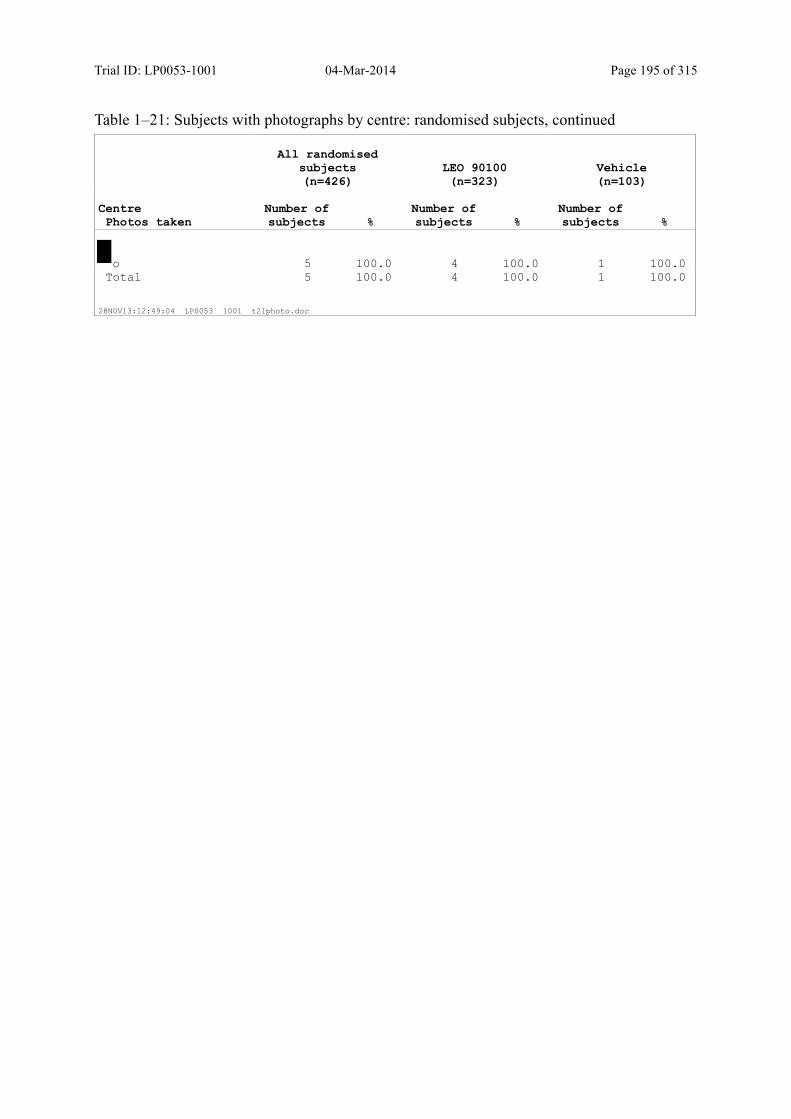
Trial ID: LP0053-1001 04-Mar-2014 Page 195 of 315
Table 1–21: Subjects with photographs by centre: randomised subjects, continued
All randomised subjects(n=426)
LEO 90100(n=323)
Vehicle(n=103)
CentrePhotos taken
Number of subjects %
Number of subjects %
Number of subjects %
o 5 100.0 4 100.0 1 100.0 Total 5 100.0 4 100.0 1 100.0
28NOV13:12:49:04 LP0053 1001 t21photo.doc
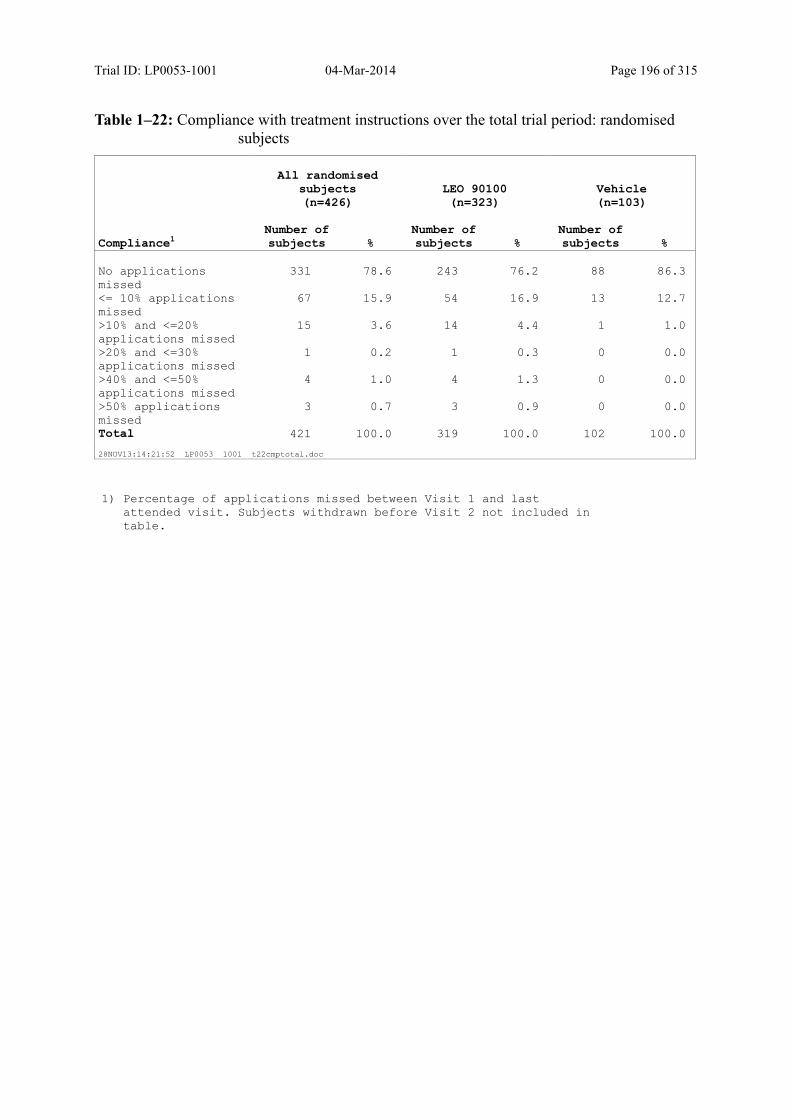
Trial ID: LP0053-1001 04-Mar-2014 Page 196 of 315
Table 1–22: Compliance with treatment instructions over the total trial period: randomised subjects
All randomised subjects(n=426)
LEO 90100(n=323)
Vehicle(n=103)
Compliance1Number of subjects %
Number of subjects %
Number of subjects %
No applications missed
331 78.6 243 76.2 88 86.3
<= 10% applications missed
67 15.9 54 16.9 13 12.7
>10% and <=20% applications missed
15 3.6 14 4.4 1 1.0
>20% and <=30% applications missed
1 0.2 1 0.3 0 0.0
>40% and <=50% applications missed
4 1.0 4 1.3 0 0.0
>50% applications missed
3 0.7 3 0.9 0 0.0
Total 421 100.0 319 100.0 102 100.0
28NOV13:14:21:52 LP0053 1001 t22cmptotal.doc
1) Percentage of applications missed between Visit 1 and last attended visit. Subjects withdrawn before Visit 2 not included in table.

Trial ID: LP0053-1001 04-Mar-2014 Page 197 of 315
Table 1–23: Compliance with treatment instructions by visit: randomised subjects
All randomised subjects(n=426)
LEO 90100(n=323)
Vehicle(n=103)
Visit intervalCompliance
Number of subjects %
Number of subjects %
Number of subjects %
Baseline to week 1No applications missed
402 96.2 305 96.5 97 95.1
<= 10% applications missed
1 0.2 1 0.3 0 0.0
>10% and <=20% applications
missed
14 3.3 9 2.8 5 4.9
>40% and <=50% applications
missed
1 0.2 1 0.3 0 0.0
Total 418 100.0 316 100.0 102 100.0
Week 1 to week 2No applications missed
387 93.5 291 93.0 96 95.0
<= 10% applications missed
1 0.2 1 0.3 0 0.0
>10% and <=20% applications
missed
24 5.8 19 6.1 5 5.0
>20% and <=30% applications
missed
1 0.2 1 0.3 0 0.0
>40% and <=50% applications
missed
1 0.2 1 0.3 0 0.0
Total 414 100.0 313 100.0 101 100.0
Week 2 to week 4No applications missed
338 82.8 248 80.0 90 91.8
<= 10% applications missed
41 10.0 36 11.6 5 5.1
>10% and <=20% applications
missed
12 2.9 10 3.2 2 2.0
28NOV13:14:24:23 LP0053 1001 t23cmpbyvisit.doc Continued...

Trial ID: LP0053-1001 04-Mar-2014 Page 198 of 315
Table 1–23: Compliance with treatment instructions by visit: randomised subjects, continued
All randomised subjects(n=426)
LEO 90100(n=323)
Vehicle(n=103)
Visit intervalCompliance
Number of subjects %
Number of subjects %
Number of subjects %
Week 2 to week 4>20% and <=30% applications
missed
8 2.0 7 2.3 1 1.0
>30% and <=40% applications
missed
1 0.2 1 0.3 0 0.0
>40% and <=50% applications
missed
1 0.2 1 0.3 0 0.0
>50% applications missed
7 1.7 7 2.3 0 0.0
Total 408 100.0 310 100.0 98 100.0
28NOV13:14:24:23 LP0053 1001 t23cmpbyvisit.doc

Trial ID: LP0053-1001 04-Mar-2014 Page 199 of 315
Table 1–24: Baseline m-PASI: randomised subjects excluding site 15
Baseline Characteristic
All randomised subjects(n=400)
LEO 90100(n=303)
Vehicle(n=97)
m-PASI Mean 6.9 6.9 6.9 SD 3.7 3.9 3.1 Median 5.9 5.8 6.0 Minimum 2 2 2 Maximum 28 28 18 Number 400 303 97
28NOV13:12:49:13 LP0053 1001 t24pasi15.doc

Trial ID: LP0053-1001 04-Mar-2014 Page 200 of 315
Figure 1–1: Visit attendance by treatment: active
316
315
313
4
1
Number of subjects
2 not attending
Primary reason for
withdrawal
Visit 1 (Randomisation)
Visit 2 (Week 1)
Visit 3 (Week 2)
Visit 4 (Week 4)
2 lost to follow-up ( )
2 voluntary ( )
323
5
1 lost to follow-up ( )
4 lost to follow-up )
1 other ( )
1 not attending
2 not attending
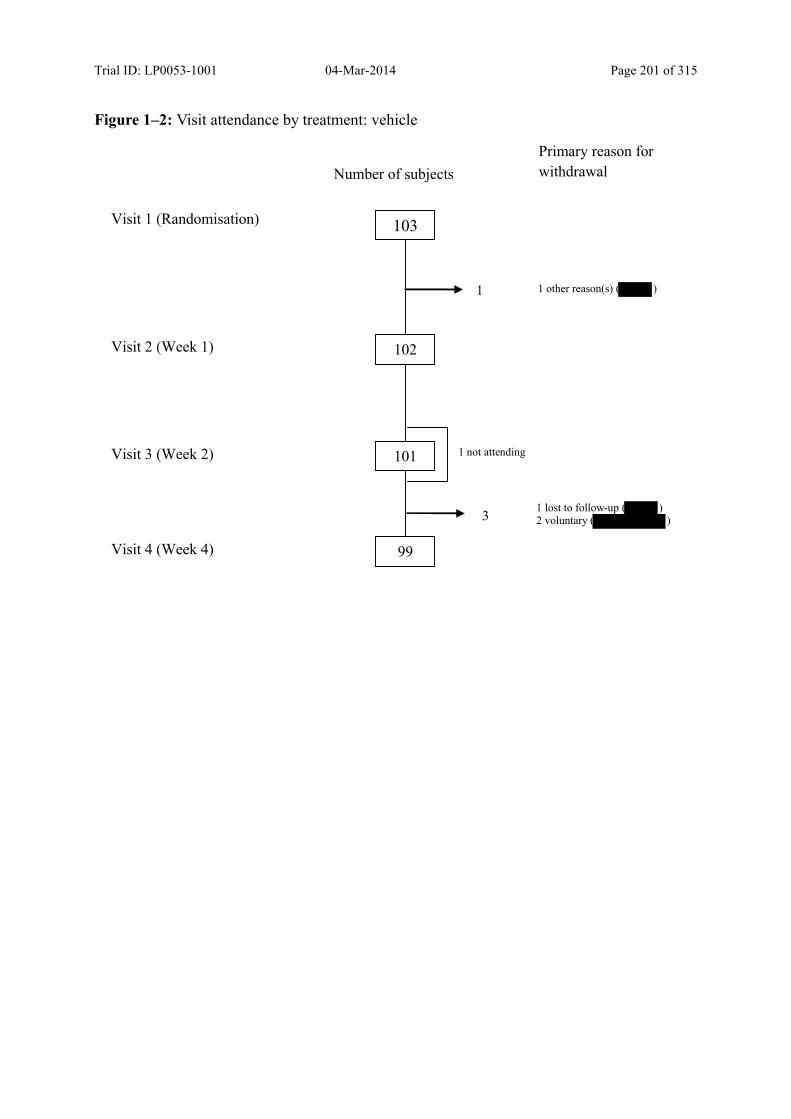
Trial ID: LP0053-1001 04-Mar-2014 Page 201 of 315
Figure 1–2: Visit attendance by treatment: vehicle
102
101
99
1
Number of subjects
1 not attending
Primary reason for
withdrawal
Visit 1 (Randomisation)
Visit 2 (Week 1)
Visit 3 (Week 2)
Visit 4 (Week 4)
1 other reason(s) ( )
103
31 lost to follow-up ( )2 voluntary ( )
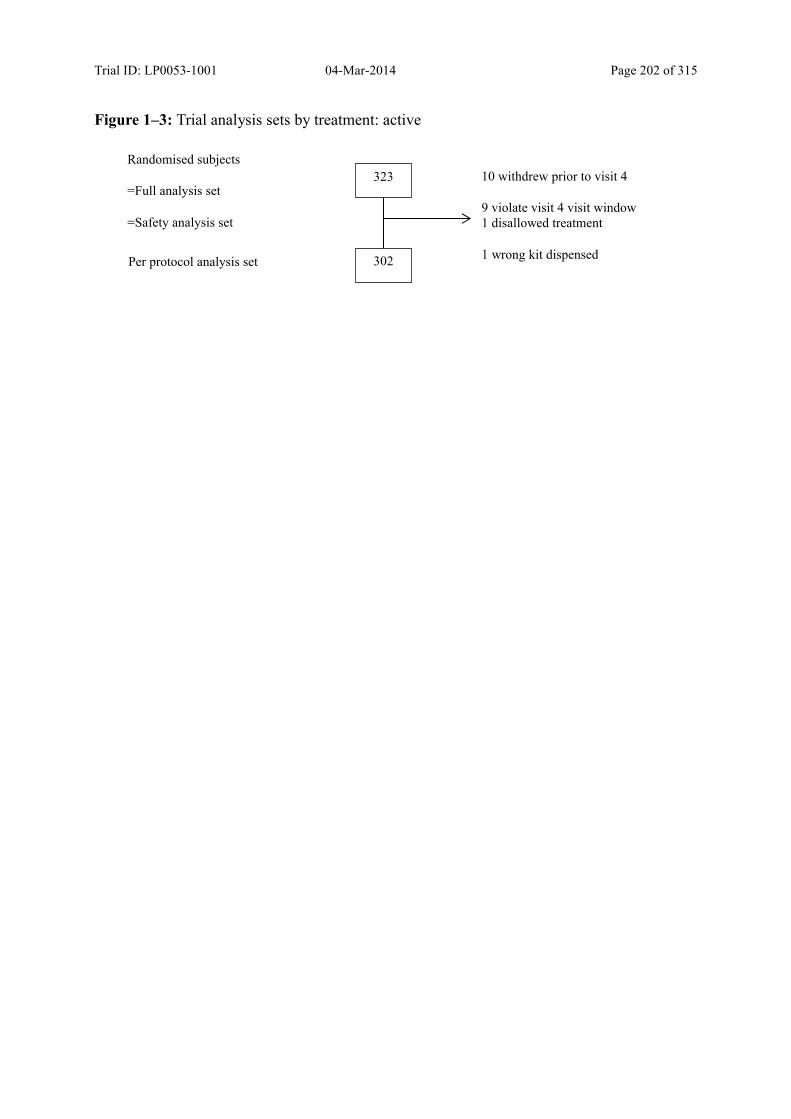
Trial ID: LP0053-1001 04-Mar-2014 Page 202 of 315
Figure 1–3: Trial analysis sets by treatment: active
Randomised subjects
=Full analysis set
=Safety analysis set
Per protocol analysis set
10 withdrew prior to visit 4
9 violate visit 4 visit window1 disallowed treatment
1 wrong kit dispensed302
323
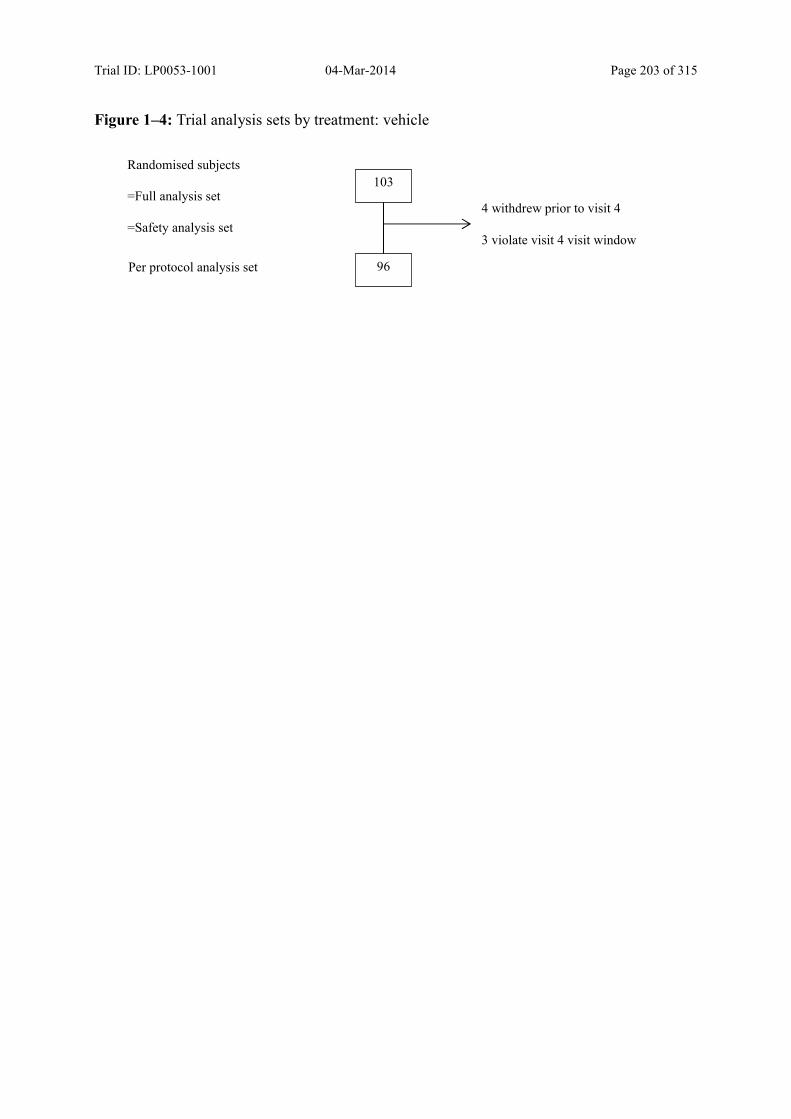
Trial ID: LP0053-1001 04-Mar-2014 Page 203 of 315
Figure 1–4: Trial analysis sets by treatment: vehicle
Randomised subjects
=Full analysis set
=Safety analysis set
Per protocol analysis set
4 withdrew prior to visit 4
3 violate visit 4 visit window
96
103

Trial ID: LP0053-1001 04-Mar-2014
Figure 1-5: Visit attendance: enrolled subjects
Nmnber of subjects
Visit 1 (Enrolled)
.. 65
Visit 1 (Randomisation)
5
Visit 2 (Week 1) 2 not attending
1 not attending 1
Visit 3 (Week 2)
1---+ .. 8
Visit 4 (Week 4)
Page 204 of 315
Primruy reason for withdrawal
6 S screen failure
1 lost to follow-up - )
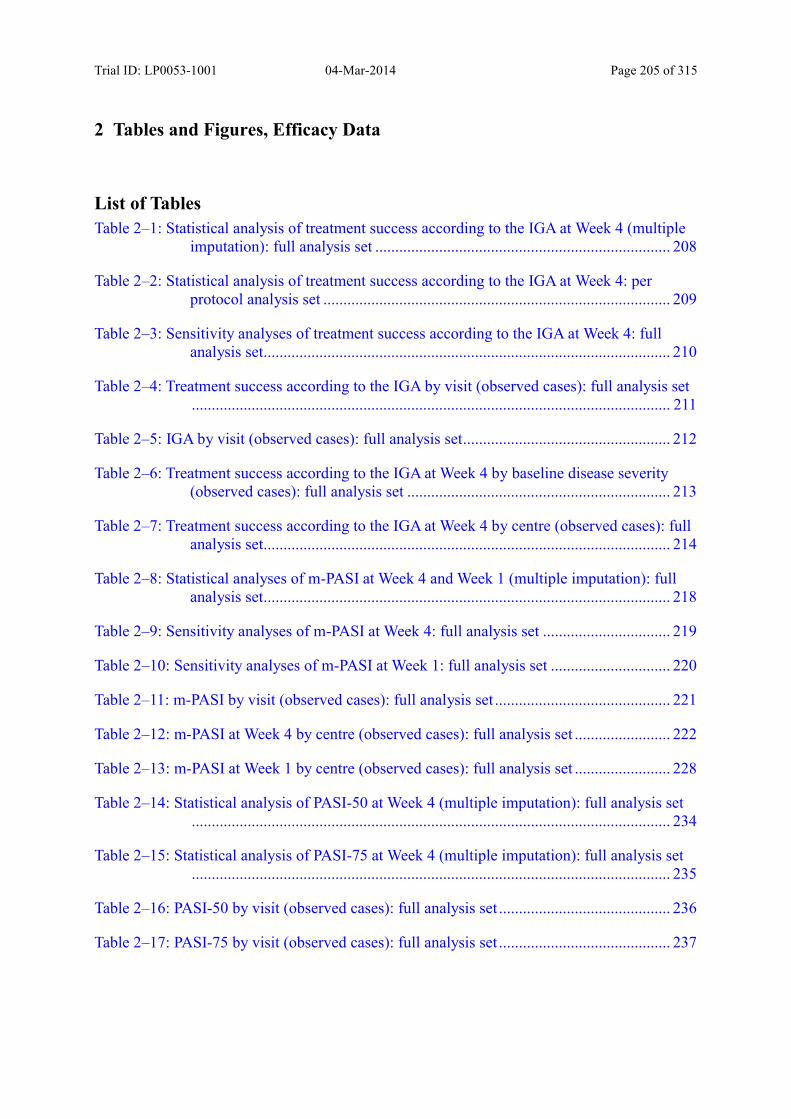
Trial ID: LP0053-1001 04-Mar-2014 Page 205 of 315
2 Tables and Figures, Efficacy Data
List of Tables
Table 2–1: Statistical analysis of treatment success according to the IGA at Week 4 (multiple imputation): full analysis set .......................................................................... 208
Table 2–2: Statistical analysis of treatment success according to the IGA at Week 4: per protocol analysis set ....................................................................................... 209
Table 2–3: Sensitivity analyses of treatment success according to the IGA at Week 4: full analysis set...................................................................................................... 210
Table 2–4: Treatment success according to the IGA by visit (observed cases): full analysis set........................................................................................................................ 211
Table 2–5: IGA by visit (observed cases): full analysis set.................................................... 212
Table 2–6: Treatment success according to the IGA at Week 4 by baseline disease severity (observed cases): full analysis set .................................................................. 213
Table 2–7: Treatment success according to the IGA at Week 4 by centre (observed cases): full analysis set...................................................................................................... 214
Table 2–8: Statistical analyses of m-PASI at Week 4 and Week 1 (multiple imputation): full analysis set...................................................................................................... 218
Table 2–9: Sensitivity analyses of m-PASI at Week 4: full analysis set ................................ 219
Table 2–10: Sensitivity analyses of m-PASI at Week 1: full analysis set .............................. 220
Table 2–11: m-PASI by visit (observed cases): full analysis set ............................................ 221
Table 2–12: m-PASI at Week 4 by centre (observed cases): full analysis set ........................ 222
Table 2–13: m-PASI at Week 1 by centre (observed cases): full analysis set ........................ 228
Table 2–14: Statistical analysis of PASI-50 at Week 4 (multiple imputation): full analysis set........................................................................................................................ 234
Table 2–15: Statistical analysis of PASI-75 at Week 4 (multiple imputation): full analysis set........................................................................................................................ 235
Table 2–16: PASI-50 by visit (observed cases): full analysis set ........................................... 236
Table 2–17: PASI-75 by visit (observed cases): full analysis set ........................................... 237

Trial ID: LP0053-1001 04-Mar-2014 Page 206 of 315
Table 2–18: Statistical analysis of treatment success according to patient's global assessment at Week 4 (observed cases): full analysis set.................................................. 238
Table 2–19: Treatment success according to patient's global assessment by visit (observed cases): full analysis set ................................................................................... 239
Table 2–20: Patient's global assessment by visit (observed cases): full analysis set ............. 240
Table 2–21: Analysis of change in Subject's assessment of itch (VAS) by time point (observed cases): full analysis set ................................................................................... 241
Table 2–22: Analysis of change in Subject's assessment of itch-related sleep loss (VAS) by time point (observed cases): full analysis set ................................................. 243
Table 2–23: Change in BSA from baseline to each visit (observed cases): full analysis set . 245
Table 2–24: Redness, thickness and scaliness of target lesion by visit: full analysis set ....... 246
Table 2–25: Analysis of change in DLQI by visit (observed cases): full analysis set ........... 249
Table 2–26: Analysis of EQ-5D-5L dimensions at baseline and Week 4 (observed cases): full analysis set...................................................................................................... 250
Table 2–27: EQ VAS score at baseline and Week 4 and analysis of change from baseline (observed cases): full analysis set .................................................................. 253
Table 2–28: EQ-5D-5L index score at baseline and Week 4 and analysis of change from baseline (observed cases): full analysis set .................................................... 254
Table 2–29: Percentage change in m-PASI by visit (observed cases): full analysis set......... 255
Table 2–30: Analysis of subjects achieving 50 percent reduction in itch by time point (observed cases): full analysis set .................................................................. 256
Table 2–31: Analysis of subjects achieving 70 percent reduction in itch by time point (observed cases): full analysis set .................................................................. 257
Table 2–32: Analysis of subjects achieving 50 percent reduction in itch-related sleep loss by time point (observed cases): full analysis set ................................................. 258
Table 2–33: Analysis of subjects achieving 70 percent reduction in itch-related sleep loss by time point (observed cases): full analysis set ................................................. 259
Table 2–34: Statistical analyses of m-PASI at Week 4 and Week 1 (multiple imputation): full analysis set excluding site ......................................................................... 260
Table 2–35: m-PASI by visit (observed cases): full analysis set excluding site ............... 261
Table 2–36: Statistical analysis of PASI-50 at Week 4 (multiple imputation): full analysis set excluding site ............................................................................................. 262
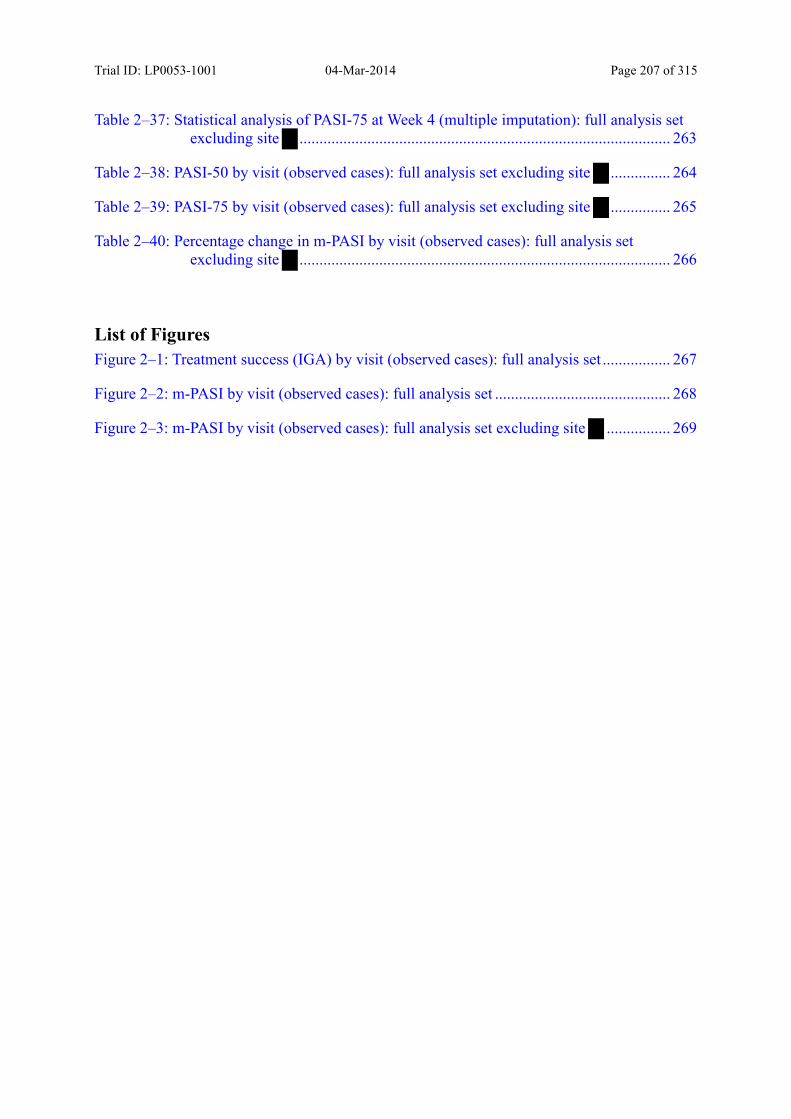
Trial ID: LP0053-1001 04-Mar-2014 Page 207 of 315
Table 2–37: Statistical analysis of PASI-75 at Week 4 (multiple imputation): full analysis set excluding site ............................................................................................. 263
Table 2–38: PASI-50 by visit (observed cases): full analysis set excluding site ............... 264
Table 2–39: PASI-75 by visit (observed cases): full analysis set excluding site ............... 265
Table 2–40: Percentage change in m-PASI by visit (observed cases): full analysis set excluding site ............................................................................................. 266
List of Figures
Figure 2–1: Treatment success (IGA) by visit (observed cases): full analysis set ................. 267
Figure 2–2: m-PASI by visit (observed cases): full analysis set ............................................ 268
Figure 2–3: m-PASI by visit (observed cases): full analysis set excluding site ................ 269
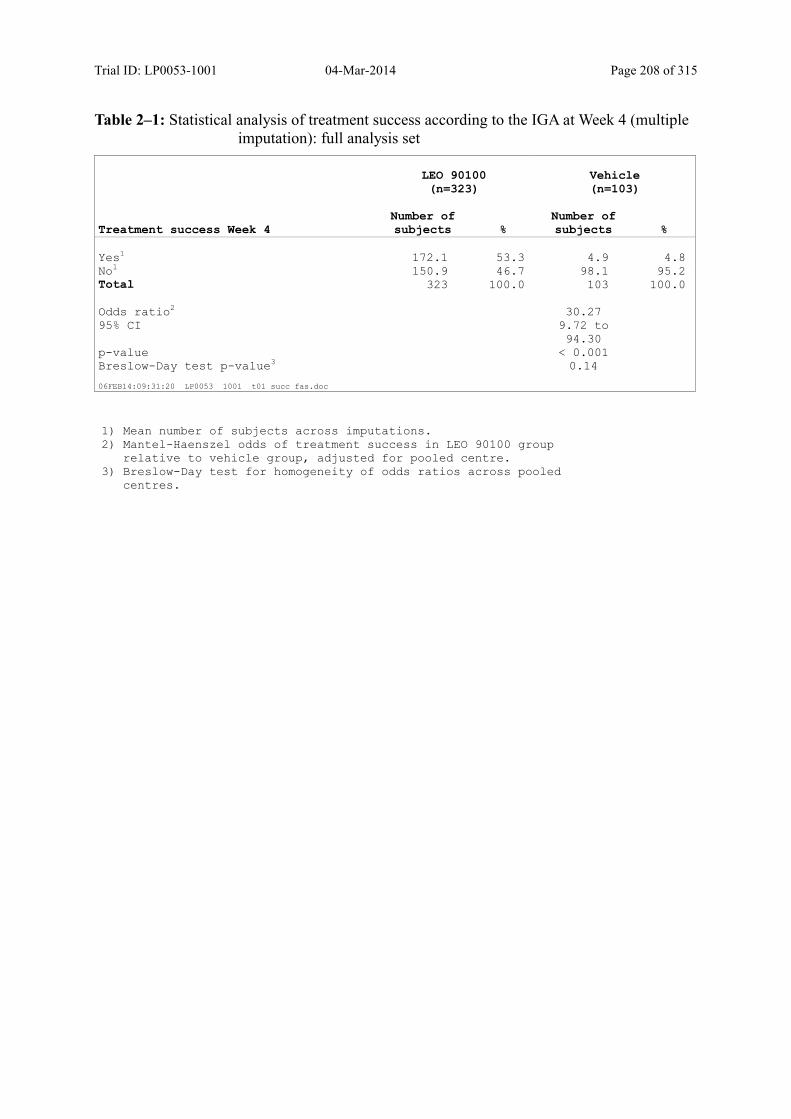
Trial ID: LP0053-1001 04-Mar-2014 Page 208 of 315
Table 2–1: Statistical analysis of treatment success according to the IGA at Week 4 (multiple imputation): full analysis set
LEO 90100(n=323)
Vehicle(n=103)
Treatment success Week 4Number of subjects %
Number of subjects %
Yes1 172.1 53.3 4.9 4.8 No1 150.9 46.7 98.1 95.2 Total 323 100.0 103 100.0 Odds ratio2 30.27 95% CI 9.72 to
94.30
p-value < 0.001 Breslow-Day test p-value3 0.14
06FEB14:09:31:20 LP0053 1001 t01 succ fas.doc
1) Mean number of subjects across imputations.2) Mantel-Haenszel odds of treatment success in LEO 90100 group
relative to vehicle group, adjusted for pooled centre.3) Breslow-Day test for homogeneity of odds ratios across pooled
centres.
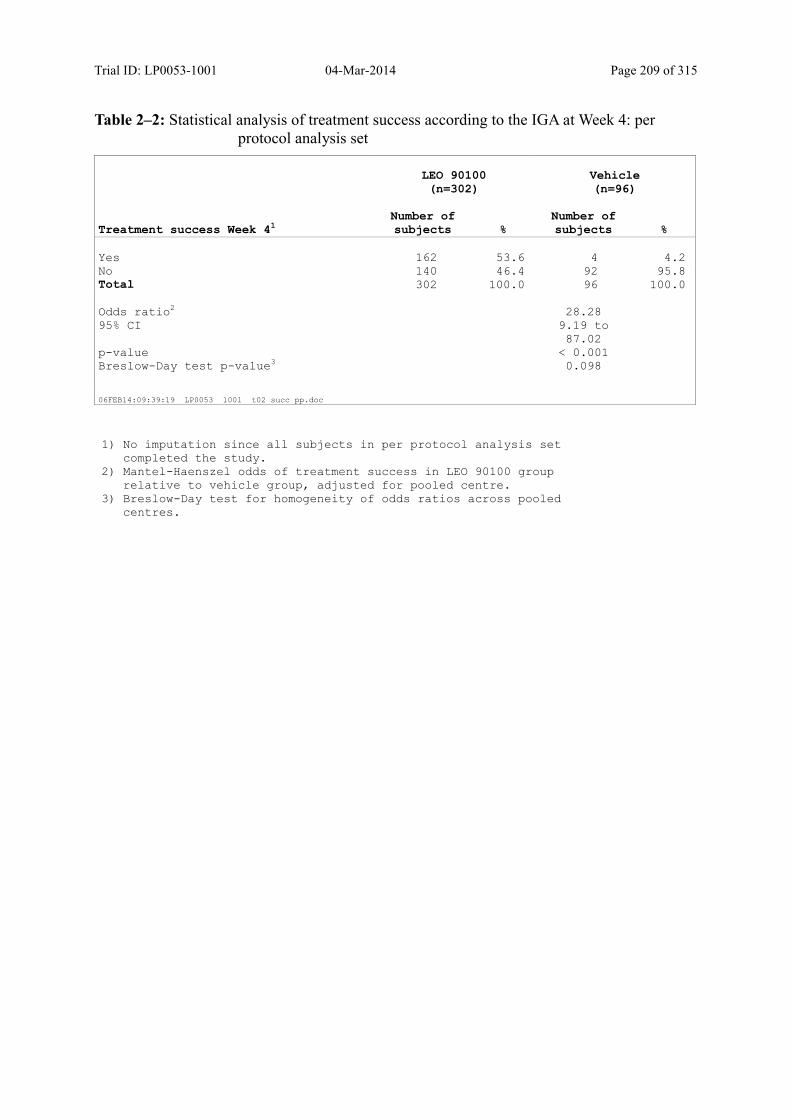
Trial ID: LP0053-1001 04-Mar-2014 Page 209 of 315
Table 2–2: Statistical analysis of treatment success according to the IGA at Week 4: per protocol analysis set
LEO 90100(n=302)
Vehicle(n=96)
Treatment success Week 41Number of subjects %
Number of subjects %
Yes 162 53.6 4 4.2 No 140 46.4 92 95.8 Total 302 100.0 96 100.0 Odds ratio2 28.28 95% CI 9.19 to
87.02
p-value < 0.001 Breslow-Day test p-value3 0.098
06FEB14:09:39:19 LP0053 1001 t02 succ pp.doc
1) No imputation since all subjects in per protocol analysis set completed the study.2) Mantel-Haenszel odds of treatment success in LEO 90100 group
relative to vehicle group, adjusted for pooled centre.3) Breslow-Day test for homogeneity of odds ratios across pooled
centres.
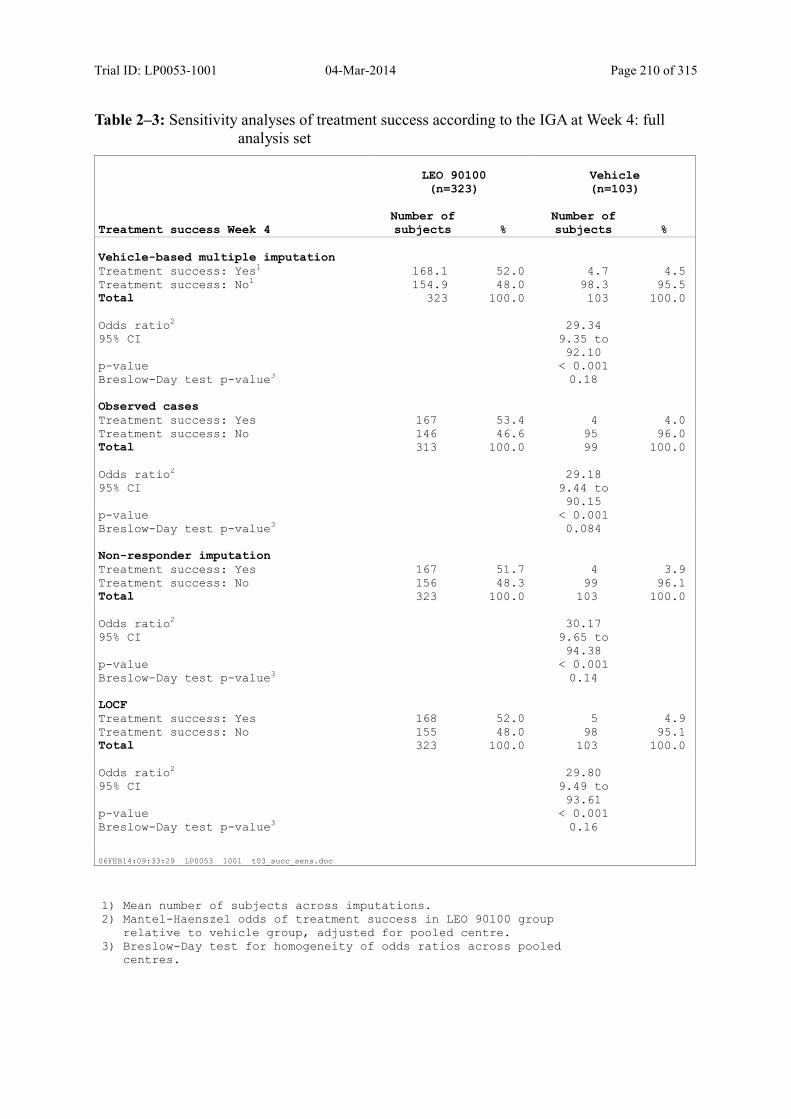
Trial ID: LP0053-1001 04-Mar-2014 Page 210 of 315
Table 2–3: Sensitivity analyses of treatment success according to the IGA at Week 4: full analysis set
LEO 90100(n=323)
Vehicle(n=103)
Treatment success Week 4Number of subjects %
Number of subjects %
Vehicle-based multiple imputation Treatment success: Yes1 168.1 52.0 4.7 4.5 Treatment success: No1 154.9 48.0 98.3 95.5 Total 323 100.0 103 100.0 Odds ratio2 29.34 95% CI 9.35 to
92.10
p-value < 0.001 Breslow-Day test p-value3 0.18 Observed cases Treatment success: Yes 167 53.4 4 4.0 Treatment success: No 146 46.6 95 96.0 Total 313 100.0 99 100.0 Odds ratio2 29.18 95% CI 9.44 to
90.15
p-value < 0.001 Breslow-Day test p-value3 0.084 Non-responder imputation Treatment success: Yes 167 51.7 4 3.9 Treatment success: No 156 48.3 99 96.1 Total 323 100.0 103 100.0 Odds ratio2 30.17 95% CI 9.65 to
94.38
p-value < 0.001 Breslow-Day test p-value3 0.14 LOCF Treatment success: Yes 168 52.0 5 4.9 Treatment success: No 155 48.0 98 95.1 Total 323 100.0 103 100.0 Odds ratio2 29.80 95% CI 9.49 to
93.61
p-value < 0.001 Breslow-Day test p-value3 0.16
06FEB14:09:33:29 LP0053 1001 t03_succ_sens.doc
1) Mean number of subjects across imputations.2) Mantel-Haenszel odds of treatment success in LEO 90100 group
relative to vehicle group, adjusted for pooled centre.3) Breslow-Day test for homogeneity of odds ratios across pooled
centres.
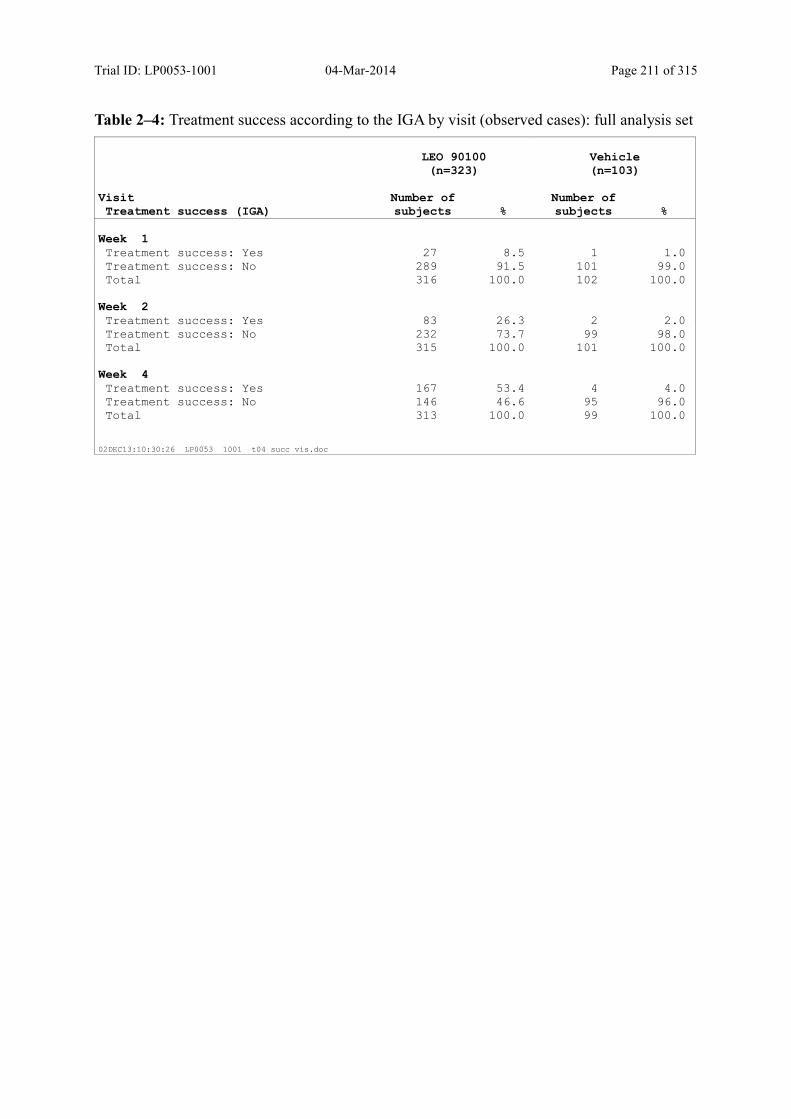
Trial ID: LP0053-1001 04-Mar-2014 Page 211 of 315
Table 2–4: Treatment success according to the IGA by visit (observed cases): full analysis set
LEO 90100(n=323)
Vehicle(n=103)
VisitTreatment success (IGA)
Number of subjects %
Number of subjects %
Week 1Treatment success: Yes 27 8.5 1 1.0 Treatment success: No 289 91.5 101 99.0 Total 316 100.0 102 100.0
Week 2Treatment success: Yes 83 26.3 2 2.0 Treatment success: No 232 73.7 99 98.0 Total 315 100.0 101 100.0
Week 4Treatment success: Yes 167 53.4 4 4.0 Treatment success: No 146 46.6 95 96.0 Total 313 100.0 99 100.0
02DEC13:10:30:26 LP0053 1001 t04 succ vis.doc
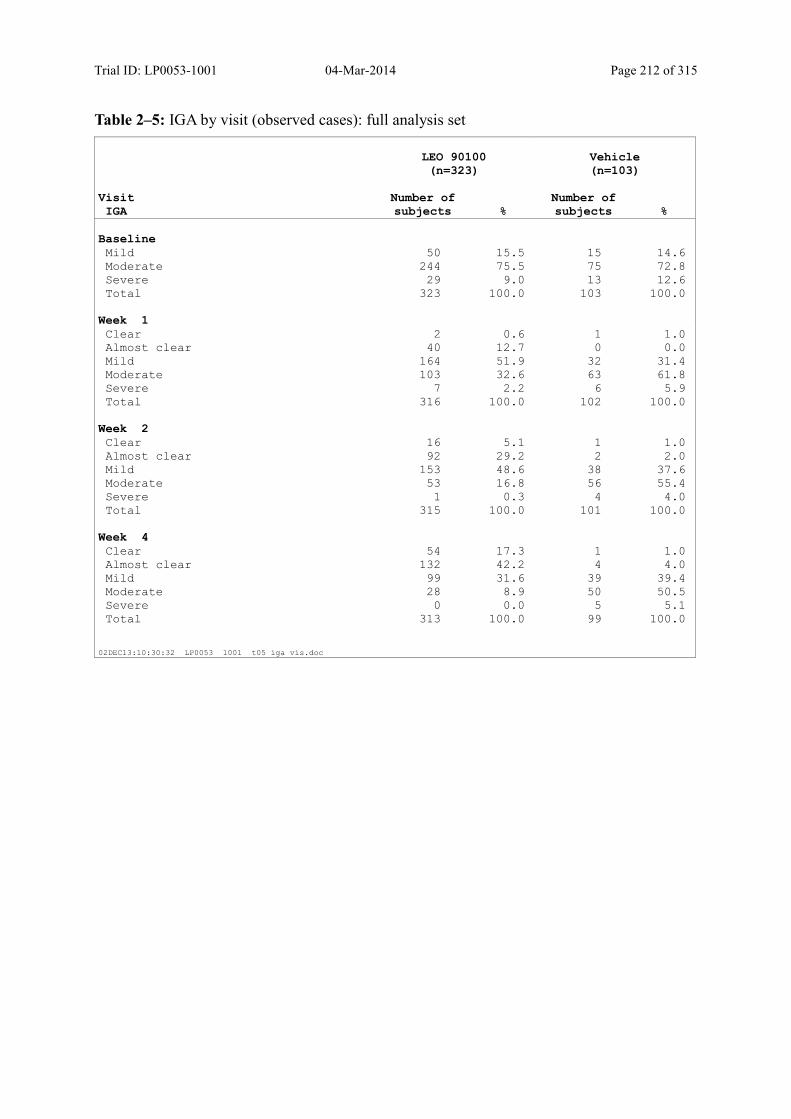
Trial ID: LP0053-1001 04-Mar-2014 Page 212 of 315
Table 2–5: IGA by visit (observed cases): full analysis set
LEO 90100(n=323)
Vehicle(n=103)
VisitIGA
Number of subjects %
Number of subjects %
BaselineMild 50 15.5 15 14.6 Moderate 244 75.5 75 72.8 Severe 29 9.0 13 12.6 Total 323 100.0 103 100.0
Week 1Clear 2 0.6 1 1.0 Almost clear 40 12.7 0 0.0 Mild 164 51.9 32 31.4 Moderate 103 32.6 63 61.8 Severe 7 2.2 6 5.9 Total 316 100.0 102 100.0
Week 2Clear 16 5.1 1 1.0 Almost clear 92 29.2 2 2.0 Mild 153 48.6 38 37.6 Moderate 53 16.8 56 55.4 Severe 1 0.3 4 4.0 Total 315 100.0 101 100.0
Week 4Clear 54 17.3 1 1.0 Almost clear 132 42.2 4 4.0 Mild 99 31.6 39 39.4 Moderate 28 8.9 50 50.5 Severe 0 0.0 5 5.1 Total 313 100.0 99 100.0
02DEC13:10:30:32 LP0053 1001 t05 iga vis.doc
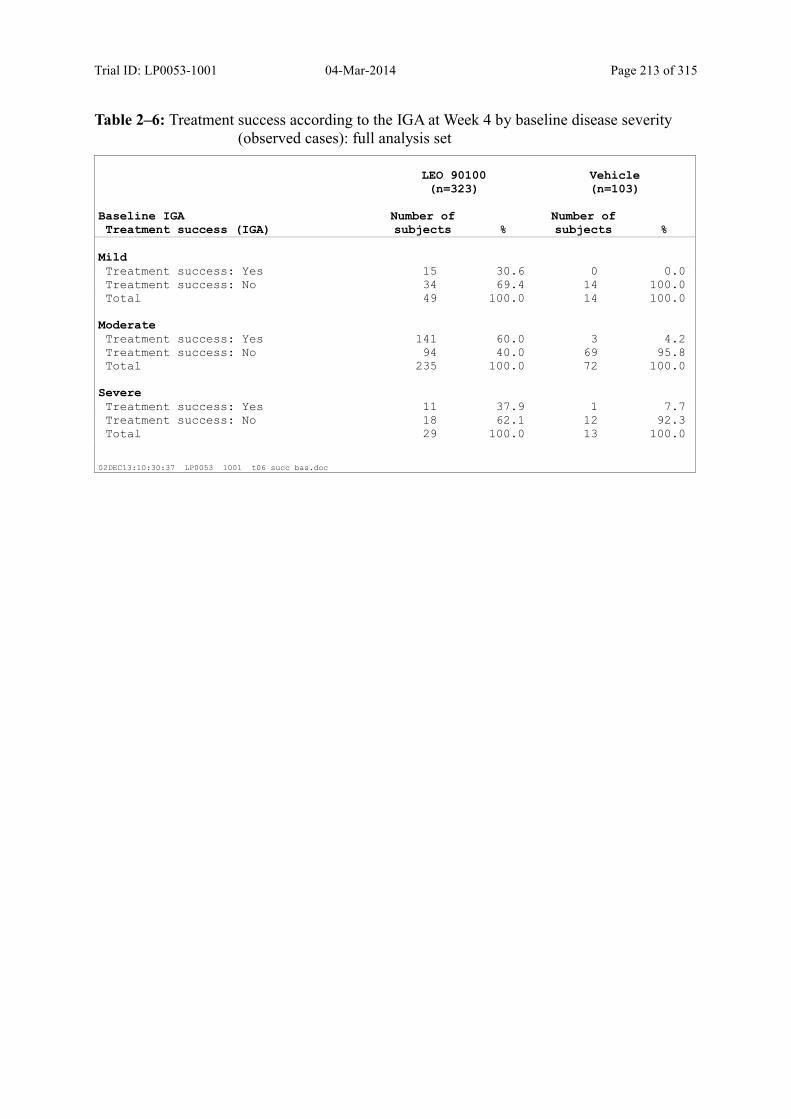
Trial ID: LP0053-1001 04-Mar-2014 Page 213 of 315
Table 2–6: Treatment success according to the IGA at Week 4 by baseline disease severity (observed cases): full analysis set
LEO 90100(n=323)
Vehicle(n=103)
Baseline IGATreatment success (IGA)
Number of subjects %
Number of subjects %
MildTreatment success: Yes 15 30.6 0 0.0 Treatment success: No 34 69.4 14 100.0 Total 49 100.0 14 100.0
ModerateTreatment success: Yes 141 60.0 3 4.2 Treatment success: No 94 40.0 69 95.8 Total 235 100.0 72 100.0
SevereTreatment success: Yes 11 37.9 1 7.7 Treatment success: No 18 62.1 12 92.3 Total 29 100.0 13 100.0
02DEC13:10:30:37 LP0053 1001 t06 succ bas.doc
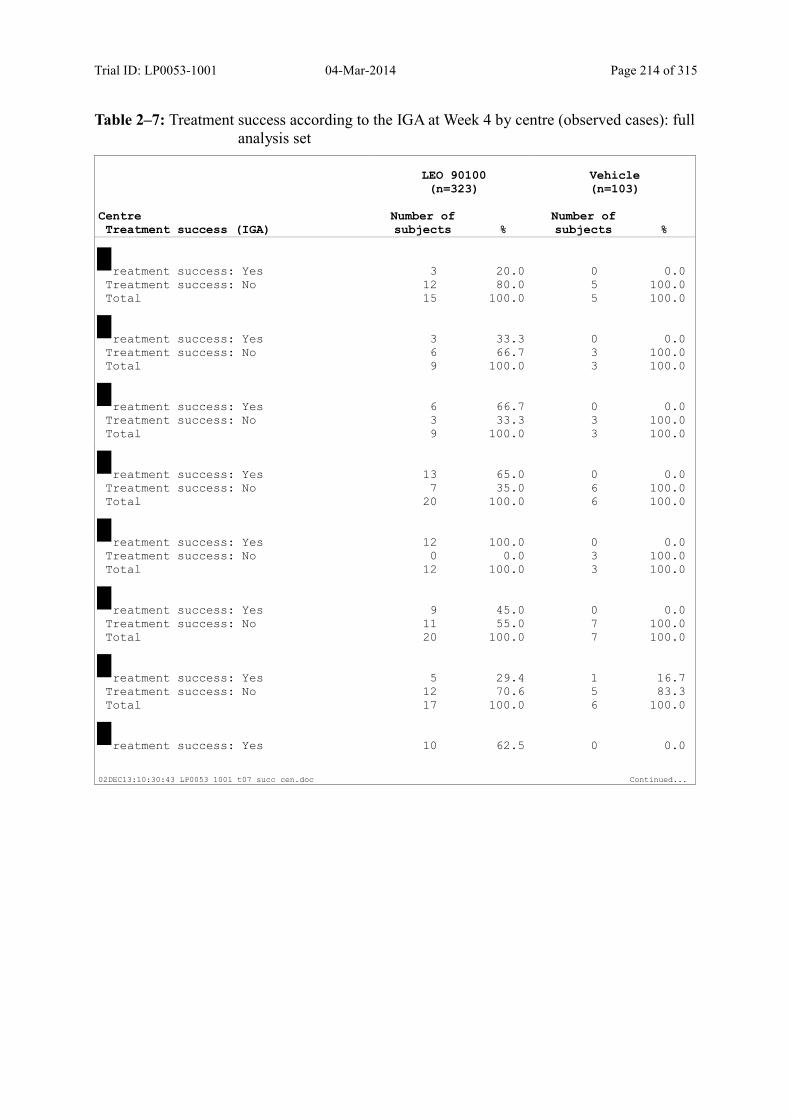
Trial ID: LP0053-1001 04-Mar-2014 Page 214 of 315
Table 2–7: Treatment success according to the IGA at Week 4 by centre (observed cases): full analysis set
LEO 90100(n=323)
Vehicle(n=103)
CentreTreatment success (IGA)
Number of subjects %
Number of subjects %
reatment success: Yes 3 20.0 0 0.0 Treatment success: No 12 80.0 5 100.0 Total 15 100.0 5 100.0
reatment success: Yes 3 33.3 0 0.0 Treatment success: No 6 66.7 3 100.0 Total 9 100.0 3 100.0
reatment success: Yes 6 66.7 0 0.0 Treatment success: No 3 33.3 3 100.0 Total 9 100.0 3 100.0
reatment success: Yes 13 65.0 0 0.0 Treatment success: No 7 35.0 6 100.0 Total 20 100.0 6 100.0
reatment success: Yes 12 100.0 0 0.0 Treatment success: No 0 0.0 3 100.0 Total 12 100.0 3 100.0
reatment success: Yes 9 45.0 0 0.0 Treatment success: No 11 55.0 7 100.0 Total 20 100.0 7 100.0
reatment success: Yes 5 29.4 1 16.7 Treatment success: No 12 70.6 5 83.3 Total 17 100.0 6 100.0
reatment success: Yes 10 62.5 0 0.0
02DEC13:10:30:43 LP0053 1001 t07 succ cen.doc Continued...

Trial ID: LP0053-1001 04-Mar-2014 Page 215 of 315
Table 2–7: Treatment success according to the IGA at Week 4 by centre (observed cases): full
analysis set, continued
LEO 90100(n=323)
Vehicle(n=103)
CentreTreatment success (IGA)
Number of subjects %
Number of subjects %
reatment success: No 6 37.5 6 100.0 Total 16 100.0 6 100.0
reatment success: Yes 5 55.6 0 0.0 Treatment success: No 4 44.4 3 100.0 Total 9 100.0 3 100.0
reatment success: Yes 3 37.5 0 0.0 Treatment success: No 5 62.5 2 100.0 Total 8 100.0 2 100.0
reatment success: Yes 2 40.0 0 0.0 Treatment success: No 3 60.0 1 100.0 Total 5 100.0 1 100.0
reatment success: Yes 5 41.7 0 0.0 Treatment success: No 7 58.3 5 100.0 Total 12 100.0 5 100.0
reatment success: Yes 7 77.8 0 0.0 Treatment success: No 2 22.2 3 100.0 Total 9 100.0 3 100.0
reatment success: Yes 11 57.9 0 0.0 Treatment success: No 8 42.1 6 100.0 Total 19 100.0 6 100.0
reatment success: Yes 4 66.7 1 100.0 Treatment success: No 2 33.3 0 0.0 Total 6 100.0 1 100.0
02DEC13:10:30:43 LP0053 1001 t07 succ cen.doc Continued...
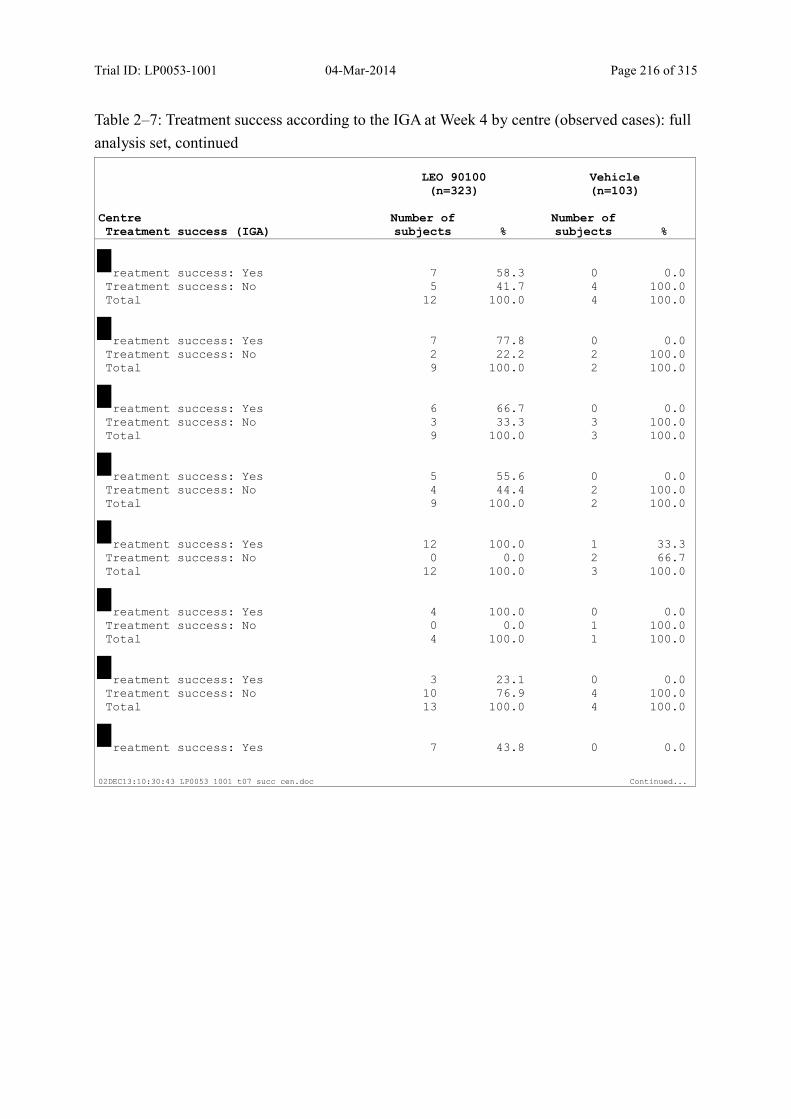
Trial ID: LP0053-1001 04-Mar-2014 Page 216 of 315
Table 2–7: Treatment success according to the IGA at Week 4 by centre (observed cases): full
analysis set, continued
LEO 90100(n=323)
Vehicle(n=103)
CentreTreatment success (IGA)
Number of subjects %
Number of subjects %
reatment success: Yes 7 58.3 0 0.0 Treatment success: No 5 41.7 4 100.0 Total 12 100.0 4 100.0
reatment success: Yes 7 77.8 0 0.0 Treatment success: No 2 22.2 2 100.0 Total 9 100.0 2 100.0
reatment success: Yes 6 66.7 0 0.0 Treatment success: No 3 33.3 3 100.0 Total 9 100.0 3 100.0
reatment success: Yes 5 55.6 0 0.0 Treatment success: No 4 44.4 2 100.0 Total 9 100.0 2 100.0
reatment success: Yes 12 100.0 1 33.3 Treatment success: No 0 0.0 2 66.7 Total 12 100.0 3 100.0
reatment success: Yes 4 100.0 0 0.0 Treatment success: No 0 0.0 1 100.0 Total 4 100.0 1 100.0
reatment success: Yes 3 23.1 0 0.0 Treatment success: No 10 76.9 4 100.0 Total 13 100.0 4 100.0
reatment success: Yes 7 43.8 0 0.0
02DEC13:10:30:43 LP0053 1001 t07 succ cen.doc Continued...
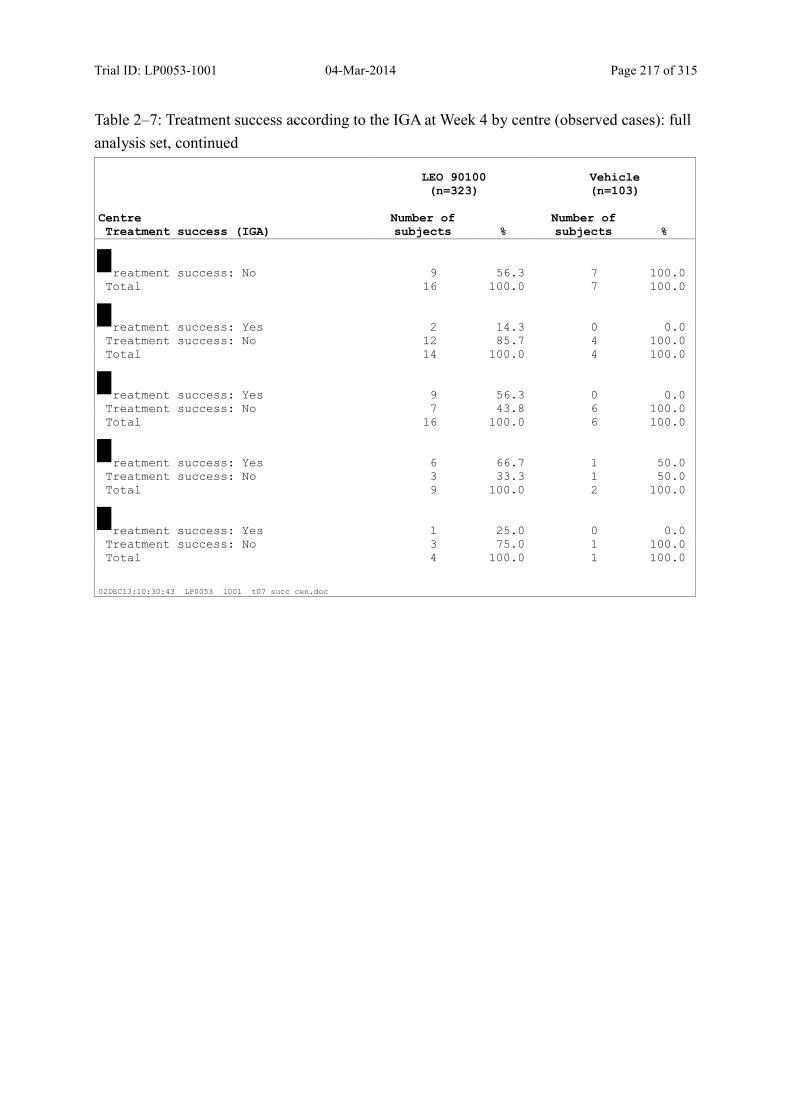
Trial ID: LP0053-1001 04-Mar-2014 Page 217 of 315
Table 2–7: Treatment success according to the IGA at Week 4 by centre (observed cases): full
analysis set, continued
LEO 90100(n=323)
Vehicle(n=103)
CentreTreatment success (IGA)
Number of subjects %
Number of subjects %
reatment success: No 9 56.3 7 100.0 Total 16 100.0 7 100.0
reatment success: Yes 2 14.3 0 0.0 Treatment success: No 12 85.7 4 100.0 Total 14 100.0 4 100.0
reatment success: Yes 9 56.3 0 0.0 Treatment success: No 7 43.8 6 100.0 Total 16 100.0 6 100.0
reatment success: Yes 6 66.7 1 50.0 Treatment success: No 3 33.3 1 50.0 Total 9 100.0 2 100.0
reatment success: Yes 1 25.0 0 0.0 Treatment success: No 3 75.0 1 100.0 Total 4 100.0 1 100.0
02DEC13:10:30:43 LP0053 1001 t07 succ cen.doc

Trial ID: LP0053-1001 04-Mar-2014 Page 218 of 315
Table 2–8: Statistical analyses of m-PASI at Week 4 and Week 1 (multiple imputation): full analysis set
Mean m-PASI score1LEO 90100(n=323)
Vehicle(n=103)
Week 4 1.99 5.50 Week 4 adjusted2 2.04 5.33 Difference2 -3.28 95% CI -3.90 to -2.67 p-value2 < 0.001 Week 1 4.53 6.21 Week 1 adjusted2 4.66 5.93 Difference2 -1.27 95% CI -1.76 to -0.78 p-value2 < 0.001
02DEC13:13:21:17 LP0053 1001 t08 PASI mi.doc
1) Averaged across imputations.2) Adjusted for the effect of pooled centre and baseline m-PASI by
analysis of covariance.
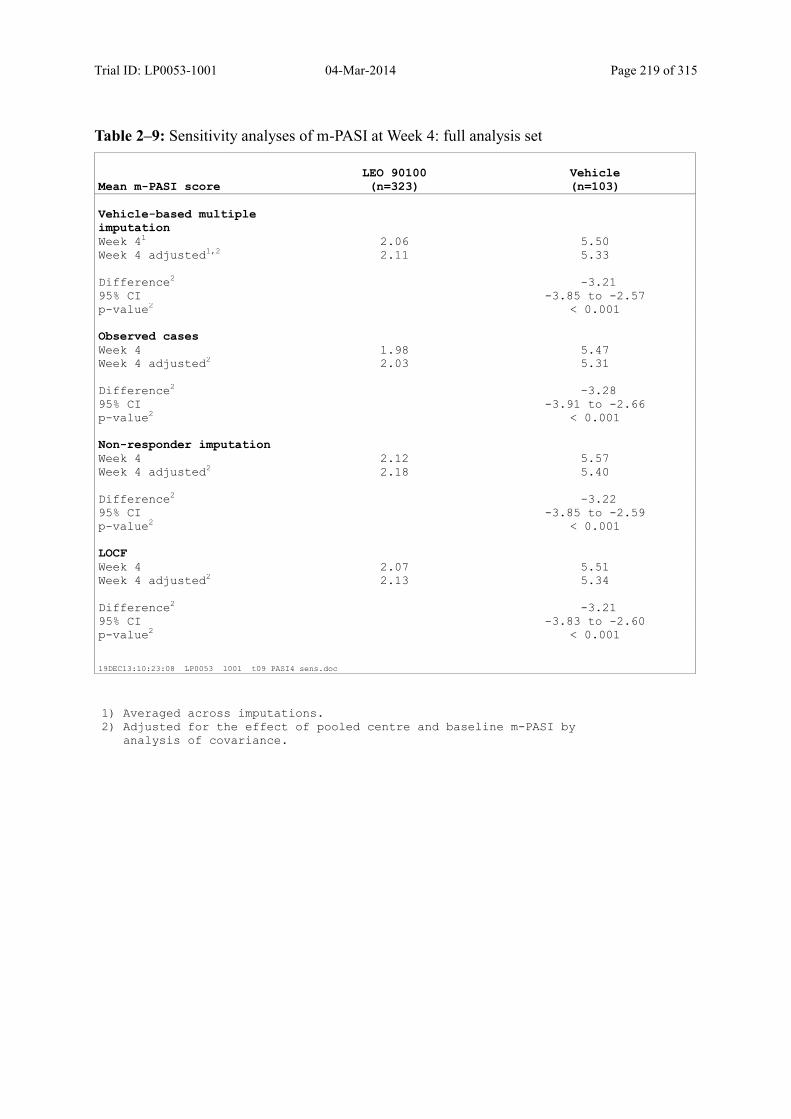
Trial ID: LP0053-1001 04-Mar-2014 Page 219 of 315
Table 2–9: Sensitivity analyses of m-PASI at Week 4: full analysis set
Mean m-PASI scoreLEO 90100(n=323)
Vehicle(n=103)
Vehicle-based multiple imputation
Week 41 2.06 5.50 Week 4 adjusted1,2 2.11 5.33 Difference2 -3.21 95% CI -3.85 to -2.57 p-value2 < 0.001 Observed cases Week 4 1.98 5.47 Week 4 adjusted2 2.03 5.31 Difference2 -3.28 95% CI -3.91 to -2.66 p-value2 < 0.001 Non-responder imputation Week 4 2.12 5.57 Week 4 adjusted2 2.18 5.40 Difference2 -3.22 95% CI -3.85 to -2.59 p-value2 < 0.001 LOCF Week 4 2.07 5.51 Week 4 adjusted2 2.13 5.34 Difference2 -3.21 95% CI -3.83 to -2.60 p-value2 < 0.001
19DEC13:10:23:08 LP0053 1001 t09 PASI4 sens.doc
1) Averaged across imputations.2) Adjusted for the effect of pooled centre and baseline m-PASI by
analysis of covariance.

Trial ID: LP0053-1001 04-Mar-2014 Page 220 of 315
Table 2–10: Sensitivity analyses of m-PASI at Week 1: full analysis set
Mean m-PASI scoreLEO 90100(n=323)
Vehicle(n=103)
Vehicle-based multiple imputation
Week 11 4.55 6.20 Week 1 adjusted1,2 4.68 5.92 Difference2 -1.24 95% CI -1.74 to -0.75 p-value2 < 0.001 Observed cases Week 1 4.54 6.23 Week 1 adjusted2 4.67 5.95 Difference2 -1.28 95% CI -1.77 to -0.78 p-value2 < 0.001 Non-responder imputation Week 1 4.57 6.20 Week 1 adjusted2 4.70 5.92 Difference2 -1.22 95% CI -1.71 to -0.73 p-value2 < 0.001 LOCF Week 1 4.57 6.20 Week 1 adjusted2 4.70 5.92 Difference2 -1.22 95% CI -1.71 to -0.73 p-value2 < 0.001
19DEC13:10:23:22 LP0053 1001 t10 PASI1 sens.doc
1) Averaged across imputations.2) Adjusted for the effect of pooled centre and baseline m-PASI by
analysis of covariance.
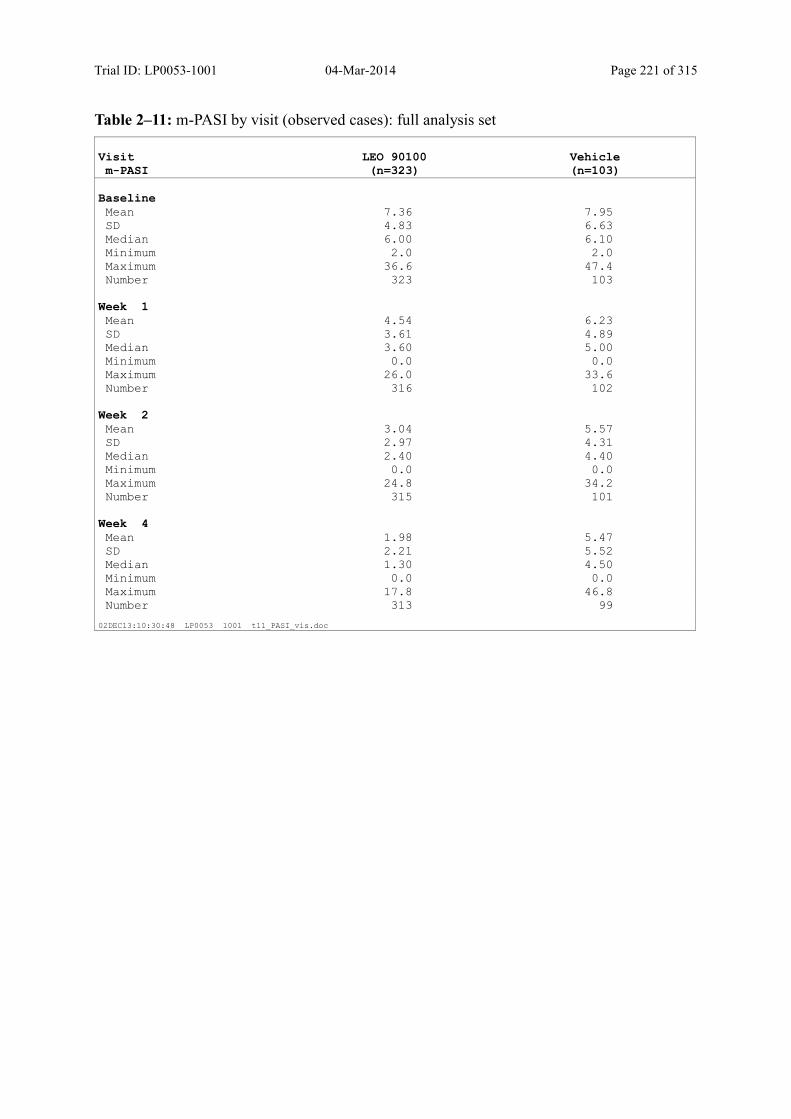
Trial ID: LP0053-1001 04-Mar-2014 Page 221 of 315
Table 2–11: m-PASI by visit (observed cases): full analysis set
Visitm-PASI
LEO 90100(n=323)
Vehicle(n=103)
BaselineMean 7.36 7.95 SD 4.83 6.63 Median 6.00 6.10 Minimum 2.0 2.0 Maximum 36.6 47.4 Number 323 103
Week 1Mean 4.54 6.23 SD 3.61 4.89 Median 3.60 5.00 Minimum 0.0 0.0 Maximum 26.0 33.6 Number 316 102
Week 2Mean 3.04 5.57 SD 2.97 4.31 Median 2.40 4.40 Minimum 0.0 0.0 Maximum 24.8 34.2 Number 315 101
Week 4Mean 1.98 5.47 SD 2.21 5.52 Median 1.30 4.50 Minimum 0.0 0.0 Maximum 17.8 46.8 Number 313 99
02DEC13:10:30:48 LP0053 1001 t11_PASI_vis.doc

Trial ID: LP0053-1001 04-Mar-2014 Page 222 of 315
Table 2–12: m-PASI at Week 4 by centre (observed cases): full analysis set
Centrem-PASI Week 4
LEO 90100(n=323)
Vehicle(n=103)
ean 2.39 5.06 SD 2.04 2.80 Median 3.00 3.80 Minimum 0.0 2.4 Maximum 5.6 9.5 Number 15 5
ean 1.86 4.20 SD 1.65 1.31 Median 1.40 4.00 Minimum 0.0 3.0 Maximum 4.5 5.6 Number 9 3
ean 1.86 3.43 SD 1.22 2.48 Median 1.40 4.50 Minimum 0.5 0.6 Maximum 3.6 5.2 Number 9 3
ean 1.58 4.70 SD 1.32 3.32 Median 1.15 4.20 Minimum 0.0 1.2 Maximum 5.1 10.2 Number 20 6
ean 0.13 4.50 SD 0.26 1.65 Median 0.00 3.60 Minimum 0.0 3.5 Maximum 0.8 6.4
02DEC13:10:30:56 LP0053 1001 t12 PASI4 cen.doc Continued...

Trial ID: LP0053-1001 04-Mar-2014 Page 223 of 315
Table 2–12: m-PASI at Week 4 by centre (observed cases): full analysis set, continued
Centrem-PASI Week 4
LEO 90100(n=323)
Vehicle(n=103)
umber 12 3
ean 1.79 5.77 SD 2.17 3.37 Median 1.30 4.80 Minimum 0.0 2.2 Maximum 8.7 11.1 Number 20 7
ean 3.88 5.02 SD 2.60 2.21 Median 3.60 5.05 Minimum 0.4 1.6 Maximum 7.8 8.4 Number 17 6
ean 1.65 4.73 SD 1.90 3.30 Median 1.20 3.50 Minimum 0.0 1.6 Maximum 7.4 9.6 Number 16 6
ean 1.66 9.00 SD 1.63 6.10 Median 1.60 6.20 Minimum 0.0 4.8 Maximum 4.7 16.0 Number 9 3
ean 4.84 7.25 SD 5.64 0.64 Median 2.90 7.25 Minimum 0.0 6.8
02DEC13:10:30:56 LP0053 1001 t12 PASI4 cen.doc Continued...

Trial ID: LP0053-1001 04-Mar-2014 Page 224 of 315
Table 2–12: m-PASI at Week 4 by centre (observed cases): full analysis set, continued
Centrem-PASI Week 4
LEO 90100(n=323)
Vehicle(n=103)
aximum 17.8 7.7 Number 8 2
ean 2.92 3.30 SD 2.41 Median 2.80 3.30 Minimum 0.4 3.3 Maximum 6.0 3.3 Number 5 1
ean 2.16 3.76 SD 1.50 1.46 Median 1.90 3.60 Minimum 0.0 1.8 Maximum 5.3 5.7 Number 12 5
ean 0.90 3.70 SD 0.74 2.43 Median 0.80 2.50 Minimum 0.0 2.1 Maximum 2.2 6.5 Number 9 3
ean 1.88 17.80 SD 2.14 16.39 Median 1.20 12.55 Minimum 0.0 3.6 Maximum 7.4 46.8 Number 19 6
ean 0.93 0.00 SD 0.98 Median 0.70 0.00
02DEC13:10:30:56 LP0053 1001 t12 PASI4 cen.doc Continued...

Trial ID: LP0053-1001 04-Mar-2014 Page 225 of 315
Table 2–12: m-PASI at Week 4 by centre (observed cases): full analysis set, continued
Centrem-PASI Week 4
LEO 90100(n=323)
Vehicle(n=103)
inimum 0.0 0.0 Maximum 2.4 0.0 Number 6 1
ean 1.60 4.10 SD 1.61 1.41 Median 1.00 4.45 Minimum 0.0 2.1 Maximum 4.8 5.4 Number 12 4
ean 0.86 6.00 SD 0.53 0.00 Median 0.80 6.00 Minimum 0.2 6.0 Maximum 2.1 6.0 Number 9 2
ean 1.10 3.73 SD 1.22 3.11 Median 0.80 2.80 Minimum 0.0 1.2 Maximum 3.0 7.2 Number 9 3
ean 2.20 3.90 SD 0.89 1.27 Median 2.00 3.90 Minimum 0.8 3.0 Maximum 3.6 4.8 Number 9 2
ean 0.36 1.93 SD 0.44 1.37
02DEC13:10:30:56 LP0053 1001 t12 PASI4 cen.doc Continued...
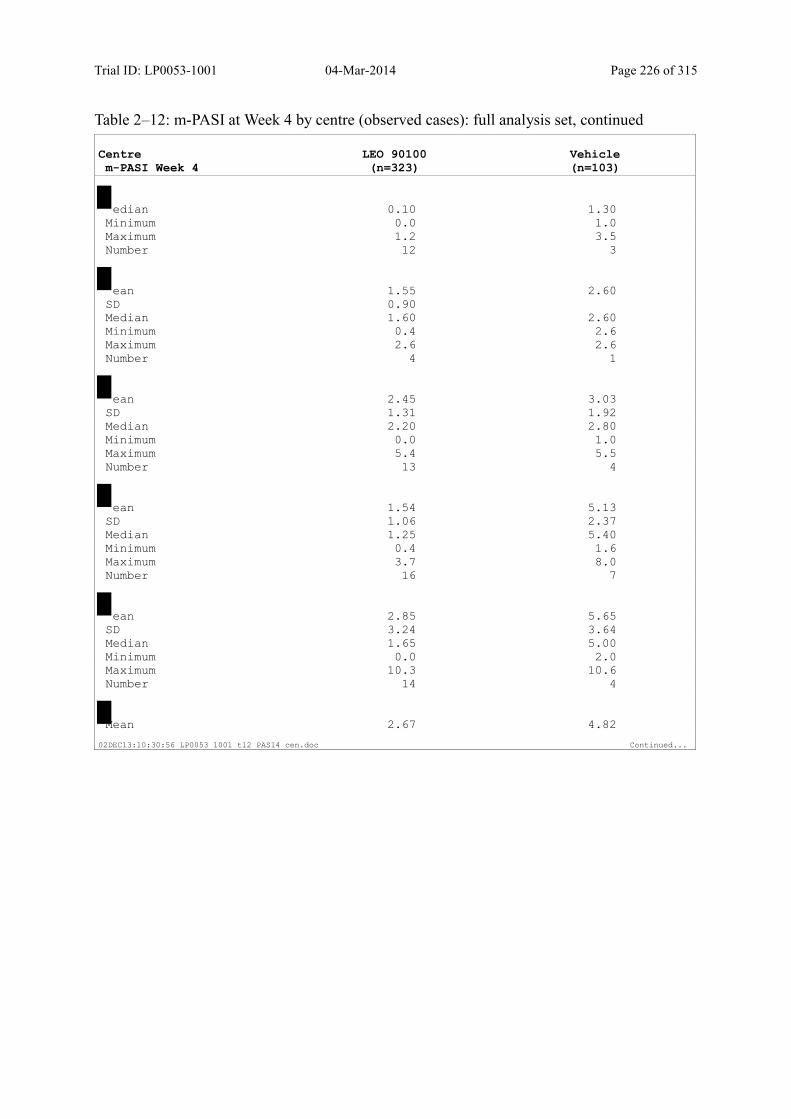
Trial ID: LP0053-1001 04-Mar-2014 Page 226 of 315
Table 2–12: m-PASI at Week 4 by centre (observed cases): full analysis set, continued
Centrem-PASI Week 4
LEO 90100(n=323)
Vehicle(n=103)
edian 0.10 1.30 Minimum 0.0 1.0 Maximum 1.2 3.5 Number 12 3
ean 1.55 2.60 SD 0.90 Median 1.60 2.60 Minimum 0.4 2.6 Maximum 2.6 2.6 Number 4 1
ean 2.45 3.03 SD 1.31 1.92 Median 2.20 2.80 Minimum 0.0 1.0 Maximum 5.4 5.5 Number 13 4
ean 1.54 5.13 SD 1.06 2.37 Median 1.25 5.40 Minimum 0.4 1.6 Maximum 3.7 8.0 Number 16 7
ean 2.85 5.65 SD 3.24 3.64 Median 1.65 5.00 Minimum 0.0 2.0 Maximum 10.3 10.6 Number 14 4
Mean 2.67 4.82
02DEC13:10:30:56 LP0053 1001 t12 PASI4 cen.doc Continued...
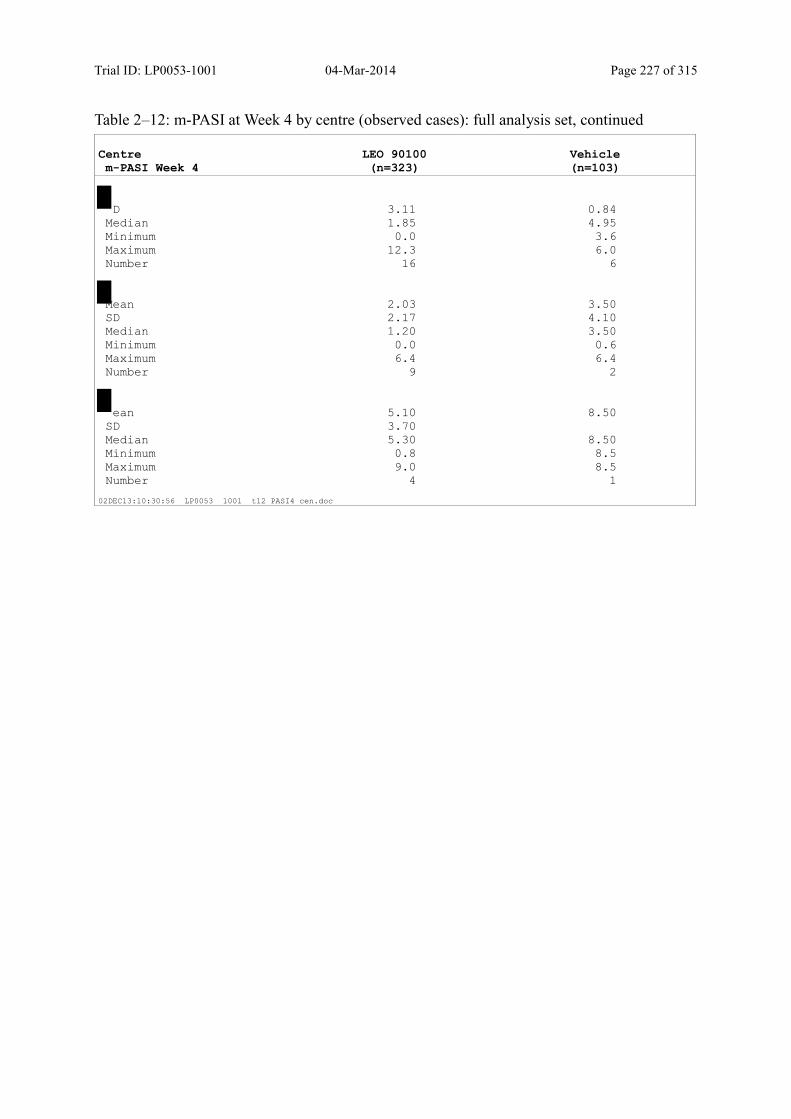
Trial ID: LP0053-1001 04-Mar-2014 Page 227 of 315
Table 2–12: m-PASI at Week 4 by centre (observed cases): full analysis set, continued
Centrem-PASI Week 4
LEO 90100(n=323)
Vehicle(n=103)
D 3.11 0.84 Median 1.85 4.95 Minimum 0.0 3.6 Maximum 12.3 6.0 Number 16 6
Mean 2.03 3.50 SD 2.17 4.10 Median 1.20 3.50 Minimum 0.0 0.6 Maximum 6.4 6.4 Number 9 2
ean 5.10 8.50 SD 3.70 Median 5.30 8.50 Minimum 0.8 8.5 Maximum 9.0 8.5 Number 4 1
02DEC13:10:30:56 LP0053 1001 t12 PASI4 cen.doc
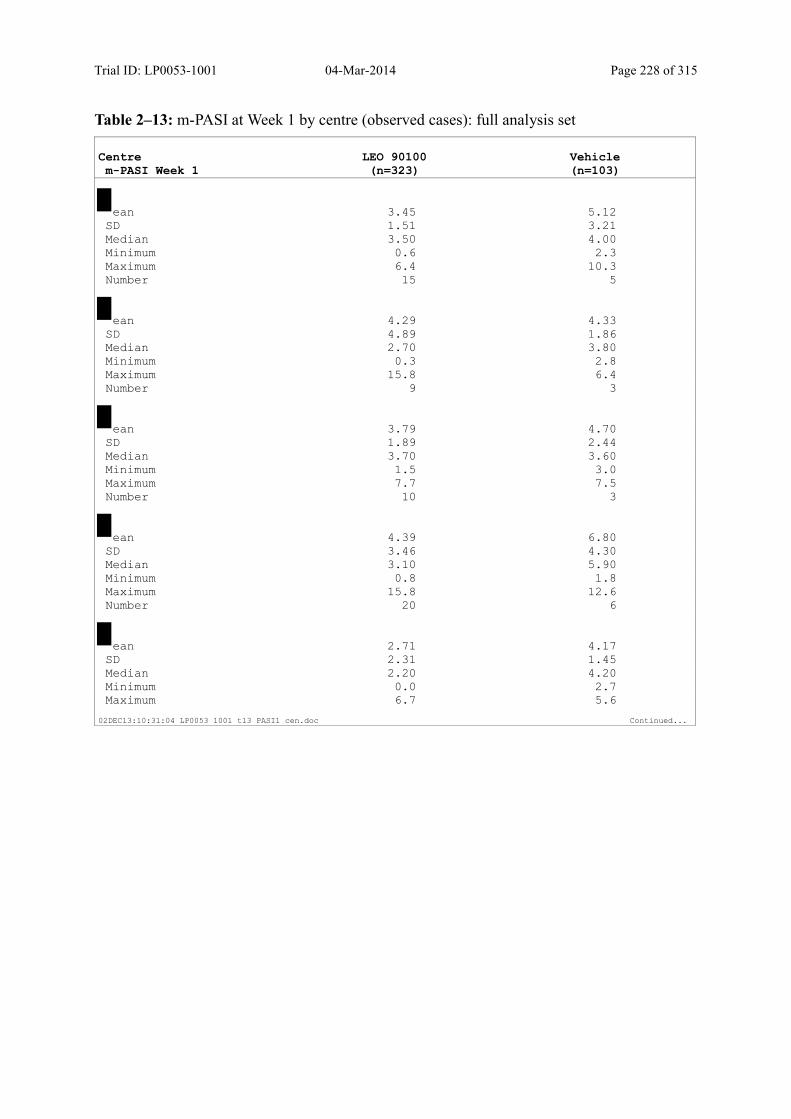
Trial ID: LP0053-1001 04-Mar-2014 Page 228 of 315
Table 2–13: m-PASI at Week 1 by centre (observed cases): full analysis set
Centrem-PASI Week 1
LEO 90100(n=323)
Vehicle(n=103)
ean 3.45 5.12 SD 1.51 3.21 Median 3.50 4.00 Minimum 0.6 2.3 Maximum 6.4 10.3 Number 15 5
ean 4.29 4.33 SD 4.89 1.86 Median 2.70 3.80 Minimum 0.3 2.8 Maximum 15.8 6.4 Number 9 3
ean 3.79 4.70 SD 1.89 2.44 Median 3.70 3.60 Minimum 1.5 3.0 Maximum 7.7 7.5 Number 10 3
ean 4.39 6.80 SD 3.46 4.30 Median 3.10 5.90 Minimum 0.8 1.8 Maximum 15.8 12.6 Number 20 6
ean 2.71 4.17 SD 2.31 1.45 Median 2.20 4.20 Minimum 0.0 2.7 Maximum 6.7 5.6
02DEC13:10:31:04 LP0053 1001 t13 PASI1 cen.doc Continued...

Trial ID: LP0053-1001 04-Mar-2014 Page 229 of 315
Table 2–13: m-PASI at Week 1 by centre (observed cases): full analysis set, continued
Centrem-PASI Week 1
LEO 90100(n=323)
Vehicle(n=103)
umber 12 3
ean 3.31 5.77 SD 2.33 3.60 Median 2.85 4.00 Minimum 0.9 2.4 Maximum 10.4 11.4 Number 20 7
ean 6.49 6.78 SD 3.27 3.02 Median 5.80 6.45 Minimum 2.7 2.2 Maximum 16.0 10.8 Number 17 6
ean 4.98 4.68 SD 4.29 3.16 Median 3.45 3.70 Minimum 0.2 1.8 Maximum 14.4 9.2 Number 16 6
ean 3.86 8.27 SD 2.40 4.50 Median 4.00 6.40 Minimum 0.6 5.0 Maximum 8.6 13.4 Number 10 3
ean 7.90 7.97 SD 7.05 0.55 Median 5.80 7.70 Minimum 2.6 7.6
02DEC13:10:31:04 LP0053 1001 t13 PASI1 cen.doc Continued...
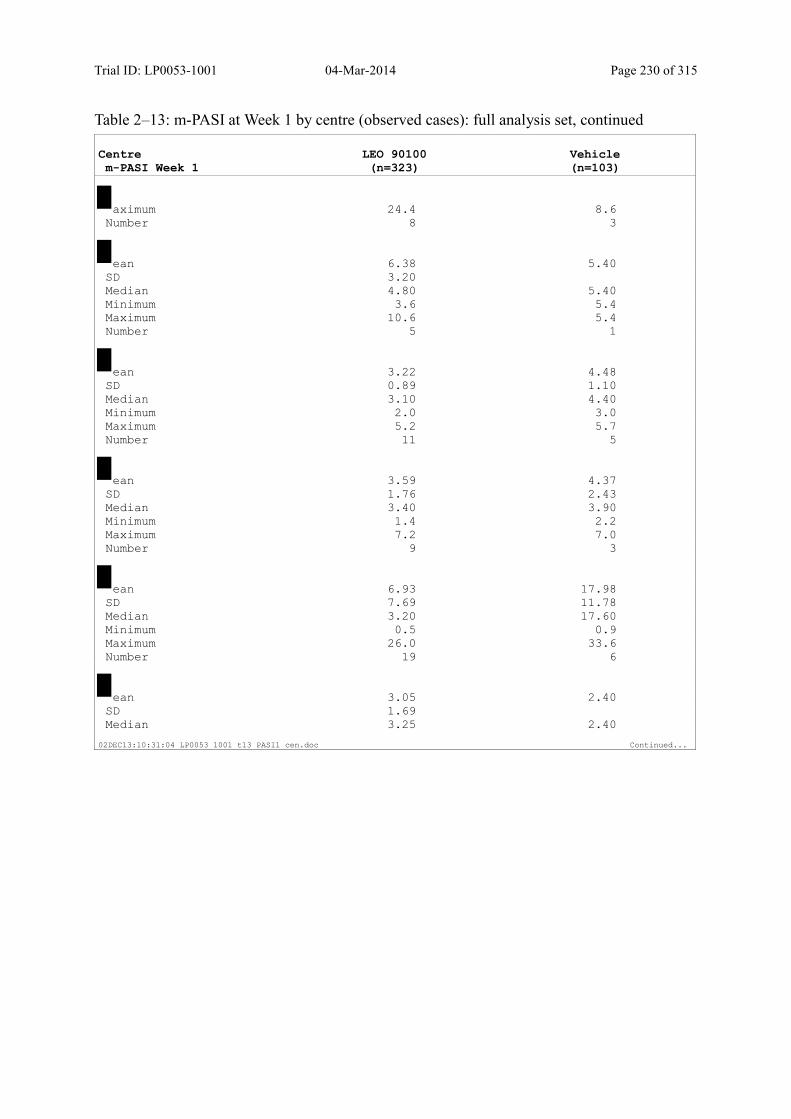
Trial ID: LP0053-1001 04-Mar-2014 Page 230 of 315
Table 2–13: m-PASI at Week 1 by centre (observed cases): full analysis set, continued
Centrem-PASI Week 1
LEO 90100(n=323)
Vehicle(n=103)
aximum 24.4 8.6 Number 8 3
ean 6.38 5.40 SD 3.20 Median 4.80 5.40 Minimum 3.6 5.4 Maximum 10.6 5.4 Number 5 1
ean 3.22 4.48 SD 0.89 1.10 Median 3.10 4.40 Minimum 2.0 3.0 Maximum 5.2 5.7 Number 11 5
ean 3.59 4.37 SD 1.76 2.43 Median 3.40 3.90 Minimum 1.4 2.2 Maximum 7.2 7.0 Number 9 3
ean 6.93 17.98 SD 7.69 11.78 Median 3.20 17.60 Minimum 0.5 0.9 Maximum 26.0 33.6 Number 19 6
ean 3.05 2.40 SD 1.69 Median 3.25 2.40
02DEC13:10:31:04 LP0053 1001 t13 PASI1 cen.doc Continued...

Trial ID: LP0053-1001 04-Mar-2014 Page 231 of 315
Table 2–13: m-PASI at Week 1 by centre (observed cases): full analysis set, continued
Centrem-PASI Week 1
LEO 90100(n=323)
Vehicle(n=103)
inimum 0.0 2.4 Maximum 5.2 2.4 Number 6 1
ean 5.32 6.88 SD 2.28 3.60 Median 5.20 5.35 Minimum 2.6 4.6 Maximum 10.8 12.2 Number 12 4
ean 3.89 5.60 SD 2.04 0.57 Median 3.80 5.60 Minimum 1.4 5.2 Maximum 8.5 6.0 Number 9 2
ean 3.87 4.00 SD 3.19 2.43 Median 3.60 2.80 Minimum 0.6 2.4 Maximum 11.5 6.8 Number 9 3
ean 5.84 2.90 SD 2.65 0.42 Median 5.50 2.90 Minimum 2.4 2.6 Maximum 10.3 3.2 Number 9 2
ean 2.74 6.18 SD 1.76 4.52
02DEC13:10:31:04 LP0053 1001 t13 PASI1 cen.doc Continued...

Trial ID: LP0053-1001 04-Mar-2014 Page 232 of 315
Table 2–13: m-PASI at Week 1 by centre (observed cases): full analysis set, continued
Centrem-PASI Week 1
LEO 90100(n=323)
Vehicle(n=103)
edian 2.30 5.05 Minimum 0.6 2.0 Maximum 7.4 12.6 Number 12 4
ean 4.53 4.60 SD 1.90 Median 4.00 4.60 Minimum 3.0 4.6 Maximum 7.1 4.6 Number 4 1
ean 4.22 3.63 SD 1.86 1.93 Median 3.80 3.35 Minimum 2.2 1.6 Maximum 8.4 6.2 Number 13 4
ean 4.78 6.63 SD 3.53 3.04 Median 3.60 5.00 Minimum 1.2 4.0 Maximum 14.6 12.0 Number 18 7
ean 5.21 6.58 SD 3.32 4.02 Median 4.50 5.50 Minimum 1.6 2.8 Maximum 15.4 13.1 Number 13 5
Mean 4.22 4.37
02DEC13:10:31:04 LP0053 1001 t13 PASI1 cen.doc Continued...

Trial ID: LP0053-1001 04-Mar-2014 Page 233 of 315
Table 2–13: m-PASI at Week 1 by centre (observed cases): full analysis set, continued
Centrem-PASI Week 1
LEO 90100(n=323)
Vehicle(n=103)
D 2.81 1.28 Median 3.80 4.80 Minimum 1.0 2.4 Maximum 10.8 5.6 Number 17 6
Mean 3.41 3.20 SD 3.03 4.53 Median 2.40 3.20 Minimum 0.0 0.0 Maximum 9.4 6.4 Number 9 2
ean 7.95 8.20 SD 3.90 Median 9.40 8.20 Minimum 2.2 8.2 Maximum 10.8 8.2 Number 4 1
02DEC13:10:31:04 LP0053 1001 t13 PASI1 cen.doc

Trial ID: LP0053-1001 04-Mar-2014 Page 234 of 315
Table 2–14: Statistical analysis of PASI-50 at Week 4 (multiple imputation): full analysis set
LEO 90100(n=323)
Vehicle(n=103)
PASI-50 Week 4Number of subjects %
Number of subjects %
Yes1 265.8 82.3 28.9 28.0 No1 57.2 17.7 74.1 72.0 Total 323 100.0 103 100.0 Odds ratio2 13.94 95% CI 7.56 to
25.73
p-value < 0.001 Breslow-Day test p-value3 0.037
02JAN14:15:19:28 LP0053 1001 t14 PASI50.doc
1) Mean number of subjects across imputations.2) Mantel-Haenszel odds of PASI-50 in LEO 90100 group relative to
vehicle group, adjusted for pooled centre.3) Breslow-Day test for homogeneity of odds ratios across pooled
centres.
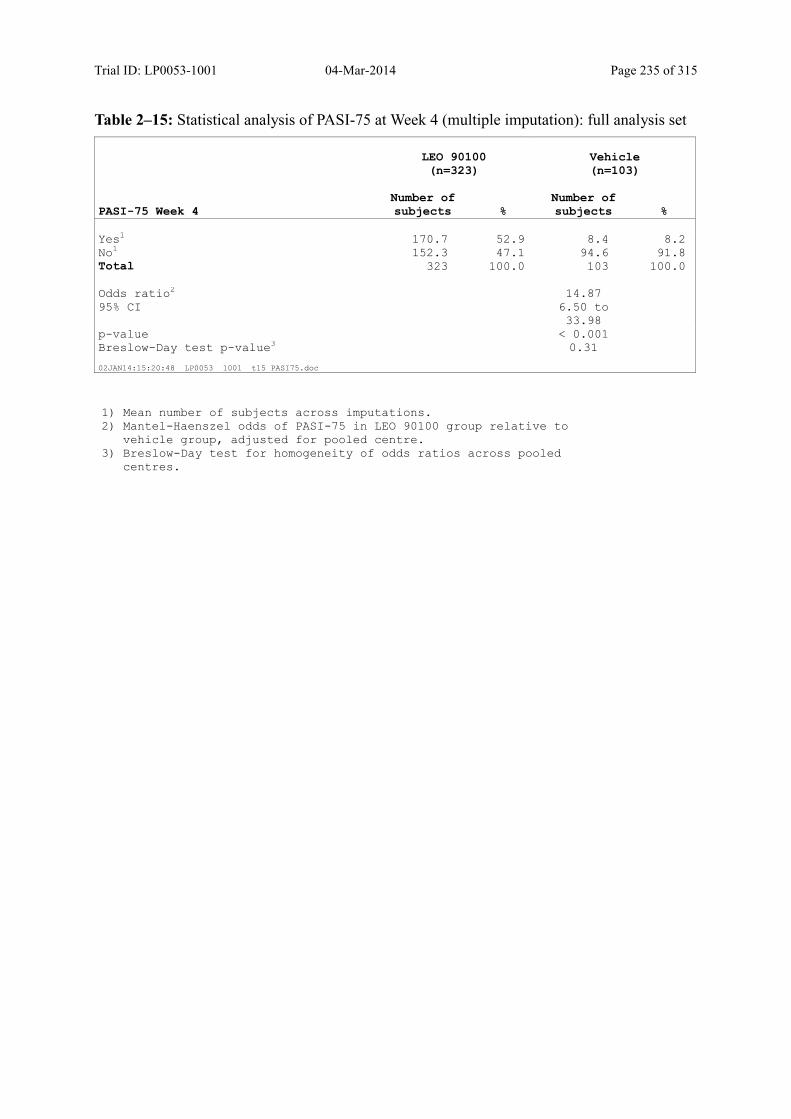
Trial ID: LP0053-1001 04-Mar-2014 Page 235 of 315
Table 2–15: Statistical analysis of PASI-75 at Week 4 (multiple imputation): full analysis set
LEO 90100(n=323)
Vehicle(n=103)
PASI-75 Week 4Number of subjects %
Number of subjects %
Yes1 170.7 52.9 8.4 8.2 No1 152.3 47.1 94.6 91.8 Total 323 100.0 103 100.0 Odds ratio2 14.87 95% CI 6.50 to
33.98
p-value < 0.001 Breslow-Day test p-value3 0.31
02JAN14:15:20:48 LP0053 1001 t15 PASI75.doc
1) Mean number of subjects across imputations.2) Mantel-Haenszel odds of PASI-75 in LEO 90100 group relative to
vehicle group, adjusted for pooled centre.3) Breslow-Day test for homogeneity of odds ratios across pooled
centres.
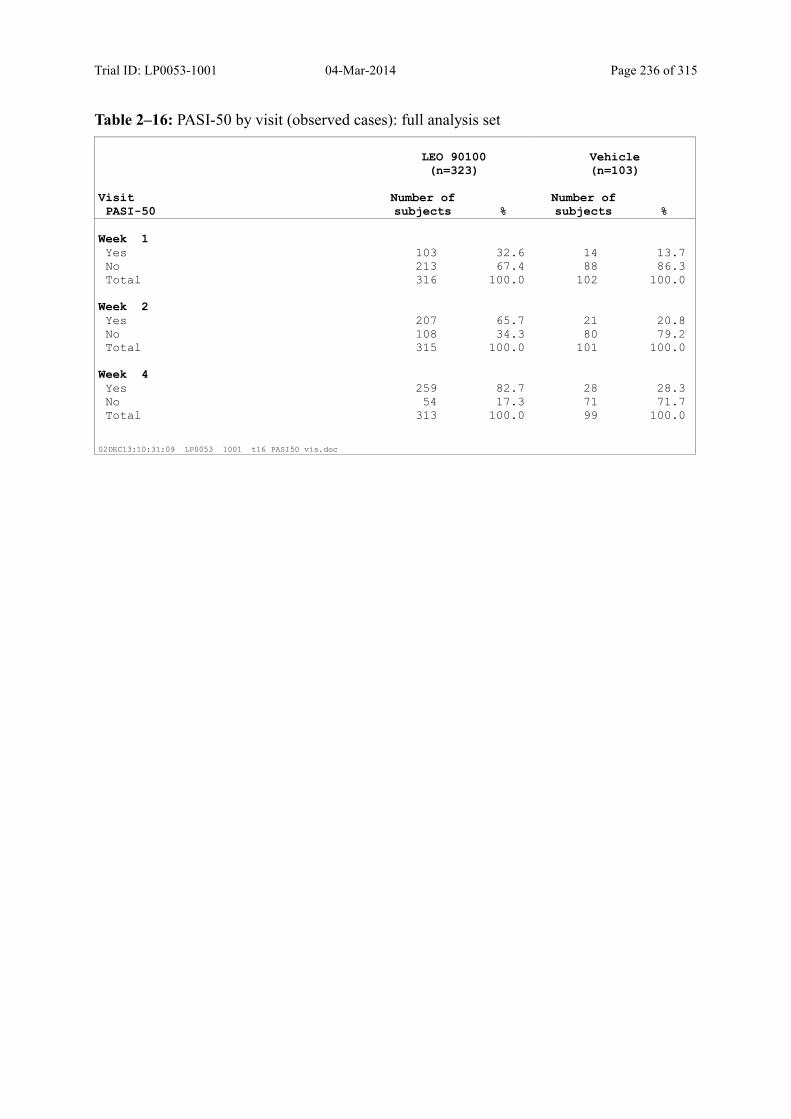
Trial ID: LP0053-1001 04-Mar-2014 Page 236 of 315
Table 2–16: PASI-50 by visit (observed cases): full analysis set
LEO 90100(n=323)
Vehicle(n=103)
VisitPASI-50
Number of subjects %
Number of subjects %
Week 1Yes 103 32.6 14 13.7 No 213 67.4 88 86.3 Total 316 100.0 102 100.0
Week 2Yes 207 65.7 21 20.8 No 108 34.3 80 79.2 Total 315 100.0 101 100.0
Week 4Yes 259 82.7 28 28.3 No 54 17.3 71 71.7 Total 313 100.0 99 100.0
02DEC13:10:31:09 LP0053 1001 t16 PASI50 vis.doc
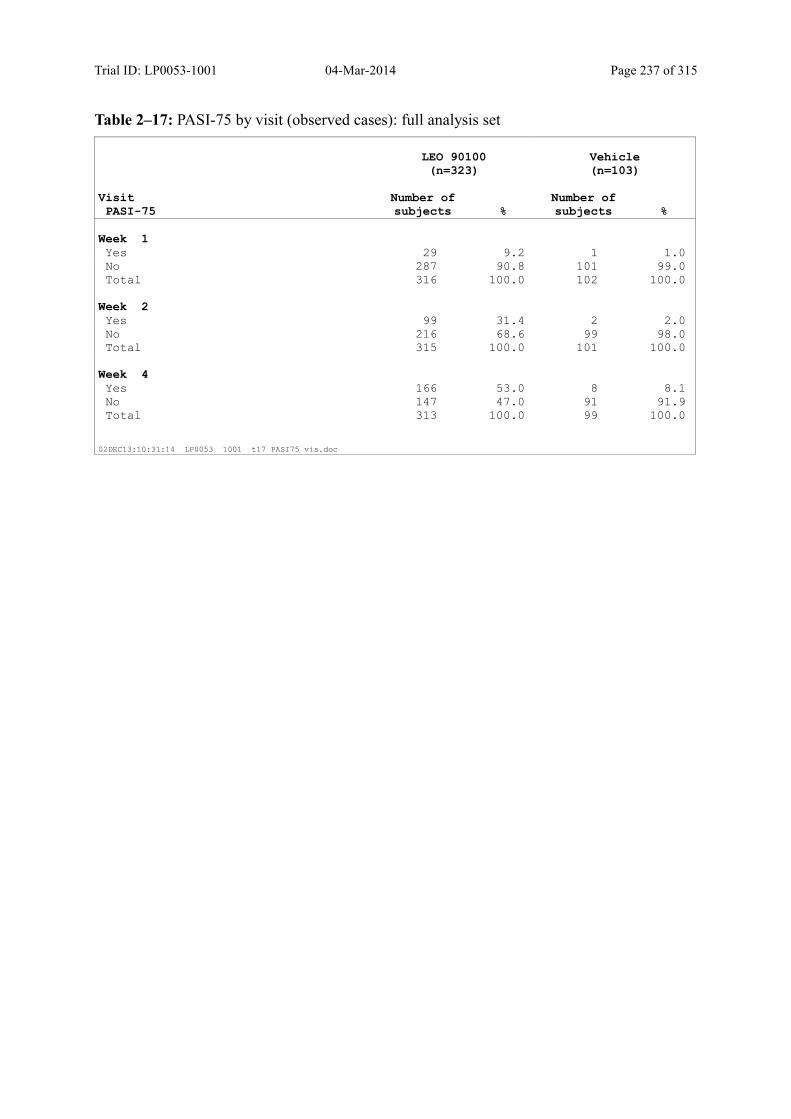
Trial ID: LP0053-1001 04-Mar-2014 Page 237 of 315
Table 2–17: PASI-75 by visit (observed cases): full analysis set
LEO 90100(n=323)
Vehicle(n=103)
VisitPASI-75
Number of subjects %
Number of subjects %
Week 1Yes 29 9.2 1 1.0 No 287 90.8 101 99.0 Total 316 100.0 102 100.0
Week 2Yes 99 31.4 2 2.0 No 216 68.6 99 98.0 Total 315 100.0 101 100.0
Week 4Yes 166 53.0 8 8.1 No 147 47.0 91 91.9 Total 313 100.0 99 100.0
02DEC13:10:31:14 LP0053 1001 t17 PASI75 vis.doc
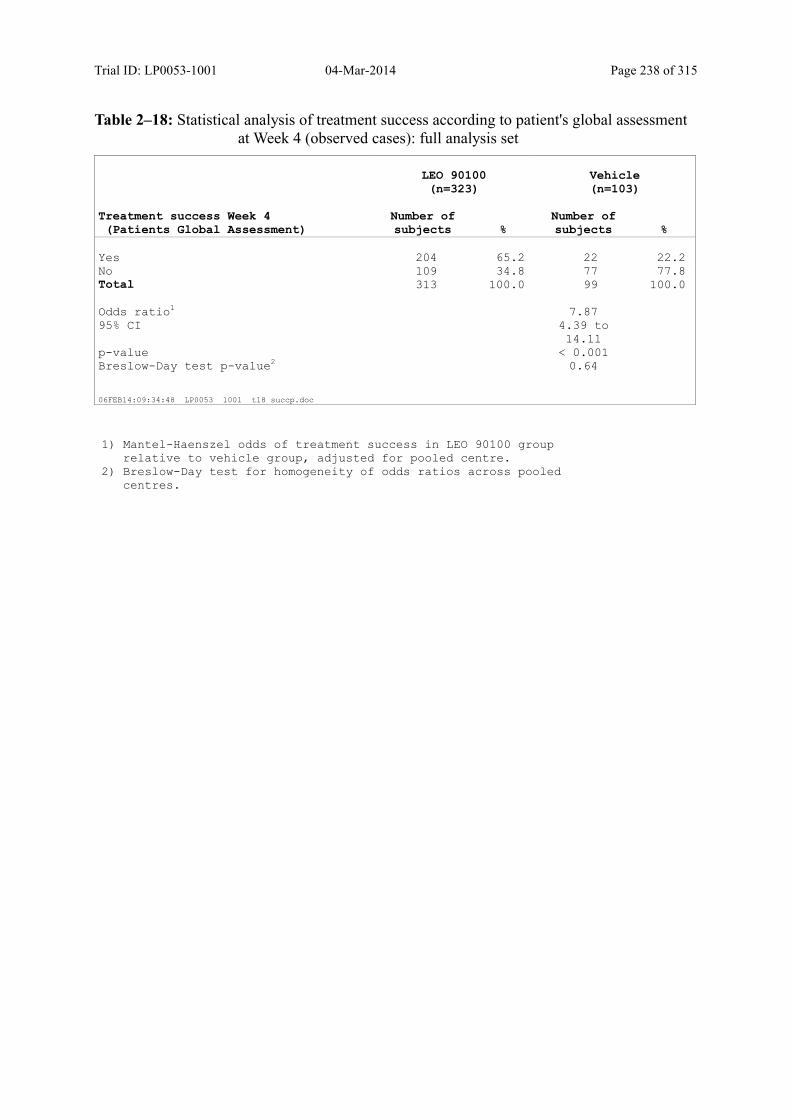
Trial ID: LP0053-1001 04-Mar-2014 Page 238 of 315
Table 2–18: Statistical analysis of treatment success according to patient's global assessment at Week 4 (observed cases): full analysis set
LEO 90100(n=323)
Vehicle(n=103)
Treatment success Week 4(Patients Global Assessment)
Number of subjects %
Number of subjects %
Yes 204 65.2 22 22.2 No 109 34.8 77 77.8 Total 313 100.0 99 100.0 Odds ratio1 7.87 95% CI 4.39 to
14.11
p-value < 0.001 Breslow-Day test p-value2 0.64
06FEB14:09:34:48 LP0053 1001 t18 succp.doc
1) Mantel-Haenszel odds of treatment success in LEO 90100 group relative to vehicle group, adjusted for pooled centre.2) Breslow-Day test for homogeneity of odds ratios across pooled
centres.
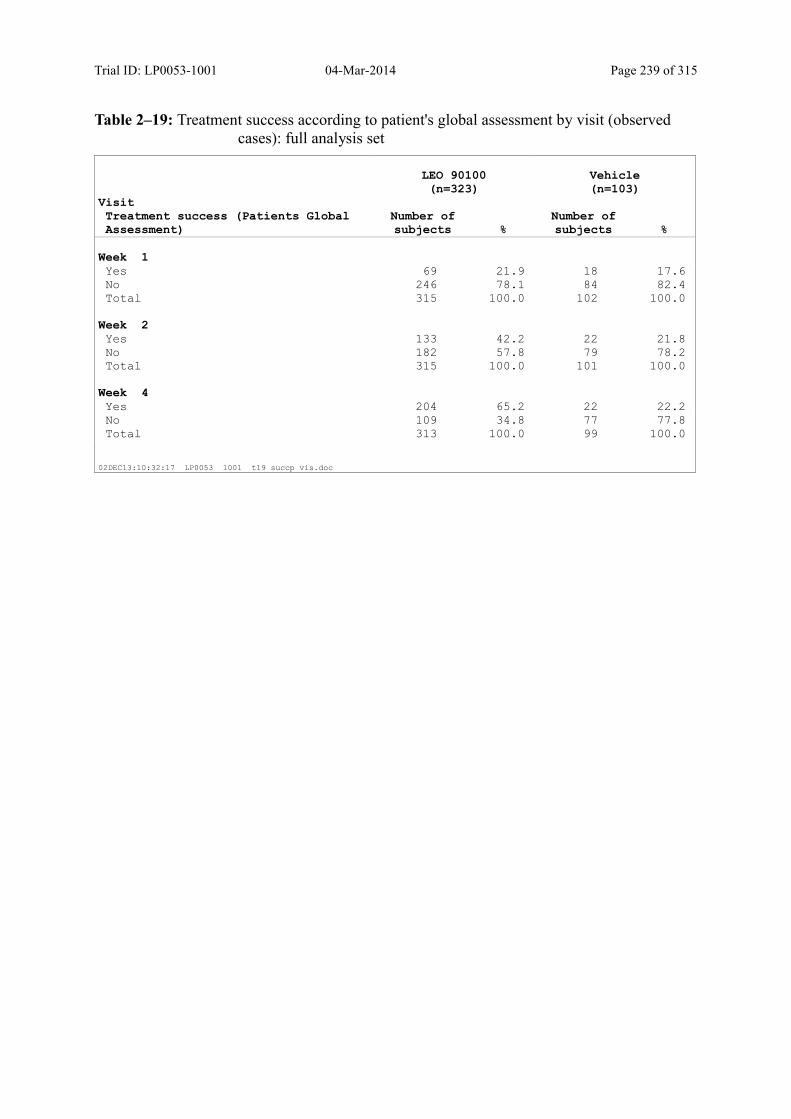
Trial ID: LP0053-1001 04-Mar-2014 Page 239 of 315
Table 2–19: Treatment success according to patient's global assessment by visit (observed cases): full analysis set
LEO 90100(n=323)
Vehicle(n=103)
VisitTreatment success (Patients GlobalAssessment)
Number of subjects %
Number of subjects %
Week 1Yes 69 21.9 18 17.6 No 246 78.1 84 82.4 Total 315 100.0 102 100.0
Week 2Yes 133 42.2 22 21.8 No 182 57.8 79 78.2 Total 315 100.0 101 100.0
Week 4Yes 204 65.2 22 22.2 No 109 34.8 77 77.8 Total 313 100.0 99 100.0
02DEC13:10:32:17 LP0053 1001 t19 succp vis.doc

Trial ID: LP0053-1001 04-Mar-2014 Page 240 of 315
Table 2–20: Patient's global assessment by visit (observed cases): full analysis set
LEO 90100(n=323)
Vehicle(n=103)
VisitPatients GlobalAssessment
Number of subjects %
Number of subjects %
BaselineVery mild 9 2.8 6 5.8 Mild 86 26.6 22 21.4 Moderate 167 51.7 53 51.5 Severe 61 18.9 22 21.4 Total 323 100.0 103 100.0
Week 1Clear 9 2.9 1 1.0 Very mild 60 19.0 17 16.7 Mild 138 43.8 38 37.3 Moderate 100 31.7 31 30.4 Severe 8 2.5 15 14.7 Total 315 100.0 102 100.0
Week 2Clear 19 6.0 3 3.0 Very mild 114 36.2 19 18.8 Mild 123 39.0 32 31.7 Moderate 53 16.8 39 38.6 Severe 6 1.9 8 7.9 Total 315 100.0 101 100.0
Week 4Clear 64 20.4 0 0.0 Very mild 140 44.7 22 22.2 Mild 82 26.2 30 30.3 Moderate 23 7.3 37 37.4 Severe 4 1.3 10 10.1 Total 313 100.0 99 100.0
02DEC13:10:31:21 LP0053 1001 t20 pga vis.doc

Trial ID: LP0053-1001 04-Mar-2014 Page 241 of 315
Table 2–21: Analysis of change in Subject's assessment of itch (VAS) by time point (observed cases): full analysis set
VisitItch VAS/Change in itch VAS
LEO 90100(n=323)
Vehicle(n=103)
BaselineMean 50.3 55.3 SD 29.7 29.4 Median 51.0 62.0 Minimum 0 0 Maximum 100 100 Number 323 102
Day 3 (change)Mean -22.9 -18.7 SD 24.5 24.3 Median -19.0 -15.0 Minimum -94 -71 Maximum 59 38 Number 312 98 Adjusted mean1 -23.5 -17.1 Difference1 -6.44 95% CI -11.33 to -1.55 p-value1 0.010
Day 5 (change)Mean -30.8 -23.3 SD 26.2 24.7 Median -27.0 -20.0 Minimum -100 -76 Maximum 45 31 Number 310 98 Adjusted mean1 -31.5 -21.3 Difference1 -10.26 95% CI -14.94 to -5.58 p-value1 < 0.001
Week 1 (change)Mean -33.9 -24.2 SD 27.7 25.3 Median -32.0 -22.0 Minimum -100 -77 Maximum 34 30 Number 314 101 Adjusted mean1 -34.8 -21.9 Difference1 -12.88 95% CI -17.59 to -8.17 p-value1 < 0.001
29JAN14:09:45:06 LP0053 1001 t21_itch_vas.doc Continued...
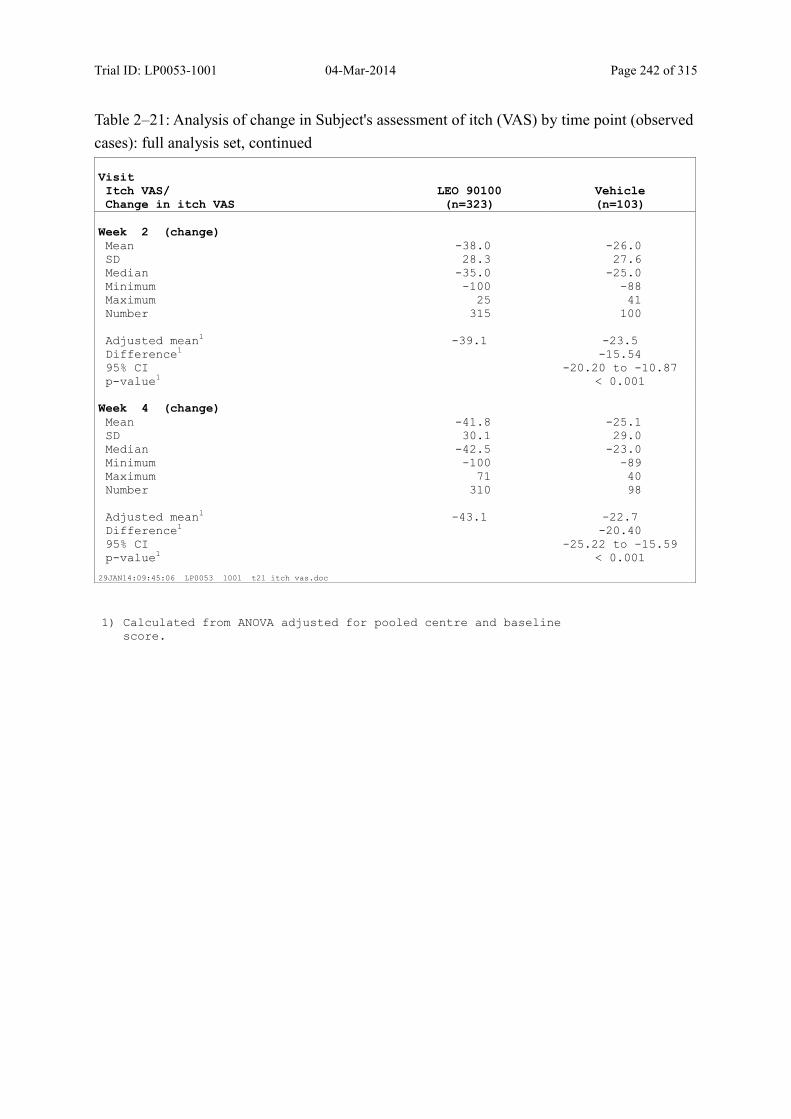
Trial ID: LP0053-1001 04-Mar-2014 Page 242 of 315
Table 2–21: Analysis of change in Subject's assessment of itch (VAS) by time point (observed
cases): full analysis set, continued
VisitItch VAS/Change in itch VAS
LEO 90100(n=323)
Vehicle(n=103)
Week 2 (change)Mean -38.0 -26.0 SD 28.3 27.6 Median -35.0 -25.0 Minimum -100 -88 Maximum 25 41 Number 315 100 Adjusted mean1 -39.1 -23.5 Difference1 -15.54 95% CI -20.20 to -10.87 p-value1 < 0.001
Week 4 (change)Mean -41.8 -25.1 SD 30.1 29.0 Median -42.5 -23.0 Minimum -100 -89 Maximum 71 40 Number 310 98 Adjusted mean1 -43.1 -22.7 Difference1 -20.40 95% CI -25.22 to -15.59 p-value1 < 0.001
29JAN14:09:45:06 LP0053 1001 t21 itch vas.doc
1) Calculated from ANOVA adjusted for pooled centre and baseline score.

Trial ID: LP0053-1001 04-Mar-2014 Page 243 of 315
Table 2–22: Analysis of change in Subject's assessment of itch-related sleep loss (VAS) by time point (observed cases): full analysis set
VisitSleep loss VAS/Change in Sleep lossVAS
LEO 90100(n=323)
Vehicle(n=103)
BaselineMean 26.9 33.1 SD 29.8 32.3 Median 14.5 24.0 Minimum 0 0 Maximum 100 100 Number 322 102
Day 3 (change)Mean -10.8 -7.5 SD 23.6 26.6 Median -2.0 -1.0 Minimum -100 -88 Maximum 73 86 Number 313 98 Adjusted mean1 -11.6 -5.6 Difference1 -5.97 95% CI -10.45 to -1.50 p-value1 0.009
Day 5 (change)Mean -14.2 -11.5 SD 24.8 26.7 Median -5.0 -4.0 Minimum -100 -88 Maximum 48 73 Number 313 98 Adjusted mean1 -15.1 -9.1 Difference1 -5.97 95% CI -10.05 to -1.89 p-value1 0.004
Week 1 (change)Mean -16.2 -12.0 SD 25.4 26.1 Median -6.5 -3.0 Minimum -100 -89 Maximum 48 74 Number 314 101 Adjusted mean1 -17.2 -9.4 Difference1 -7.83 95% CI -11.84 to -3.83 p-value1 < 0.001
29JAN14:09:42:12 LP0053 1001 t22 sleep vas.doc Continued...
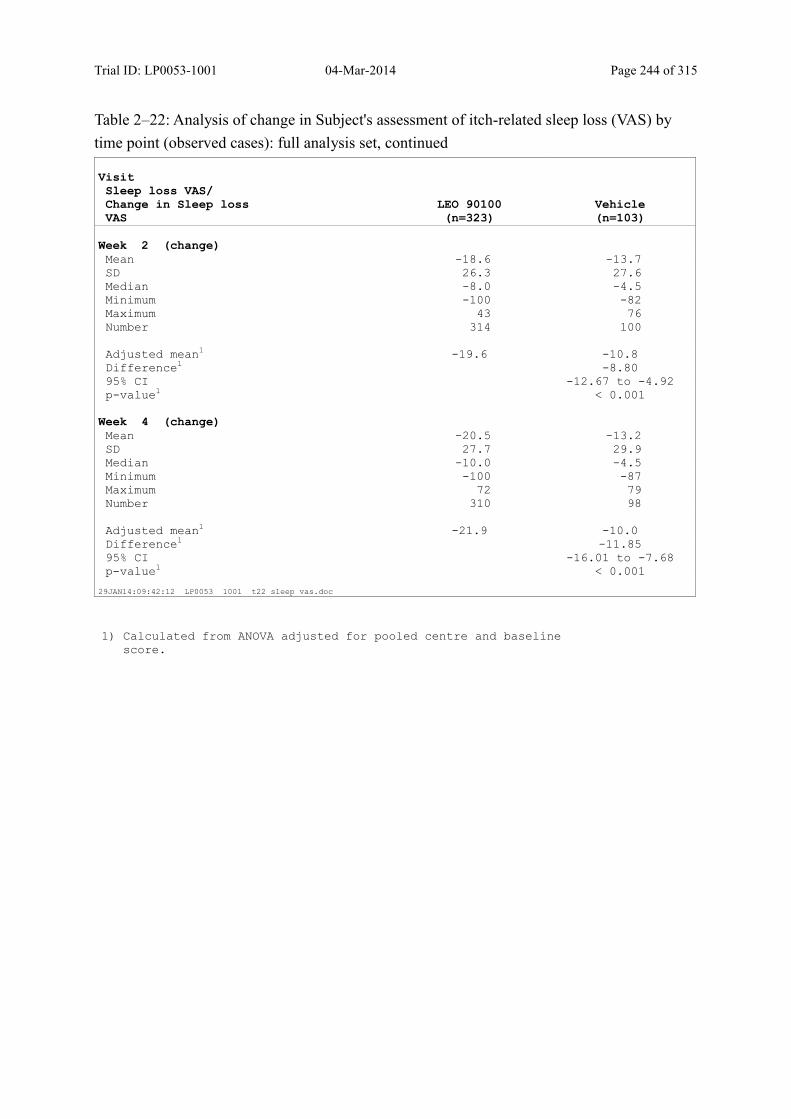
Trial ID: LP0053-1001 04-Mar-2014 Page 244 of 315
Table 2–22: Analysis of change in Subject's assessment of itch-related sleep loss (VAS) by
time point (observed cases): full analysis set, continued
VisitSleep loss VAS/Change in Sleep lossVAS
LEO 90100(n=323)
Vehicle(n=103)
Week 2 (change)Mean -18.6 -13.7 SD 26.3 27.6 Median -8.0 -4.5 Minimum -100 -82 Maximum 43 76 Number 314 100 Adjusted mean1 -19.6 -10.8 Difference1 -8.80 95% CI -12.67 to -4.92 p-value1 < 0.001
Week 4 (change)Mean -20.5 -13.2 SD 27.7 29.9 Median -10.0 -4.5 Minimum -100 -87 Maximum 72 79 Number 310 98 Adjusted mean1 -21.9 -10.0 Difference1 -11.85 95% CI -16.01 to -7.68 p-value1 < 0.001
29JAN14:09:42:12 LP0053 1001 t22 sleep vas.doc
1) Calculated from ANOVA adjusted for pooled centre and baseline score.

Trial ID: LP0053-1001 04-Mar-2014 Page 245 of 315
Table 2–23: Change in BSA from baseline to each visit (observed cases): full analysis set
VisitBSA/Change in BSA
LEO 90100(n=323)
Vehicle(n=103)
BaselineMean 7.4 8.0 SD 6.4 7.0 Median 5.0 5.0 Minimum 2 2 Maximum 30 30 Number 323 103
Week 1 (change)Mean -0.9 -0.3 SD 2.2 1.5 Median 0.0 0.0 Minimum -20 -11 Maximum 5 4 Number 316 102
Week 2 (change)Mean -2.0 -1.0 SD 3.3 2.9 Median -1.0 0.0 Minimum -28 -15 Maximum 4 12 Number 315 101
Week 4 (change)Mean -3.7 -1.0 SD 4.8 3.3 Median -2.0 0.0 Minimum -28 -15 Maximum 2 17 Number 313 99
02DEC13:10:31:39 LP0053 1001 t23 BSA.doc
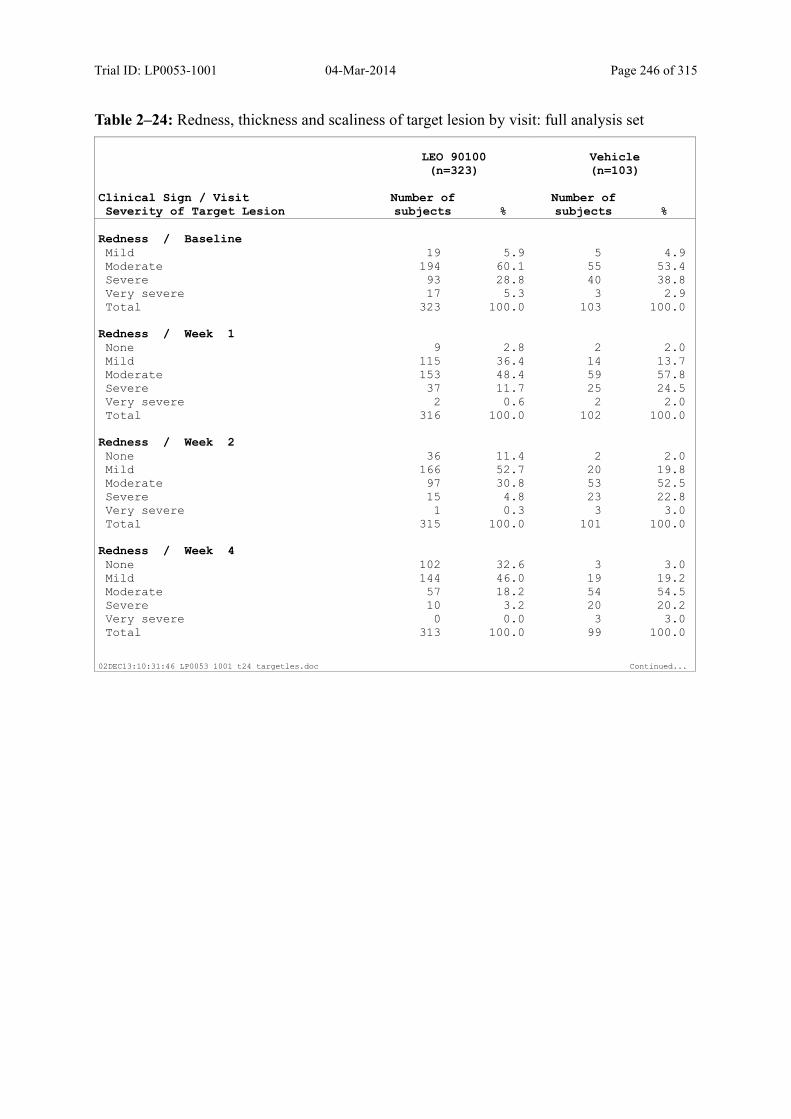
Trial ID: LP0053-1001 04-Mar-2014 Page 246 of 315
Table 2–24: Redness, thickness and scaliness of target lesion by visit: full analysis set
LEO 90100(n=323)
Vehicle(n=103)
Clinical Sign / VisitSeverity of Target Lesion
Number of subjects %
Number of subjects %
Redness / BaselineMild 19 5.9 5 4.9 Moderate 194 60.1 55 53.4 Severe 93 28.8 40 38.8 Very severe 17 5.3 3 2.9 Total 323 100.0 103 100.0
Redness / Week 1None 9 2.8 2 2.0 Mild 115 36.4 14 13.7 Moderate 153 48.4 59 57.8 Severe 37 11.7 25 24.5 Very severe 2 0.6 2 2.0 Total 316 100.0 102 100.0
Redness / Week 2None 36 11.4 2 2.0 Mild 166 52.7 20 19.8 Moderate 97 30.8 53 52.5 Severe 15 4.8 23 22.8 Very severe 1 0.3 3 3.0 Total 315 100.0 101 100.0
Redness / Week 4None 102 32.6 3 3.0 Mild 144 46.0 19 19.2 Moderate 57 18.2 54 54.5 Severe 10 3.2 20 20.2 Very severe 0 0.0 3 3.0 Total 313 100.0 99 100.0
02DEC13:10:31:46 LP0053 1001 t24 targetles.doc Continued...

Trial ID: LP0053-1001 04-Mar-2014 Page 247 of 315
Table 2–24: Redness, thickness and scaliness of target lesion by visit: full analysis set,
continued
LEO 90100(n=323)
Vehicle(n=103)
Clinical Sign / VisitSeverity of Target Lesion
Number of subjects %
Number of subjects %
Thickness / BaselineMild 29 9.0 7 6.8 Moderate 194 60.1 63 61.2 Severe 90 27.9 27 26.2 Very severe 10 3.1 6 5.8 Total 323 100.0 103 100.0
Thickness / Week 1None 45 14.2 2 2.0 Mild 133 42.1 26 25.5 Moderate 118 37.3 61 59.8 Severe 18 5.7 10 9.8 Very severe 2 0.6 3 2.9 Total 316 100.0 102 100.0
Thickness / Week 2None 116 36.8 3 3.0 Mild 127 40.3 35 34.7 Moderate 62 19.7 48 47.5 Severe 9 2.9 13 12.9 Very severe 1 0.3 2 2.0 Total 315 100.0 101 100.0
Thickness / Week 4None 180 57.5 4 4.0 Mild 89 28.4 32 32.3 Moderate 41 13.1 46 46.5 Severe 3 1.0 14 14.1 Very severe 0 0.0 3 3.0 Total 313 100.0 99 100.0
02DEC13:10:31:46 LP0053 1001 t24_targetles.doc Continued...
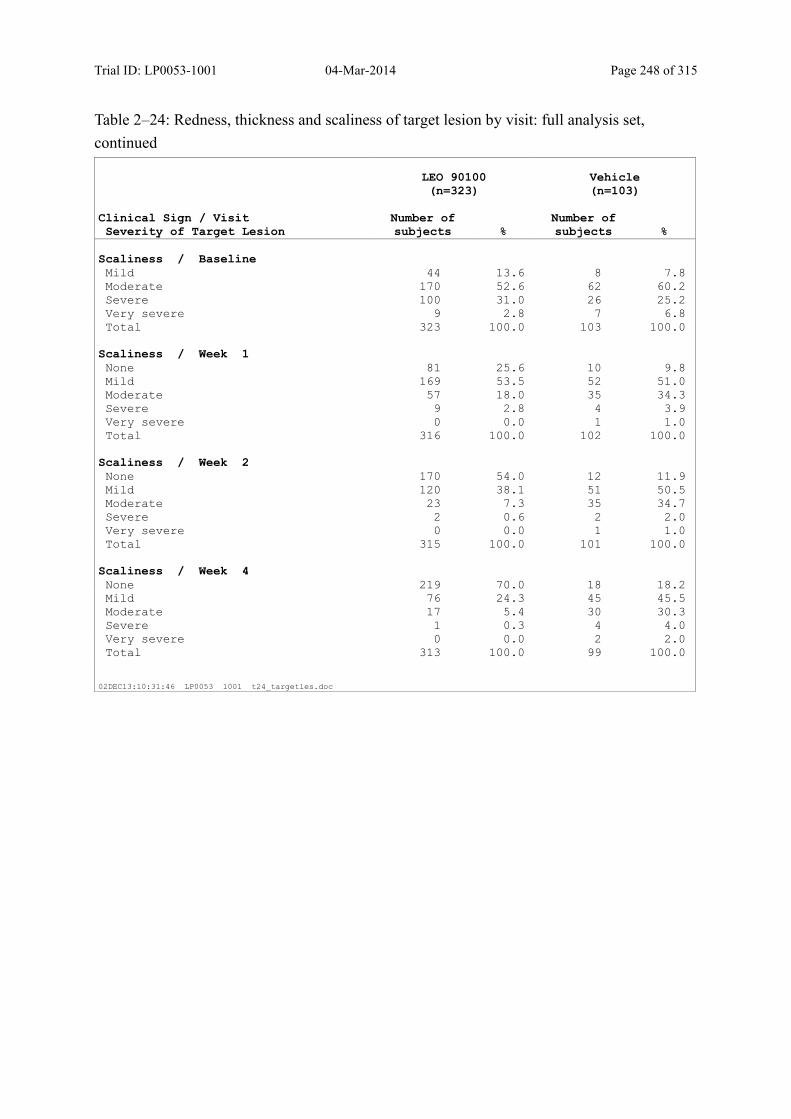
Trial ID: LP0053-1001 04-Mar-2014 Page 248 of 315
Table 2–24: Redness, thickness and scaliness of target lesion by visit: full analysis set,
continued
LEO 90100(n=323)
Vehicle(n=103)
Clinical Sign / VisitSeverity of Target Lesion
Number of subjects %
Number of subjects %
Scaliness / BaselineMild 44 13.6 8 7.8 Moderate 170 52.6 62 60.2 Severe 100 31.0 26 25.2 Very severe 9 2.8 7 6.8 Total 323 100.0 103 100.0
Scaliness / Week 1None 81 25.6 10 9.8 Mild 169 53.5 52 51.0 Moderate 57 18.0 35 34.3 Severe 9 2.8 4 3.9 Very severe 0 0.0 1 1.0 Total 316 100.0 102 100.0
Scaliness / Week 2None 170 54.0 12 11.9 Mild 120 38.1 51 50.5 Moderate 23 7.3 35 34.7 Severe 2 0.6 2 2.0 Very severe 0 0.0 1 1.0 Total 315 100.0 101 100.0
Scaliness / Week 4None 219 70.0 18 18.2 Mild 76 24.3 45 45.5 Moderate 17 5.4 30 30.3 Severe 1 0.3 4 4.0 Very severe 0 0.0 2 2.0 Total 313 100.0 99 100.0
02DEC13:10:31:46 LP0053 1001 t24_targetles.doc

Trial ID: LP0053-1001 04-Mar-2014 Page 249 of 315
Table 2–25: Analysis of change in DLQI by visit (observed cases): full analysis set
VisitDLQI/Change in DLQI
LEO 90100(n=323)
Vehicle(n=103)
BaselineMean 9.9 10.3 SD 6.4 6.9 Median 9.0 9.0 Minimum 0 0 Maximum 30 30 Number 322 103
Week 1 (change)Mean -4.6 -3.4 SD 4.4 4.1 Median -4.0 -3.0 Minimum -18 -16 Maximum 7 6 Number 315 101 Adjusted mean1 -4.7 -3.4 Difference1 -1.36 95% CI -2.13 to -0.60 p-value1 < 0.001
Week 2 (change)Mean -6.0 -4.0 SD 5.3 5.3 Median -5.0 -3.0 Minimum -24 -25 Maximum 9 16 Number 313 101 Adjusted mean1 -6.1 -3.9 Difference1 -2.14 95% CI -3.03 to -1.26 p-value1 < 0.001
Week 4 (change)Mean -7.0 -4.4 SD 5.4 5.1 Median -6.0 -4.0 Minimum -24 -22 Maximum 15 9 Number 309 99 Adjusted mean1 -7.1 -4.3 Difference1 -2.79 95% CI -3.65 to -1.94 p-value1 < 0.001
29JAN14:09:51:12 LP0053 1001 t25 DLQI.doc
1) Calculated from ANOVA adjusted for pooled centre and baseline score.
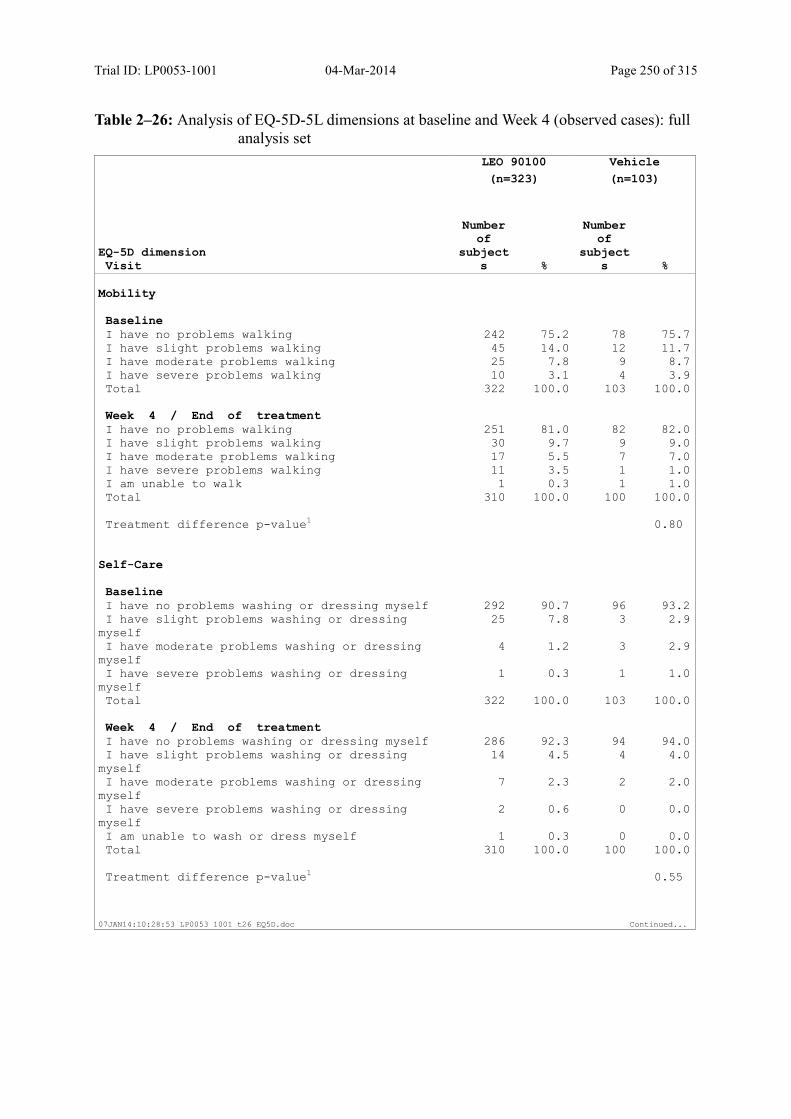
Trial ID: LP0053-1001 04-Mar-2014 Page 250 of 315
Table 2–26: Analysis of EQ-5D-5L dimensions at baseline and Week 4 (observed cases): full analysis set
LEO 90100
(n=323)
Vehicle
(n=103)
EQ-5D dimensionVisit
Number of
subjects %
Number of
subjects %
Mobility
BaselineI have no problems walking 242 75.2 78 75.7 I have slight problems walking 45 14.0 12 11.7 I have moderate problems walking 25 7.8 9 8.7 I have severe problems walking 10 3.1 4 3.9 Total 322 100.0 103 100.0
Week 4 / End of treatmentI have no problems walking 251 81.0 82 82.0 I have slight problems walking 30 9.7 9 9.0 I have moderate problems walking 17 5.5 7 7.0 I have severe problems walking 11 3.5 1 1.0 I am unable to walk 1 0.3 1 1.0 Total 310 100.0 100 100.0
Treatment difference p-value1 0.80
Self-Care
BaselineI have no problems washing or dressing myself 292 90.7 96 93.2 I have slight problems washing or dressing
myself 25 7.8 3 2.9
I have moderate problems washing or dressing myself
4 1.2 3 2.9
I have severe problems washing or dressing myself
1 0.3 1 1.0
Total 322 100.0 103 100.0
Week 4 / End of treatmentI have no problems washing or dressing myself 286 92.3 94 94.0 I have slight problems washing or dressing
myself 14 4.5 4 4.0
I have moderate problems washing or dressing myself
7 2.3 2 2.0
I have severe problems washing or dressing myself
2 0.6 0 0.0
I am unable to wash or dress myself 1 0.3 0 0.0 Total 310 100.0 100 100.0
Treatment difference p-value1 0.55
07JAN14:10:28:53 LP0053 1001 t26 EQ5D.doc Continued...
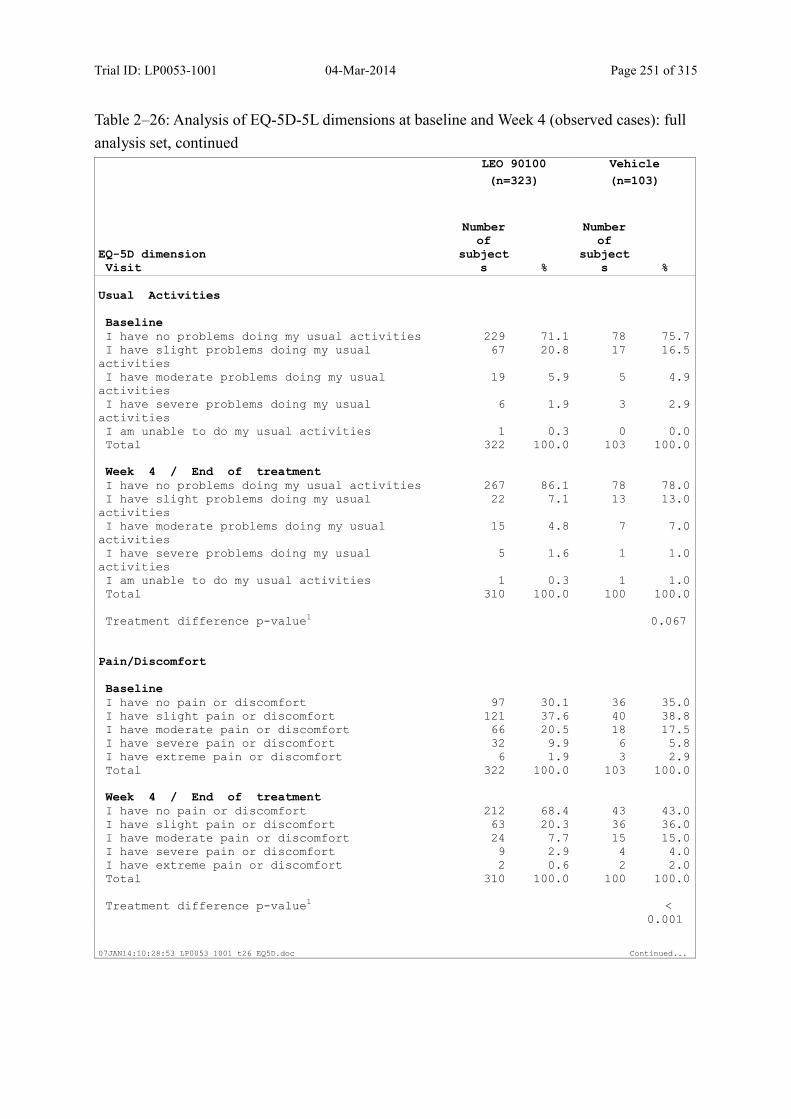
Trial ID: LP0053-1001 04-Mar-2014 Page 251 of 315
Table 2–26: Analysis of EQ-5D-5L dimensions at baseline and Week 4 (observed cases): full
analysis set, continuedLEO 90100
(n=323)
Vehicle
(n=103)
EQ-5D dimensionVisit
Number of
subjects %
Number of
subjects %
Usual Activities
BaselineI have no problems doing my usual activities 229 71.1 78 75.7 I have slight problems doing my usual
activities 67 20.8 17 16.5
I have moderate problems doing my usual activities
19 5.9 5 4.9
I have severe problems doing my usual activities
6 1.9 3 2.9
I am unable to do my usual activities 1 0.3 0 0.0 Total 322 100.0 103 100.0
Week 4 / End of treatmentI have no problems doing my usual activities 267 86.1 78 78.0 I have slight problems doing my usual
activities 22 7.1 13 13.0
I have moderate problems doing my usual activities
15 4.8 7 7.0
I have severe problems doing my usual activities
5 1.6 1 1.0
I am unable to do my usual activities 1 0.3 1 1.0 Total 310 100.0 100 100.0
Treatment difference p-value1 0.067
Pain/Discomfort
BaselineI have no pain or discomfort 97 30.1 36 35.0 I have slight pain or discomfort 121 37.6 40 38.8 I have moderate pain or discomfort 66 20.5 18 17.5 I have severe pain or discomfort 32 9.9 6 5.8 I have extreme pain or discomfort 6 1.9 3 2.9 Total 322 100.0 103 100.0
Week 4 / End of treatmentI have no pain or discomfort 212 68.4 43 43.0 I have slight pain or discomfort 63 20.3 36 36.0 I have moderate pain or discomfort 24 7.7 15 15.0 I have severe pain or discomfort 9 2.9 4 4.0 I have extreme pain or discomfort 2 0.6 2 2.0 Total 310 100.0 100 100.0
Treatment difference p-value1 <
0.001
07JAN14:10:28:53 LP0053 1001 t26 EQ5D.doc Continued...
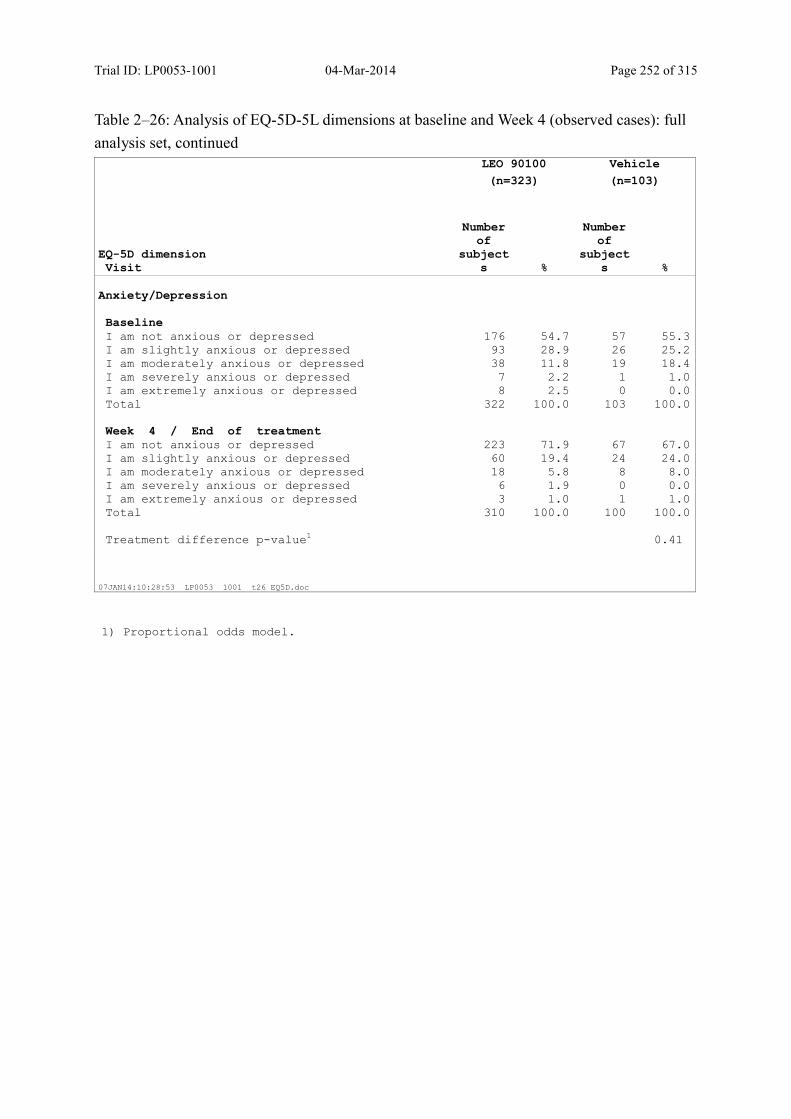
Trial ID: LP0053-1001 04-Mar-2014 Page 252 of 315
Table 2–26: Analysis of EQ-5D-5L dimensions at baseline and Week 4 (observed cases): full
analysis set, continuedLEO 90100
(n=323)
Vehicle
(n=103)
EQ-5D dimensionVisit
Number of
subjects %
Number of
subjects %
Anxiety/Depression
BaselineI am not anxious or depressed 176 54.7 57 55.3 I am slightly anxious or depressed 93 28.9 26 25.2 I am moderately anxious or depressed 38 11.8 19 18.4 I am severely anxious or depressed 7 2.2 1 1.0 I am extremely anxious or depressed 8 2.5 0 0.0 Total 322 100.0 103 100.0
Week 4 / End of treatmentI am not anxious or depressed 223 71.9 67 67.0 I am slightly anxious or depressed 60 19.4 24 24.0 I am moderately anxious or depressed 18 5.8 8 8.0 I am severely anxious or depressed 6 1.9 0 0.0 I am extremely anxious or depressed 3 1.0 1 1.0 Total 310 100.0 100 100.0
Treatment difference p-value1 0.41
07JAN14:10:28:53 LP0053 1001 t26 EQ5D.doc
1) Proportional odds model.

Trial ID: LP0053-1001 04-Mar-2014 Page 253 of 315
Table 2–27: EQ VAS score at baseline and Week 4 and analysis of change from baseline (observed cases): full analysis set
VisitEQ VAS score/Change in EQ VAS score
LEO 90100(n=323)
Vehicle(n=103)
BaselineMean 78.6 80.4 SD 17.4 15.4 Median 80.0 85.0 Minimum 0 35 Maximum 100 100 Number 322 103
Week 4 / End of treatmentMean 83.8 80.2 SD 15.3 16.3 Median 88.0 85.0 Minimum 12 0 Maximum 100 100 Number 311 99
Week 4 / End of treatment (change)Mean 5.3 0.4 SD 15.1 14.8 Median 5.0 0.0 Minimum -50 -80 Maximum 90 40 Number 311 99 Adjusted mean1 5.1 0.9 Difference1 4.26 95% CI 1.40 to 7.13 p-value1 0.004
07JAN14:10:28:47 LP0053 1001 t27 eq vas.doc
1) Calculated from ANOVA adjusted for pooled centre and baseline score.
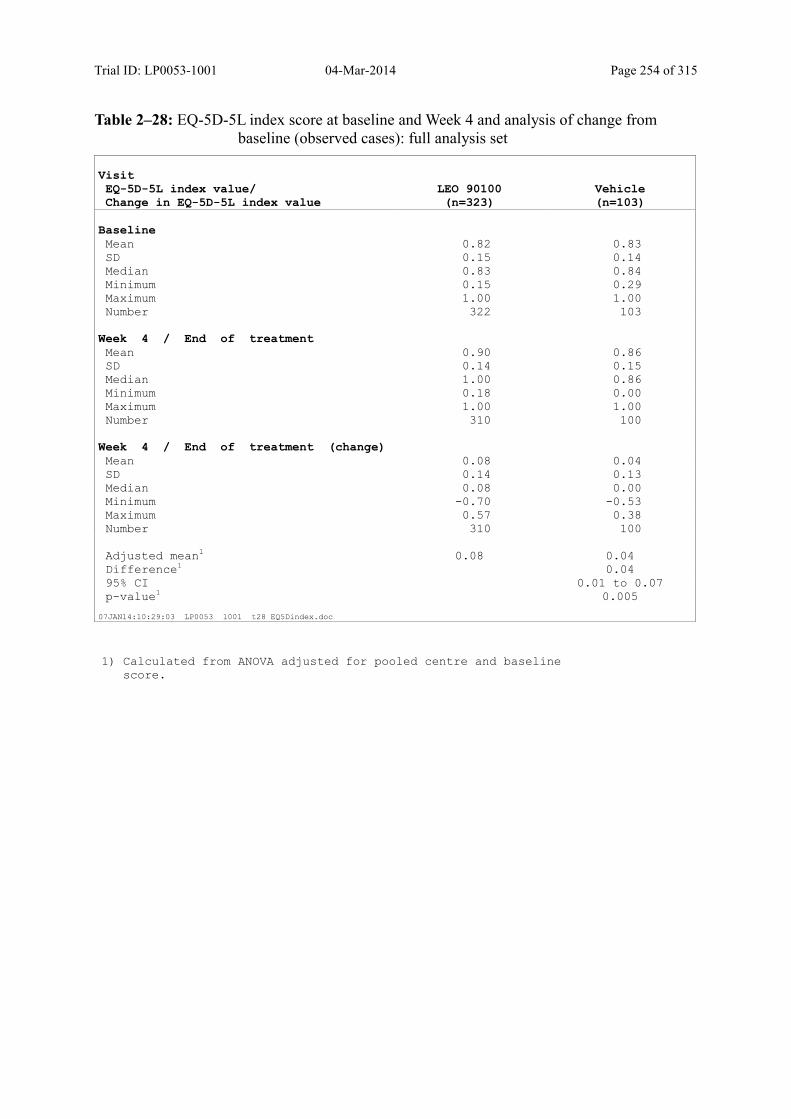
Trial ID: LP0053-1001 04-Mar-2014 Page 254 of 315
Table 2–28: EQ-5D-5L index score at baseline and Week 4 and analysis of change from baseline (observed cases): full analysis set
VisitEQ-5D-5L index value/Change in EQ-5D-5L index value
LEO 90100(n=323)
Vehicle(n=103)
BaselineMean 0.82 0.83 SD 0.15 0.14 Median 0.83 0.84 Minimum 0.15 0.29 Maximum 1.00 1.00 Number 322 103
Week 4 / End of treatmentMean 0.90 0.86 SD 0.14 0.15 Median 1.00 0.86 Minimum 0.18 0.00 Maximum 1.00 1.00 Number 310 100
Week 4 / End of treatment (change)Mean 0.08 0.04 SD 0.14 0.13 Median 0.08 0.00 Minimum -0.70 -0.53 Maximum 0.57 0.38 Number 310 100 Adjusted mean1 0.08 0.04 Difference1 0.04 95% CI 0.01 to 0.07 p-value1 0.005
07JAN14:10:29:03 LP0053 1001 t28 EQ5Dindex.doc
1) Calculated from ANOVA adjusted for pooled centre and baseline score.
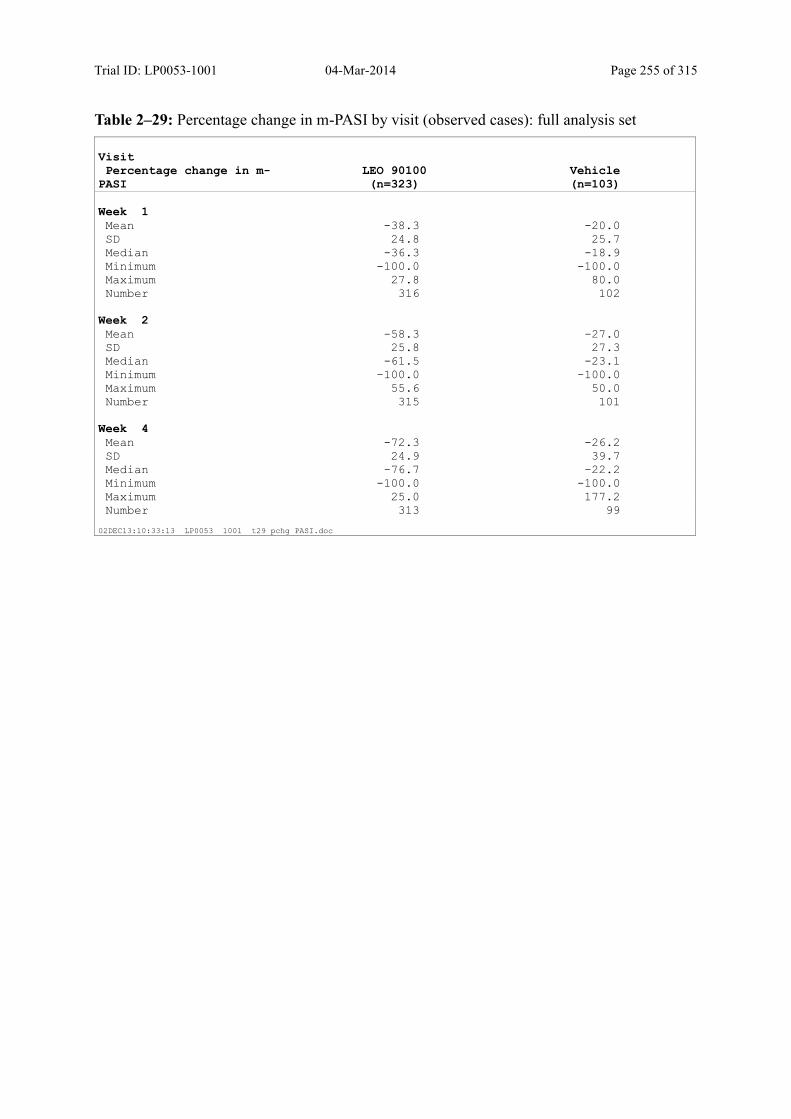
Trial ID: LP0053-1001 04-Mar-2014 Page 255 of 315
Table 2–29: Percentage change in m-PASI by visit (observed cases): full analysis set
VisitPercentage change in m-
PASILEO 90100(n=323)
Vehicle(n=103)
Week 1Mean -38.3 -20.0 SD 24.8 25.7 Median -36.3 -18.9 Minimum -100.0 -100.0 Maximum 27.8 80.0 Number 316 102
Week 2Mean -58.3 -27.0 SD 25.8 27.3 Median -61.5 -23.1 Minimum -100.0 -100.0 Maximum 55.6 50.0 Number 315 101
Week 4Mean -72.3 -26.2 SD 24.9 39.7 Median -76.7 -22.2 Minimum -100.0 -100.0 Maximum 25.0 177.2 Number 313 99
02DEC13:10:33:13 LP0053 1001 t29 pchg PASI.doc
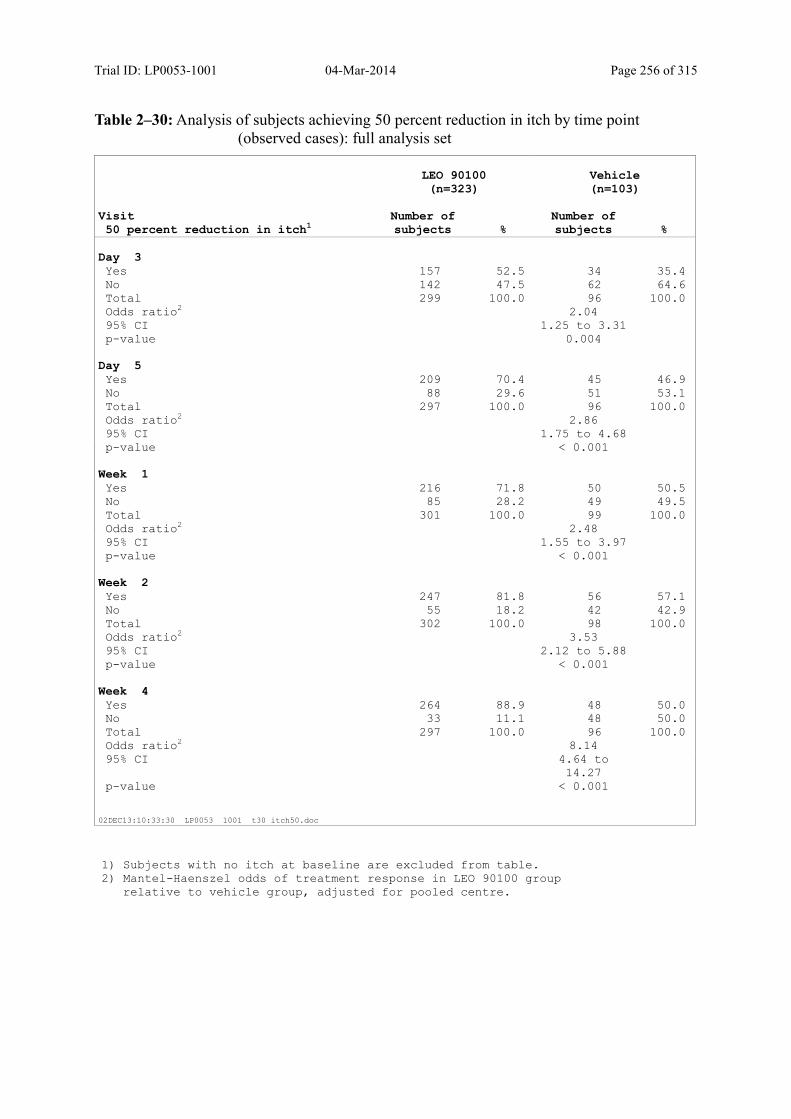
Trial ID: LP0053-1001 04-Mar-2014 Page 256 of 315
Table 2–30: Analysis of subjects achieving 50 percent reduction in itch by time point (observed cases): full analysis set
LEO 90100(n=323)
Vehicle(n=103)
Visit50 percent reduction in itch1
Number of subjects %
Number of subjects %
Day 3Yes 157 52.5 34 35.4 No 142 47.5 62 64.6 Total 299 100.0 96 100.0 Odds ratio2 2.04 95% CI 1.25 to 3.31 p-value 0.004
Day 5Yes 209 70.4 45 46.9 No 88 29.6 51 53.1 Total 297 100.0 96 100.0 Odds ratio2 2.86 95% CI 1.75 to 4.68 p-value < 0.001
Week 1Yes 216 71.8 50 50.5 No 85 28.2 49 49.5 Total 301 100.0 99 100.0 Odds ratio2 2.48 95% CI 1.55 to 3.97 p-value < 0.001
Week 2Yes 247 81.8 56 57.1 No 55 18.2 42 42.9 Total 302 100.0 98 100.0 Odds ratio2 3.53 95% CI 2.12 to 5.88 p-value < 0.001
Week 4Yes 264 88.9 48 50.0 No 33 11.1 48 50.0 Total 297 100.0 96 100.0 Odds ratio2 8.14 95% CI 4.64 to
14.27
p-value < 0.001
02DEC13:10:33:30 LP0053 1001 t30 itch50.doc
1) Subjects with no itch at baseline are excluded from table.2) Mantel-Haenszel odds of treatment response in LEO 90100 group
relative to vehicle group, adjusted for pooled centre.

Trial ID: LP0053-1001 04-Mar-2014 Page 257 of 315
Table 2–31: Analysis of subjects achieving 70 percent reduction in itch by time point (observed cases): full analysis set
LEO 90100(n=323)
Vehicle(n=103)
Visit70 percent reduction in itch1
Number of subjects %
Number of subjects %
Day 3Yes 110 36.8 23 24.0 No 189 63.2 73 76.0 Total 299 100.0 96 100.0 Odds ratio2 1.89 95% CI 1.11 to 3.20 p-value 0.018
Day 5Yes 157 52.9 28 29.2 No 140 47.1 68 70.8 Total 297 100.0 96 100.0 Odds ratio2 2.74 95% CI 1.67 to 4.52 p-value < 0.001
Week 1Yes 181 60.1 31 31.3 No 120 39.9 68 68.7 Total 301 100.0 99 100.0 Odds ratio2 3.18 95% CI 1.97 to 5.15 p-value < 0.001
Week 2Yes 214 70.9 42 42.9 No 88 29.1 56 57.1 Total 302 100.0 98 100.0 Odds ratio2 3.28 95% CI 2.04 to 5.26 p-value < 0.001
Week 4Yes 248 83.5 39 40.6 No 49 16.5 57 59.4 Total 297 100.0 96 100.0 Odds ratio2 7.01 95% CI 4.19 to
11.74
p-value < 0.001
02DEC13:10:33:40 LP0053 1001 t31 itch70.doc
1) Subjects with no itch at baseline are excluded from table.2) Mantel-Haenszel odds of treatment response in LEO 90100 group
relative to vehicle group, adjusted for pooled centre.
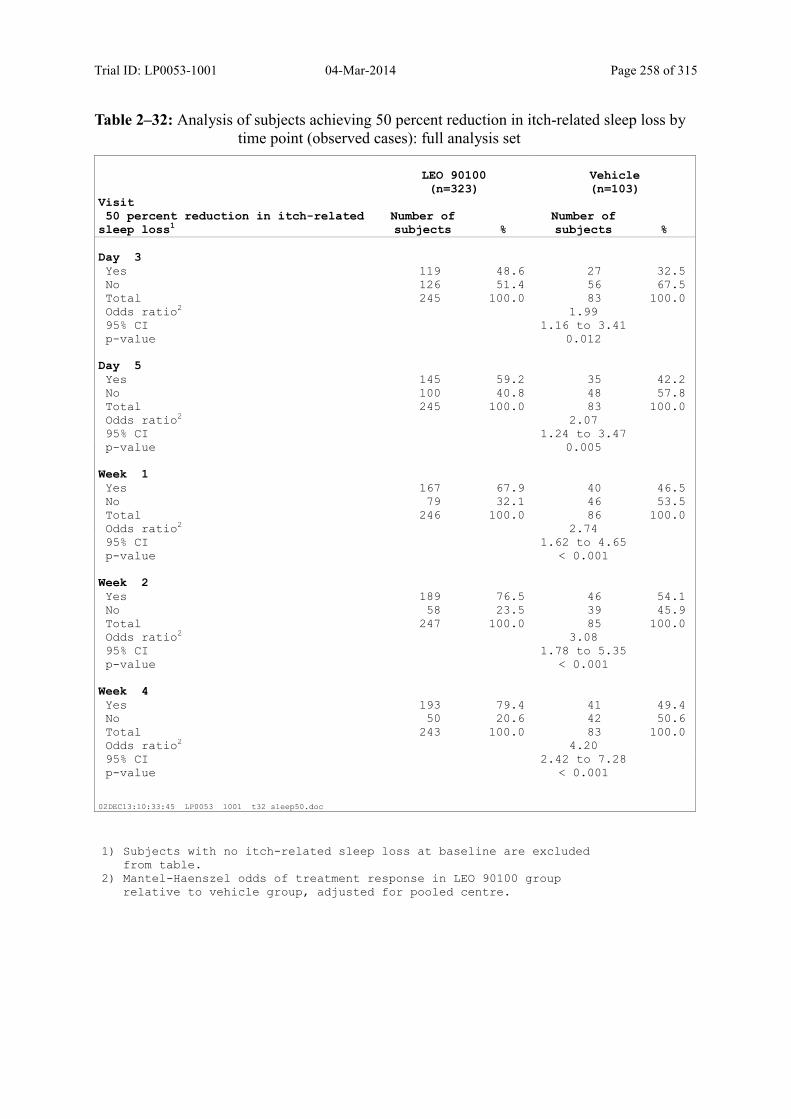
Trial ID: LP0053-1001 04-Mar-2014 Page 258 of 315
Table 2–32: Analysis of subjects achieving 50 percent reduction in itch-related sleep loss by time point (observed cases): full analysis set
LEO 90100(n=323)
Vehicle(n=103)
Visit50 percent reduction in itch-related
sleep loss1Number of subjects %
Number of subjects %
Day 3Yes 119 48.6 27 32.5 No 126 51.4 56 67.5 Total 245 100.0 83 100.0 Odds ratio2 1.99 95% CI 1.16 to 3.41 p-value 0.012
Day 5Yes 145 59.2 35 42.2 No 100 40.8 48 57.8 Total 245 100.0 83 100.0 Odds ratio2 2.07 95% CI 1.24 to 3.47 p-value 0.005
Week 1Yes 167 67.9 40 46.5 No 79 32.1 46 53.5 Total 246 100.0 86 100.0 Odds ratio2 2.74 95% CI 1.62 to 4.65 p-value < 0.001
Week 2Yes 189 76.5 46 54.1 No 58 23.5 39 45.9 Total 247 100.0 85 100.0 Odds ratio2 3.08 95% CI 1.78 to 5.35 p-value < 0.001
Week 4Yes 193 79.4 41 49.4 No 50 20.6 42 50.6 Total 243 100.0 83 100.0 Odds ratio2 4.20 95% CI 2.42 to 7.28 p-value < 0.001
02DEC13:10:33:45 LP0053 1001 t32 sleep50.doc
1) Subjects with no itch-related sleep loss at baseline are excluded from table.2) Mantel-Haenszel odds of treatment response in LEO 90100 group
relative to vehicle group, adjusted for pooled centre.

Trial ID: LP0053-1001 04-Mar-2014 Page 259 of 315
Table 2–33: Analysis of subjects achieving 70 percent reduction in itch-related sleep loss by time point (observed cases): full analysis set
LEO 90100(n=323)
Vehicle(n=103)
Visit70 percent reduction in itch-related
sleep loss1Number of subjects %
Number of subjects %
Day 3Yes 87 35.5 19 22.9 No 158 64.5 64 77.1 Total 245 100.0 83 100.0 Odds ratio2 1.88 95% CI 1.05 to 3.38 p-value 0.035
Day 5Yes 110 44.9 24 28.9 No 135 55.1 59 71.1 Total 245 100.0 83 100.0 Odds ratio2 2.00 95% CI 1.16 to 3.45 p-value 0.011
Week 1Yes 126 51.2 30 34.9 No 120 48.8 56 65.1 Total 246 100.0 86 100.0 Odds ratio2 2.03 95% CI 1.21 to 3.40 p-value 0.007
Week 2Yes 146 59.1 34 40.0 No 101 40.9 51 60.0 Total 247 100.0 85 100.0 Odds ratio2 2.33 95% CI 1.38 to 3.94 p-value 0.002
Week 4Yes 172 70.8 33 39.8 No 71 29.2 50 60.2 Total 243 100.0 83 100.0 Odds ratio2 4.01 95% CI 2.33 to 6.90 p-value < 0.001
02DEC13:10:33:49 LP0053 1001 t33 sleep70.doc
1) Subjects with no itch-related sleep loss at baseline are excluded from table.2) Mantel-Haenszel odds of treatment response in LEO 90100 group
relative to vehicle group, adjusted for pooled centre.
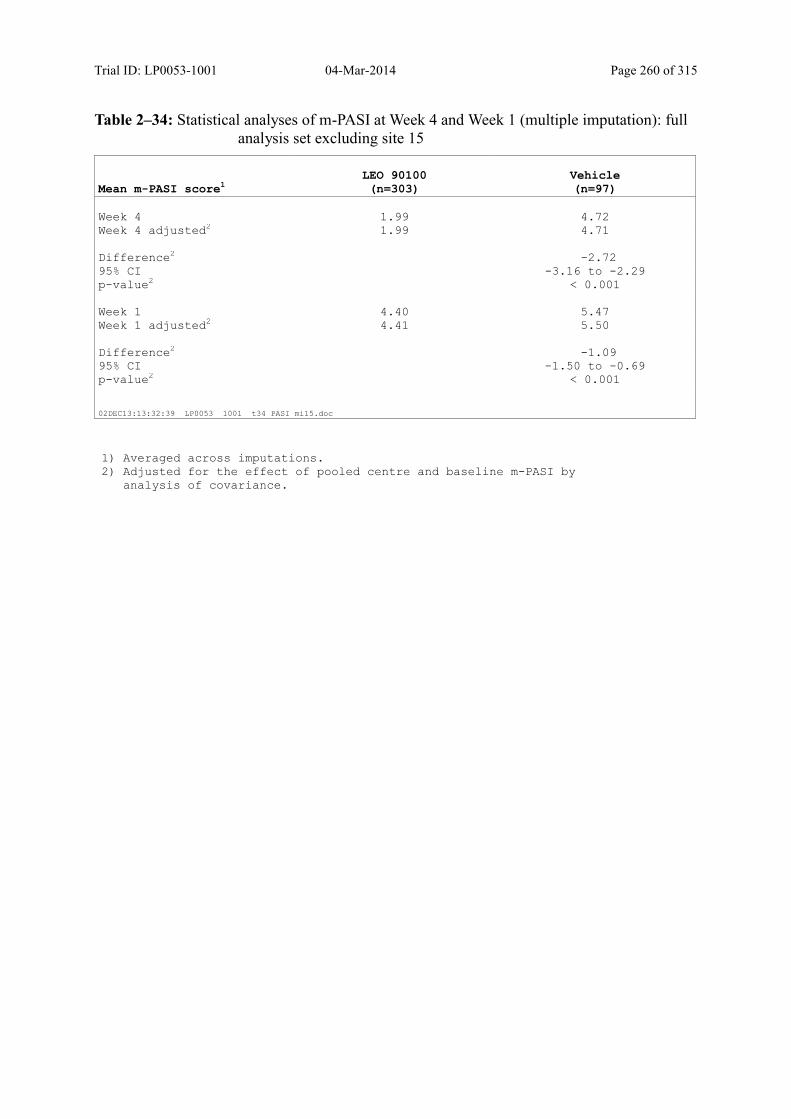
Trial ID: LP0053-1001 04-Mar-2014 Page 260 of 315
Table 2–34: Statistical analyses of m-PASI at Week 4 and Week 1 (multiple imputation): full analysis set excluding site 15
Mean m-PASI score1LEO 90100(n=303)
Vehicle(n=97)
Week 4 1.99 4.72 Week 4 adjusted2 1.99 4.71 Difference2 -2.72 95% CI -3.16 to -2.29 p-value2 < 0.001 Week 1 4.40 5.47 Week 1 adjusted2 4.41 5.50 Difference2 -1.09 95% CI -1.50 to -0.69 p-value2 < 0.001
02DEC13:13:32:39 LP0053 1001 t34 PASI mi15.doc
1) Averaged across imputations.2) Adjusted for the effect of pooled centre and baseline m-PASI by
analysis of covariance.
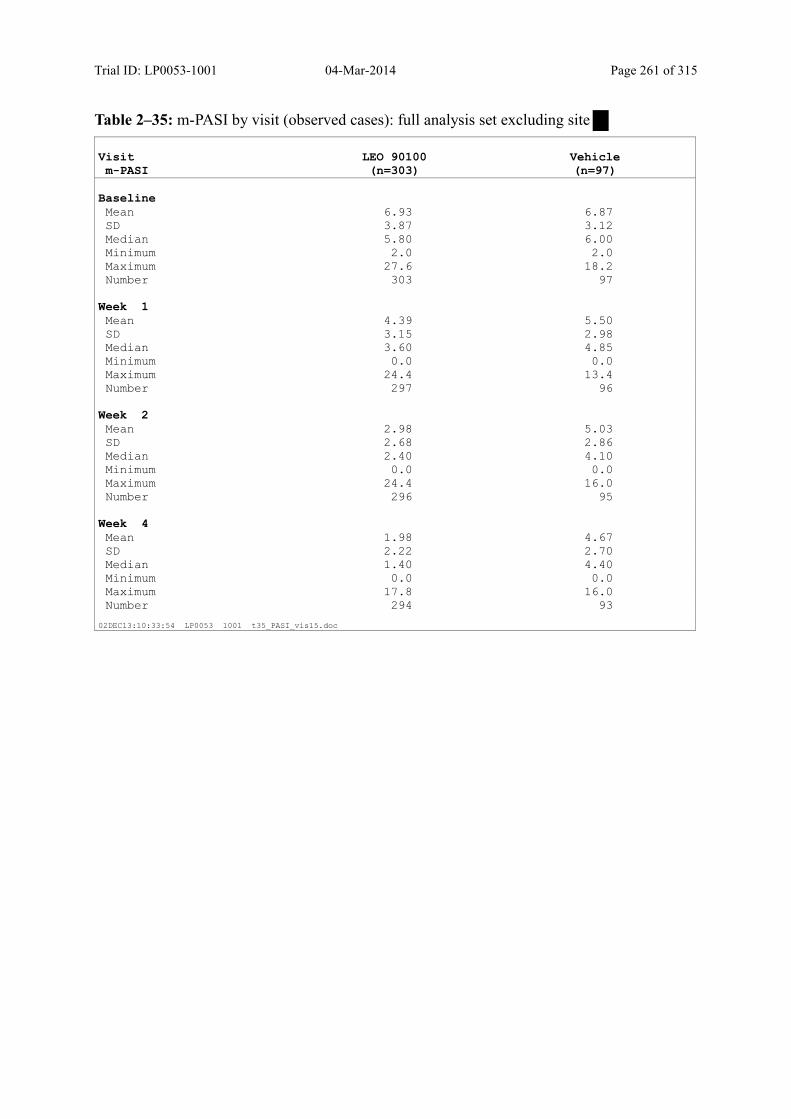
Trial ID: LP0053-1001 04-Mar-2014 Page 261 of 315
Table 2–35: m-PASI by visit (observed cases): full analysis set excluding site
Visitm-PASI
LEO 90100(n=303)
Vehicle(n=97)
BaselineMean 6.93 6.87 SD 3.87 3.12 Median 5.80 6.00 Minimum 2.0 2.0 Maximum 27.6 18.2 Number 303 97
Week 1Mean 4.39 5.50 SD 3.15 2.98 Median 3.60 4.85 Minimum 0.0 0.0 Maximum 24.4 13.4 Number 297 96
Week 2Mean 2.98 5.03 SD 2.68 2.86 Median 2.40 4.10 Minimum 0.0 0.0 Maximum 24.4 16.0 Number 296 95
Week 4Mean 1.98 4.67 SD 2.22 2.70 Median 1.40 4.40 Minimum 0.0 0.0 Maximum 17.8 16.0 Number 294 93
02DEC13:10:33:54 LP0053 1001 t35_PASI_vis15.doc
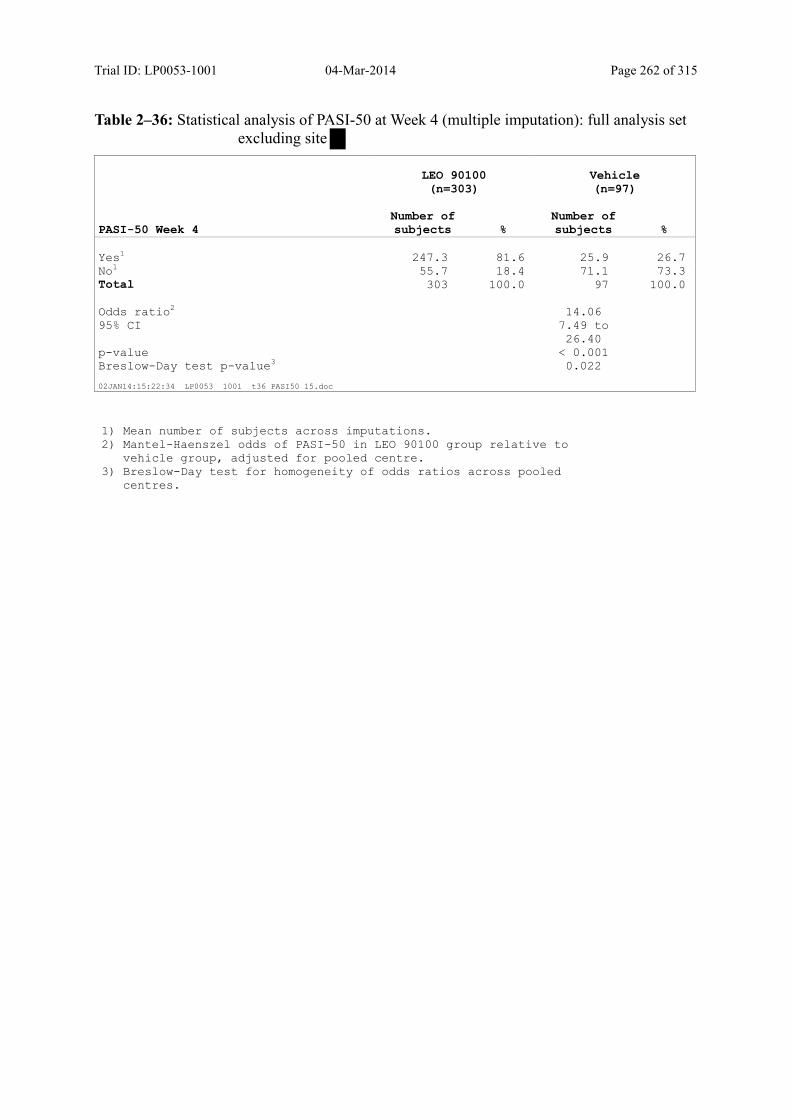
Trial ID: LP0053-1001 04-Mar-2014 Page 262 of 315
Table 2–36: Statistical analysis of PASI-50 at Week 4 (multiple imputation): full analysis set excluding site
LEO 90100(n=303)
Vehicle(n=97)
PASI-50 Week 4Number of subjects %
Number of subjects %
Yes1 247.3 81.6 25.9 26.7 No1 55.7 18.4 71.1 73.3 Total 303 100.0 97 100.0 Odds ratio2 14.06 95% CI 7.49 to
26.40
p-value < 0.001 Breslow-Day test p-value3 0.022
02JAN14:15:22:34 LP0053 1001 t36 PASI50 15.doc
1) Mean number of subjects across imputations.2) Mantel-Haenszel odds of PASI-50 in LEO 90100 group relative to
vehicle group, adjusted for pooled centre.3) Breslow-Day test for homogeneity of odds ratios across pooled
centres.
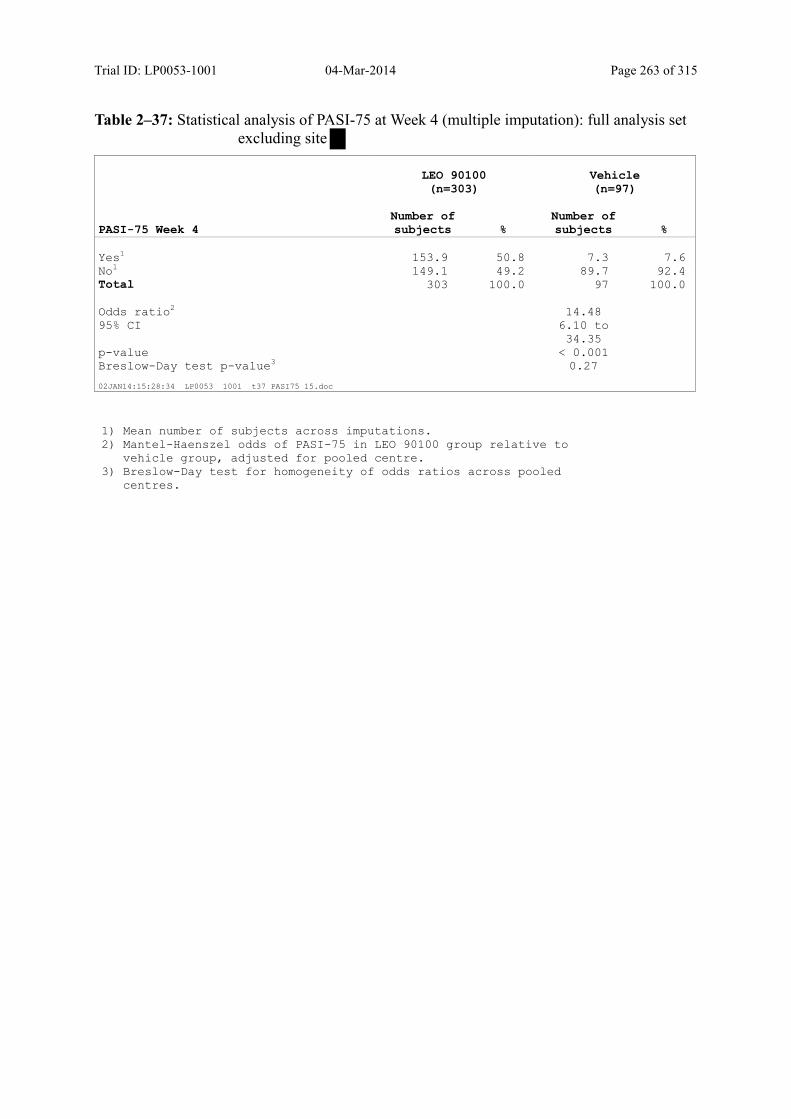
Trial ID: LP0053-1001 04-Mar-2014 Page 263 of 315
Table 2–37: Statistical analysis of PASI-75 at Week 4 (multiple imputation): full analysis set excluding site
LEO 90100(n=303)
Vehicle(n=97)
PASI-75 Week 4Number of subjects %
Number of subjects %
Yes1 153.9 50.8 7.3 7.6 No1 149.1 49.2 89.7 92.4 Total 303 100.0 97 100.0 Odds ratio2 14.48 95% CI 6.10 to
34.35
p-value < 0.001 Breslow-Day test p-value3 0.27
02JAN14:15:28:34 LP0053 1001 t37 PASI75 15.doc
1) Mean number of subjects across imputations.2) Mantel-Haenszel odds of PASI-75 in LEO 90100 group relative to
vehicle group, adjusted for pooled centre.3) Breslow-Day test for homogeneity of odds ratios across pooled
centres.

Trial ID: LP0053-1001 04-Mar-2014 Page 264 of 315
Table 2–38: PASI-50 by visit (observed cases): full analysis set excluding site
LEO 90100(n=303)
Vehicle(n=97)
VisitPASI-50
Number of subjects %
Number of subjects %
Week 1Yes 90 30.3 12 12.5 No 207 69.7 84 87.5 Total 297 100.0 96 100.0
Week 2Yes 190 64.2 18 18.9 No 106 35.8 77 81.1 Total 296 100.0 95 100.0
Week 4Yes 241 82.0 25 26.9 No 53 18.0 68 73.1 Total 294 100.0 93 100.0
02DEC13:10:34:05 LP0053 1001 t38 PASI50 vis15.doc
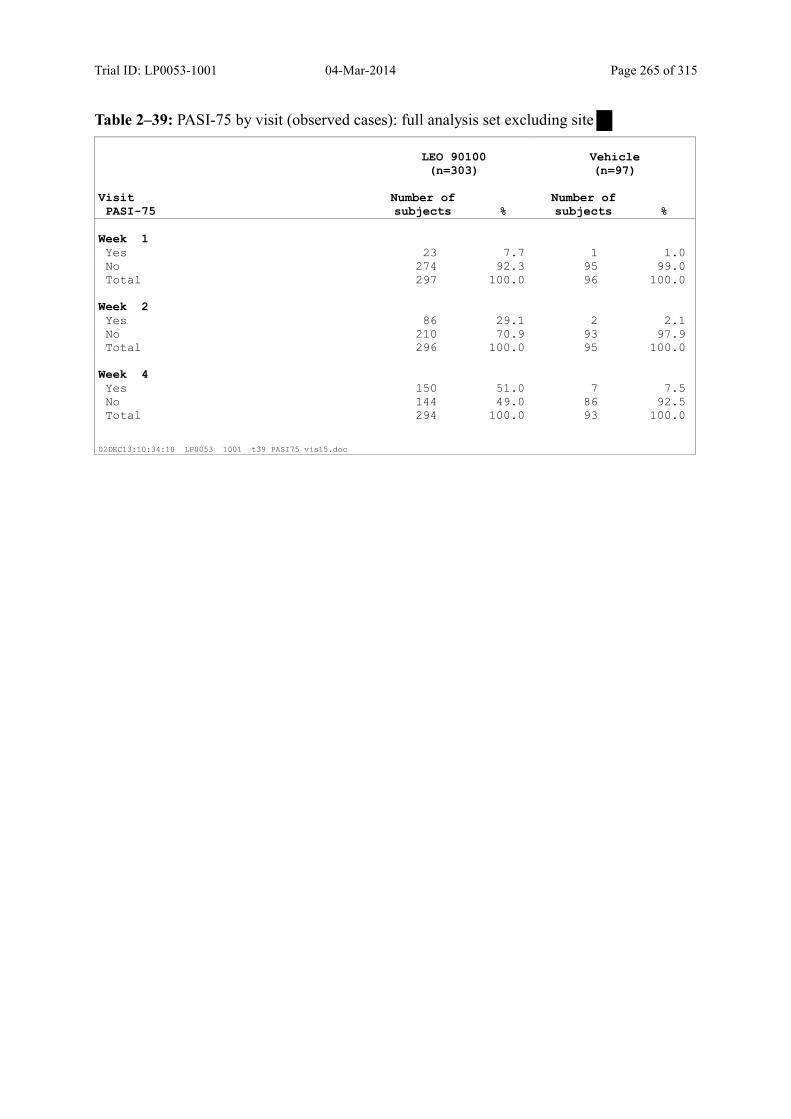
Trial ID: LP0053-1001 04-Mar-2014 Page 265 of 315
Table 2–39: PASI-75 by visit (observed cases): full analysis set excluding site
LEO 90100(n=303)
Vehicle(n=97)
VisitPASI-75
Number of subjects %
Number of subjects %
Week 1Yes 23 7.7 1 1.0 No 274 92.3 95 99.0 Total 297 100.0 96 100.0
Week 2Yes 86 29.1 2 2.1 No 210 70.9 93 97.9 Total 296 100.0 95 100.0
Week 4Yes 150 51.0 7 7.5 No 144 49.0 86 92.5 Total 294 100.0 93 100.0
02DEC13:10:34:10 LP0053 1001 t39 PASI75 vis15.doc

Trial ID: LP0053-1001 04-Mar-2014 Page 266 of 315
Table 2–40: Percentage change in m-PASI by visit (observed cases): full analysis set excluding site
VisitPercentage change in m-
PASILEO 90100(n=303)
Vehicle(n=97)
Week 1Mean -37.3 -19.8 SD 24.2 24.1 Median -35.7 -18.4 Minimum -100.0 -100.0 Maximum 27.8 80.0 Number 297 96
Week 2Mean -57.3 -26.4 SD 25.6 25.9 Median -60.4 -22.4 Minimum -100.0 -100.0 Maximum 55.6 35.6 Number 296 95
Week 4Mean -71.5 -28.1 SD 25.2 33.2 Median -75.3 -22.2 Minimum -100.0 -100.0 Maximum 25.0 73.3 Number 294 93
02DEC13:10:33:59 LP0053 1001 t40 pchg PASI15.doc
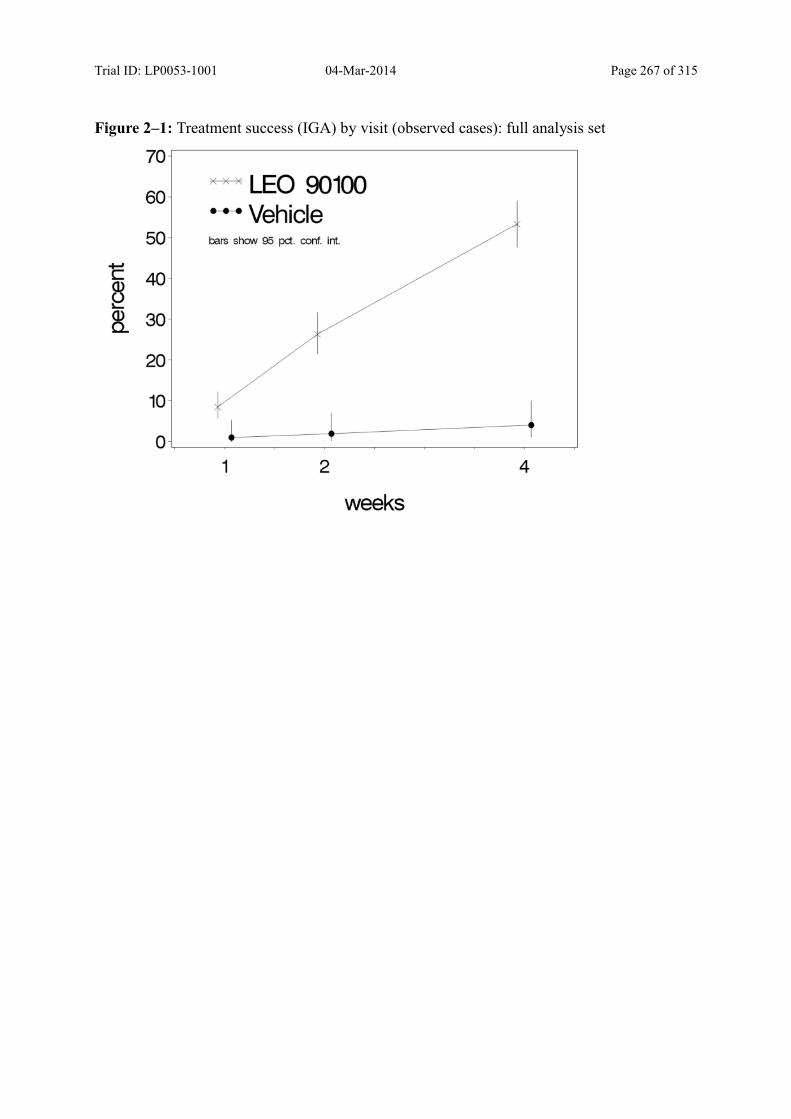
Trial ID: LP0053-1001 04-Mar-2014 Page 267 of 315
Figure 2–1: Treatment success (IGA) by visit (observed cases): full analysis set
70
60 ~ LEO 90100 ------- Vehicle
50 bars show 95 pet. conf. int.
c 40 ~ Q) Q_ 30
20
10
t ~ ~ 0 1 2 4
weeks
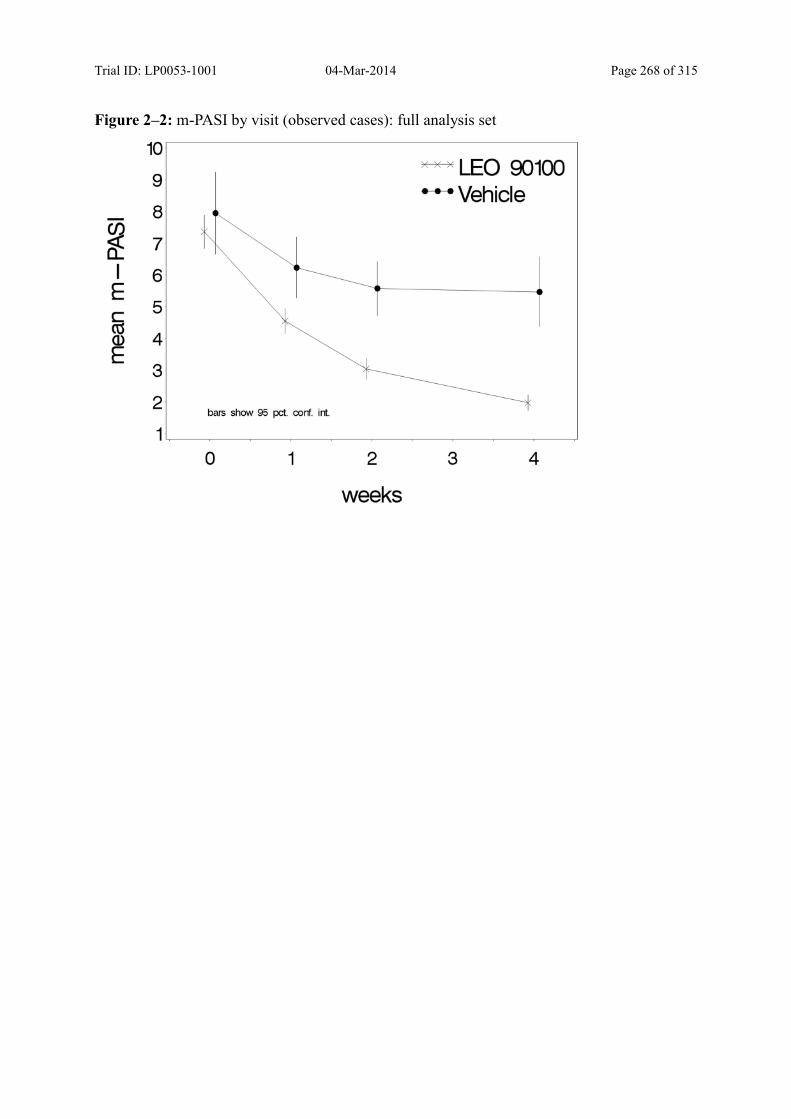
Trial ID: LP0053-1001 04-Mar-2014 Page 268 of 315
Figure 2–2: m-PASI by visit (observed cases): full analysis set
~ a: I E c ccs Q)
E
10
9
8
7
6
5
4
3
2 bars show 95 pet. coni. int.
7HHf LEO 90100 ---vehicle
1 L__o~~~1--~-2----~3-----4~~
weeks
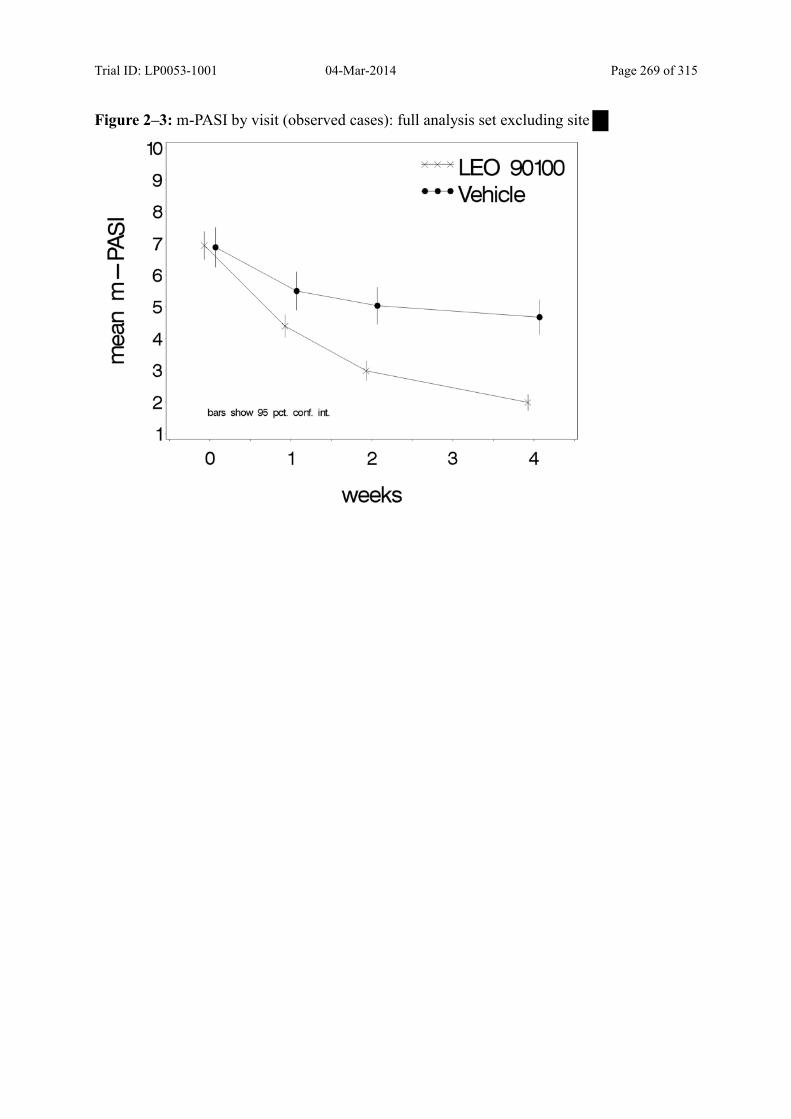
Trial ID: LP0053-1001 04-Mar-2014 Page 269 of 315
Figure 2–3: m-PASI by visit (observed cases): full analysis set excluding site
~ a: I E c ccs Q)
E
10
9
8
7
6
5
4
3
2 bars show 95 pet. coni. int.
7HHf LEO 90100 ---vehicle
1 L__o~~~1--~-2----~3-----4~~
weeks
I
Trial ID: LP0053-1001 04-Mar-2014 Page 270 of 315
3 Tables and Figures, Safety Data
List of Tables
Table 3–1: Duration and extent of exposure to treatment: safety analysis set ....................... 272
Table 3–2: Average weekly amount of study medication used: safety analysis set ............... 273
Table 3–3: Total amount of study medication used: safety analysis set................................. 274
Table 3–4: Overall summary of adverse events: safety analysis set ...................................... 275
Table 3–5: Adverse events by SOC: safety analysis set......................................................... 276
Table 3–6: Adverse events by SOC and preferred term: safety analysis set .......................... 277
Table 3–7: Adverse drug reactions by SOC and preferred term: safety analysis set.............. 280
Table 3–8: Serious adverse events by SOC and preferred term: safety analysis set .............. 281
Table 3–9: Adverse events leading to withdrawal from trial by SOC and preferred term: safety analysis set...................................................................................................... 282
Table 3–10: Adverse events leading to discontinuation of treatment by SOC and preferred term: safety analysis set.................................................................................. 283
Table 3–11: Lesional/perilesional adverse events by SOC and preferred term: safety analysis set ................................................................................................................... 284
Table 3–12: Intensity of adverse events by SOC and preferred term: safety analysis set...... 285
Table 3–13: Relationship to study medication of adverse events by SOC and preferred term: safety analysis set ........................................................................................... 288
Table 3–14: Local safety and tolerability by visit: safety analysis set ................................... 291
Table 3–15: Vital signs by visit: safety analysis set ............................................................... 295
Table 3–16: Change in vital signs from baseline to Week 4: safety analysis set ................... 296
Table 3–17: Summary of albumin-corrected serum calcium and change from baseline: safety analysis set...................................................................................................... 297
Table 3–18: Shift table for albumin-corrected serum calcium: safety analysis set ................ 298
Table 3–19: Shift table for albumin-corrected serum calcium based on LEO defined clinically significant values: safety analysis set............................................................. 299
Trial ID: LP0053-1001 04-Mar-2014 Page 271 of 315
Table 3–20: Summary of urinary calcium:creatinine ratio and change from baseline: safety analysis set...................................................................................................... 300
Table 3–21: Shift table for urinary calcium:creatinine ratio: safety analysis set ................... 301
Table 3–22: Subjects with albumin-corrected serum calcium or calcium: creatinine ratio outside the reference range: safety analysis set.............................................. 302
List of Figures
Figure 3–1: Local safety and tolerability by visit: safety analysis set ................................... 310
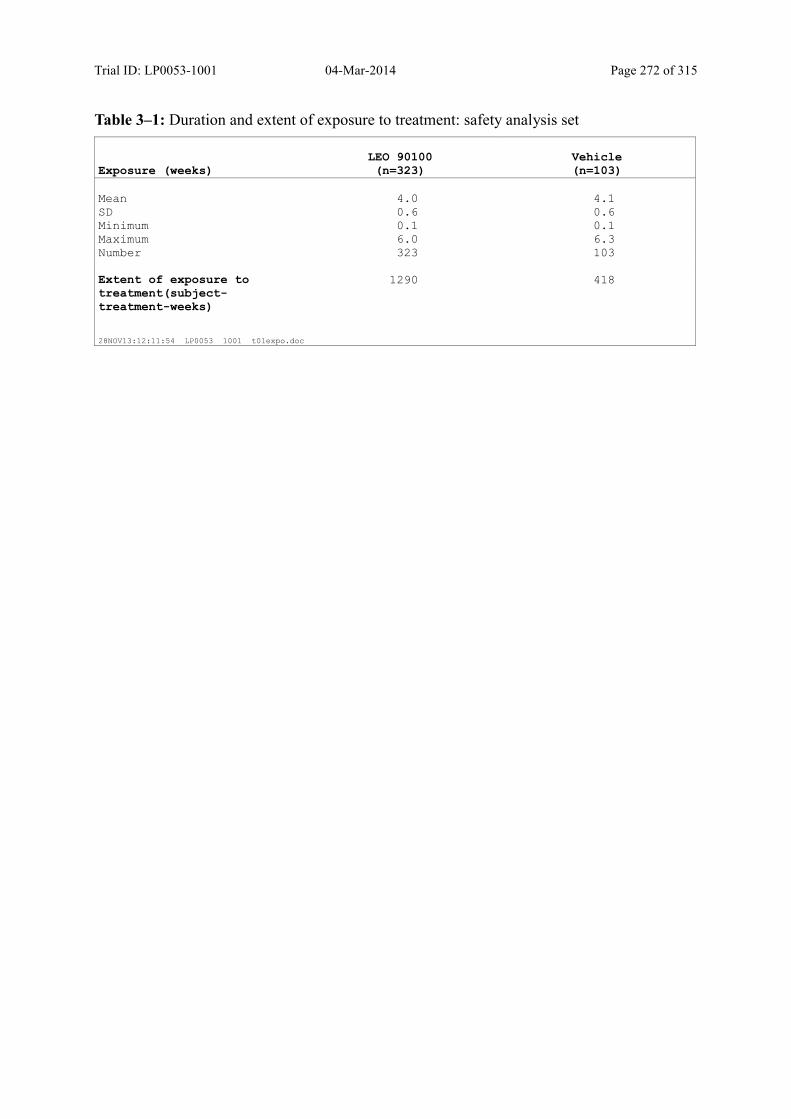
Trial ID: LP0053-1001 04-Mar-2014 Page 272 of 315
Table 3–1: Duration and extent of exposure to treatment: safety analysis set
Exposure (weeks)LEO 90100(n=323)
Vehicle(n=103)
Mean 4.0 4.1 SD 0.6 0.6 Minimum 0.1 0.1 Maximum 6.0 6.3 Number 323 103 Extent of exposure to treatment(subject-treatment-weeks)
1290 418
28NOV13:12:11:54 LP0053 1001 t01expo.doc

Trial ID: LP0053-1001 04-Mar-2014 Page 273 of 315
Table 3–2: Average weekly amount of study medication used: safety analysis set
IntervalAmount (grams per week)
LEO 90100(n=323)
Vehicle(n=103)
Baseline to week 1Mean 29.9 32.9 SD 21.9 23.5 Median 22.5 25.5 Minimum 0.9 2.7 Maximum 97.3 87.7 Number 314 101
Week 1 to week 2Mean 28.5 32.6 SD 23.1 24.1 Median 20.4 23.4 Minimum 0.0 2.0 Maximum 121.5 89.0 Number 309 100
Week 2 to week 4Mean 30.2 32.7 SD 23.0 25.5 Median 24.1 23.7 Minimum 0.0 0.0 Maximum 106.4 100.4 Number 295 97
Total treatment periodMean 29.8 32.1 SD 21.2 23.6 Median 24.3 23.1 Minimum 2.1 2.5 Maximum 89.7 87.7 Number 293 98
28NOV13:14:52:09 LP0053 1001 t02amount.doc
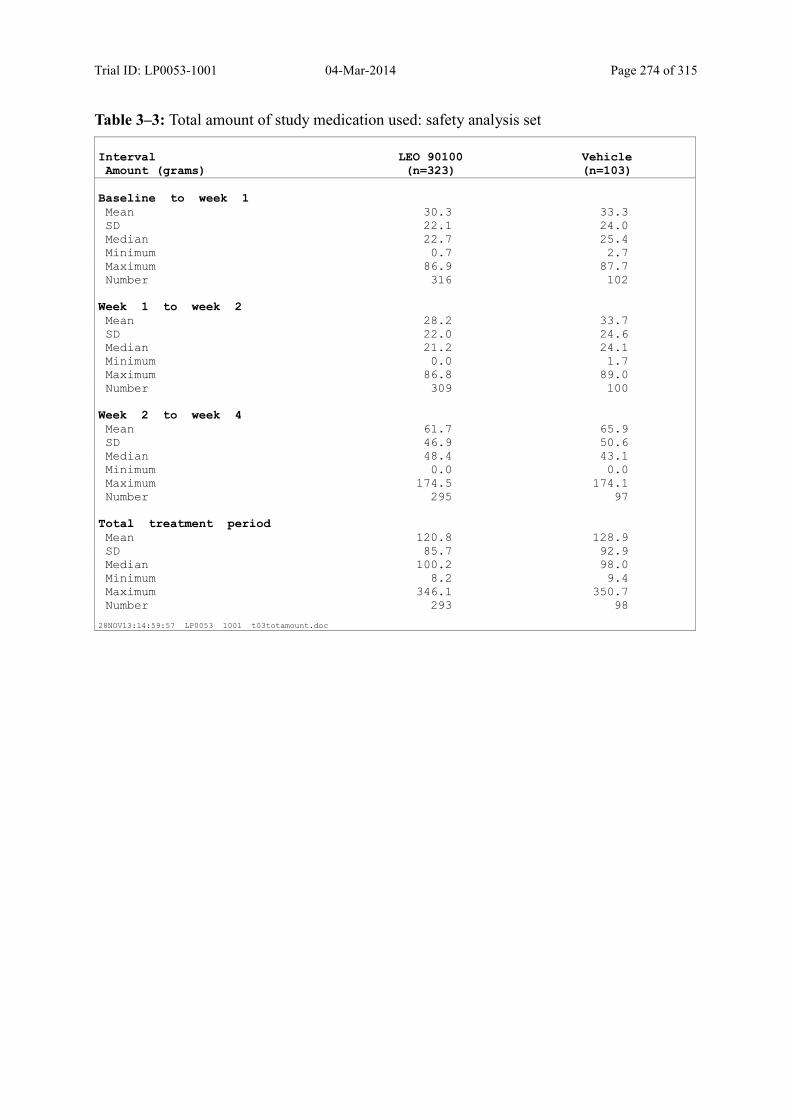
Trial ID: LP0053-1001 04-Mar-2014 Page 274 of 315
Table 3–3: Total amount of study medication used: safety analysis set
IntervalAmount (grams)
LEO 90100(n=323)
Vehicle(n=103)
Baseline to week 1Mean 30.3 33.3 SD 22.1 24.0 Median 22.7 25.4 Minimum 0.7 2.7 Maximum 86.9 87.7 Number 316 102
Week 1 to week 2Mean 28.2 33.7 SD 22.0 24.6 Median 21.2 24.1 Minimum 0.0 1.7 Maximum 86.8 89.0 Number 309 100
Week 2 to week 4Mean 61.7 65.9 SD 46.9 50.6 Median 48.4 43.1 Minimum 0.0 0.0 Maximum 174.5 174.1 Number 295 97
Total treatment periodMean 120.8 128.9 SD 85.7 92.9 Median 100.2 98.0 Minimum 8.2 9.4 Maximum 346.1 350.7 Number 293 98
28NOV13:14:59:57 LP0053 1001 t03totamount.doc
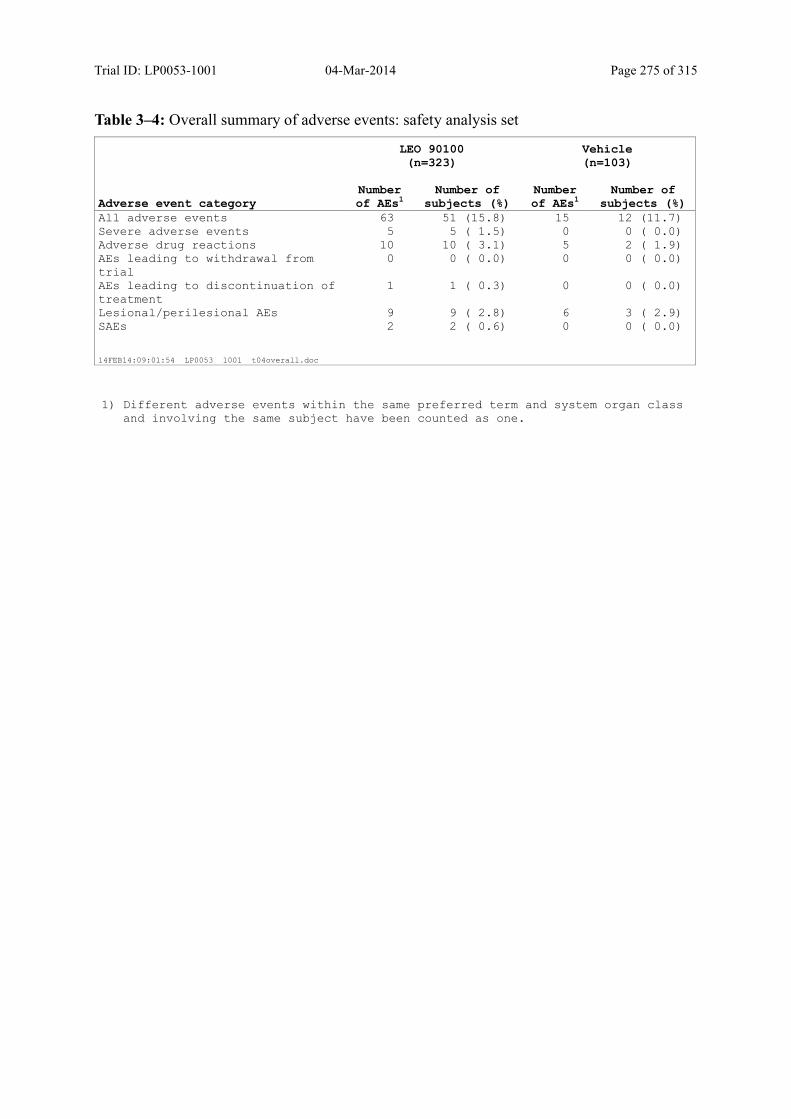
Trial ID: LP0053-1001 04-Mar-2014 Page 275 of 315
Table 3–4: Overall summary of adverse events: safety analysis set
LEO 90100(n=323)
Vehicle(n=103)
Adverse event categoryNumberof AEs1
Number of subjects (%)
Numberof AEs1
Number of subjects (%)
All adverse events 63 51 (15.8) 15 12 (11.7) Severe adverse events 5 5 ( 1.5) 0 0 ( 0.0) Adverse drug reactions 10 10 ( 3.1) 5 2 ( 1.9) AEs leading to withdrawal from trial
0 0 ( 0.0) 0 0 ( 0.0)
AEs leading to discontinuation of treatment
1 1 ( 0.3) 0 0 ( 0.0)
Lesional/perilesional AEs 9 9 ( 2.8) 6 3 ( 2.9) SAEs 2 2 ( 0.6) 0 0 ( 0.0)
14FEB14:09:01:54 LP0053 1001 t04overall.doc
1) Different adverse events within the same preferred term and system organ class and involving the same subject have been counted as one.
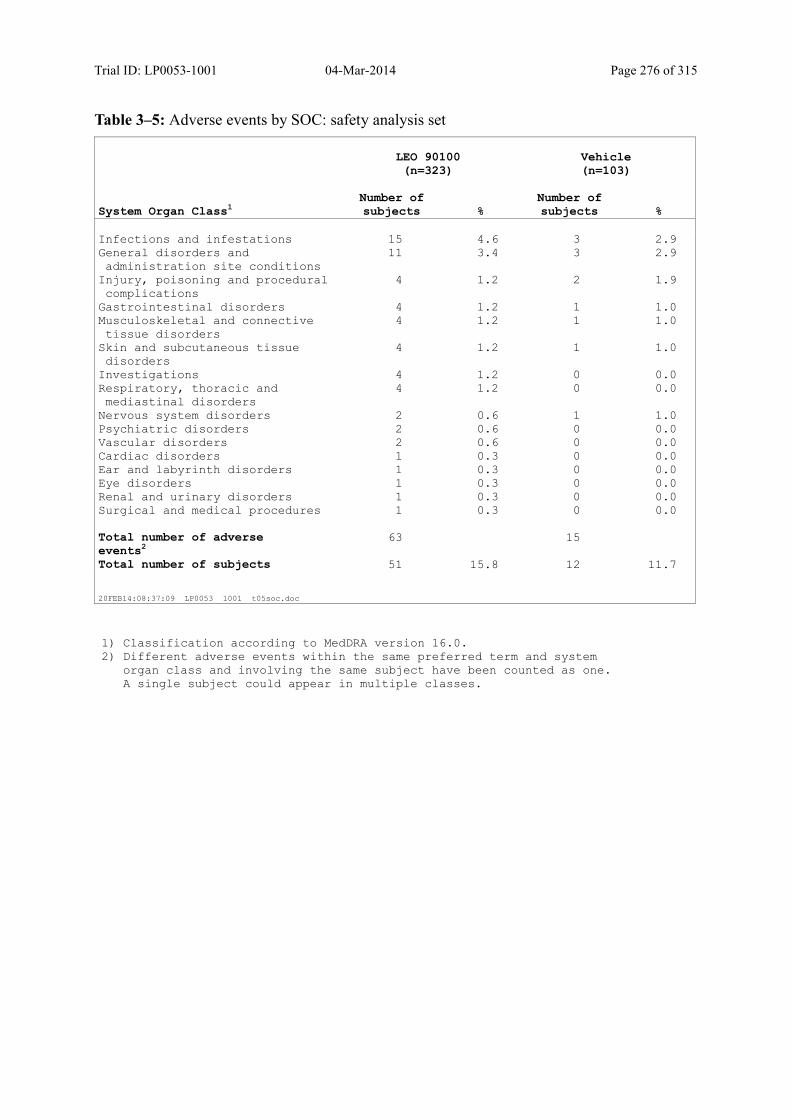
Trial ID: LP0053-1001 04-Mar-2014 Page 276 of 315
Table 3–5: Adverse events by SOC: safety analysis set
LEO 90100(n=323)
Vehicle(n=103)
System Organ Class1Number of subjects %
Number of subjects %
Infections and infestations 15 4.6 3 2.9General disorders andadministration site conditions
11 3.4 3 2.9
Injury, poisoning and proceduralcomplications
4 1.2 2 1.9
Gastrointestinal disorders 4 1.2 1 1.0Musculoskeletal and connectivetissue disorders
4 1.2 1 1.0
Skin and subcutaneous tissuedisorders
4 1.2 1 1.0
Investigations 4 1.2 0 0.0Respiratory, thoracic andmediastinal disorders
4 1.2 0 0.0
Nervous system disorders 2 0.6 1 1.0Psychiatric disorders 2 0.6 0 0.0Vascular disorders 2 0.6 0 0.0Cardiac disorders 1 0.3 0 0.0Ear and labyrinth disorders 1 0.3 0 0.0Eye disorders 1 0.3 0 0.0Renal and urinary disorders 1 0.3 0 0.0Surgical and medical procedures 1 0.3 0 0.0 Total number of adverseevents2
63 15
Total number of subjects 51 15.8 12 11.7
20FEB14:08:37:09 LP0053 1001 t05soc.doc
1) Classification according to MedDRA version 16.0.2) Different adverse events within the same preferred term and system
organ class and involving the same subject have been counted as one. A single subject could appear in multiple classes.
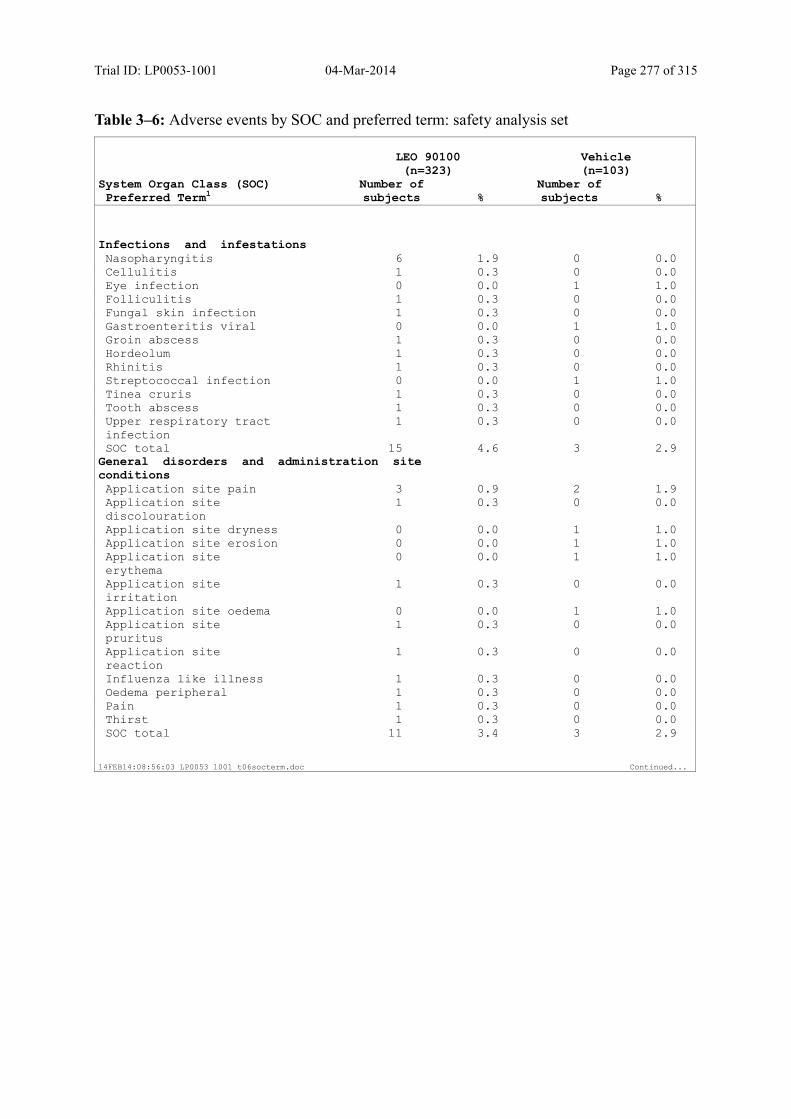
Trial ID: LP0053-1001 04-Mar-2014 Page 277 of 315
Table 3–6: Adverse events by SOC and preferred term: safety analysis set
LEO 90100(n=323)
Vehicle(n=103)
System Organ Class (SOC)Preferred Term1
Number of subjects %
Number of subjects %
Infections and infestationsNasopharyngitis 6 1.9 0 0.0Cellulitis 1 0.3 0 0.0Eye infection 0 0.0 1 1.0Folliculitis 1 0.3 0 0.0Fungal skin infection 1 0.3 0 0.0Gastroenteritis viral 0 0.0 1 1.0Groin abscess 1 0.3 0 0.0Hordeolum 1 0.3 0 0.0Rhinitis 1 0.3 0 0.0Streptococcal infection 0 0.0 1 1.0Tinea cruris 1 0.3 0 0.0Tooth abscess 1 0.3 0 0.0Upper respiratory tractinfection
1 0.3 0 0.0
SOC total 15 4.6 3 2.9General disorders and administration siteconditionsApplication site pain 3 0.9 2 1.9Application sitediscolouration
1 0.3 0 0.0
Application site dryness 0 0.0 1 1.0Application site erosion 0 0.0 1 1.0Application siteerythema
0 0.0 1 1.0
Application siteirritation
1 0.3 0 0.0
Application site oedema 0 0.0 1 1.0Application sitepruritus
1 0.3 0 0.0
Application sitereaction
1 0.3 0 0.0
Influenza like illness 1 0.3 0 0.0Oedema peripheral 1 0.3 0 0.0Pain 1 0.3 0 0.0Thirst 1 0.3 0 0.0SOC total 11 3.4 3 2.9
14FEB14:08:56:03 LP0053 1001 t06socterm.doc Continued...
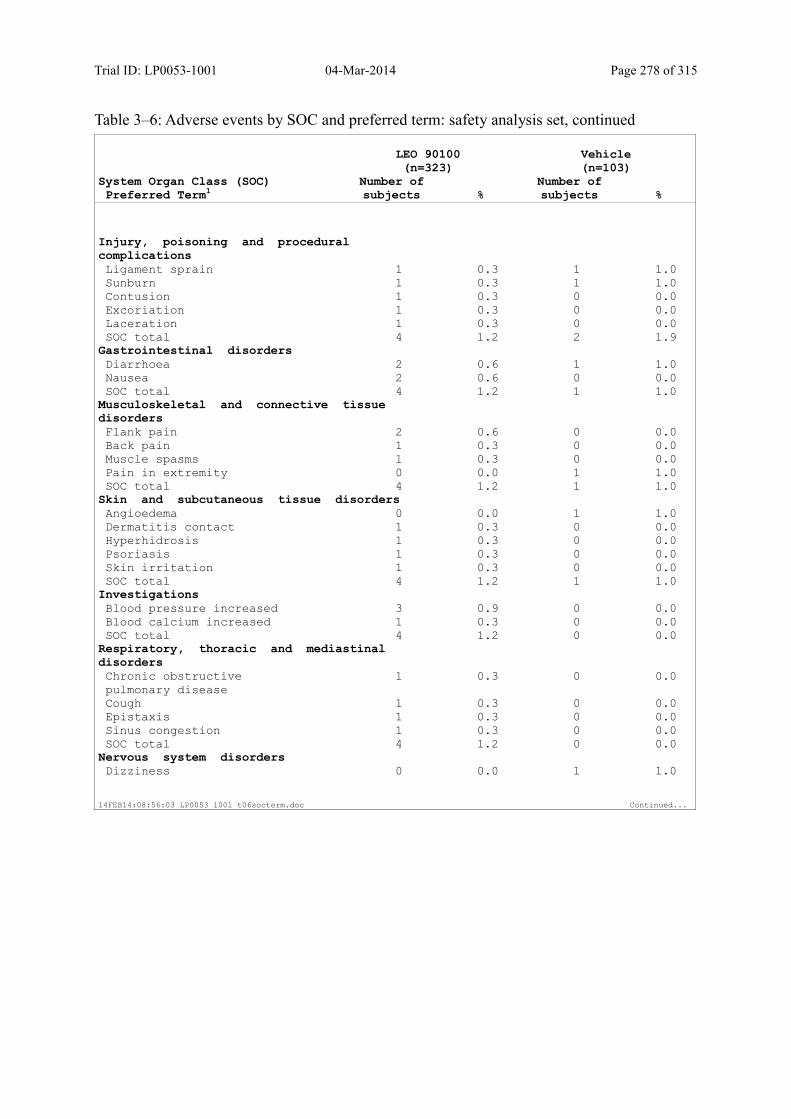
Trial ID: LP0053-1001 04-Mar-2014 Page 278 of 315
Table 3–6: Adverse events by SOC and preferred term: safety analysis set, continued
LEO 90100(n=323)
Vehicle(n=103)
System Organ Class (SOC)Preferred Term1
Number of subjects %
Number of subjects %
Injury, poisoning and proceduralcomplicationsLigament sprain 1 0.3 1 1.0Sunburn 1 0.3 1 1.0Contusion 1 0.3 0 0.0Excoriation 1 0.3 0 0.0Laceration 1 0.3 0 0.0SOC total 4 1.2 2 1.9
Gastrointestinal disordersDiarrhoea 2 0.6 1 1.0Nausea 2 0.6 0 0.0SOC total 4 1.2 1 1.0
Musculoskeletal and connective tissuedisordersFlank pain 2 0.6 0 0.0Back pain 1 0.3 0 0.0Muscle spasms 1 0.3 0 0.0Pain in extremity 0 0.0 1 1.0SOC total 4 1.2 1 1.0
Skin and subcutaneous tissue disordersAngioedema 0 0.0 1 1.0Dermatitis contact 1 0.3 0 0.0Hyperhidrosis 1 0.3 0 0.0Psoriasis 1 0.3 0 0.0Skin irritation 1 0.3 0 0.0SOC total 4 1.2 1 1.0
InvestigationsBlood pressure increased 3 0.9 0 0.0Blood calcium increased 1 0.3 0 0.0SOC total 4 1.2 0 0.0
Respiratory, thoracic and mediastinaldisordersChronic obstructivepulmonary disease
1 0.3 0 0.0
Cough 1 0.3 0 0.0Epistaxis 1 0.3 0 0.0Sinus congestion 1 0.3 0 0.0SOC total 4 1.2 0 0.0
Nervous system disordersDizziness 0 0.0 1 1.0
14FEB14:08:56:03 LP0053 1001 t06socterm.doc Continued...
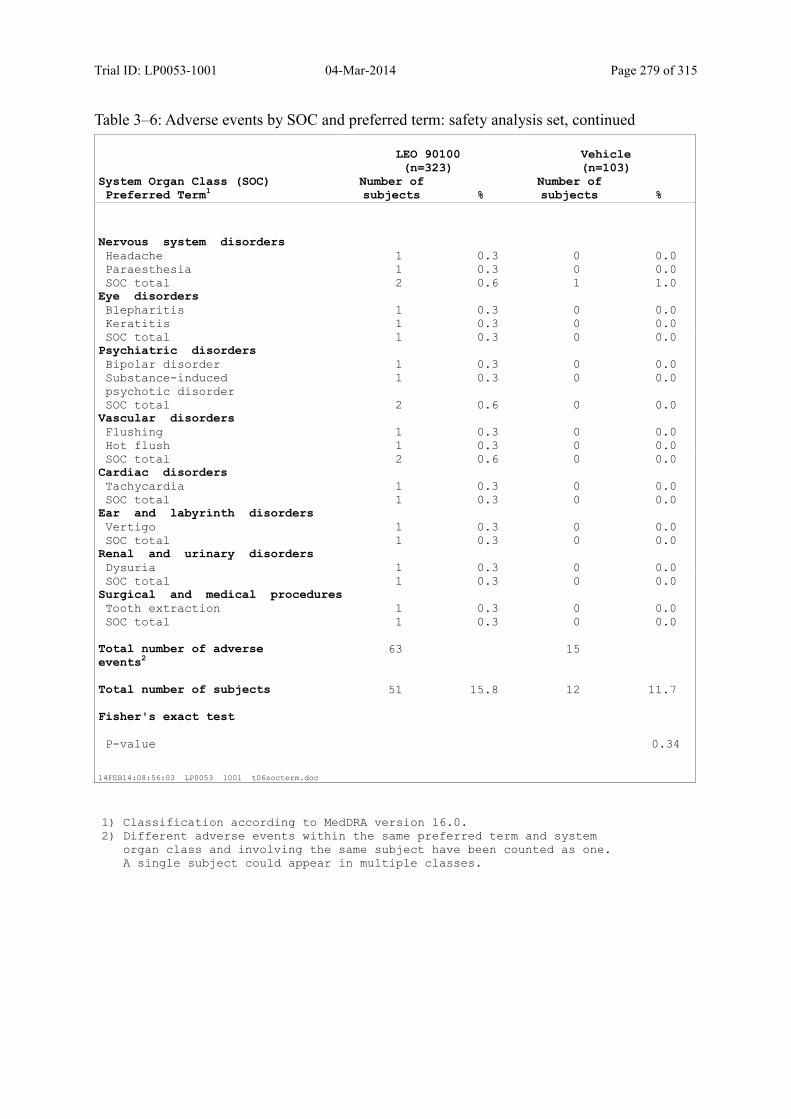
Trial ID: LP0053-1001 04-Mar-2014 Page 279 of 315
Table 3–6: Adverse events by SOC and preferred term: safety analysis set, continued
LEO 90100(n=323)
Vehicle(n=103)
System Organ Class (SOC)Preferred Term1
Number of subjects %
Number of subjects %
Nervous system disordersHeadache 1 0.3 0 0.0Paraesthesia 1 0.3 0 0.0SOC total 2 0.6 1 1.0
Eye disordersBlepharitis 1 0.3 0 0.0Keratitis 1 0.3 0 0.0SOC total 1 0.3 0 0.0
Psychiatric disordersBipolar disorder 1 0.3 0 0.0Substance-inducedpsychotic disorder
1 0.3 0 0.0
SOC total 2 0.6 0 0.0Vascular disordersFlushing 1 0.3 0 0.0Hot flush 1 0.3 0 0.0SOC total 2 0.6 0 0.0
Cardiac disordersTachycardia 1 0.3 0 0.0SOC total 1 0.3 0 0.0
Ear and labyrinth disordersVertigo 1 0.3 0 0.0SOC total 1 0.3 0 0.0
Renal and urinary disordersDysuria 1 0.3 0 0.0SOC total 1 0.3 0 0.0
Surgical and medical proceduresTooth extraction 1 0.3 0 0.0SOC total 1 0.3 0 0.0
Total number of adverseevents2
63 15
Total number of subjects 51 15.8 12 11.7
Fisher's exact test
P-value 0.34
14FEB14:08:56:03 LP0053 1001 t06socterm.doc
1) Classification according to MedDRA version 16.0.2) Different adverse events within the same preferred term and system
organ class and involving the same subject have been counted as one. A single subject could appear in multiple classes.
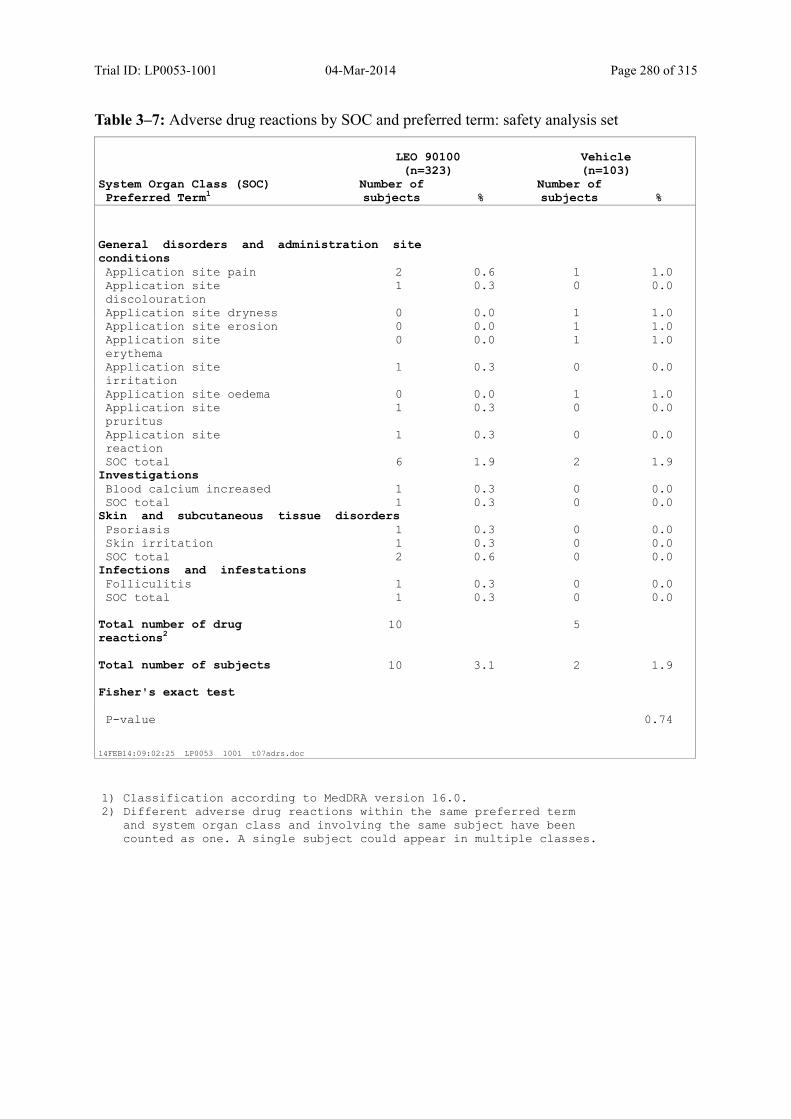
Trial ID: LP0053-1001 04-Mar-2014 Page 280 of 315
Table 3–7: Adverse drug reactions by SOC and preferred term: safety analysis set
LEO 90100(n=323)
Vehicle(n=103)
System Organ Class (SOC)Preferred Term1
Number of subjects %
Number of subjects %
General disorders and administration siteconditionsApplication site pain 2 0.6 1 1.0Application sitediscolouration
1 0.3 0 0.0
Application site dryness 0 0.0 1 1.0Application site erosion 0 0.0 1 1.0Application siteerythema
0 0.0 1 1.0
Application siteirritation
1 0.3 0 0.0
Application site oedema 0 0.0 1 1.0Application sitepruritus
1 0.3 0 0.0
Application sitereaction
1 0.3 0 0.0
SOC total 6 1.9 2 1.9InvestigationsBlood calcium increased 1 0.3 0 0.0SOC total 1 0.3 0 0.0
Skin and subcutaneous tissue disordersPsoriasis 1 0.3 0 0.0Skin irritation 1 0.3 0 0.0SOC total 2 0.6 0 0.0
Infections and infestationsFolliculitis 1 0.3 0 0.0SOC total 1 0.3 0 0.0
Total number of drugreactions2
10 5
Total number of subjects 10 3.1 2 1.9
Fisher's exact test
P-value 0.74
14FEB14:09:02:25 LP0053 1001 t07adrs.doc
1) Classification according to MedDRA version 16.0.2) Different adverse drug reactions within the same preferred term
and system organ class and involving the same subject have been counted as one. A single subject could appear in multiple classes.
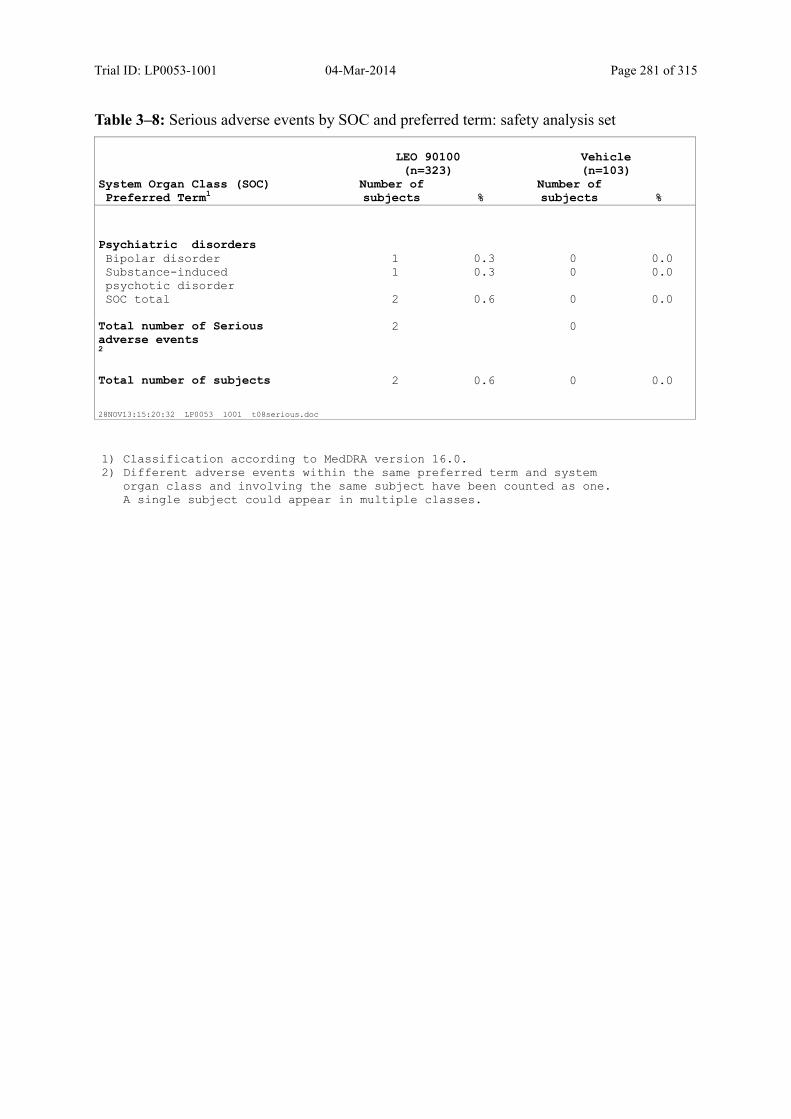
Trial ID: LP0053-1001 04-Mar-2014 Page 281 of 315
Table 3–8: Serious adverse events by SOC and preferred term: safety analysis set
LEO 90100(n=323)
Vehicle(n=103)
System Organ Class (SOC)Preferred Term1
Number of subjects %
Number of subjects %
Psychiatric disordersBipolar disorder 1 0.3 0 0.0Substance-inducedpsychotic disorder
1 0.3 0 0.0
SOC total 2 0.6 0 0.0
Total number of Seriousadverse events2
2 0
Total number of subjects 2 0.6 0 0.0
28NOV13:15:20:32 LP0053 1001 t08serious.doc
1) Classification according to MedDRA version 16.0.2) Different adverse events within the same preferred term and system
organ class and involving the same subject have been counted as one. A single subject could appear in multiple classes.

Trial ID: LP0053-1001 04-Mar-2014 Page 282 of 315
Table 3–9: Adverse events leading to withdrawal from trial by SOC and preferred term: safety analysis set
No data for this table.
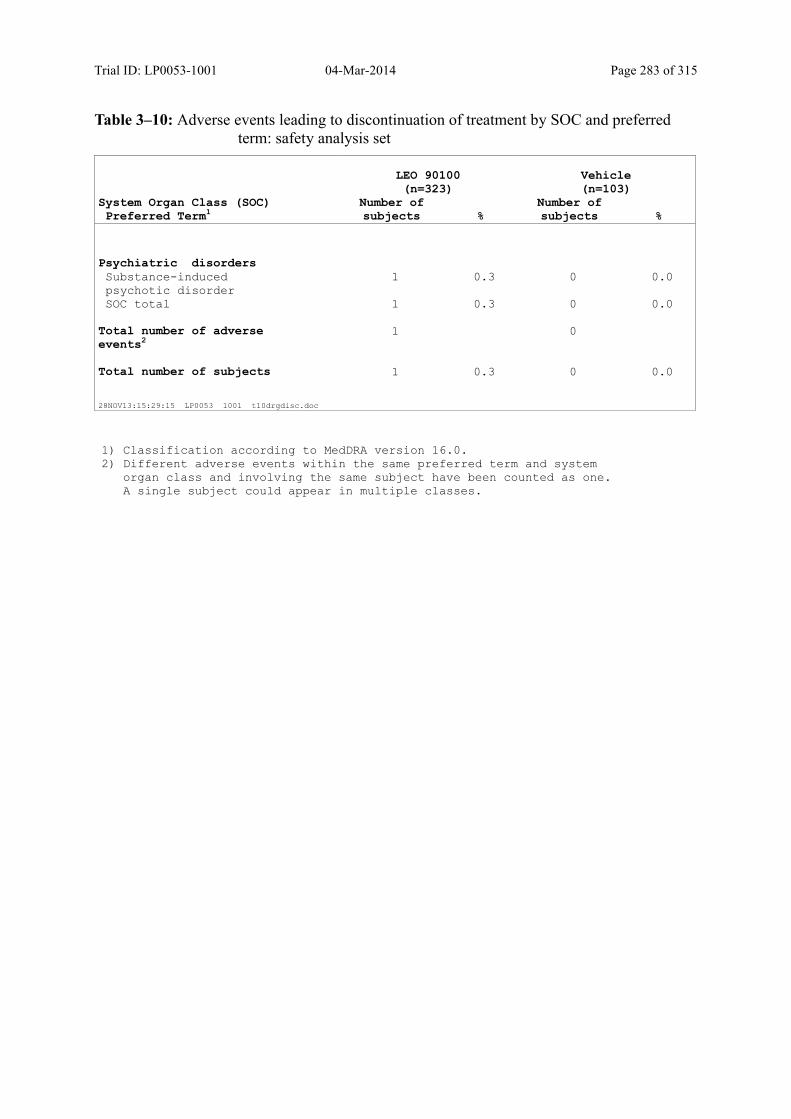
Trial ID: LP0053-1001 04-Mar-2014 Page 283 of 315
Table 3–10: Adverse events leading to discontinuation of treatment by SOC and preferred term: safety analysis set
LEO 90100(n=323)
Vehicle(n=103)
System Organ Class (SOC)Preferred Term1
Number of subjects %
Number of subjects %
Psychiatric disordersSubstance-inducedpsychotic disorder
1 0.3 0 0.0
SOC total 1 0.3 0 0.0
Total number of adverseevents2
1 0
Total number of subjects 1 0.3 0 0.0
28NOV13:15:29:15 LP0053 1001 t10drgdisc.doc
1) Classification according to MedDRA version 16.0.2) Different adverse events within the same preferred term and system
organ class and involving the same subject have been counted as one. A single subject could appear in multiple classes.
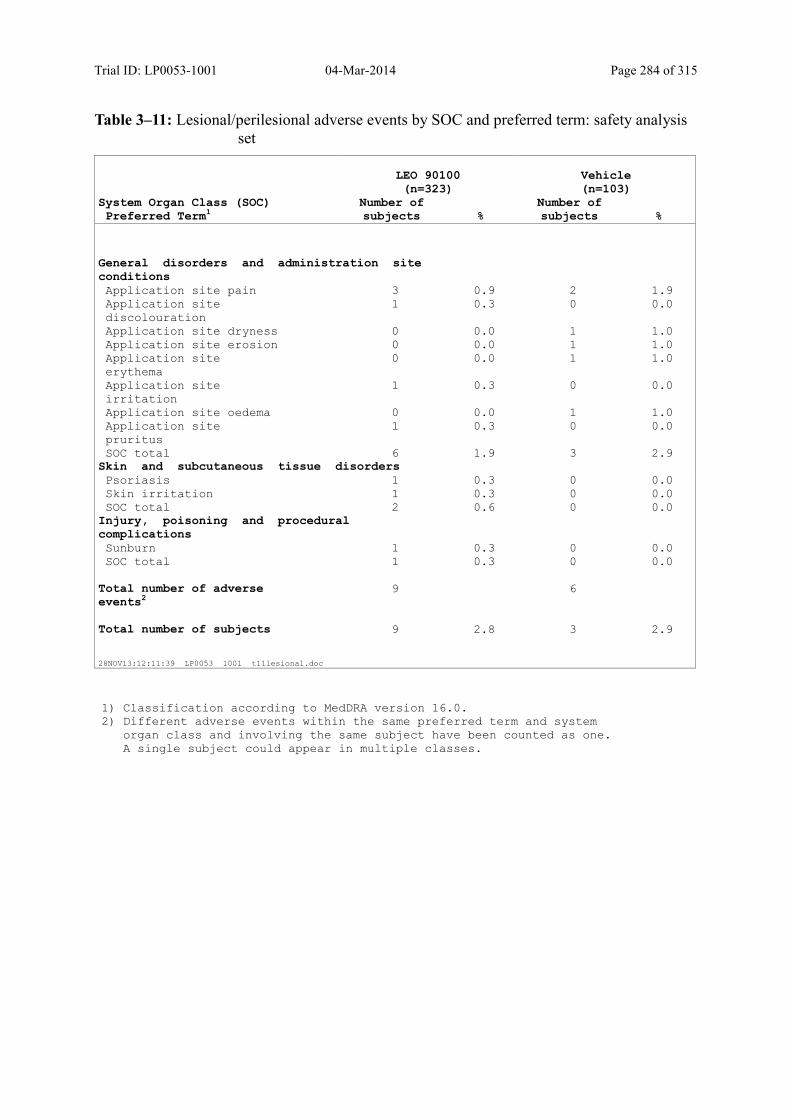
Trial ID: LP0053-1001 04-Mar-2014 Page 284 of 315
Table 3–11: Lesional/perilesional adverse events by SOC and preferred term: safety analysis set
LEO 90100(n=323)
Vehicle(n=103)
System Organ Class (SOC)Preferred Term1
Number of subjects %
Number of subjects %
General disorders and administration siteconditionsApplication site pain 3 0.9 2 1.9Application sitediscolouration
1 0.3 0 0.0
Application site dryness 0 0.0 1 1.0Application site erosion 0 0.0 1 1.0Application siteerythema
0 0.0 1 1.0
Application siteirritation
1 0.3 0 0.0
Application site oedema 0 0.0 1 1.0Application sitepruritus
1 0.3 0 0.0
SOC total 6 1.9 3 2.9Skin and subcutaneous tissue disordersPsoriasis 1 0.3 0 0.0Skin irritation 1 0.3 0 0.0SOC total 2 0.6 0 0.0
Injury, poisoning and proceduralcomplicationsSunburn 1 0.3 0 0.0SOC total 1 0.3 0 0.0
Total number of adverseevents2
9 6
Total number of subjects 9 2.8 3 2.9
28NOV13:12:11:39 LP0053 1001 t11lesional.doc
1) Classification according to MedDRA version 16.0.2) Different adverse events within the same preferred term and system
organ class and involving the same subject have been counted as one. A single subject could appear in multiple classes.
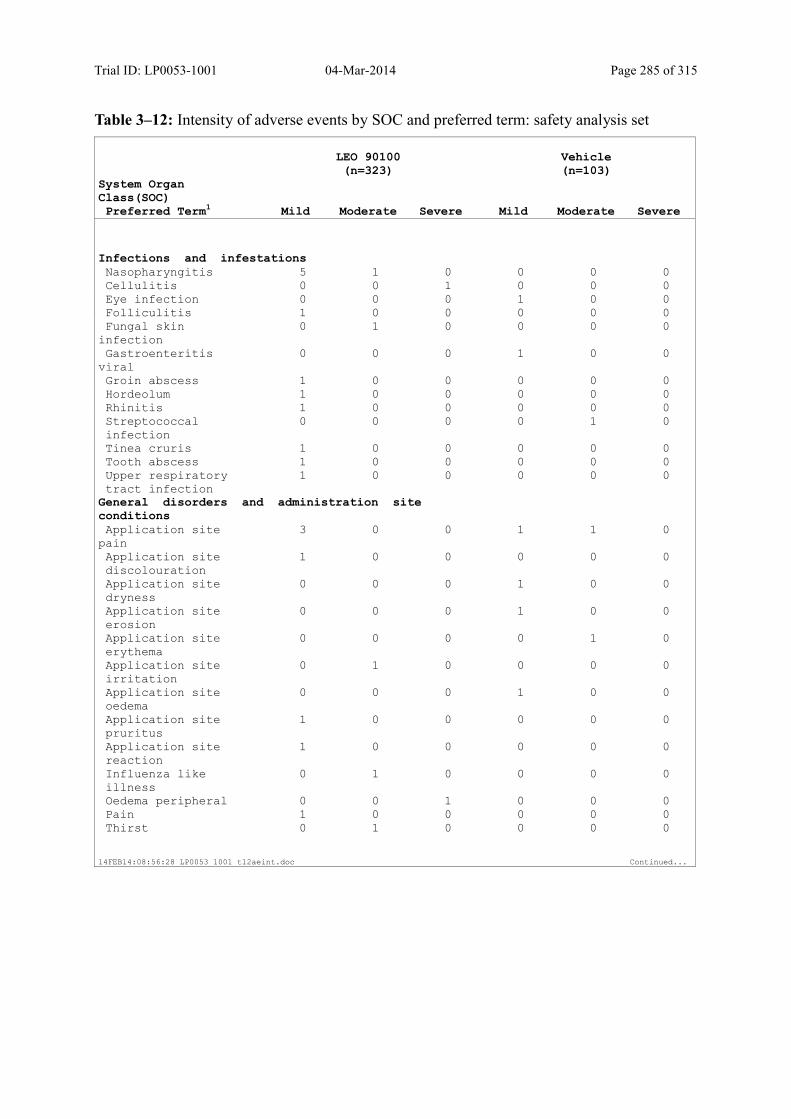
Trial ID: LP0053-1001 04-Mar-2014 Page 285 of 315
Table 3–12: Intensity of adverse events by SOC and preferred term: safety analysis set
LEO 90100(n=323)
Vehicle(n=103)
System Organ Class(SOC)Preferred Term1 Mild Moderate Severe Mild Moderate Severe
Infections and infestationsNasopharyngitis 5 1 0 0 0 0Cellulitis 0 0 1 0 0 0Eye infection 0 0 0 1 0 0Folliculitis 1 0 0 0 0 0Fungal skin
infection 0 1 0 0 0 0
Gastroenteritis viral
0 0 0 1 0 0
Groin abscess 1 0 0 0 0 0Hordeolum 1 0 0 0 0 0Rhinitis 1 0 0 0 0 0Streptococcalinfection
0 0 0 0 1 0
Tinea cruris 1 0 0 0 0 0Tooth abscess 1 0 0 0 0 0Upper respiratorytract infection
1 0 0 0 0 0
General disorders and administration siteconditionsApplication site
pain 3 0 0 1 1 0
Application sitediscolouration
1 0 0 0 0 0
Application sitedryness
0 0 0 1 0 0
Application siteerosion
0 0 0 1 0 0
Application siteerythema
0 0 0 0 1 0
Application siteirritation
0 1 0 0 0 0
Application siteoedema
0 0 0 1 0 0
Application sitepruritus
1 0 0 0 0 0
Application sitereaction
1 0 0 0 0 0
Influenza likeillness
0 1 0 0 0 0
Oedema peripheral 0 0 1 0 0 0Pain 1 0 0 0 0 0Thirst 0 1 0 0 0 0
14FEB14:08:56:28 LP0053 1001 t12aeint.doc Continued...
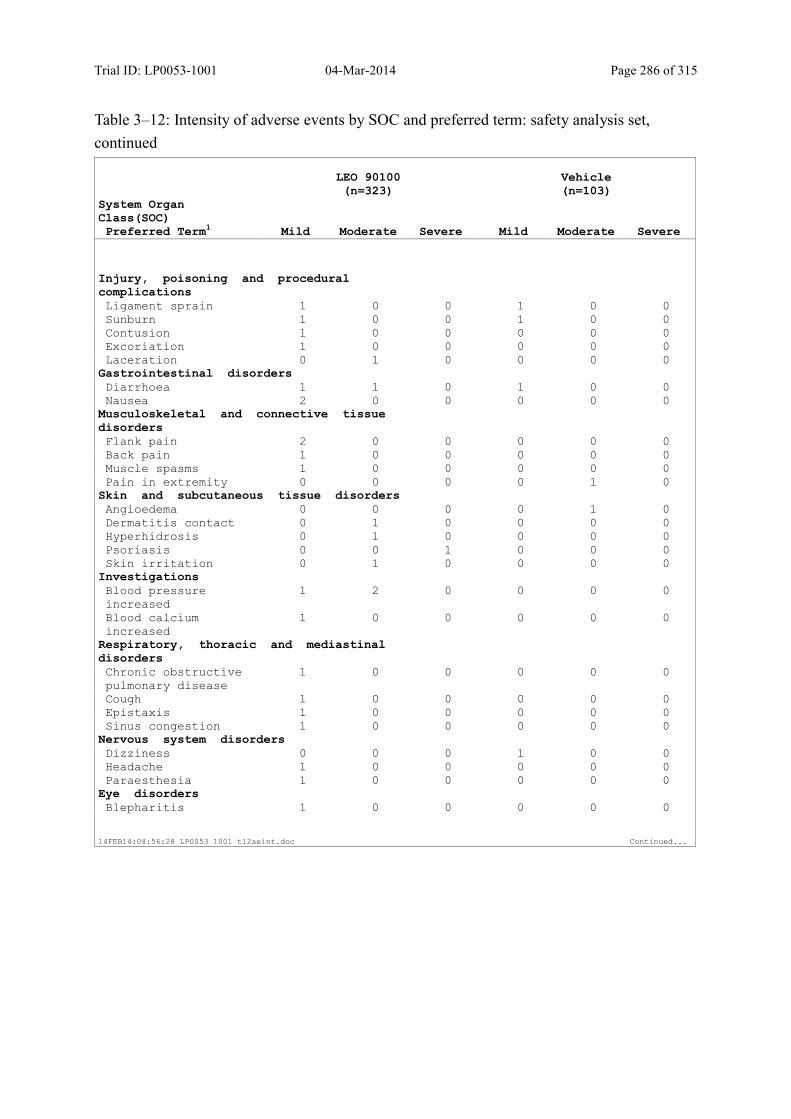
Trial ID: LP0053-1001 04-Mar-2014 Page 286 of 315
Table 3–12: Intensity of adverse events by SOC and preferred term: safety analysis set,
continued
LEO 90100(n=323)
Vehicle(n=103)
System Organ Class(SOC)Preferred Term1 Mild Moderate Severe Mild Moderate Severe
Injury, poisoning and proceduralcomplicationsLigament sprain 1 0 0 1 0 0Sunburn 1 0 0 1 0 0Contusion 1 0 0 0 0 0Excoriation 1 0 0 0 0 0Laceration 0 1 0 0 0 0
Gastrointestinal disordersDiarrhoea 1 1 0 1 0 0Nausea 2 0 0 0 0 0
Musculoskeletal and connective tissuedisordersFlank pain 2 0 0 0 0 0Back pain 1 0 0 0 0 0Muscle spasms 1 0 0 0 0 0Pain in extremity 0 0 0 0 1 0
Skin and subcutaneous tissue disordersAngioedema 0 0 0 0 1 0Dermatitis contact 0 1 0 0 0 0Hyperhidrosis 0 1 0 0 0 0Psoriasis 0 0 1 0 0 0Skin irritation 0 1 0 0 0 0
InvestigationsBlood pressureincreased
1 2 0 0 0 0
Blood calciumincreased
1 0 0 0 0 0
Respiratory, thoracic and mediastinaldisordersChronic obstructivepulmonary disease
1 0 0 0 0 0
Cough 1 0 0 0 0 0Epistaxis 1 0 0 0 0 0Sinus congestion 1 0 0 0 0 0
Nervous system disordersDizziness 0 0 0 1 0 0Headache 1 0 0 0 0 0Paraesthesia 1 0 0 0 0 0
Eye disordersBlepharitis 1 0 0 0 0 0
14FEB14:08:56:28 LP0053 1001 t12aeint.doc Continued...
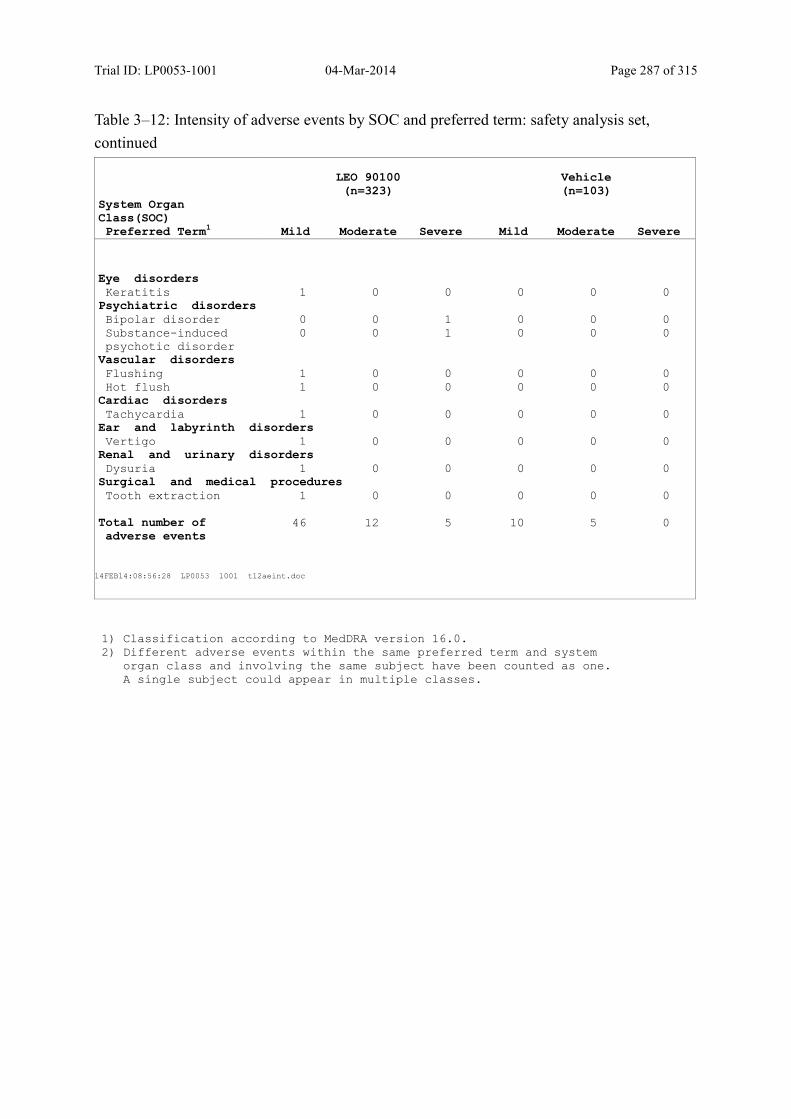
Trial ID: LP0053-1001 04-Mar-2014 Page 287 of 315
Table 3–12: Intensity of adverse events by SOC and preferred term: safety analysis set,
continued
LEO 90100(n=323)
Vehicle(n=103)
System Organ Class(SOC)Preferred Term1 Mild Moderate Severe Mild Moderate Severe
Eye disordersKeratitis 1 0 0 0 0 0
Psychiatric disordersBipolar disorder 0 0 1 0 0 0Substance-inducedpsychotic disorder
0 0 1 0 0 0
Vascular disordersFlushing 1 0 0 0 0 0Hot flush 1 0 0 0 0 0
Cardiac disordersTachycardia 1 0 0 0 0 0
Ear and labyrinth disordersVertigo 1 0 0 0 0 0
Renal and urinary disordersDysuria 1 0 0 0 0 0
Surgical and medical proceduresTooth extraction 1 0 0 0 0 0
Total number ofadverse events
46 12 5 10 5 0
14FEB14:08:56:28 LP0053 1001 t12aeint.doc
1) Classification according to MedDRA version 16.0.2) Different adverse events within the same preferred term and system
organ class and involving the same subject have been counted as one. A single subject could appear in multiple classes.

Trial ID: LP0053-1001 04-Mar-2014 Page 288 of 315
Table 3–13: Relationship to study medication of adverse events by SOC and preferred term: safety analysis set
LEO 90100(n=323)
Vehicle(n=103)
System Organ Class(SOC)Preferred Term1
Not related Possible Probable
Not related Possible Probable
Infections and infestationsNasopharyngitis 6 0 0 0 0 0Cellulitis 1 0 0 0 0 0Eye infection 0 0 0 1 0 0Folliculitis 0 1 0 0 0 0Fungal skin
infection 1 0 0 0 0 0
Gastroenteritis viral
0 0 0 1 0 0
Groin abscess 1 0 0 0 0 0Hordeolum 1 0 0 0 0 0Rhinitis 1 0 0 0 0 0Streptococcalinfection
0 0 0 1 0 0
Tinea cruris 1 0 0 0 0 0Tooth abscess 1 0 0 0 0 0Upper respiratorytract infection
1 0 0 0 0 0
General disorders and administration siteconditionsApplication site
pain 1 0 2 1 1 0
Application sitediscolouration
0 0 1 0 0 0
Application sitedryness
0 0 0 0 1 0
Application siteerosion
0 0 0 0 1 0
Application siteerythema
0 0 0 0 1 0
Application siteirritation
0 0 1 0 0 0
Application siteoedema
0 0 0 0 1 0
Application sitepruritus
0 1 0 0 0 0
Application sitereaction
0 1 0 0 0 0
Influenza likeillness
1 0 0 0 0 0
Oedema peripheral 1 0 0 0 0 0Pain 1 0 0 0 0 0
14FEB14:09:02:55 LP0053 1001 t13aerel.doc Continued...

Trial ID: LP0053-1001 04-Mar-2014 Page 289 of 315
Table 3–13: Relationship to study medication of adverse events by SOC and preferred term:
safety analysis set, continued
LEO 90100(n=323)
Vehicle(n=103)
System Organ Class(SOC)Preferred Term1
Not related Possible Probable
Not related Possible Probable
General disorders and administration siteconditionsThirst 1 0 0 0 0 0
Injury, poisoning and proceduralcomplicationsLigament sprain 1 0 0 1 0 0Sunburn 1 0 0 1 0 0Contusion 1 0 0 0 0 0Excoriation 1 0 0 0 0 0Laceration 1 0 0 0 0 0
Gastrointestinal disordersDiarrhoea 2 0 0 1 0 0Nausea 2 0 0 0 0 0
Musculoskeletal and connective tissuedisordersFlank pain 2 0 0 0 0 0Back pain 1 0 0 0 0 0Muscle spasms 1 0 0 0 0 0Pain in extremity 0 0 0 1 0 0
Skin and subcutaneous tissue disordersAngioedema 0 0 0 1 0 0Dermatitis contact 1 0 0 0 0 0Hyperhidrosis 1 0 0 0 0 0Psoriasis 0 1 0 0 0 0Skin irritation 0 0 1 0 0 0
InvestigationsBlood pressureincreased
3 0 0 0 0 0
Blood calciumincreased
0 1 0 0 0 0
Respiratory, thoracic and mediastinaldisordersChronic obstructivepulmonary disease
1 0 0 0 0 0
Cough 1 0 0 0 0 0Epistaxis 1 0 0 0 0 0Sinus congestion 1 0 0 0 0 0
Nervous system disordersDizziness 0 0 0 1 0 0Headache 1 0 0 0 0 0Paraesthesia 1 0 0 0 0 0
14FEB14:09:02:55 LP0053 1001 t13aerel.doc Continued...
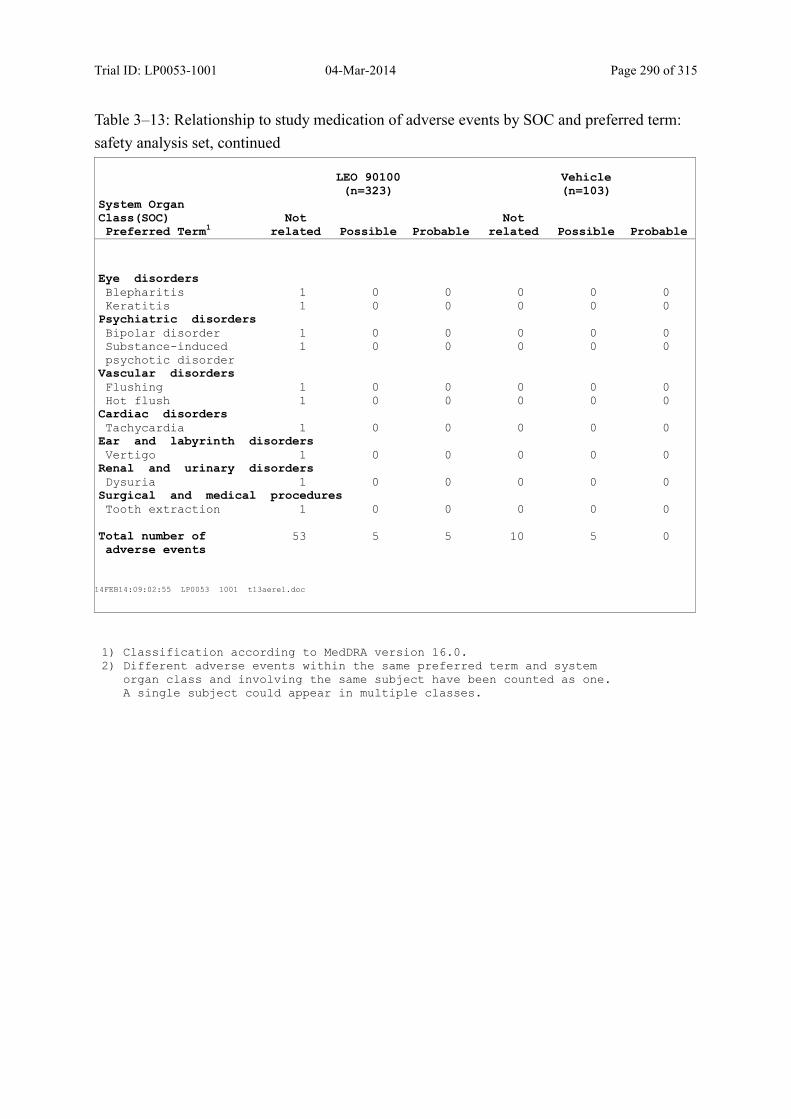
Trial ID: LP0053-1001 04-Mar-2014 Page 290 of 315
Table 3–13: Relationship to study medication of adverse events by SOC and preferred term:
safety analysis set, continued
LEO 90100(n=323)
Vehicle(n=103)
System Organ Class(SOC)Preferred Term1
Not related Possible Probable
Not related Possible Probable
Eye disordersBlepharitis 1 0 0 0 0 0Keratitis 1 0 0 0 0 0
Psychiatric disordersBipolar disorder 1 0 0 0 0 0Substance-inducedpsychotic disorder
1 0 0 0 0 0
Vascular disordersFlushing 1 0 0 0 0 0Hot flush 1 0 0 0 0 0
Cardiac disordersTachycardia 1 0 0 0 0 0
Ear and labyrinth disordersVertigo 1 0 0 0 0 0
Renal and urinary disordersDysuria 1 0 0 0 0 0
Surgical and medical proceduresTooth extraction 1 0 0 0 0 0
Total number ofadverse events
53 5 5 10 5 0
14FEB14:09:02:55 LP0053 1001 t13aerel.doc
1) Classification according to MedDRA version 16.0.2) Different adverse events within the same preferred term and system
organ class and involving the same subject have been counted as one. A single subject could appear in multiple classes.

Trial ID: LP0053-1001 04-Mar-2014 Page 291 of 315
Table 3–14: Local safety and tolerability by visit: safety analysis set
LEO 90100(n=323)
Vehicle(n=103)
VisitAssessment
Number of subjects %
Number of subjects %
Perilesional erythemaBaseline
Absent 300 92.9 98 95.1 Mild 15 4.6 1 1.0 Moderate 8 2.5 4 3.9 Severe 0 0.0 0 0.0 Total 323 100.0 103 100.0 Week 1
Absent 295 93.4 90 88.2 Mild 17 5.4 8 7.8 Moderate 3 0.9 3 2.9 Severe 1 0.3 1 1.0 Total 316 100.0 102 100.0 Week 2
Absent 301 95.6 93 92.1 Mild 10 3.2 5 5.0 Moderate 3 1.0 2 2.0 Severe 1 0.3 1 1.0 Total 315 100.0 101 100.0 Week 4
Absent 307 98.1 97 98.0 Mild 6 1.9 2 2.0 Moderate 0 0.0 0 0.0 Severe 0 0.0 0 0.0 Total 313 100.0 99 100.0
Perilesional drynessBaseline
Absent 293 90.7 96 93.2 Mild 18 5.6 3 2.9 Moderate 10 3.1 4 3.9 Severe 2 0.6 0 0.0 Total 323 100.0 103 100.0 Week 1
Absent 286 90.5 91 89.2 Mild 22 7.0 8 7.8 Moderate 8 2.5 2 2.0 Severe 0 0.0 1 1.0 Total 316 100.0 102 100.0
29NOV13:10:16:28 LP0053 1001 t14local.doc Continued...
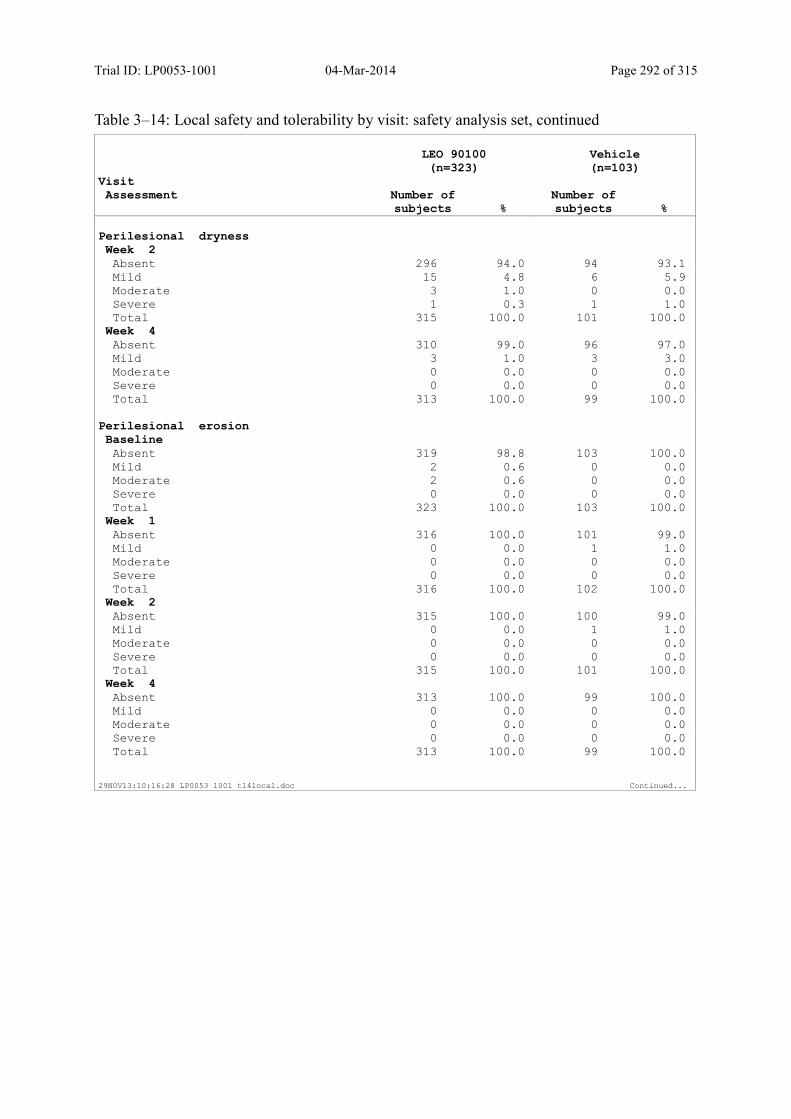
Trial ID: LP0053-1001 04-Mar-2014 Page 292 of 315
Table 3–14: Local safety and tolerability by visit: safety analysis set, continued
LEO 90100(n=323)
Vehicle(n=103)
VisitAssessment
Number of subjects %
Number of subjects %
Perilesional drynessWeek 2
Absent 296 94.0 94 93.1 Mild 15 4.8 6 5.9 Moderate 3 1.0 0 0.0 Severe 1 0.3 1 1.0 Total 315 100.0 101 100.0 Week 4
Absent 310 99.0 96 97.0 Mild 3 1.0 3 3.0 Moderate 0 0.0 0 0.0 Severe 0 0.0 0 0.0 Total 313 100.0 99 100.0
Perilesional erosionBaseline
Absent 319 98.8 103 100.0 Mild 2 0.6 0 0.0 Moderate 2 0.6 0 0.0 Severe 0 0.0 0 0.0 Total 323 100.0 103 100.0 Week 1
Absent 316 100.0 101 99.0 Mild 0 0.0 1 1.0 Moderate 0 0.0 0 0.0 Severe 0 0.0 0 0.0 Total 316 100.0 102 100.0 Week 2
Absent 315 100.0 100 99.0 Mild 0 0.0 1 1.0 Moderate 0 0.0 0 0.0 Severe 0 0.0 0 0.0 Total 315 100.0 101 100.0 Week 4
Absent 313 100.0 99 100.0 Mild 0 0.0 0 0.0 Moderate 0 0.0 0 0.0 Severe 0 0.0 0 0.0 Total 313 100.0 99 100.0
29NOV13:10:16:28 LP0053 1001 t14local.doc Continued...

Trial ID: LP0053-1001 04-Mar-2014 Page 293 of 315
Table 3–14: Local safety and tolerability by visit: safety analysis set, continued
LEO 90100(n=323)
Vehicle(n=103)
VisitAssessment
Number of subjects %
Number of subjects %
Perilesional oedemaBaseline
Absent 317 98.1 103 100.0 Mild 5 1.5 0 0.0 Moderate 1 0.3 0 0.0 Severe 0 0.0 0 0.0 Total 323 100.0 103 100.0 Week 1
Absent 316 100.0 100 98.0 Mild 0 0.0 2 2.0 Moderate 0 0.0 0 0.0 Severe 0 0.0 0 0.0 Total 316 100.0 102 100.0 Week 2
Absent 314 99.7 99 98.0 Mild 1 0.3 2 2.0 Moderate 0 0.0 0 0.0 Severe 0 0.0 0 0.0 Total 315 100.0 101 100.0 Week 4
Absent 313 100.0 99 100.0 Mild 0 0.0 0 0.0 Moderate 0 0.0 0 0.0 Severe 0 0.0 0 0.0 Total 313 100.0 99 100.0
Burning or painBaseline
Absent 294 91.0 92 89.3 Mild 15 4.6 6 5.8 Moderate 9 2.8 3 2.9 Severe 5 1.5 2 1.9 Total 323 100.0 103 100.0 Week 1
Absent 290 91.8 93 91.2 Mild 19 6.0 7 6.9 Moderate 7 2.2 1 1.0 Severe 0 0.0 1 1.0 Total 316 100.0 102 100.0
29NOV13:10:16:28 LP0053 1001 t14local.doc Continued...

Trial ID: LP0053-1001 04-Mar-2014 Page 294 of 315
Table 3–14: Local safety and tolerability by visit: safety analysis set, continued
LEO 90100(n=323)
Vehicle(n=103)
VisitAssessment
Number of subjects %
Number of subjects %
Burning or painWeek 2
Absent 307 97.5 94 93.1 Mild 5 1.6 3 3.0 Moderate 3 1.0 4 4.0 Severe 0 0.0 0 0.0 Total 315 100.0 101 100.0 Week 4
Absent 306 97.8 95 96.0 Mild 5 1.6 2 2.0 Moderate 2 0.6 1 1.0 Severe 0 0.0 1 1.0 Total 313 100.0 99 100.0
29NOV13:10:16:28 LP0053 1001 t14local.doc
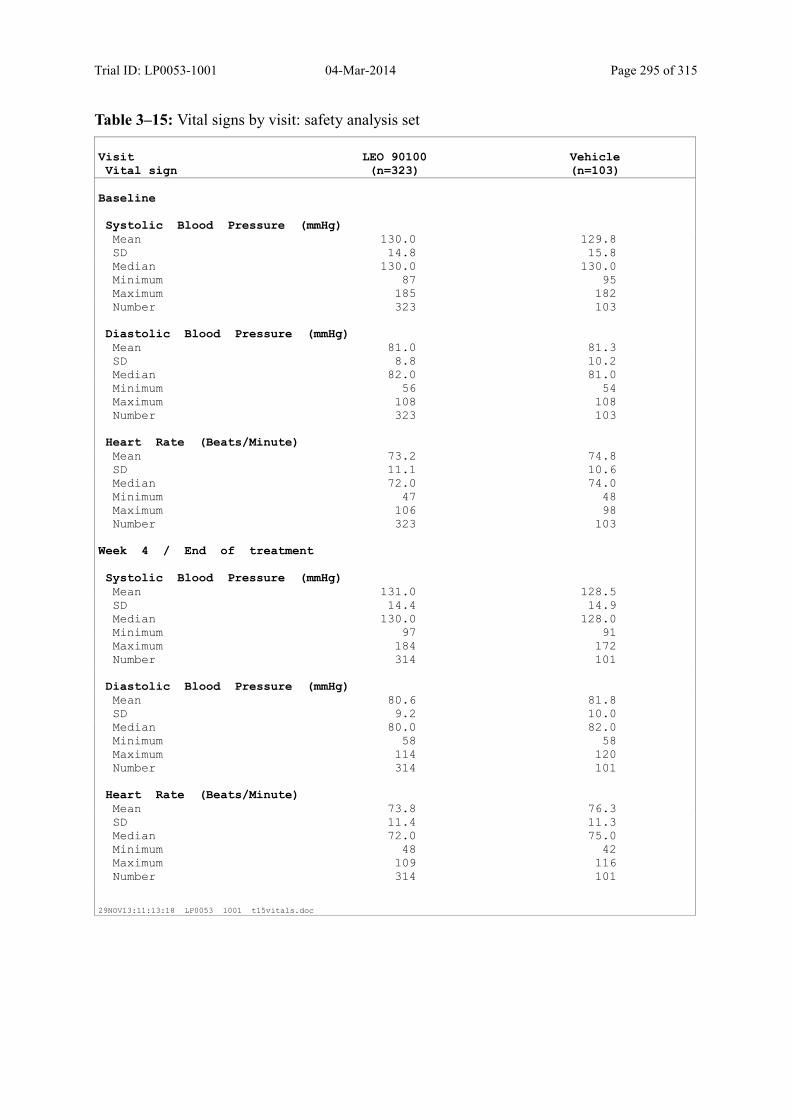
Trial ID: LP0053-1001 04-Mar-2014 Page 295 of 315
Table 3–15: Vital signs by visit: safety analysis set
VisitVital sign
LEO 90100(n=323)
Vehicle(n=103)
Baseline
Systolic Blood Pressure (mmHg) Mean 130.0 129.8 SD 14.8 15.8 Median 130.0 130.0 Minimum 87 95 Maximum 185 182 Number 323 103
Diastolic Blood Pressure (mmHg) Mean 81.0 81.3 SD 8.8 10.2 Median 82.0 81.0 Minimum 56 54 Maximum 108 108 Number 323 103
Heart Rate (Beats/Minute) Mean 73.2 74.8 SD 11.1 10.6 Median 72.0 74.0 Minimum 47 48 Maximum 106 98 Number 323 103
Week 4 / End of treatment
Systolic Blood Pressure (mmHg) Mean 131.0 128.5 SD 14.4 14.9 Median 130.0 128.0 Minimum 97 91 Maximum 184 172 Number 314 101
Diastolic Blood Pressure (mmHg) Mean 80.6 81.8 SD 9.2 10.0 Median 80.0 82.0 Minimum 58 58 Maximum 114 120 Number 314 101
Heart Rate (Beats/Minute) Mean 73.8 76.3 SD 11.4 11.3 Median 72.0 75.0 Minimum 48 42 Maximum 109 116 Number 314 101
29NOV13:11:13:18 LP0053 1001 t15vitals.doc
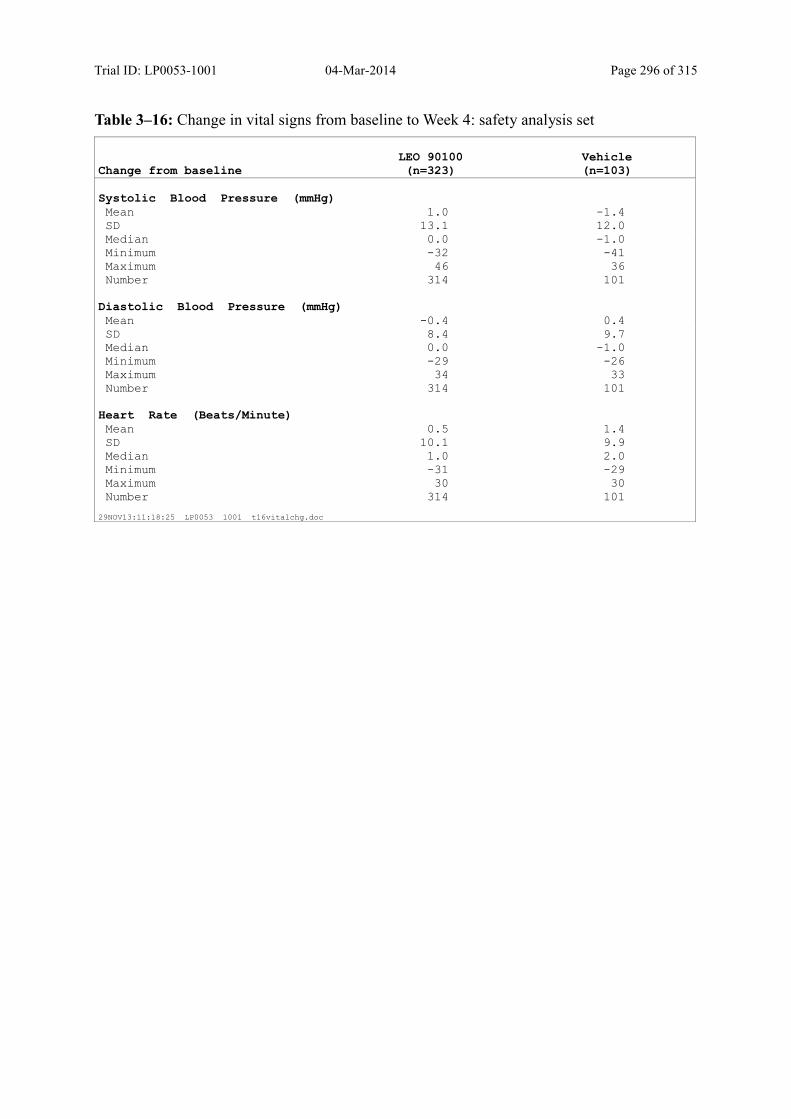
Trial ID: LP0053-1001 04-Mar-2014 Page 296 of 315
Table 3–16: Change in vital signs from baseline to Week 4: safety analysis set
Change from baselineLEO 90100(n=323)
Vehicle(n=103)
Systolic Blood Pressure (mmHg)Mean 1.0 -1.4 SD 13.1 12.0 Median 0.0 -1.0 Minimum -32 -41 Maximum 46 36 Number 314 101
Diastolic Blood Pressure (mmHg)Mean -0.4 0.4 SD 8.4 9.7 Median 0.0 -1.0 Minimum -29 -26 Maximum 34 33 Number 314 101
Heart Rate (Beats/Minute)Mean 0.5 1.4 SD 10.1 9.9 Median 1.0 2.0 Minimum -31 -29 Maximum 30 30 Number 314 101
29NOV13:11:18:25 LP0053 1001 t16vitalchg.doc
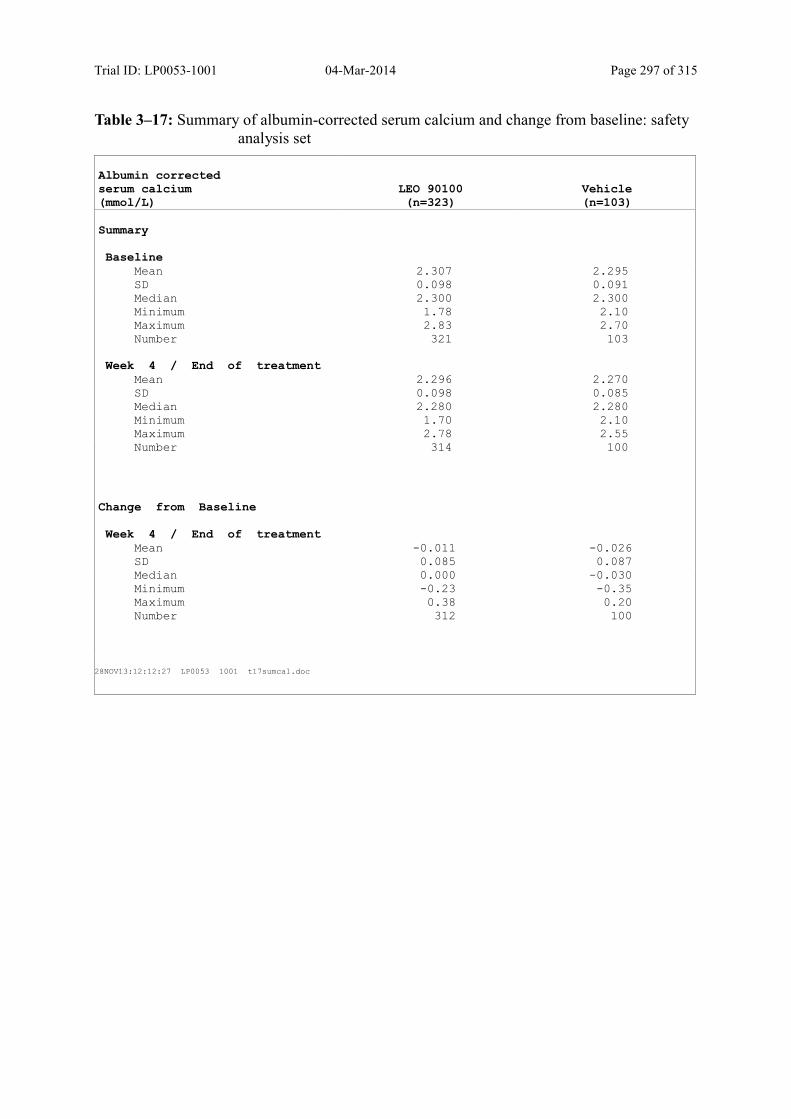
Trial ID: LP0053-1001 04-Mar-2014 Page 297 of 315
Table 3–17: Summary of albumin-corrected serum calcium and change from baseline: safety analysis set
Albumin correctedserum calcium(mmol/L)
LEO 90100(n=323)
Vehicle(n=103)
Summary
Baseline Mean 2.307 2.295 SD 0.098 0.091 Median 2.300 2.300 Minimum 1.78 2.10 Maximum 2.83 2.70 Number 321 103
Week 4 / End of treatment Mean 2.296 2.270 SD 0.098 0.085 Median 2.280 2.280 Minimum 1.70 2.10 Maximum 2.78 2.55 Number 314 100
Change from Baseline
Week 4 / End of treatment Mean -0.011 -0.026 SD 0.085 0.087 Median 0.000 -0.030 Minimum -0.23 -0.35 Maximum 0.38 0.20 Number 312 100
28NOV13:12:12:27 LP0053 1001 t17sumcal.doc

Trial ID: LP0053-1001 04-Mar-2014 Page 298 of 315
Table 3–18: Shift table for albumin-corrected serum calcium: safety analysis set
LEO 90100(n=323)
End of treatment category1
Vehicle(n=103)
End of treatment category1
Laboratory parameter
Baseline category1 LOW NORMAL HIGH LOW NORMAL HIGH
Albumin corrected serum calcium
Low 1 8 0 2 1 0
Normal 5 290 3 3 93 0High 0 2 3 0 1 0
28NOV13:12:12:36 LP0053 1001 t18shalbu.doc
1) Number of subjects with laboratory parameters below, within or above the reference range.
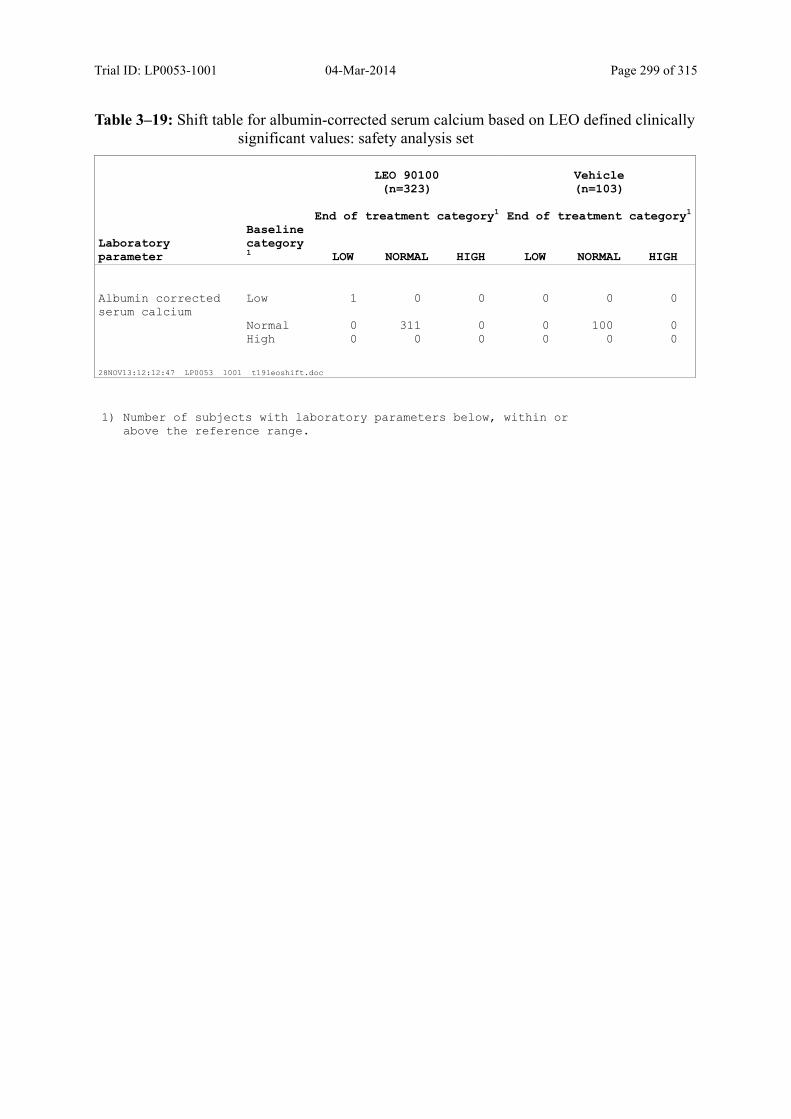
Trial ID: LP0053-1001 04-Mar-2014 Page 299 of 315
Table 3–19: Shift table for albumin-corrected serum calcium based on LEO defined clinically significant values: safety analysis set
LEO 90100(n=323)
End of treatment category1
Vehicle(n=103)
End of treatment category1
Laboratory parameter
Baseline category1 LOW NORMAL HIGH LOW NORMAL HIGH
Albumin corrected serum calcium
Low 1 0 0 0 0 0
Normal 0 311 0 0 100 0High 0 0 0 0 0 0
28NOV13:12:12:47 LP0053 1001 t19leoshift.doc
1) Number of subjects with laboratory parameters below, within or above the reference range.
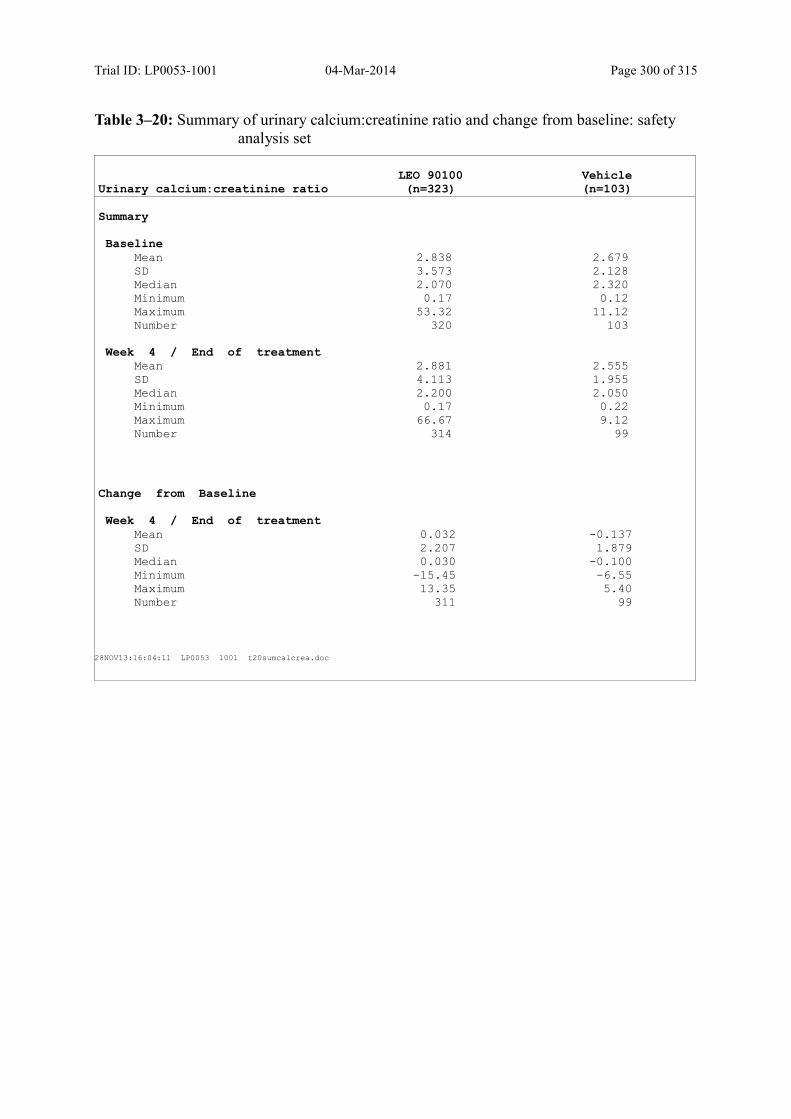
Trial ID: LP0053-1001 04-Mar-2014 Page 300 of 315
Table 3–20: Summary of urinary calcium:creatinine ratio and change from baseline: safety analysis set
Urinary calcium:creatinine ratioLEO 90100(n=323)
Vehicle(n=103)
Summary
Baseline Mean 2.838 2.679 SD 3.573 2.128 Median 2.070 2.320 Minimum 0.17 0.12 Maximum 53.32 11.12 Number 320 103
Week 4 / End of treatment Mean 2.881 2.555 SD 4.113 1.955 Median 2.200 2.050 Minimum 0.17 0.22 Maximum 66.67 9.12 Number 314 99
Change from Baseline
Week 4 / End of treatment Mean 0.032 -0.137 SD 2.207 1.879 Median 0.030 -0.100 Minimum -15.45 -6.55 Maximum 13.35 5.40 Number 311 99
28NOV13:16:04:11 LP0053 1001 t20sumcalcrea.doc
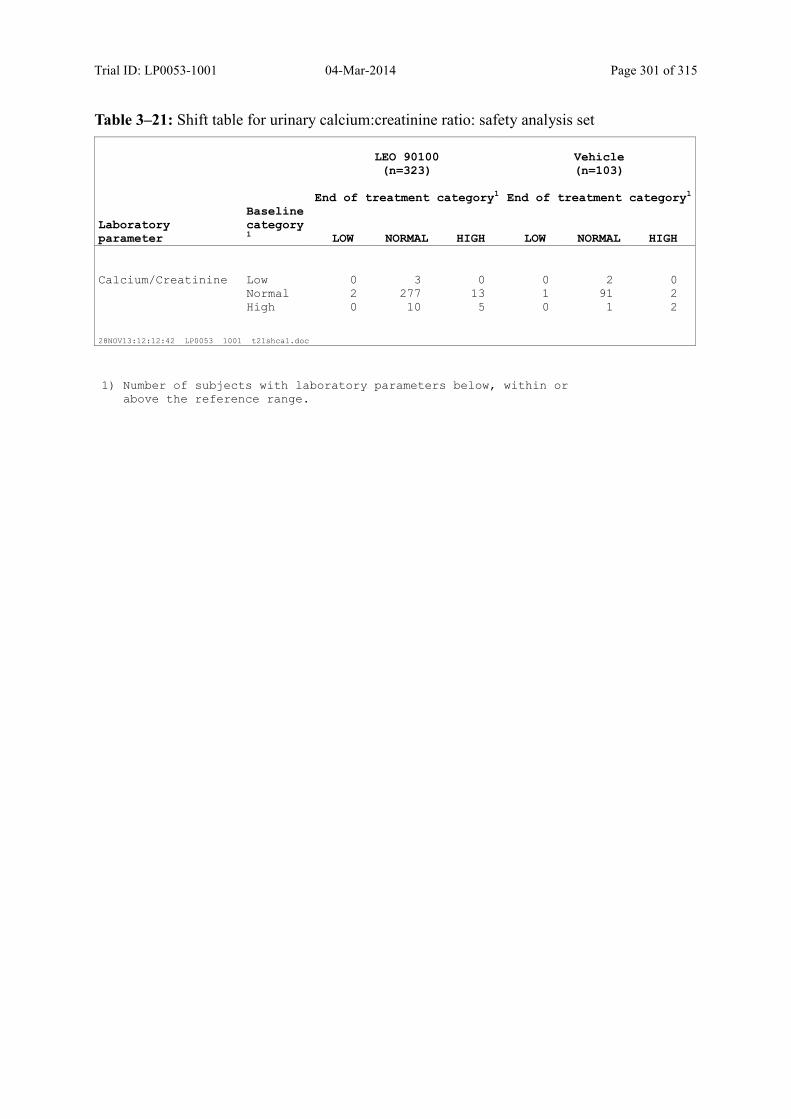
Trial ID: LP0053-1001 04-Mar-2014 Page 301 of 315
Table 3–21: Shift table for urinary calcium:creatinine ratio: safety analysis set
LEO 90100(n=323)
End of treatment category1
Vehicle(n=103)
End of treatment category1
Laboratory parameter
Baseline category1 LOW NORMAL HIGH LOW NORMAL HIGH
Calcium/Creatinine Low 0 3 0 0 2 0Normal 2 277 13 1 91 2High 0 10 5 0 1 2
28NOV13:12:12:42 LP0053 1001 t21shcal.doc
1) Number of subjects with laboratory parameters below, within or above the reference range.
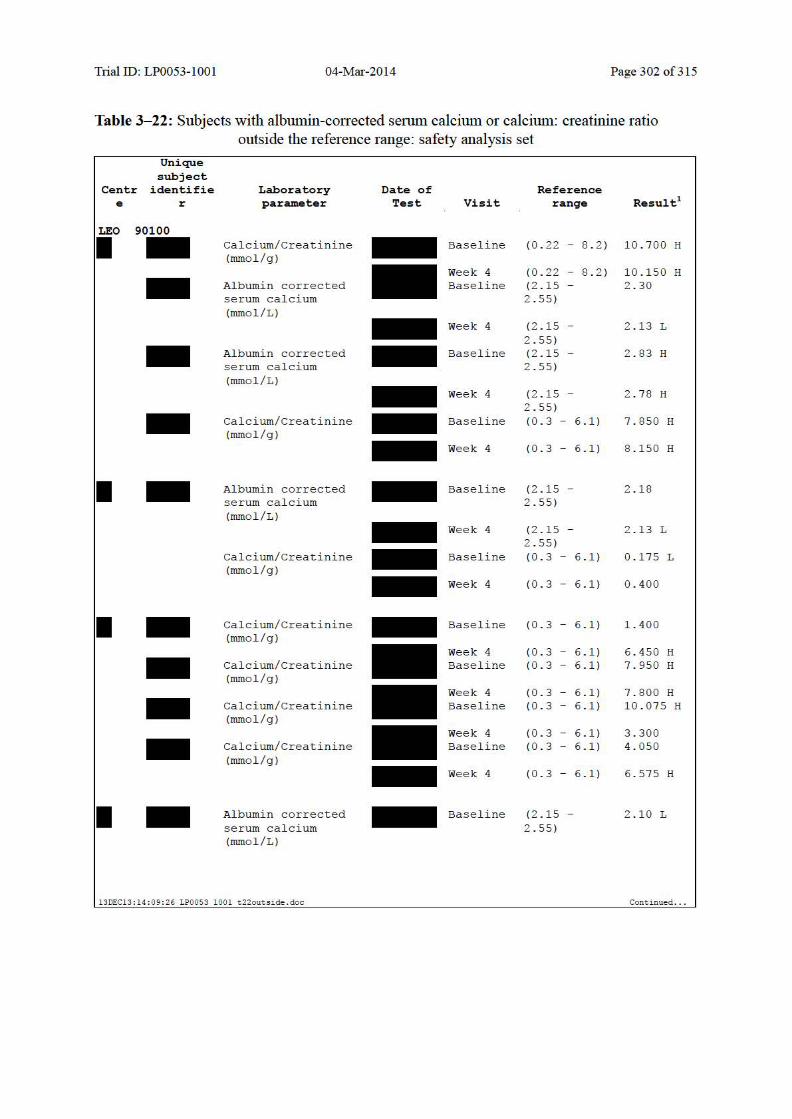
Trial ID: LP0053-1001 04-Mar-2014 Page 302 of 315
Table 3-22: Subjects with albumin-con ected sennn calcium or calcium: creatinine ratio outside the reference range: safety analysis set
Uni que subje ct
Ce ntr ident ifi e Laboratory Da t e of Re fere nce e r pa rame t e r Test Vi sit r a nge Result1
LEO 90100
I - Calcium/Creatinine - Baseli ne (0 .22 - 8 . 2) 1 0 . 700 H (mmol/g)
Week 4 (0 .22 - 8 . 2) 1 0 . 150 H - Albumi n corrected Baseline (2 .15 - 2 . 30 serum calci um 2 . 55) (mmol/L) - Week 4 (2 .15 - 2 . 13 L
2 . 55) - Albumi n cor rected - Baseline (2 .15 - 2 . 83 H serum calci um 2 . 55) (mmol/L) - Week 4 (2 .15 - 2 . 78 H
2 . 55) - Calcium/Creatinine - Baseline (0 .3 - 6 . 1) 7 . 850 H (mmol/g) - Week 4 (0 .3 - 6 . 1) 8 . 150 H
I - Albumi n cor rected - Baseline (2 .15 - 2 . 18 serum calci um 2 . 55) (mmol/L) - Week 4 (2 .15 - 2 . 13 L
2 . 55) Calcium/Creatinine - Baseline (0 .3 - 6 . 1) 0 . 175 L (mmol/g) - Week 4 (0 .3 - 6 . 1) 0 . 400
I - Calcium/Creatinine - Baseline (0 .3 - 6 . 1) 1 . 400 (mmol/g)
Week 4 (0 .3 - 6 . 1) 6 . 450 H - Calcium/Creatinine Baseline (0 .3 - 6 . 1) 7 . 950 H (mmol/g)
Week 4 (0 .3 - 6 . 1) 7 . 800 H - Calcium/Creatinine Baseline (0 .3 - 6 . 1) 1 0 . 0 75 H (mmol/g)
Week 4 (0 .3 - 6 . 1) 3 . 300 - Calcium/Creatinine Baseline (0 .3 - 6 . 1) 4 . 050 (mmol/g) - Wee k 4 (0 .3 - 6 . 1) 6 . 575 H
I - Albumi n cor rected - Baseline (2 .15 - 2 . 10 L serum calci um 2 . 55) (mmol/L)
13DEC13:14 : 09:26 LPOOS3 1001 t 22out side.doc Cont i nued .. •

Trial ID: LP0053-1001 04-Mar-2014 Page 303 of 315
Table 3- 22: Subjects with albumin-con ected sennn calcium or calcium: creatinine ratio
outside the reference range: safety analysis set, continued Uni que subje ct
Ce ntr ident ifi e Laboratory Da t e o f Re ference e r parame t er Te st Vi sit range Result1
EO 90
I - Albumi n corrected - Week 4 (2 .15 - 2 . 18 serum calci um 2 . 55) (mmol/L)
I - Albumi n corrected - Baseline (2 .15 - 2 . 10 L serum calci um 2 . 55) (mmol/L) - Week 4 (2 .15 - 2 . 25
2 . 55) - Calcium/Creat ini ne - Baseline (0 . 3 - 6 . 1) 5 . 950 (mmol/g) - Week 4 (0 . 3 - 6 . 1) 1 0 . 075 H
I - Albumi n corrected - Baseline (2 .15 - 2 . 05 L serum calci um 2 . 55) (mmol/L) - Week 4 (2 .15 - 2 . 20
2 . 55) Calcium/Creat ini ne - Baseline (0 .22 - 8 . 2) 3 . 800 (mmol/g)
Week 4 (0 .22 - 8 . 2) 8 . 700 H - Albumi n corrected Baseline (2 .15 - 2 . 25 serum calci um 2 . 55) (mmol/L) - Week 4 (2 .15 - 2 . 63 H
2 . 55) - Follow- up (2 .15 - 2 . 13 L 2 . 55) - Albumi n corrected - Baseline (2 .15 - 2 . 13 L
serum calci um 2 . 55) (mmol/L) - Week 4 (2 .15 - 2 . 15
2 . 55) - Albumi n corrected - Baseline (2 .15 - 1. 78 L serum calci um 2 . 55) (mmol/L) - Week 4 (2 .15 - 1 . 70 L
2 . 55) Calcium/Creat ini ne - Week 4 (0 . 3 - 6 . 1) 0 . 2 75 L (mmol/g)
I - Albumi n corrected - Baseline (2 .15 - 2 . 20 serum calci um 2 . 55) (mmol/L)
13DEC13:14:09:26 LPOOS3 1001 t 22outsi de. doc Cont i nued .. .
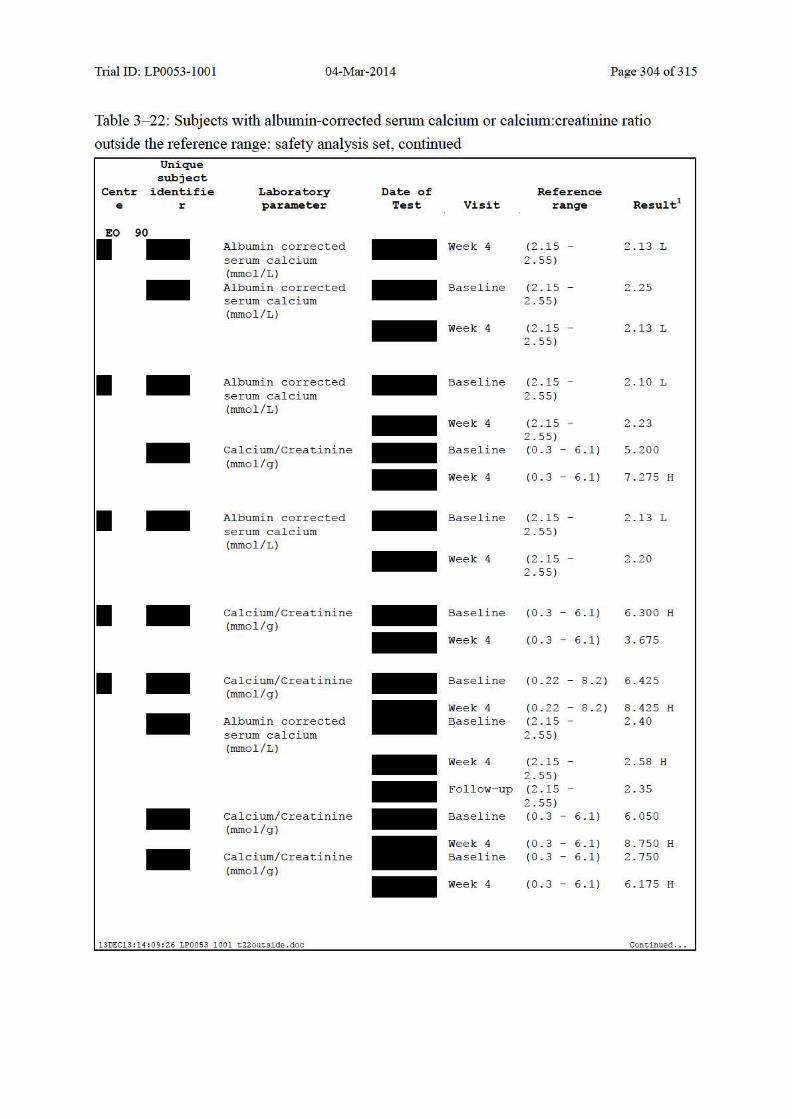
Trial ID: LP0053-1001 04-Mar-2014 Page 304 of 315
Table 3- 22: Subjects with albumin-con ected sennn calcium or calcium: creatinine ratio
outside the reference range: safety analysis set, continued Uni que subje ct
Ce ntr ident ifi e Laboratory Da t e o f Re ference e r parame t er Test Vi sit range Result1
EO 90
I - Albumi n cor rected - Week 4 (2 .15 - 2 . 13 L serum calci um 2 . 55) (mmol/L) - Albumi n cor rected - Baseline (2 .15 - 2 . 25 serum calci um 2 . 55) (mmol/L) - Week 4 (2 .15 - 2 . 13 L
2 . 55)
I - Albumi n cor rected - Baseline (2 .15 - 2 . 10 L serum calci um 2 . 55) (mmol/L) - Week 4 (2 .15 - 2 . 23
2 . 55) - Calcium/Creatinine - Baseline (0 . 3 - 6 . 1) 5 . 200 (mmol/g) - Week 4 (0 . 3 - 6 . 1) 7 . 2 75 H
I - Albumi n cor rected - Baseline (2 .15 - 2 . 13 L serum calci um 2 . 55) (mmol/L) - Week 4 (2 .15 - 2 . 20
2 . 55)
I - Calcium/Creatinine - Baseline (0 . 3 - 6 . 1) 6 . 300 H (mmol/g) - Week 4 (0 . 3 - 6 . 1) 3 . 675
I - Calcium/Creatinine - Baseline (0 .22 - 8 . 2) 6 . 425 (mmol/g)
Week 4 (0 .22 - 8 . 2) 8 . 425 H - Albumi n cor rected Baseline (2 .15 - 2 . 40 serum calci um 2 . 55) (mmol/L) - Week 4 (2 .15 - 2 . 58 H
2 . 55) - Follow- up (2 .15 - 2 . 35 2 . 55) - Calcium/Creatinine - Baseline (0 . 3 - 6 . 1) 6 . 050
(mmol/g) Week 4 (0 . 3 - 6 . 1) 8 . 750 H - Calcium/Creatinine Baseline (0 . 3 - 6 . 1) 2 . 750
(mmol/g) - Week 4 (0 . 3 - 6 . 1) 6 . 175 H
13DEC13:14 : 09:26 LPOOS3 1001 t 22out s i de.doc Cont i nued .. .

Trial ID: LP0053-1001 04-Mar-2014 Page 305 of 315
Table 3- 22: Subjects with albumin-con ected sennn calcium or calcium: creatinine ratio
outside the reference range: safety analysis set, continued Uni que subje ct
Ce ntr ident ifi e Laboratory Da t e o f Re ference e r parame t er Test Vi sit range Result1
EO 90
I - Calcium/Creat ini ne - Baseli ne (0.3 - 6 . 1) 1 0 . 825 H (mmol/g)
Week 4 (0 . 3 - 6 . 1) 4 . 375 - Albumi n corrected Baseline (2 .15 - 2 . 13 L serum calci um 2 . 55) (mmol/L) - Week 4 (2 .15 - 2 . 23
2 . 55)
I - Albumi n corrected - Baseline (2 .15 - 2 . 20 serum calci um 2 . 55) (mmol/L) - Week 4 (2 .15 - 2 . 13 L
2 . 55)
I - Albumi n corrected - Baseline (2 .15 - 2 . 38 serum calci um 2 . 55) (mmol/L) - Week 4 (2 .15 - 2 . 60 H
2 . 55) - Follow- up (2 .15 - 2 . 35 2 . 55) - Calcium/Creatinine - Baseline (0 .22 - 8 . 2) 8 . 675 H
(mmol/g) - Week 4 (0 .22 - 8 . 2) 6 . 950
I - Calcium/Creatinine - Baseline (0 .22 - 8 . 2) 0 . 200 L (mmol/g)
Week 4 (0 .22 - 8 . 2) 0 . 900 - Calcium/Creatinine Baseline (0 . 3 - 6 . 1) 7 . 550 H (mmol/g) - Week 4 (0 . 3 - 6 . 1) 9 . 475 H
I - Calcium/Creatinine - Baseline (0 .22 - 8 . 2) 4 . 900 (mmol/g) - Week 4 (0 .22 - 8 . 2) 8 . 250 H
I - Albumi n corrected - Baseline (2 .15 - 2 . 80 H serum calci um 2 . 55) (mmol/L) - Week 4 (2 .15 - 2 . 75 H
2 . 55) Calcium/Creatinine - Baseline (0 . 3 - 6 . 1) 4 . 900 (mmol/g)
13DEC13:14:0 9 :26 LPOOS3 1001 t 22outsi de.doc Cont i nued .. .
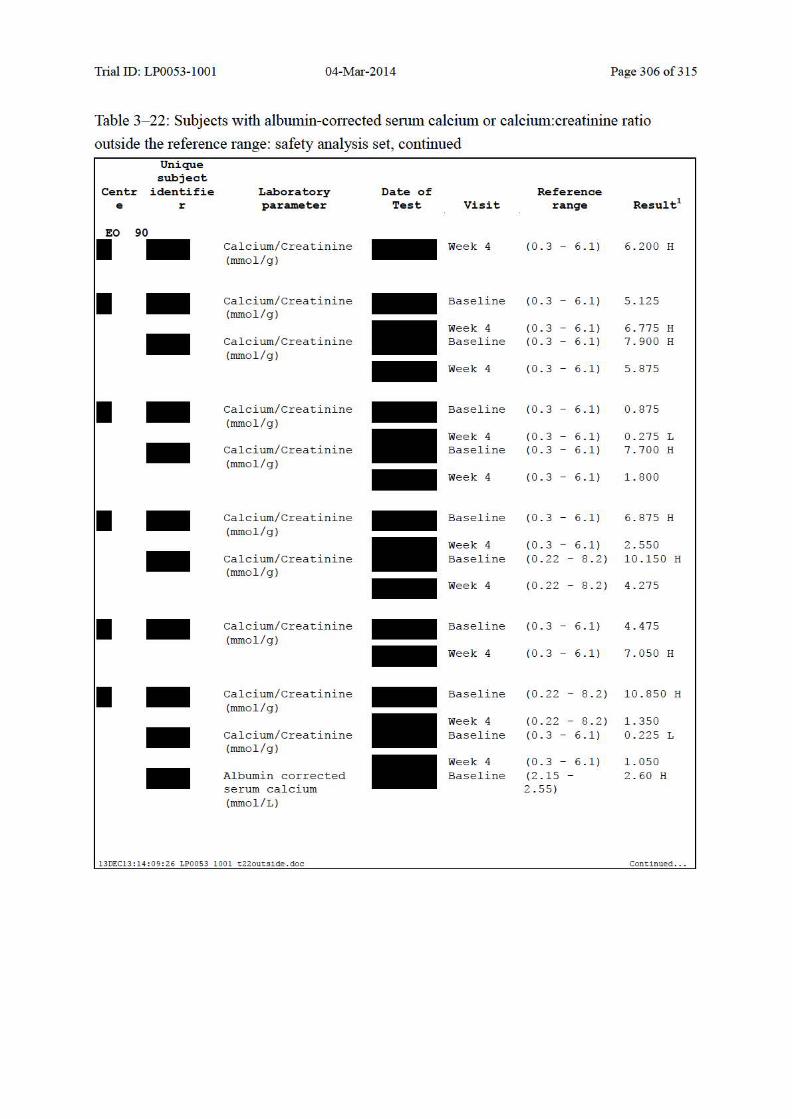
Trial ID: LP0053-1001 04-Mar-2014 Page 306 of 315
Table 3- 22: Subjects with albumin-con ected sennn calcium or calcium: creatinine ratio
outside the reference range: safety analysis set, continued Uni que subje ct
Ce ntr ident ifi e Laboratory Da t e o f Re ference e r parame t er Test Vi sit range Result1
EO 90
I - Calcium/Creat ini ne - Week 4 (0.3 - 6 . 1) 6 . 200 H (mmol/g)
I - Calcium/Creat ini ne - Baseli ne (0 . 3 - 6 . 1) 5 . 125 (mmol/g)
Week 4 (0 . 3 - 6 . 1) 6 . 775 H - Calcium/Creatinine Baseli ne (0 . 3 - 6 . 1) 7 . 900 H (mmol/g) - Week 4 (0 . 3 - 6 . 1) 5 . 875
I - Calcium/Creatinine - Baseli ne (0 . 3 - 6 . 1) 0 . 875 (mmol/g)
Week 4 (0 . 3 - 6 . 1) 0 . 275 L - Calcium/Creat ini ne Baseli ne (0 . 3 - 6 . 1) 7 . 700 H (mmol/g) - Week 4 (0 . 3 - 6 . 1) 1 . 800
I - Calcium/Creat ini ne - Baseli ne (0 . 3 - 6 . 1) 6 . 875 H (mmol/g)
Week 4 (0 . 3 - 6 . 1) 2 . 550 - Calcium/Creat ini ne Baseli ne (0 .22 - 8 . 2) 1 0 . 150 H (mmol/g) - Week 4 (0 .22 - 8 . 2) 4 . 275
I - Calcium/Creatinine - Baseli ne (0 . 3 - 6 . 1) 4 . 475 (mmol/g) - Week 4 (0 . 3 - 6 . 1) 7 . 050 H
I - Calcium/Creatinine - Baseli ne (0 .22 - 8 . 2) 1 0 . 850 H (mmol/g)
Week 4 (0 .22 - 8 . 2) 1 . 350 - Calcium/Creatinine Baseli ne (0 . 3 - 6 . 1) 0 . 225 L (mmol/g)
Week 4 (0 . 3 - 6 . 1) 1 . 050 - Albumi n cor rected Baseli ne (2 .15 - 2 . 60 H serum calci um 2 . 55) (mmol/L)
13DEC13:14 : 09 : 26 LPOOS3 1001 t 22out s i de . doc Cont i nued .. .
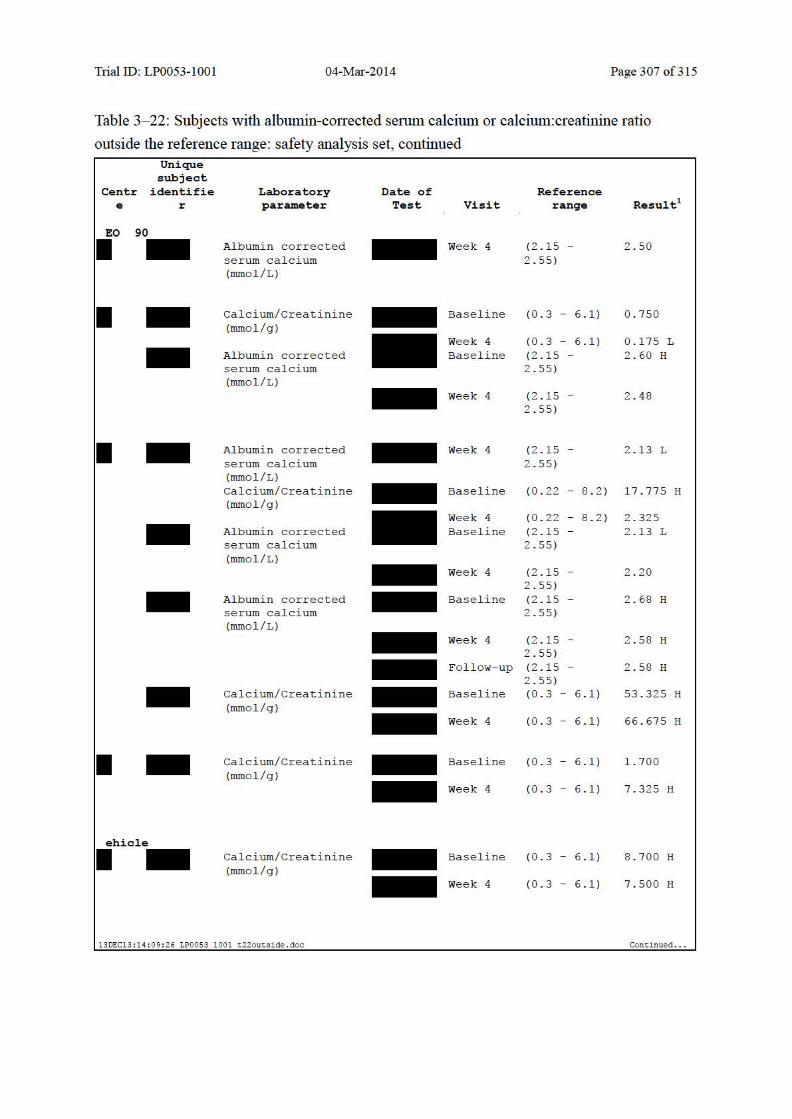
Trial ID: LP0053-1001 04-Mar-2014 Page 307 of 315
Table 3- 22: Subjects with albumin-con ected sennn calcium or calcium: creatinine ratio
outside the reference range: safety analysis set, continued Uni que subje ct
Ce ntr ident ifi e Laboratory Da t e o f Re ference e r parame t er Test Vi sit range Result1
EO 90
I - Albumi n corrected - Week 4 (2 .15 - 2 . 50 serum calci um 2 . 55) (mmol/L)
I - Calcium/Creatinine - Baseline (0 .3 - 6 . 1) 0 . 750 (mmol/g)
Week 4 (0 .3 - 6 . 1) 0 . 175 L - Albumi n corrected Baseline (2 .15 - 2 . 60 H serum calci um 2 . 55) (mmol/L) - Week 4 (2 .15 - 2 . 48
2 . 55)
I - Albumi n corrected - Week 4 (2 .15 - 2 . 13 L serum calci um 2 . 55) (mmol/L) Calcium/Creatinine - Baseline (0 .22 - 8 . 2) 1 7 . 775 H (mmol/g)
Week 4 (0 .22 - 8 . 2) 2 . 325 - Albumi n corrected Baseline (2 .15 - 2 . 13 L serum calci um 2 . 55) (mmol/L) - Week 4 (2 .15 - 2 . 20
2 . 55) - Albumi n corrected - Baseline (2 .15 - 2 . 68 H serum calci um 2 . 55) (mmol/L) - Week 4 (2 .15 - 2 . 58 H
2 . 55) - Follow- up (2 .15 - 2 . 58 H 2 . 55) - Calcium/Creatinine - Baseline (0 .3 - 6 . 1) 53 . 325 H
(mmol/g) - Week 4 (0 .3 - 6 . 1) 66 . 675 H
I - Calcium/Creatinine - Baseline (0 .3 - 6 . 1) 1 . 700 (mmol/g) - Week 4 (0 .3 - 6 . 1) 7 . 325 H
ehicle
I - Calcium/Creatinine - Baseline (0 .3 - 6 . 1) 8 . 700 H (mmol/g) - Week 4 (0 .3 - 6 . 1) 7 . 500 H
13DEC13:14:0 9 :26 LPOOS3 1001 t 22outsi de.doc Cont i nued .. .
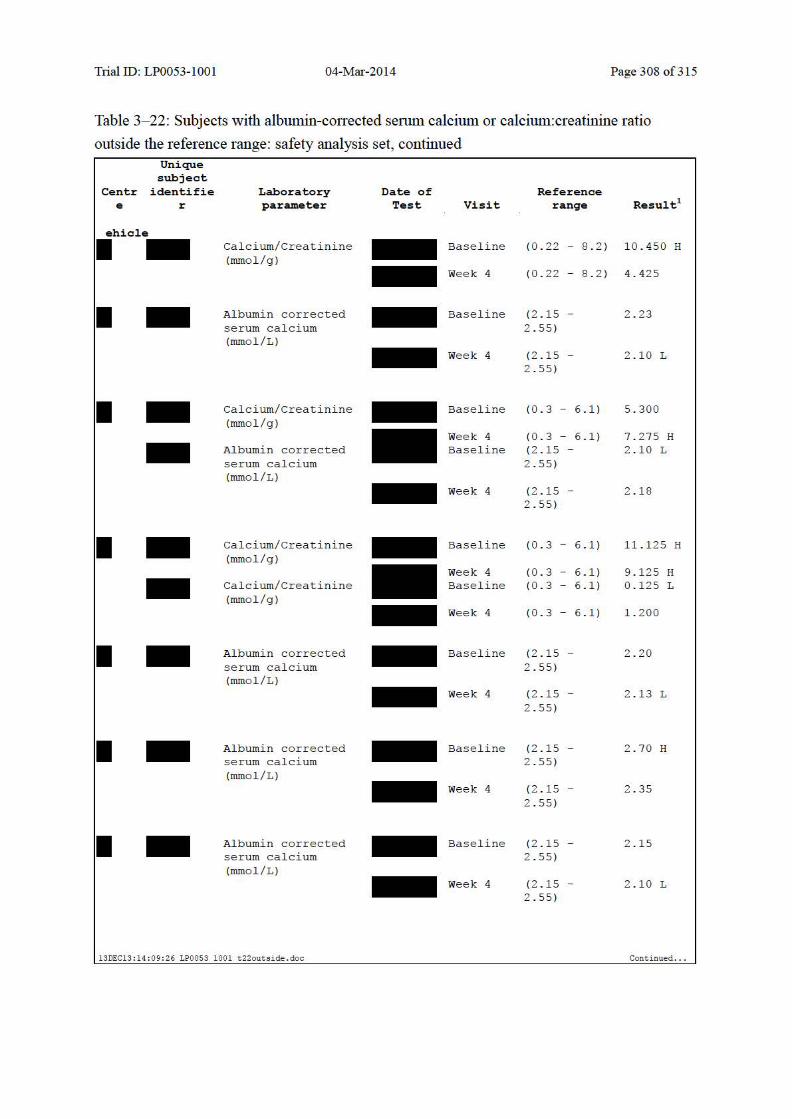
Trial ID: LP0053-1001 04-Mar-2014 Page 308 of 315
Table 3- 22: Subjects with albumin-con ected sennn calcium or calcium: creatinine ratio
outside the reference range: safety analysis set, continued Uni que subje ct
Ce ntr ident ifi e Laboratory Da t e o f Re ference e r parame t er Test Vi sit range Result1
ehicle
I - Calcium/Creatinine - Baseli ne (0 .22 - 8 . 2) 1 0 . 450 H (mmol/g) - Week 4 (0 .22 - 8 . 2) 4 . 425
I - Albumi n corrected - Baseli ne (2 .15 - 2 . 23 serum calci um 2 . 55) (mmol/L) - Week 4 (2 .15 - 2 . 10 L
2 . 55)
I - Calcium/Creatinine - Baseline (0 .3 - 6 . 1) 5 . 300 (mmol/g)
Week 4 (0 .3 - 6 . 1) 7 . 275 H - Albumi n corrected Baseline (2 .15 - 2 . 10 L serum calci um 2 . 55) (mmol/L) - Week 4 (2 .15 - 2 . 18
2 . 55)
I - Calcium/Creatinine - Baseline (0 .3 - 6 . 1) 1 1.125 H (mmol/g)
Week 4 (0 .3 - 6 . 1) 9 . 125 H - Calcium/Creatinine Baseline (0 .3 - 6 . 1) 0 . 125 L (mmol/g) - Week 4 (0 .3 - 6 . 1) 1 . 200
I - Albumi n corrected - Baseline (2 .15 - 2 . 20 serum calci um 2 . 55) (mmol/L) - Week 4 (2 .15 - 2 . 13 L
2 . 55)
I - Albumi n corrected - Baseline (2 .15 - 2 . 70 H serum calci um 2 . 55) (mmol/L) - Week 4 (2 .15 - 2 . 35
2 . 55)
I - Albumi n corrected - Baseline (2 .15 - 2 . 15 serum calci um 2 . 55) (mmol/L) - Week 4 (2 .15 - 2 . 10 L
2 . 55)
13DEC13:14:09:26 LPOOS3 1001 t 22outsi de.doc Cont i nued .. .

Trial ID: LP0053-1001 04-Mar-2014 Page 309 of 315
Table 3- 22: Subjects with albumin-con ected sennn calcium or calcium: creatinine ratio
outside the reference range: safety analysis set, continued Uni que subje ct
Ce ntr ident ifi e Laboratory Da t e o f Re ference e r parame t er Test Vi sit range Result1
ehicle
I - Calcium/Creatinine - Baseli ne (0 . 3 - 6 . 1) 0 . 200 L (mmol/g) - Week 4 (0 . 3 - 6 . 1) 0 . 525
I - Albumi n cor rected - Baseli ne (2 .15 - 2 . 10 L serum calci um 2 . 55) (mmol/L) - Week 4 (2 .15 - 2 . 10 L
2 . 55)
I - Calcium/Creatinine - Baseline (0 .3 - 6 . 1) 4 . 200 (mmol/g)
Week 4 (0 .3 - 6 . 1) 6 . 300 H - Calcium/Creatinine Baseline (0 .3 - 6 . 1) 1 . 750 (mmol/g) - Week 4 (0 .3 - 6 . 1) 0 . 225 L
I - Albumi n cor rected - Baseline (2 .15 - 2 . 13 L serum calci um 2 . 55) (mmol/L) - Week 4 (2 .15 - 2 . 10 L
2 . 55)
13DEC13:14 : 0 9 : 26 LP00 53 1001 t.22out.si de.doc
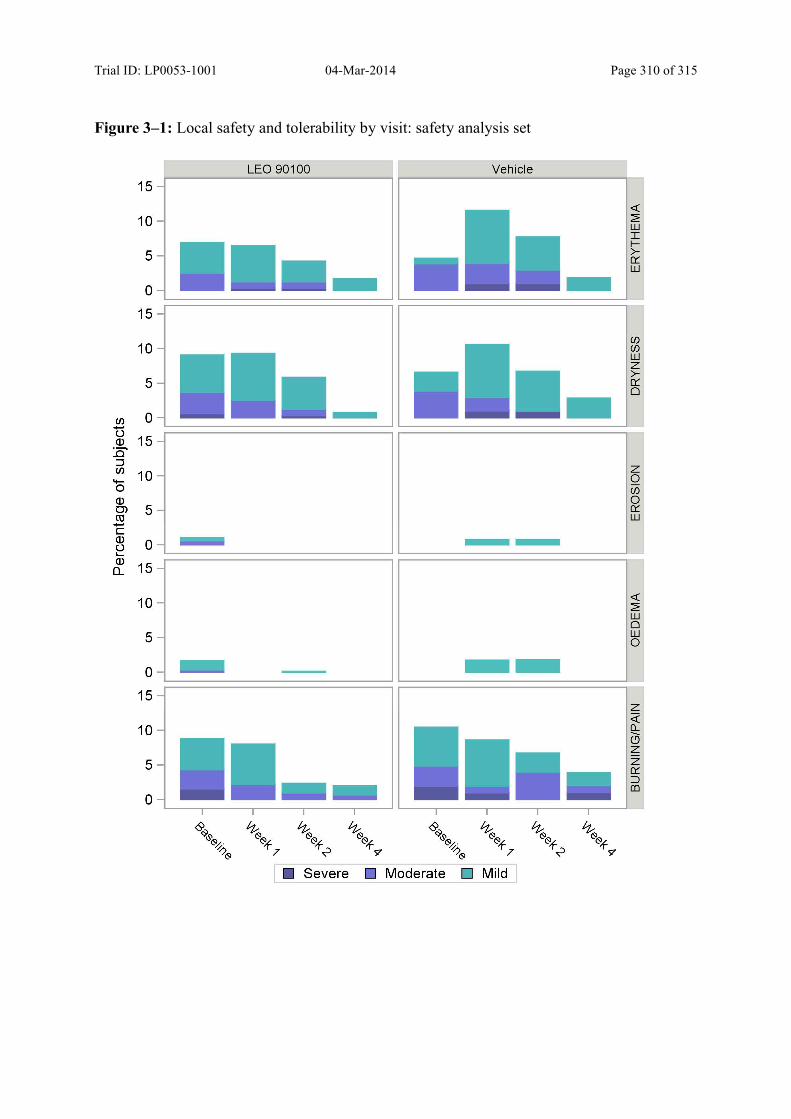
Trial ID: LP0053-1001 04-Mar-2014 Page 310 of 315
Figure 3–1: Local safety and tolerability by visit: safety analysis set
15 -
10 -
5 -
0 -
15 -
10 -
5 -
en 0 -...... ()
15 -Q)
E ::::l en 10 -'+-0 Q) 0) 5 -co ...... c Q) 0 -() I-Q)
15 -D...
10 -
5 -
0 -
15 -
10 -
5 -
0 -
LEO 90100 Vehicle
• Severe • Moderate D Mild
-
<( ~ w I I>-0::: w
(/) (/) w z >-0::: 0
z 0 (/)
0 0::: w
<( ~ w 0 w 0
z <{ 0... (5 z z 0::: ::J en

Trial ID: LP0053-1001 04-Mar-2014 Page 311 of 315
0 End-of-Text Listings
Trial ID: LP0053-1001 04-Mar-2014 Page 312 of 315
Table of Contents
0-1 Subjects Withdrawn due to AE .........................................................................................................................................................................313
0-2 Deaths..............................................................................................................................................................................................................................314
0-3 Serious Adverse Events .......................................................................................................................................................................................315
Treatment group=LEO 90100..........................................................................................................................................................................................315
Trial ID: LP0053-1001 04-Mar-2014 Page 313 of 315
Listing 0-1: Subjects Withdrawn due to AE
Date of program execution Empty List04FEB2014:09:16:12 No data for this listing
04FEB2014:09:16:12 Programs-Listings empty Page 313 of 5
Trial ID: LP0053-1001 04-Mar-2014 Page 314 of 315
Listing 0-2: Deaths
Date of program execution Empty List04FEB2014:09:16:12 No data for this listing
04FEB2014:09:16:12 Programs-Listings ae(where=aeout='FATAL') Page 314 of 5

Trial ID: LP0053-1001
Listing 0-3 : Serious Adverse Events
Treatment group=LEO 90100
Centre/ Subjec t ID Location
•
Preferred term/ rted term
BIPOLAR DI SORDER/ Bipo l ar d i sorder exac erb ati on
SUBSTANCE- INDUCED PSYCHOTIC DISORDER/ Acute psychiatric event with drug overdose
04-Mar-2014
Duratio n
-04FEB2014 : 09 :1 6:12 PrograJDS-Listinqs a e 1001 (where=first(upcase(aeser) ) = 'Y' )
Rela- In ten-tion s Not Severe rel ated
Not Severe rel ated
Page 315 of315
Action taken Days since with Other first/ lates study a c tion Seriou t
taken Outcome s dose Dose not Concomi ta Recovered Yes 28/15 changed nt
medicatio n
Drug None Unknown Yes 21/6 withdrawn
Page 315 o f 5