clive bates presentation at tma 2015
TRANSCRIPT

Tobacco Harm Reduction the Public Health Benefits
TMA Centenary Meeting8.30am Tuesday 19th May 2015
Clive BatesCounterfactual
www.clivebates.com

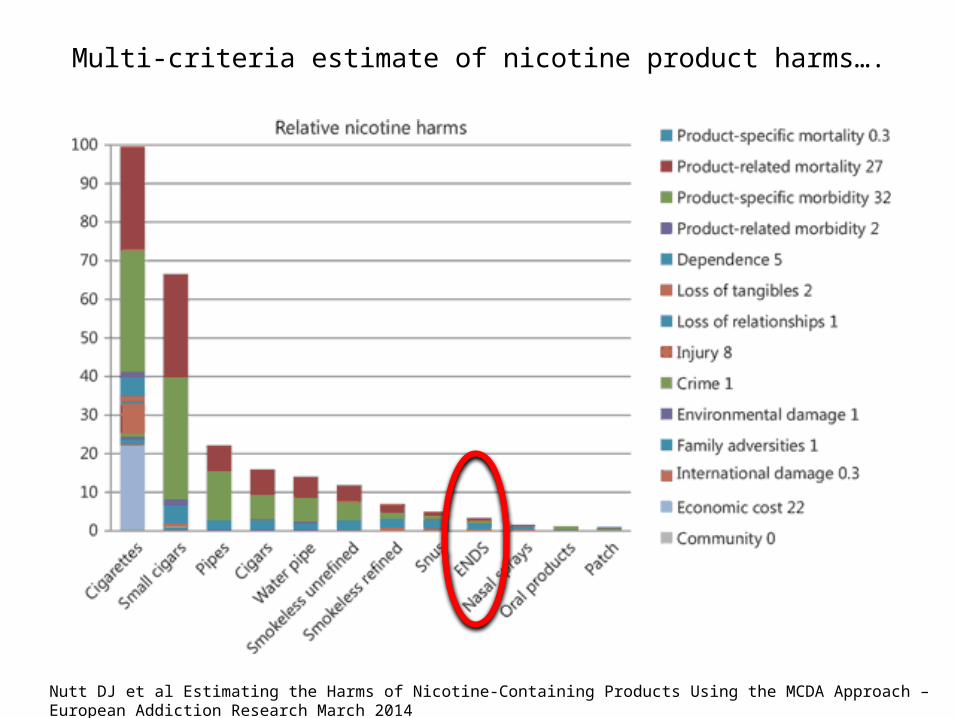
Multi-criteria estimate of nicotine product harms….
Nutt DJ et al Estimating the Harms of Nicotine-Containing Products Using the MCDA Approach – European Addiction Research March 2014

Harm reduction categories – risk continuum?
Cigarettes Smokeless E-cigs NRT0
20
40
60
80
100
120
Crud
e es
timat
e of
risk
– C
igs
= 10
0
From analysis of the constituents of e-cigarette vapour, e-cigarette use from popular brands can be expected to be at least 20 times safer (and probably considerably more so) than smoking tobacco cigarettes in terms of long-term health risksProfessor Robert WestProfessor Ann McNeillProfessor Peter HajekDr Jamie BrownMs Deborah Arnott

Value proposition: a smokers’ cost-benefit analysis
1. Keep smoking
Benefit: nicotine, sensory, taste, ritual, brand-related
Cost: illness, money, stigma, addiction
2. Quit smoking
Benefit: avoid smoking harm, take control, cash savings
Cost: withdrawal, craving, sustained willpower, lost smoking benefits
3. Switch to e-cigs
Benefit: most smoking benefits*, no/minor smoking harms, personalisation, buzz, cash saving
Cost: addiction?
* Full benefits – subject to continued innovation
“Quit or die”

I smoked for 45 years and tried every NRT product available, none of them worked. I continued to smoke even though my health was getting worse, resulting in emphysema and using oxygen daily.
September 2011 I discovered e-cigarettes and they worked. It was like someone handed me a miracle. In less than a week I stopped using regular cigarettes. I haven’t had a tobacco cigarette since.
Unsolicited comment left on www.clivebates.com

10 years of life
Doll R et al. BMJ 2004;328:1519

The Big Picture

Global cigarette consumption - still rising
Data source: Ng M, Freeman MK, Fleming TD, et al. Smoking prevalence and cigarette consumption in 187 countries, 1980-2012. JAMA 2014; 311: 183–92.
19801982
19841986
19881990
19921994
19961998
20002002
20042006
20082010
2012 -
1,000
2,000
3,000
4,000
5,000
6,000
7,000
Global cigarette consumption 1980-2012
Billi
on p
iece
s
Developing countries
Developed countries

The Lancet – March 2015
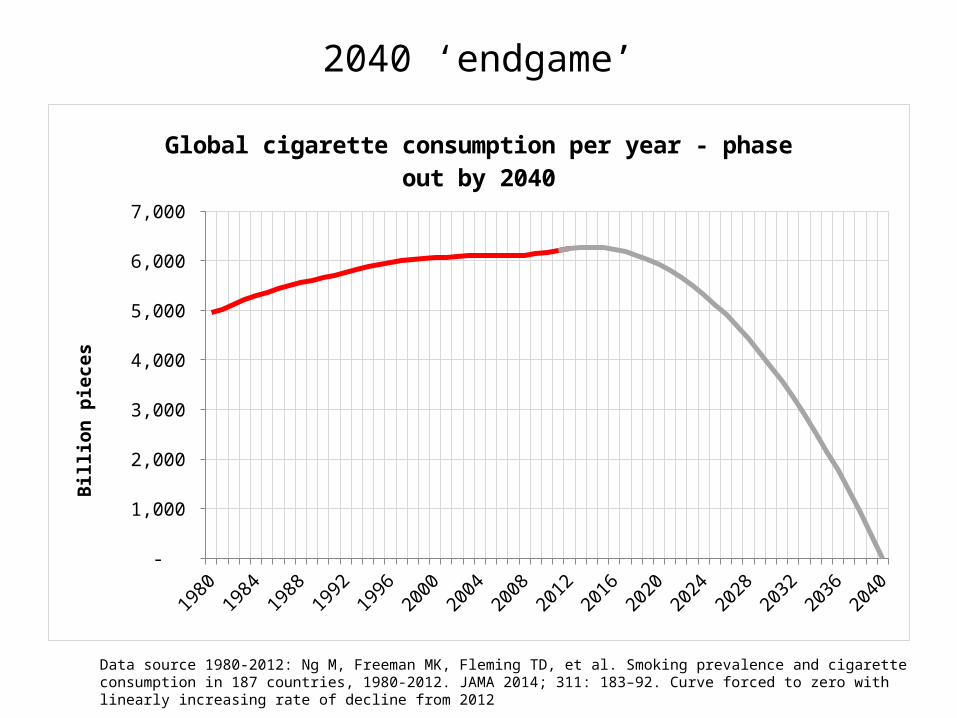
2040 ‘endgame’
Data source 1980-2012: Ng M, Freeman MK, Fleming TD, et al. Smoking prevalence and cigarette consumption in 187 countries, 1980-2012. JAMA 2014; 311: 183–92. Curve forced to zero with linearly increasing rate of decline from 2012
19801983
19861989
19921995
19982001
20042007
20102013
20162019
20222025
20282031
20342037
2040 -
1,000
2,000
3,000
4,000
5,000
6,000
7,000
Global cigarette consumption per year - phase out by 2040
Billi
on p
iece
s

Global cigarette consumption – trend to 2030
Data source: Ng M, Freeman MK, Fleming TD, et al. Smoking prevalence and cigarette consumption in 187 countries, 1980-2012. JAMA 2014; 311: 183–92.
19801982
19841986
19881990
19921994
19961998
20002002
20042006
20082010
20122014
20162018
20202022
20242026
20282030
-
1,000
2,000
3,000
4,000
5,000
6,000
7,000
8,000
f(x) = − 1.0885895413884 x² + 90.2145845141575 x + 2525.92595307918R² = 0.996217080527582
f(x) = − 0.373689285098205 x² − 3.79556698045781 x + 2363.00806451613R² = 0.984255731677563
f(x) = − 1.46227882648661 x² + 86.4190175336997 x + 4888.93401759531R² = 0.993220971257086
Global cigarette consumption and trends – parabolic trend
Billi
on p
iece
s
Global
Developed countries
Developing countries

Cigarette global consumption trend projection to 2030
Consumption 2010-2030 on parabolic trend projection from 1908-2012 data from Ng M, Freeman MK, Fleming TD, et al. Smoking prevalence and cigarette consumption in 187 countries, 1980-2012. JAMA 2014; 311: 183–92.
20102011
20122013
20142015
20162017
20182019
20202021
20222023
20242025
20262027
20282029
2030 -
1,000
2,000
3,000
4,000
5,000
6,000
7,000
Global cigarette consumption 2010-2030 - on trend
Billi
on p
iece
s
Global cigarette consumption
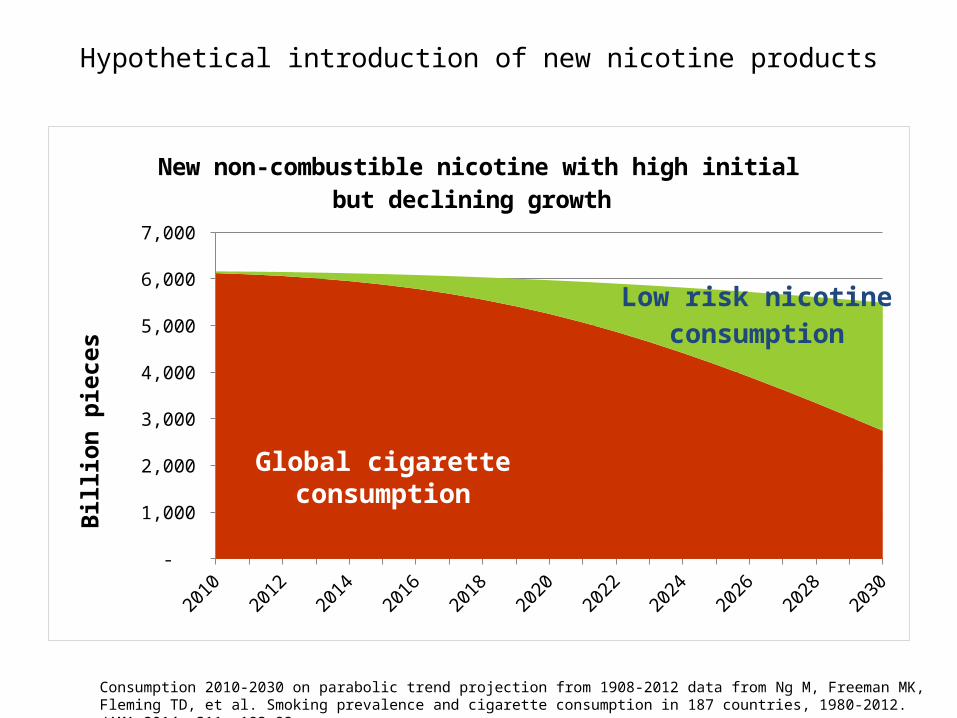
Hypothetical introduction of new nicotine products
Consumption 2010-2030 on parabolic trend projection from 1908-2012 data from Ng M, Freeman MK, Fleming TD, et al. Smoking prevalence and cigarette consumption in 187 countries, 1980-2012. JAMA 2014; 311: 183–92.
20102011
20122013
20142015
20162017
20182019
20202021
20222023
20242025
20262027
20282029
2030 -
1,000
2,000
3,000
4,000
5,000
6,000
7,000
New non-combustible nicotine with high initial but declining growth
Billi
on p
iece
s
Low risk nicotineconsumption
Global cigarette consumption

Hypothetical introduction of new nicotine products
Consumption 2010-2030 on parabolic trend projection from 1908-2012 data from Ng M, Freeman MK, Fleming TD, et al. Smoking prevalence and cigarette consumption in 187 countries, 1980-2012. JAMA 2014; 311: 183–92.
20102011
20122013
20142015
20162017
20182019
20202021
20222023
20242025
20262027
20282029
2030 -
1,000
2,000
3,000
4,000
5,000
6,000
7,000
New non-combustible nicotine with high initial but declining growth
Billi
on p
iece
s
This boundary is harder to move.
This boundary is easier to move.


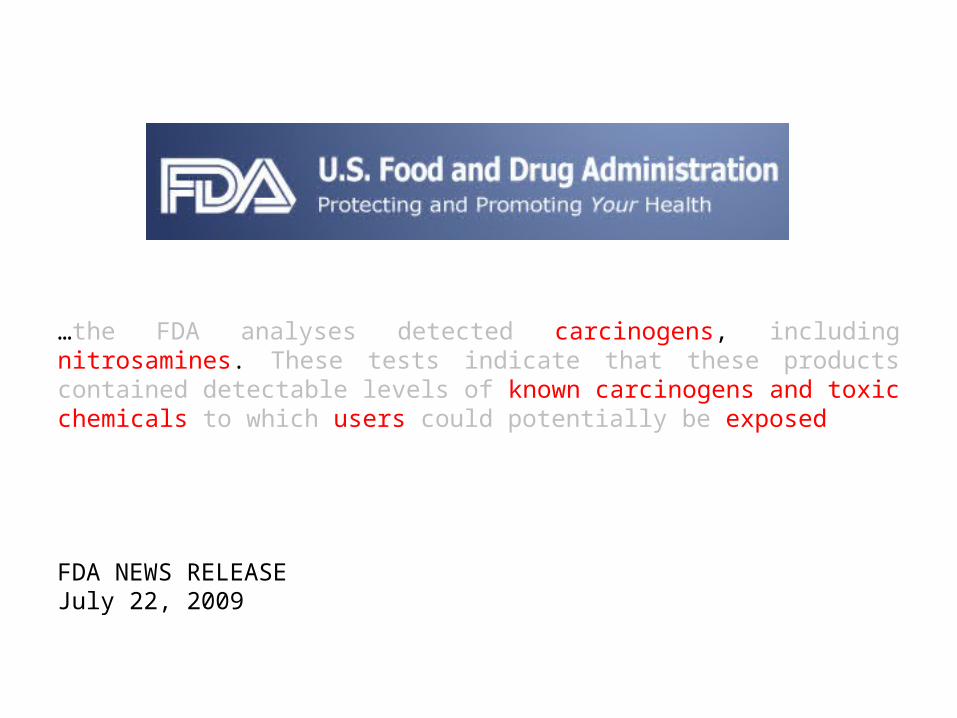
Anatomy of a moral panic 1
CANCER

…the FDA analyses detected carcinogens, including nitrosamines. These tests indicate that these products contained detectable levels of known carcinogens and toxic chemicals to which users could potentially be exposed
FDA NEWS RELEASEJuly 22, 2009
…the FDA analyses detected carcinogens, including nitrosamines. These tests indicate that these products contained detectable levels of known carcinogens and toxic chemicals to which users could potentially be exposed
FDA NEWS RELEASEJuly 22, 2009

The dose makes the poison
Total nitrosamines
(ng)
Daily exposure
(ng)Ratio to
e-cigarettes
E-cigarette per ml 13 52 1.00
Nicotine gum per piece 2 48 0.92
Winston per stick 3,365 50,475 971
Newport 3,885 50,775 976
Marlboro 6,260 93,900 1,806
Camel 5,191 77,865 1,497
Levels of nitrosamines found in electronic and tobacco cigarettes
Source: Farsalinos KE, Polosa R. Safety evaluation and risk assessment of electronic cigarettes as tobacco cigarette substitutes: a systematic review. Ther Adv drug Saf 2014;5:67–86 0 Table 3.

Anatomy of a moral panic 2
POISON

What’s your poison?
In 2013, AAPCC found 1,414 reported exposures to either e-cigarette devices or liquid nicotine; through March 24, 2014, there have been 651 reported exposures.

Reports of nicotine exposure rising rapidly!!
The term "exposure" means someone has had contact with the substance in some way; for example, ingested, inhaled, absorbed by the skin or eyes, etc. Not all exposures are poisonings or overdoses.
2011 2012 2013 2014 -
1,000
2,000
3,000
4,000
5,000
271 460
1,543
3,957
E-cigarette Device and Liquid Nicotine Reported Exposures to US Poison Centers
Source: American Association of Poison Control Centres AAPCC - 2015
“Poisoning incidents … jumped by 156% from 2013 to 2014 and have increased more than 14
fold since 2011”Matthew Myers CTFK

But e-cigs and liquids are a tiny fraction of reports
E-cigs &
liquids 2
013
E-cigs a
nd liquids 2
014
Analgesics
Cosmetics
Cleaning substa
nces
Sedatives
Antidepressants
Foreign bodies
Cardiovascu
lar dru
gs
Antihistamines
Topical p
reps
Pesticid
es
Alcohols
-
50,000
100,000
150,000
200,000
250,000
300,000
350,000
Exposure reports (US 2013)Total = 2,596,915
2013 Annual Report of the American Association of Poison Control Centers ’ National Poison Data System (Table 17A)
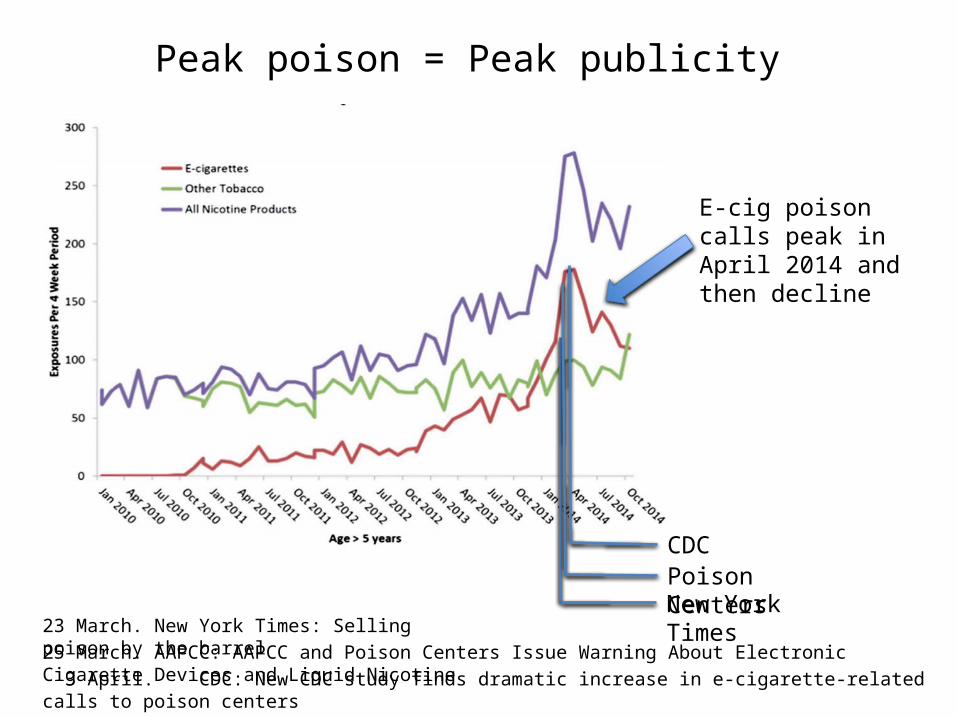
Peak poison = Peak publicity
New York TimesPoison CentersCDC
23 March. New York Times: Selling poison by the barrel25 March. AAPCC: AAPCC and Poison Centers Issue Warning About Electronic Cigarette Devices and Liquid Nicotine 3 April. CDC: New CDC study finds dramatic increase in e-cigarette-related calls to poison centers
E-cig poison calls peak in April 2014 and then decline
Anatomy of a moral panic 3
CHILDREN

CDC announcement 6 September 2013
“E-cigarette use more than doubles among U.S. middle and high school students from 2011-2012”CDC Press release
"The increased use of e-cigarettes by teens is deeply troubling. Nicotine is a highly addictive drug. Many teens who start with e-cigarettes may be condemned to struggling with a lifelong addiction to nicotine and conventional cigarettes.”Tom Frieden, CDC Director
“These data show a dramatic rise in usage of e-cigarettes by youth, and this is cause for great concern as we don’t yet understand the long-term effects of these novel tobacco products.”Mitch Zeller, Director of FDA Center for Tobacco Products
CDC Press release 5 September 2013

Bold claim: use doubles to 1.78m
2011 2012 2011 2012Middle School (age 11-14) High School (age 14-18)
0
2
4
6
8
10
12
14
16
18
E-cigarette 'ever use' doubles in US adolescents
Ever used e-cigs
CDC National Youth Tobacco Survey 2012 (US data: Septemeber 2013)
Perc
ent e
ver u
sed

But most were not ‘current users’ (last 30 days)
2011 2012 2011 2012Middle School (age 11-14) High School (age 14-18)
0
2
4
6
8
10
12
14
16
18
E-cigarette 'current user' prevalence in US adolescents
E-cigarette users
CDC National Youth Tobacco Survey 2012 (US data: Septemeber 2013)
Perc
enta
ge u
sing
in la
st 3
0 da
ys

Separated publication of the e-cig and smoking data 2013
10 weeks

But most were not ‘current users’ (last 30 days)
2011 2012 2011 2012Middle School (age 11-14) High School (age 14-18)
0
2
4
6
8
10
12
14
16
18
E-cigarette 'current user' prevalence in US adolescents
E-cigarette users
CDC National Youth Tobacco Survey 2012 (US data: Septemeber 2013)
Perc
enta
ge u
sing
in la
st 3
0 da
ys
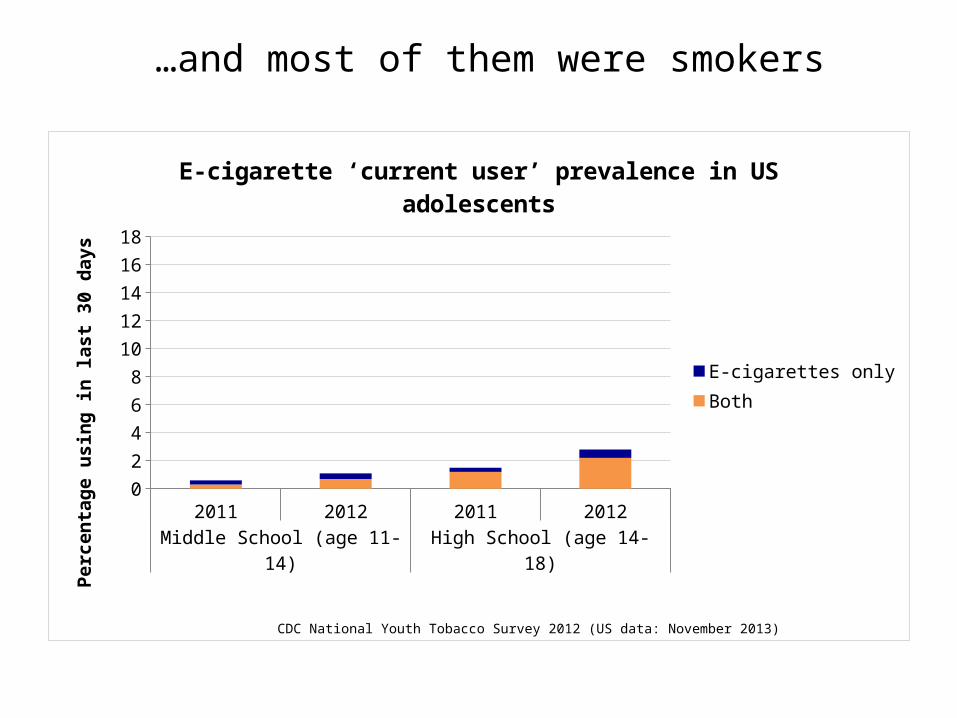
…and most of them were smokers
2011 2012 2011 2012Middle School (age 11-14) High School (age 14-18)
0
2
4
6
8
10
12
14
16
18
E-cigarette ‘current user’ prevalence in US adolescents
E-cigarettes onlyBoth
CDC National Youth Tobacco Survey 2012 (US data: November 2013)
Perc
enta
ge u
sing
in la
st 3
0 da
ys

…and don’t mention the smoking
2011 2012 2011 2012Middle School (age 11-14) High School (age 14-18)
0
2
4
6
8
10
12
14
16
18
4.02.8
14.6
11.8
0.30.7
1.2
2.2
0.30.4
0.3
0.6
Cigarette and e-cigarette use among US school students 2011-12
E-cigarettes onlyBothCigarettes
Perc
enta
ge u
sing
in th
e la
st 3
0 da
ys
Sources: Raw data from CDC National Youth Tobacco Surveys 2012-13. Analysis and graphic by Brad Rodu

E-cigarette growth coincides with decline in smoking
2011 2012 2013 2011 2012 2013Middle-School Students High-School Students
0
2
4
6
8
10
12
14
16
18
4 2.8 2.4
14.6
11.8
9.70.3 0.70.5
1.2
2.2
3
0.30.4 0.6
0.3
0.6
1.3
Cigarette and e-cigarette use among US school students 2011-13
E-cigarettes onlyBothCigarettes
Perc
enta
ge u
sing
in th
e la
st 3
0 da
ys
Sources: Raw data from CDC National Youth Tobacco Surveys 2012-13. Analysis and graphic by Brad Rodu

Anatomy of a moral panic 4
HIDDEN FORMALDEHYDE

Launching a panic

Media storm 22 January 2015
• Reuters: Ramping up e-cigarette voltage produces more formaldehyde -study
• LA Times E-cigarettes can produce more formaldehyde than regular cigarettes, study says
• NPR: E-Cigarettes Can Churn Out High Levels Of Formaldehyde
• NBC news: Before You Vape: High levels of Formaldehyde Hidden in E-Cigs
• CBS News: E-cigarette vapor filled with cancer-causing chemicals, researchers say
• Wall Street Journal: Study Links E-Cigarettes to Formaldehyde, Cancer Risk
• South China Morning Post: E-cigarettes 'expose smokers to more formaldehyde than regular tobacco'
• Mail Online: Some e-cigarettes may release more of a cancer-causing chemical than regular tobacco, study suggests
• Consumer Health Day: High Levels of Cancer-Linked Chemical in E-Cigarette Vapor, Study Finds
• Buzzfeed: Study Finds E-Cigs Produce More Formaldehyde Than Regular Cigarettes
• News Everyday: Vaping worse than smoking, formaldehyde study
• Huffington Post (UK): Is Vaping Safe? Cancer-Causing Substance 'Formaldehyde' Hidden In E-Cigarettes
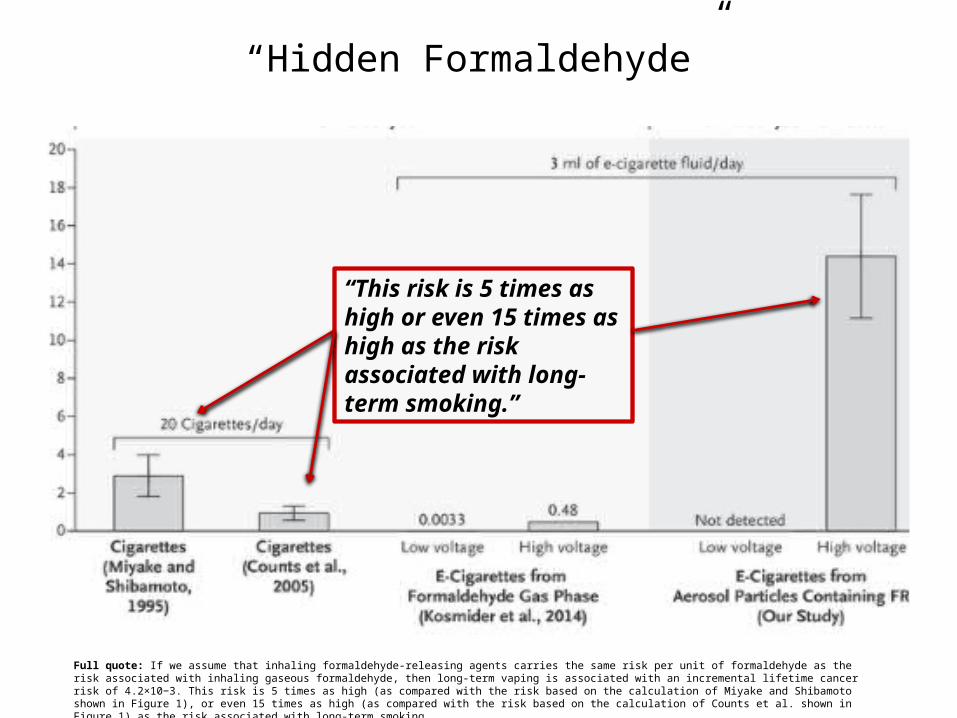
“Hidden Formaldehyde”
“This risk is 5 times as high or even 15 times as high as the risk associated with long-term smoking.”
Full quote: If we assume that inhaling formaldehyde-releasing agents carries the same risk per unit of formaldehyde as the risk associated with inhaling gaseous formaldehyde, then long-term vaping is associated with an incremental lifetime cancer risk of 4.2×10⁻³. This risk is 5 times as high (as compared with the risk based on the calculation of Miyake and Shibamoto shown in Figure 1), or even 15 times as high (as compared with the risk based on the calculation of Counts et al. shown in Figure 1) as the risk associated with long-term smoking.

About as clever as…
Anatomy of a moral panic 5
KIDDIE FLAVOURS
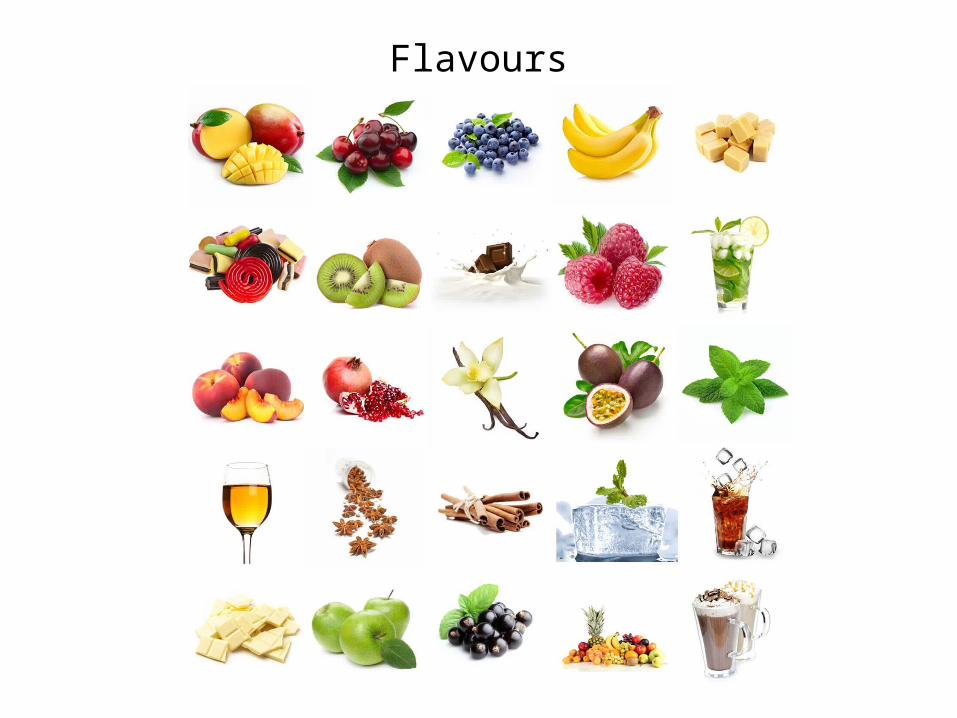
Flavours

Did anyone ask the kids?
Shiffman S, Sembower MA, Pillitteri JL, Gerlach KK, Gitchell JG. The impact of flavor descriptors on nonsmoking teens’ and adult smokers' interest in electronic cigarettes. Nicotine Tob Res 2015
Participants indicated their interest (0-10 scale) in e-cigarettes paired with various flavor descriptors

Panic attack!!

Changing perceptions – for the worse
Pulmonary inflammation
Lipoid pneumonia
Third hand nicotine
Ultrafine particles
Blindness
Anti-freeze
PoisoningsGateway
10x Formaldehyde!

WE JUST DON’T
KNOW!!!
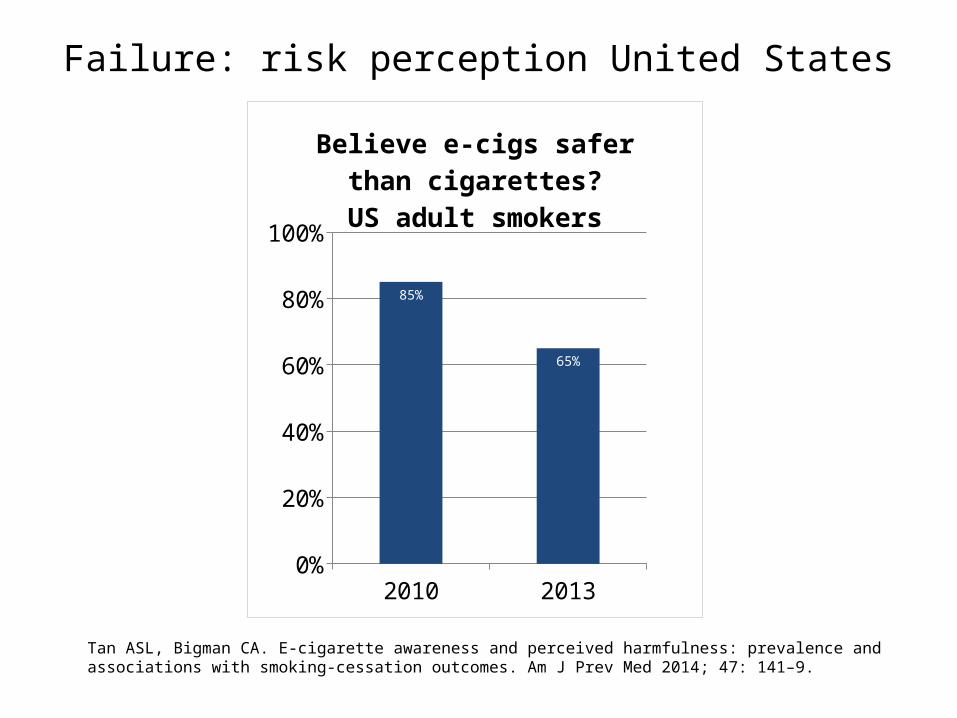
Failure: risk perception United States
2010 20130%
20%
40%
60%
80%
100%
85%
65%
Believe e-cigs safer than cig-arettes?
US adult smokers
Tan ASL, Bigman CA. E-cigarette awareness and perceived harmfulness: prevalence and associations with smoking-cessation outcomes. Am J Prev Med 2014; 47: 141–9.
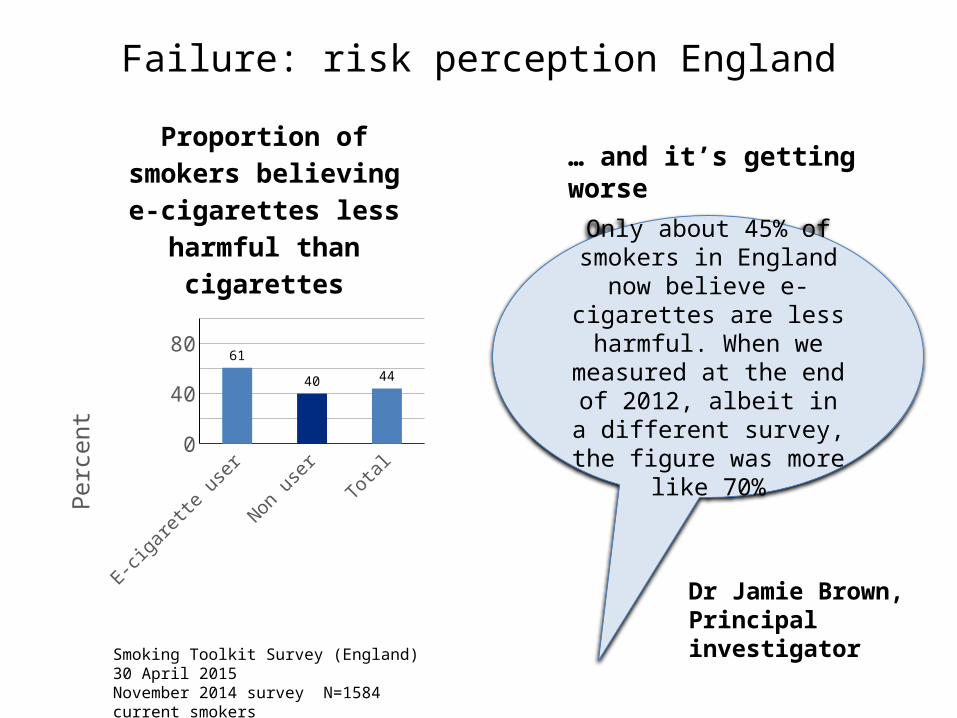
Failure: risk perception England
E-cigarette user
Non user Total0
20
40
60
80
100
61
4044
Proportion of smokers be-lieving e-cigarettes less harmful than cigarettes
Perc
ent
Smoking Toolkit Survey (England) 30 April 2015November 2014 survey N=1584 current smokers
Only about 45% of smokers in England now believe e-
cigarettes are less harmful. When we measured at the
end of 2012, albeit in a different survey, the figure
was more like 70%
… and it’s getting worse
Dr Jamie Brown, Principal investigator

Worsening trend among young British smokers
Perceived e-cig risk in young British smokers
Trends in electronic cigarette use in young people in Great Britain over 2013-2014 Arnott, Britton, Cheeseman, Dockrell, Eastwood, Jarvis, & McNeill ASH, CR-UK, PHE 2014

49
A LOT M
ORE harmful
MORE harm
ful
JUST AS harm
ful
LESS harm
ful
A LOT LE
SS harmful
Completely harmless
Don’t know
0%
5%
10%
15%
20%
25%
30%
35%
40%
1% 1%
14%
35%
17%
2%
30%
Do you think electronic cigarettes are more, less or as harmful as regular cigarettes?
Total sample size was 12269 adults. Fieldwork was undertaken by YouGov between 5th to 14th March 2014 . The survey was carried out online. The figures have been weighted and are representative of all GB adults (aged 18+).
Data from

50
A LOT M
ORE harmful
MORE harm
ful
JUST AS harm
ful
LESS harm
ful
A LOT LE
SS harmful
Completely harmless
Don’t know
0%
5%
10%
15%
20%
25%
30%
35%
40%
1% 1%
14%
35%
17%
2%
30%
Do you think electronic cigarettes are more, less or as harmful as regular cigarettes?
Total sample size was 12269 adults. Fieldwork was undertaken by YouGov between 5th to 14th March 2014 . The survey was carried out online. The figures have been weighted and are representative of all GB adults (aged 18+).
Data from

51
2011-2
2011-3
2011-4
2012-1
2012-2
2012-3
2012-4
2013-1
2013-2
2013-3
2013-4
2014-1
2014-2
2014-3
2014-4
2015-10
5
10
15
20
25
Prevalence of electronic cigarette use: smokers and recent ex-smokers (England)
Perc
enta
ge o
f sm
oker
s and
rece
nt e
x-sm
oker
s
Any
Daily
Source: Smoking Toolkit Study, April 2015
N=16529 adults who smoke or who stopped in the past year; increase p<0.001
Huge public health potential by 2040… if….
• 25 years innovation
• Regulation & policy that enhances value proposition
• True and fair presentation of risk and science
• Pressure on smoking
• New accountability in public health
• From moral panic to moral imperative