cloud alpha - ichimokutrade.com · cloud alpha ... there are those that turn to friends’...
TRANSCRIPT

IN THIS ISSUE
Testing Your Future..................................1
Global Market Update.............................2 Trending Global Stock Markets, US Stock Market, VIX Volatility Index, 30 Yr Bonds, Crude Oil, Gold, Germany, China, Japan, Russia, India, Brazil, Mexico, Middle East - Kuwait
Colquitt’s Corner.......................................9
Seasonal Trades......................................10
Futures Update.......................................11
What’s on the Buffet in May?..................11
Cloud Alphawww.ichimokutrade.com
© EII CapitalVolume 2, No. 5 May 1st, 2016
Testing Your Future
Any true trader worth their salt has long ago learned the les-son against making absolute prophesies to themselves or in public. When one has a sentiment or forecast it is often
best to speak in terms of possibilities, probabilities, and subtlety. For the uninitiated to the markets a statement of fact made by someone perceived to be of authority can be taken as gospel and acted upon to much disaster. When one enters the market based solely upon the espoused expertise of another and loses money their anger then has a target. Despite the fact that the amateur trader was the one that decided to act on another’s opinion and manually performed the action of clicking to execute the trade there is little to no introspection or knowledge gained. This is the fundamental danger far more costly than the capital lost. Despite this reality there is a vast cottage industry of ex-perts and pundits that make their living rendering analysis and dispensing tips. Those without the patience to learn the art and craft of trading eat up this media much to their disservice. Then there are those that turn to friends’ perspectives which can be even worse. On the Showtime drama series “Billions,” which I high-ly enjoy and whose characters must have been drawn from con-sulting real traders, this occurrence played out as a subplot on one episode where an average Joe surreptitiously overhears his hedge fund manager friend place a trade over the phone. The average Joe bets big on this tip, leverages himself to the max, and is soon facing a margin call. He turns to the hedge fund manager in des-peration for advice. The manager asks him how much he needs to cover the margin adding “how much is our friendship worth?” Ultimately there is no 100% certainty on a trade. Even if the tip turns out to be right an outsider cannot know 100% of the execution which can make all the difference between winning and losing. There is nothing to learn for oneself if a trade is won or lost based on advice. The only real gains to be had are utter dependence or animosity to a trusted friend or talking head (who is not going to lose his job as long as he keeps rattling out more advice in an entertaining way). Let’s assume for a moment that a person rendering trad-ing advice presents their track record. They may advertise some-thing like a 90% winning percentage and have the track record to prove it. People may taut such a record as an accomplishment but it’s really not. One can do anything with options. I have a soft-ware engineer friend that works on the backend of the Options market at a company that processes Options pricing data from the exchanges to trading firms and retail trading platforms. He was
Page 1
Email for Information:[email protected]
Follow Us On Twitter!@ichimokutrading
Telephone:(646)863-9620

Page 2
convinced that given enough computing power he could create a perfect Options trading system. I in-dulged his fantasy and showed him two ways to go about this. I first proved I could eliminate all risk while at the same time eliminating all reward minus commis-sions to provide a small net loss. I then showed how I could create a 95% winning rate with tiny, consistent re-wards until it blew up the capital when exposed to Au-gust 2015. He finally listened and abandoned his pur-suit for the “perfect” Options pricing automated trading strategy. The best strategy is going to be one with supe-rior reward to risk ratio but will sacrifice probability to achieve it. The starting point for a true winning strate-gy should be a goal of at least 3 to 1 reward to risk and a 30% winning ratio. To those that think that 30% is shockingly low remember that with 3 to 1 your baseline for breakeven is 25% winning such that every one win takes care of the 75% of losing trades. To those that im-mediately accept that the math makes sense and they are confident such a system is one they can stomach let me show you what such a system looks like in reality.
Ultimately, the hypothetical situation above if executed faithfully would turn a profit. The real ques-tion though is; for how many losing trades and over what amount of time could one continue their rigor? Such a system of low relative risk to reward has a very small chance of catastrophic loss. Still, many traders gravitate to the more emotionally satisfying models of high win percentages at the threat of losing it all on a Black Swan Event. Fortunately there is a simple solution to make the truly best trading system work for you. That solution is time consuming, grinding, and painstaking. The solution is testing. Backtesting takes you above the
emotional ups and downs of markets and reminds you that what you are doing works if you just stick to the plan. Doing the work yourself is tremendously harder than taking someone else’s word from a tip. That work is not just about producing data to pore over and crunch. The real value is the process itself. The same mind, eyes, and fingers that are put through the motions then act with confidence to see the opportunity and press the button to execute the plan that they so rigorously proved as a path to success.
-Wes Bennett
I’m very big on having clarified principles. I don’t believe in being reactive.
You can’t do that in the markets. I can’t.I need perspective. I need a game plan.
-Ray Dalio
Global Market Update
In this section, we will cover some of the Global Stock Markets.
Trending Global Stock MarketIn this section, we are going to outline all the Global mar-kets that are trending either bullish or bearish. The “Dir” column illustrates the sentiment for the Stock market.
Table 1 shows all the Global Stock Markets that are trend-ing on Daily timeframe. Notice, the list is smaller for the Bullish countries than last month.
Table 1a: Ichimokutrade RT Scanner: Last Month Daily Bullish/Bearish Trends

Page 3
Table 1b: Ichimokutrade RT Scanner: Current Daily Bullish/Bearish Trends
Table 2 shows all the Global Stock Markets that are trend-ing on Weekly timeframe.
Table 2a: Ichimokutrade RT Scanner: Last Month Weekly Bullish/Bearish Trends
Table 2b: Ichimokutrade RT Scanner: Current Weekly Bullish/Bearish Trends
Table 3 shows all the Global Stock Markets that are trend-ing on Monthly timeframe. More countries entered a long term bullish sentiment. Not a huge number but at least it was some. This was due to the fact that the daily and weekly time frames had more countries turn bullish.
Table 3a: Ichimokutrade RT Scanner: Last Month Monthly Bullish/Bearish Trends
Table 3b: Ichimokutrade RT Scanner: Current Monthly Bullish/Bearish Trends
Table 4 shows the Global Stock markets that are bullish on all time frames. A lot of new countries just entered the list. Let’s see if they can stay on this list for another month. We look for countries to remain bullish for at least 2 months in order to classify them as bullish.
Table 4a: Ichimokutrade RT Scanner: CurrentDaily/Weekly/Monthly Bullish Trends
Table 4b: Ichimokutrade RT Scanner: Last Month Daily/Weekly/Monthly Bullish Trends
Table 5 shows the Global Stock markets that are bearish on all time frames. Notice, there is no table for this month because there are no countries trending on all three time-frames. This is now three months in a row for no “true” trends in the Global markets.
US Stock Market
For the US Stock Market, we will analyze various instru-ments to give us a “complete” picture. The first instrument we will analyze is the E-Mini SP500 Futures. Figure 1 shows the monthly Ichimoku chart for E-mini SP500 futures. Since 2011, we have been on a nice long term bull-ish trend without a major pull back. The green 26-month support has been holding this trend. Nothing really ex-citing is going on. We continue to consolidate with the summer months ahead of us.
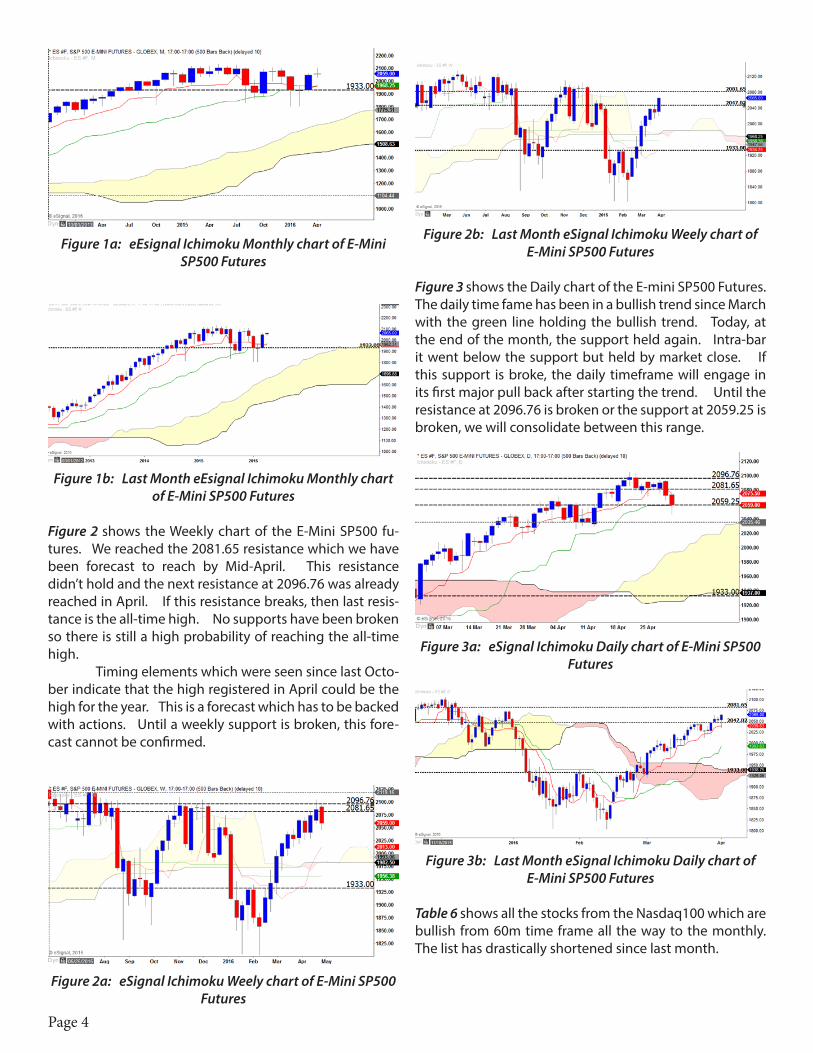
Figure 1a: eEsignal Ichimoku Monthly chart of E-Mini SP500 Futures
Figure 1b: Last Month eEsignal Ichimoku Monthly chart of E-Mini SP500 Futures
Figure 2 shows the Weekly chart of the E-Mini SP500 fu-tures. We reached the 2081.65 resistance which we have been forecast to reach by Mid-April. This resistance didn’t hold and the next resistance at 2096.76 was already reached in April. If this resistance breaks, then last resis-tance is the all-time high. No supports have been broken so there is still a high probability of reaching the all-time high. Timing elements which were seen since last Octo-ber indicate that the high registered in April could be the high for the year. This is a forecast which has to be backed with actions. Until a weekly support is broken, this fore-cast cannot be confirmed.
Figure 2a: eSignal Ichimoku Weely chart of E-Mini SP500 Futures
Figure 2b: Last Month eSignal Ichimoku Weely chart of E-Mini SP500 Futures
Figure 3 shows the Daily chart of the E-mini SP500 Futures. The daily time fame has been in a bullish trend since March with the green line holding the bullish trend. Today, at the end of the month, the support held again. Intra-bar it went below the support but held by market close. If this support is broke, the daily timeframe will engage in its first major pull back after starting the trend. Until the resistance at 2096.76 is broken or the support at 2059.25 is broken, we will consolidate between this range.
Figure 3a: eSignal Ichimoku Daily chart of E-Mini SP500 Futures
Figure 3b: Last Month eSignal Ichimoku Daily chart of E-Mini SP500 Futures
Table 6 shows all the stocks from the Nasdaq100 which are bullish from 60m time frame all the way to the monthly. The list has drastically shortened since last month.
Page 4

Table 1a: Current Ichimokutrade RT ScannerNasdaq100 Bullish from 60m to Monthly
Table 2 shows all the stocks from the SP500 which are bearish from 60m time frame all the way to the monthly.
Table 5a: Current Ichimokutrade RT ScannerS&P 500 Bullish 60m to Monthly
Table 5b: Last Month Ichimokutrade RT ScannerS&P 500 Bullish 60m to Monthly
VIX Volatility Index
Figure 4 shows the weekly chart of the CBOE Market Vol-atility Index. It has an inverse relationship with the US Stock market. If the market goes up, the $VIX goes down and vice versa. We have been using the $VIX in conjunc-tion with the E-mini SP500 to give us early indication on market direction. Since the beginning of this year, we have been posting the $VIX chart on twitter and determin-ing the market direction on a weekly basis for day-trading/swing trading. We have outlined two zones. One from 12.12 to 20.74 where the US stock market would be bullish and the second zone from 20.74 to 32.21 where the US stock mar-ket would be bearish. Last month, we stated that the probabilities were high due to the Weekly/Daily time frame for price to start to move towards the support. Within 1 month, we are approaching the support at 12.12 very fast. Once this support is reached, there is high prob-ability that price will bounce off it and start to move back towards the resistance at 20.74. We have been forecasting since early Feb that the next high is going to be in Mid-April. The VIX has gone up which indicates the markets going down. The support was never reached. As long as a resistance is not broken, there is a high probability of reaching the support still.
Figure 4a: eSignal Ichimoku Weekly chart of $VIX Futures
Figure 4b: Last Month eSignal Ichimoku Weekly chart of $VIX Futures
Figure 5 shows the daily chart of the CBOE Market Volatil-ity Index. The daily time frame shows a resistance being broken. Price is now trying to enter the cloud to go to the top of the cloud. As long as the daily support at 14.69 holds, the VIX can enter the cloud and supports the “Sell in May and go away theory”
Figure 5a: eSignal Ichimoku Daily chart of $VIX Futures
Page 5

Page 6
Figure 5b: Last Month eSignal Ichimoku Daily chart of $VIX Futures
30 Year Treasury Bonds Futures
May 2014, the 30 Year Treasury Bond futures entered a long term bullish trend (Figure 6). We reached the resis-tance at 165’21 and held so far. As long as the support at 161’05 holds, there is still a high probability of reaching the resistance at 171’27.
Figure 6a: eSignal Ichimoku Weekly chart 30 Year Treasury Bonds Futures
Crude Oil
Figure 7 shows the Weekly Ichimoku Chart for Crude Oil Futures. Crude oil was moving up nicely and had broken $40/barrel. When this occurred, everyone declared the bottom of crude oil and starting to project it was heading towards $50/barrel soon. The support has been holding and price reached the resistance outline last month of 44.31 and broken it. The new resistance is show below.
Figure 7a: eSignal Weekly chart of NYMEX Crude Oil
Futures
Figure 8 shows the Daily Ichimoku Chart for Crude Oil Futures. The sentiment is bullish. The support outlined as weak but it held. Since it held a weak support, price took off to the resistance outlined last month and broke it. Price is now trending bullish to the next resistance close to 50.00
Figure 8a: eSignal Ichimoku Daily chart of NYMEX Crude Oil Futures
Gold
Figure 9a shows the Monthly Ichimoku Chart for Gold Futures. Last month, price was holding the support at 1217.40. As long as it held, there was a high probability of reaching the resistance at 1302.0. Price is slowly up to reach this resistance.
Figure 9a: eSignal Ichimoku Monthly Chart of Gold

Page 7
Figure 9b shows the weekly chart. The weekly is support-ing the monthly time frame with price trying to reach the resistance at 1302.00
Figure 9b: eSignal Ichimoku Weekly Chart of Gold
Germany
Figure 10 shows the weekly Ichimoku chart for the Ger-man Stock Market Index. The sentiment is bearish con-solidating. The resistance at 10067 didn’t hold. This is indicating that the market is not strong bearish. There is a high probability of consolidating until it gets above the cloud or breaks the new support at 10067.
Figure 10a eSignal Ichimoku Weekly chart of German DAX Stock Index
Figure 10b Last Month eSignal Ichimoku Weekly chart of German DAX Stock Index
China
Figure 11 shows the weekly Ichimoku chart for the Chinese
Stock Index. The sentiment is bearish but the China mar-ket is going through a pull back right now. The pull back resistance is 3304.44.
Figure 11a: eSignal Ichimoku Weekly chart of China Stock Market
Figure 11a: Last Month eSignal Ichimoku Weekly chart of China Stock Market
Japan
Figure 12 shows the Monthly Ichimoku chart for the Japan Nikkei Stock Index. The Japanese stock market has been in a major bullish trend since 2013. Towards the end of 2015, the market has been going through a major pull back controlled by the resistance 17385. The resistance is still holding.
Figure 12a: eSignal Ichimoku Monthly chart of Japan Stock Market

Russia
Figure 13 shows the Weekly Ichimoku chart for the Russian Stock market. The Russian stock market is in a bullish trend trying to get to the resistance at 2040.47. The support at 1802 is holding the bullish trend.
Figure 13a: eSignal Ichimoku Weekly chart of Russia Stock Market
India
Figure 14 shows the Monthly & Daily Ichimoku chart for the Indian Stock Index ($NIFTY=NSE). The Indian stock market has been going through a major bullish at 7946. There are a lot of minor resistances to the major resistance of 8500.
Figure 14a: eSignal Ichimoku Monthly chart of Indian Stock Market
Brazil
Figure 15 shows the Weekly Ichimoku chart for the Brazil Stock Index ($BOV-BSP). The Brazil stock market was in a strong bearish trend being held by a major resistance at 43500. In one week, this resistance was broken and the bearish trend was over. The major resistance holding price didn’t hold at all. It broke it very easily and now the sentiment is bullish. This is not good for the market at all. This is indicating that the market does not really want to trend. It is going to be
very volatile. Time to stay away until it settles down.
Figure 15: eSignal Ichimoku Weekly chart of Brazil Stock Market
Mexico
Figure 16 shows the Weekly Ichimoku chart for the Mexico Stock Index. The Mexican stock market has been consol-idating since 2012. However, this month, the market is showing signs that it could possible breakout. All time frames are bullish and supporting the breakout. Nothing really happened in April. It is still holding the support so it still has a high probability of breaking out to the bullish side.
Figure 16: eSignal Ichimoku Weekly chart of Mexico Stock Market
-Manesh Patel
Middle East Stock Markets:Kuwait
The surge in oil prices that started in February sup-ported the Middle East markets to do better than previous month. The bullishness sentiment moved from the lower timeframe to higher timeframe especially on the weekly timeframe. However, this was not the cast to all markets, Dubai which was the 2nd best performing market last month is now the worst market after Bahrain. To give you more insight about the performance, we have attached the following heat-maps that generated
Page 8

Page 9
from our website. They help us to identify the enhance-ment in the market over the past three months and show how the bullishness moved from lower timeframe to daily to weekly. Graph no. 1 shows the market sentiment in Feb, the red and amber were almost covering all the tables except the daily timeframe for some of the countries. In March, red and amber vanished from the daily timeframe and covered entirely by the green cells. The weekly and monthly also affected and changed from red to amber. Last month the green penetrated the markets to reach the monthly timeframe, however it was not the case to all countries. Dubai, Bahrain and Qatar were not doing well last months.
Table 1a: IchimokuTrade RT Scanner: Middle East Markets Heatmap for Feb 2016
Table 1b: IchimokuTrade RT Scanner: Middle East Markets Heatmap for March 2016
Table 1c: IchimokuTrade RT Scanner: Middle East Markets Heatmap for April 2016
Let us talk now about Kuwait Market since it shows a nicely enhancement over the past three months. The following graph shows the weekly timeframe, which the controlling timeframe now. It is currently facing a critical resistance at 860 level as shown in the below chart.
Figure 1: eSignal Ichimoku Weekly Chart of Kuwait Financial Market
The probability to break the current resistance and reach the next resistance at 929 is low in the upcoming two months. However, there will be an opportunity in July for the market to reach the next resistance at 929. If the price of oil continue surging or stays at the same level, it will help the market to reach the next resistance level.
-Abdullah Alrayes
A good trader has to have three things:
a chronic inability to accept things at face value,to feel continuously unsettled,
and to have humility.-Michael Steinhardt
Colquitt’s Corner
After last month’s article I got a lot of feedback on my results. I want to thank everyone for taking the time to read the article. Since the article, Manesh and I
have put together a backtesting team. We went back and took a look at the 6 and 7 time email alerts for futures, cur-rencies, and the S&P 500 stock market index components. We reviewed all of the potential trades for the first quarter. The results turned out great! Understand this strategy is a simple trading plan I describe in my blog posts. Now we have the proof to show that this trading plan can work across all instruments. This is just a simple trading plan. Imagine if you took the time to fine tune it. Our research team has begun this process and the results are worth the time. The problem is no one wants to take the time to backtest. No one takes a trading plan and puts it to work. The worst part is people take an unclear trading plan and actually trade real money with it. If you are truly wanting to be a successful trader then you need a trading plan that has been backtested and can work across all instruments. I understand most people just want someone just to give them a simple few steps and the can walk away and make money right way. I hear

all the time, “I want to retire and trade”. If that is the case, what are you willing to do to achieve that? What steps are you taking to make sure that becomes a reality? There isn’t an easy way to trade. It requires time and practice like any-thing else you do. I’m a musician and if I don’t practice, when it comes time for a show, it’s going to be horrible. Trading is the same way. To me the show is like placing the trade. If I haven’t practiced and put to together a set list of songs I’m playing then I would just look lost on stage. I look at trading the same way. Back testing is now like practice or rehearsal. I’m trying out new ideas and make sure they work before I go apply them. The realty is you will have to do the same. 90% of my time is backtesting, the other 10% is trading. It’s the back testing results that gives me the confidence in the email alerts from the website. There should be no excuses why people cannot make money on the website. I have put a simple 3 step trading together that is successful on its own. If you are a former 1 month student or university student then all you need to do is add your optimization strategies that we have taught you to increase your results. Don’t take my word for it. Back test it yourself and see the results. What’s the worst it could do? I want to thank Eric Chai, Wes Bennet, and Zee-shan Ahmed for their contribution to the research.
-Michael Colquitt
Seasonal Trades
May typically marks the point in the year when we begin to see changes in the market. Seasonal-ly, the markets tend to peak at the end of April
or beginning of May. Our seasonal target last month for the Emini S&P 500 Futures was 2100. We hit that level, so now what? Well now things get tricky, up to this month we high probability seasonal statistics. The next couple of months however, we have low probability seasonal sta-tistics. In other words, in past newsletters you have read about seasonals working 10 out of 10 years or 9 out of 10 years, well when we go below 90%, we typically don’t in-clude those stats in our newsletter. So what can we expect from the month of May for the Emini S&P 500 Futures? The last three May’s (2013, 2014 and 2015) have all seen the S&P 500 go to new all time highs. The previous three years (2010, 2011 and 2012) were negative and finally 2007, 2008 and 2009 were positive. So 6 out the last 9 years have been positive and it appears to be some sort of alternating 3 year cycle. If the 3 year cycle holds, this year should be negative. But there really is no high probability statistic to say with confidence which way it will go. Technically, we need a close above the 2106 level on the monthly chart
to gain some bullish momentum. For the bearish side we would need to close below 1956. Our pick for April, Goodyear Tire & Rubber Com-pany (GT), did not follow through on seasonal play. The stock did have a bullish move following the entry date and was retesting the previous pivot, but moved down after earnings. A conservative approach would have been to take some risk of the table right before earnings as it was at a resistance. We don’t have that many high probability season-al opportunities for stocks this month due to the volatility of the month. We typically publish trades with high prob-ability seasonal opportunities that also have a matching technical sentiment in the direction of the seasonal. Due to the limited number of results we have this month, we will be publishing them based solely by their seasonality. So this month it will be more important for our readers to apply their own technical/fundamental analysis before en-tering these seasonals.
Figure 1: TDAmeritrade Ichimoku Weekly chart of AVGO
Our pick for this month is Broadcom Limited (AVGO). The major resistance of $147 was broken back in March and ideally we would have liked for it to have held in April. Unfortunately it didn’t, but it could just be a slight dip below that level or we could see a further pullback to the $136 level. Either way, we will be looking for a lower time frame Ichimoku setup around May 5th for entry. Our email alert subscribers can keep an eye out for this stock as well as the others posted in the table below, in their MTF email alerts.
-Hiren Patel
Page 10

Futures Update
Over the past year, we have encouraged traders to diversify their portfolios and this is one thing we will continue to do. During our October 2015 news-
letter, we put a special emphasis on trading Futures prod-ucts and took a detailed look at the major products in this category from Equity Indexes, Energy, Metals and more. We will continue to track these on a month-to-month ba-sis and provide our views. Below is a table summarizing the various Futures contracts.
An interesting observation that I made during the compi-lation of the above data relates to the E-mini Nasdaq 100. As we have seen over the past couple of years, the Nasdaq has continued to be the leading Equity index during the bullish run, however, there is a bit of a discrepancy at the moment. If you take a look at the Daily chart for the E-mini SP500 or E-mini Dow, you will see how the major support has been maintained ever since we got above the cloud – now take a look at the Daily chart for the Emini Nasdaq – the Daily support has not been respected and price is on the verge of re-entering the cloud. If you take this a step further and look at the Weekly chart for the Emini Nasdaq, you can see that we are sitting at a boundary condition between this instrument being bullish vs bearish.
-Zeeshan Ahmed
What’s on the Buffet in May?
The month of May typically tends to be the time many individuals start to plan their summer getaways to beach homes, home countries and cruises across the
world. Hence the coined phrase, sell in May and go away has gained intense momentum over the past years. Al-though the SP500 has been positive in the month over the past 3 years, we still allow the price action on the charts to give us an objective view of the market. The SP500 can give us an overall view of the market, however digging into the sectors allows us to breakdown as to where the winners and losers may lie.
Our last update highlighted the Consumer Staples (XLP) and Utilities sector (XLU) and both were at key resistance levels. See Figure 1 and 2 respectively.
Figure 1: TDAmeritrade Ichimoku Weekly chart of Consumer Staples (XLP)
Figure 2: TDAmeritrade Ichimoku Weekly chart of Utilities (XLU)
Both sectors have paired some of their gains which were expected given their performance over the past quarter.
Page 11

However we continue to have these on our watch list as this could be an opportunity to add some names from these sectors to a portfolio. As long as the key support lev-els hold, they will maintain their bullish momentum. The energy sector (XLE) displayed its strength breaking the key resistance level of 64.27 and is now on track to test the 71.26 resistance highlighted. See Figure 4. With oil continuously creating new highs for 2016, this sector is going through a major pullback on the weekly.
Figure 3: TDAmeritrade Ichimoku Weekly chart of Utilities (XLE)
Conversely, the Consumer Discretionary (XLY) and Tech-nology sector (XLK) held their respective resistance levels. See Figure 4 and 5.
Figure 3: TDAmeritrade Ichimoku Weekly chart of Consumer Staples (XLY)
Figure 4: TDAmeritrade Ichimoku Weekly chart of Utilities (XLK)
With key tech names such as Apple (APPL) and Netflix (NFLX) missing earnings estimates, the winners like Face-book (FB) and Amazon (AMZN) were unable to help move this sector higher. We can now watch for price to deter-mine if the sector will hold at the 41.36 support. Should it break through, it may spell some continue pressure for this popular sector. With the market reaching all-time highs of 2105 on the SP500, this may have been a nervous quarter for many investors. Analyzing the sectors allows us to see the most bullish and bearish areas of the market allowing us position our portfolio effectively. The fundamental basis for investing teaches buying low and selling high but by no means are we picking this to be the top. That being said, it has never hurt anyone to take some profits on an investment. Despite the overall market sentiment, there is always something for the bulls and bears to feed on (i.e. bullish vs bearish sectors) - knowing where that is, just might be the key to your success.
-Pranav Khattar
Page 12
Thank You for reading! Please look forward to our next newsletter June 4th, 2016!
To subscribe email request to: [email protected]. Cloud Alpha newsletter contains or may contain references to other companies. E.I.I Capital Group makes no representations, warranties or endorsements whatever about any other companies , or any prod-ucts or services of those other companies, even if the products or services of those other companies or their Web sites are described or integrated with E.I.I Capital Group products or services. You use this newsletter and all E.I.I. Capital Group (and affiliated) products and services at your own risk. In no event shall E.I.I. Capital Group be liable for any special, incidental, indirect or consequential damages of any kind, or any financial losses or damages whatever, including, without limitation, those resulting from loss whether or not we have been advised of the possibility of such damages, and regardless of the theory of liability. This newsletter could, and likely does, include some technical and other inaccuracies and errors. Past performance, whether actual or indicated by historical tests of strategies, is no guarantee of future performance or success. There is a possibility that you may sustain a loss equal to or greater than your entire investment regardless of which asset class you trade (equities, options futures or forex); therefore, you should not invest or risk money that you cannot afford to lose. U.S. Government Required Disclaimer - Commodity Futures Trading Commission. Futures and options trading has large potential rewards, but also large potential risk. You must be aware of the risks and be willing to accept them in order to invest in the futures and options markets. Don’t trade with money you can’t afford to lose. This website is neither a solicitation nor an offer to Buy/Sell futures or options. No representation is being made that any account will or is likely to achieve profits or losses similar to those discussed on this website. The past performance of any trading system or methodology is not necessarily indicative of future results. CFTC RULE 4.41 - HYPOTHETICAL OR SIMULATED PERFORMANCE RESULTS HAVE CERTAIN LIMITATIONS. UNLIKE AN ACTUAL PERFORMANCE RECORD, SIMULATED RESULTS DO NOT REPRESENT ACTUAL TRADING. ALSO, SINCE THE TRADES HAVE NOT BEEN EXECUTED, THE RESULTS MAY HAVE UNDER-OR-OVER COMPENSATED FOR THE IMPACT, IF ANY, OF CERTAIN MARKET FACTORS, SUCH AS LACK OF LIQUIDITY, SIMULATED TRADING PROGRAMS IN GENERAL ARE ALSO SUBJECT TO THE FACT THAT THEY ARE DESIGNED WITH THE BENEFIT OF HINDSIGHT. NO REPRESENTATION IS BEING MADE THAT ANY ACCOUNT WILL OR IS LIKELY TO ACHIEVE PROFIT OR LOSSES SIMILAR TO THOSE SHOWN. Testimonials appearing on this site are actually received via email submission. They are individual experiences, reflecting real life experiences of those who have used our products and/or services in some way or other. However, they are individual results and results do vary. We do not claim that they are typical results that consumers will generally achieve. The testimonials are not necessarily representative of all of those who will use our products and/or services. The testimonials displayed are given verbatim except for correction of grammatical or typing errors. Some have been shortened, meaning; not the whole message received by the testimony writer is displayed, when it seemed lengthy or the testimony in its entirety seemed irrelevant for the general public.