cmbs annex
TRANSCRIPT

This CD-ROM accompanies and is a part of the Prospectus Supplement, dated May 11, 2007 (the "Prospectus Supplement"), relating to the Wachovia Bank Commercial Mortgage Trust, Commercial Mortgage Pass-Through Certificates, Series 2007-C31 Class A-1, Class A-2, Class A-3, Class A-PB, Class A-4, Class A-5, Class A-1A, Class A-M, Class A-J, Class B, Class C, Class D, Class E and Class F Certificates (collectively, the "Offered Certificates"). The information set forth on this CD-ROM is an electronic copy of certain information set forth on Annexes A-1, A-2, A-3, A-4, A-5 and A-6 to the Prospectus Supplement. This CD-ROM should be reviewed only in conjunction with the entire Prospectus Supplement. This CD-ROM does not contain all relevant information relating to the Offered Certificates, particularly with respect to the structure of the underlying Trust Fund and the risks and special considerations associated with an investment in the Offered Certificates. Such information is described elsewhere in the Prospectus Supplement.
Any information contained on this CD-ROM will be more fully described elsewhere in the Prospectus Supplement. The information contained on this CD-ROM should not be viewed as projections, forecasts, predictions or opinions with respect to value. Prior to making any investment decision, a prospective investor should receive, and should carefully review, the prospectus, dated October 19, 2006 (the “Prospectus”) and the Prospectus Supplement.
The information contained on this CD-ROM may be supplemented with further information prior to time of sale.
NOTHING IN THIS CD-ROM SHOULD BE CONSIDERED AN OFFER TO SELL OR A SOLICITATION OF AN OFFER TO BUY THE OFFERED CERTIFICATES.

WACHOVIA BANK COMMERCIAL MORTGAGE TRUST SERIES 2007-C31
ANNEX A-1 CERTAIN CHARACTERISTICS OF THE MORTGAGE LOANS AND MORTGAGED PROPERTIES
Property Name Address City State Zip Code Loan Purpose Mortgage Loan Seller Specific Property Type
1 1 Five Times Square New York NY 10036 Acquisition Wachovia Office CBD
2 1 Various Various Various Various Acquisition Wachovia Various Various2.01 Market Square 701, 801 Pennsylvania Avenue NW Washington DC 20004 Office CBD2.02 Polk & Taylor Buildings 2521 S Clark Street & 2530 Crystal Drive Arlington VA 22202 Office Suburban2.03 Wells Fargo Center 999 Third Avenue Seattle WA 98104 Office CBD2.04 One, Two & Three Lafayette Centre 1120 20th Street NW; 1155 21st Street NW; 1133 21st Street NW Washington DC 20036 Office CBD2.05 Booz Allen Complex 8251 Greensboro Drive; 8281 Greensboro Drive; 8283 Greensboro Drive Mc Lean VA 22102 Office Suburban2.06 Key Center 601 108th Avenue NE Bellevue WA 98004 Office CBD2.07 Sunset North 3060-3180, 139th Avenue SE Bellevue WA 98005 Office Suburban2.08 City Center Bellevue 500 108th Avenue NE Bellevue WA 98004 Office CBD2.09 Plaza Center and US Bank Tower 10800 and 10900 NE 8th Street Bellevue WA 98004 Office CBD2.10 1616 Fort Myer Drive 1616 Fort Myer Drive Arlington VA 22209 Office Suburban2.11 American Center 8300 & 8330 Boone Boulevard Vienna VA 22182 Office Suburban2.12 Eastgate Office Park 15325 SE 30th Place Bellevue WA 98007 Office Suburban2.13 Liberty Place 325 7th Street NW Washington DC 20004 Office CBD2.14 Lincoln Executive Center Buildings I, II, III, A&B 3380 146th Place Southeast, 14332 Southeast Eastgate Way, 3245 146th Place Southeast; 3290 and 3310 146th Place Southeast Bellevue WA 98007 Office Suburban2.15 11111 Sunset Hills Road 11111 Sunset Hills Road Reston VA 20190 Office Suburban2.16 Army and Navy Club Building 1627 I Street NW Washington DC 20006 Office CBD2.17 Plaza East 11100 NE 8th Street Bellevue WA 98004 Office CBD2.18 Reston Town Center 11911 Freedom Drive Reston VA 20190 Mixed Use Office/Retail2.19 1300 North Seventeenth Street 1300 North 17th Street Arlington VA 22209 Office Suburban2.20 Washington Mutual Tower 1201 Third Avenue Seattle WA 98101 Office CBD
3 1 666 Fifth Avenue New York NY 10103 Acquisition Barclays Office CBD4 1 Mall at Rockingham Park 99 Rockingham Park Boulevard Salem NH 03079 Refinance Nomura Retail Anchored
5 2 Various New York NY Various Acquisition Wachovia Multifamily Conventional5.01 Stuyvesant Town 317 Avenue C (General Management Office); Various Others New York NY 10009 Multifamily Conventional5.02 Peter Cooper Village 4 Peter Cooper Road (Security Office); Various Others New York NY 10016 Multifamily Conventional
6 1 One Grand Cypress Boulevard Orlando FL 32836 Refinance Wachovia Hospitality Full Service7 1 Boston Marriott Long Wharf 296 State Street Boston MA 02109 Acquisition Wachovia Hospitality Full Service8 1 Ashford Hospitality Pool 3 Various Various Various Various Acquisition Wachovia Hospitality Limited Service
8.01 Courtyard - San Francisco, CA 299 Second Street San Francisco CA 94105 Hospitality Limited Service8.02 Courtyard - Seattle, WA 925 Westlake Avenue North Seattle WA 98109 Hospitality Limited Service
9 1 Ashford Hospitality Pool 2 Various Various Various Various Acquisition Wachovia Hospitality Various9.01 Residence Inn - Phoenix , AZ 801 North 44th Street Phoenix AZ 85008 Hospitality Extended Stay9.02 SpringHill Suites - Hawthorne, CA 14620 Aviation Boulevard Hawthorne CA 90250 Hospitality Limited Service9.03 Towne Place Suites - Hawthorne, CA 14400 Aviation Boulevard Hawthorne CA 90250 Hospitality Extended Stay9.04 SpringHill Suites - Plymouth Meeting, PA 430 Plymouth Road Plymouth Meeting PA 19462 Hospitality Limited Service9.05 SpringHill Suites - Glen Allen, VA 9701 Brook Road Glen Allen VA 23059 Hospitality Limited Service9.06 Residence Inn - Plano, TX 5001 Whitestone Lane Plano TX 75024 Hospitality Extended Stay9.07 Residence Inn - Newark, CA 35466 Dumbarton Court Newark CA 94560 Hospitality Extended Stay10 1 Los Angeles International Jewelry Center 550 South Hill Street Los Angeles CA 90013 Acquisition Wachovia Mixed Use Office/Retail
11 1 Various San Francisco CA Various Refinance Nomura Various Various11.01 300 Buchanan Street 300 Buchanan Street San Francisco CA 94102 Multifamily Conventional11.02 536 Leavenworth Street 536 Leavenworth Street San Francisco CA 94109 Multifamily Conventional11.03 210-218 Church Street 210-218 Church Street San Francisco CA 94114 Multifamily Conventional11.04 1405 Franklin Street 1405 Franklin Street San Francisco CA 94109 Multifamily Conventional11.05 610 Leavenworth Street 610 Leavenworth Street San Francisco CA 94109 Multifamily Conventional11.06 350 Judah Street 350 Judah Street San Francisco CA 94122 Multifamily Conventional11.07 2080 Gough Street 2080 Gough Street San Francisco CA 94114 Multifamily Conventional11.08 455 Hyde Street 455 Hyde Street San Francisco CA 94109 Multifamily Conventional11.09 1035 Sutter Street 1035 Sutter Street San Francisco CA 94109 Multifamily Conventional11.10 969 Bush Street 969 Bush Street San Francisco CA 94109 Multifamily Conventional11.11 345 Fulton Street 345 Fulton Street San Francisco CA 94102 Multifamily Conventional11.12 516 Ellis Street 516 Ellis Street San Francisco CA 94109 Multifamily Conventional11.13 721 Geary Street 721 Geary Street San Francisco CA 94109 Multifamily Conventional11.14 11 Dolores Street 11 Dolores Street San Francisco CA 94103 Multifamily Conventional11.15 2335 Larkin Street 2335 Larkin Street San Francisco CA 94109 Multifamily Conventional11.16 3875 18th Street 3875 18th Street San Francisco CA 94114 Multifamily Conventional11.17 1025 Sutter Street 1025 Sutter Street San Francisco CA 94109 Multifamily Conventional11.18 828 Jones Street 828 Jones Street San Francisco CA 94109 Multifamily Conventional11.19 240 Church Street 240 Church Street San Francisco CA 94114 Retail Unanchored11.20 735 O'Farrell Street 735 O'Farrell Street San Francisco CA 94109 Multifamily Conventional11.21 2337-2339 Market Street 2337-2339 Market Street San Francisco CA 94114 Multifamily Conventional11.22 635 Ellis Street 635 Ellis Street San Francisco CA 94109 Multifamily Conventional11.23 215-219 Church Street 215-219 Church Street San Francisco CA 94114 Multifamily Conventional11.24 1385 Kansas Street 1385 Kansas Street San Francisco CA 94107 Multifamily Conventional11.25 747 Ellis Street 747 Ellis Street San Francisco CA 94109 Multifamily Conventional11.26 631 Larkin Street 631 Larkin Street San Francisco CA 94109 Retail Unanchored11.27 601 Larkin Street 601 Larkin Street San Francisco CA 94109 Multifamily Conventional11.28 1520-1524 Geneva Avenue 1520-1524 Geneva Avenue San Francisco CA 94112 Multifamily Conventional11.29 1199 DeHaro Street 1199 DeHaro Street San Francisco CA 94107 Multifamily Conventional
12 1 Ashford Hospitality Pool 1 Various Various Various Various Acquisition Wachovia Hospitality Limited Service12.01 Courtyard - Basking Ridge, NJ 595 Martinsville Road Basking Ridge NJ 07920 Hospitality Limited Service12.02 Courtyard - Oakland Airport, CA 350 Hegenberger Road Oakland CA 94621 Hospitality Limited Service12.03 Courtyard - Scottsdale, AZ 3311 North Scottsdale Road Scottsdale AZ 85251 Hospitality Limited Service12.04 Courtyard - Plano, TX 6840 North Dallas Parkway Plano TX 75024 Hospitality Limited Service12.05 Courtyard - Newark, CA 34905 Newark Boulevard Newark CA 94560 Hospitality Limited Service
13 1 Various Various Various Various Refinance Wachovia Office CBD13.01 First Citizens Plaza 128 South Tryon Street Charlotte NC 28202 Office CBD13.02 Sarasota City Center 1819 Main Street Sarasota FL 34236 Office CBD
14 2 City Heights Apartment Homes 209 South Westmoreland Avenue Los Angeles CA 90004 Acquisition Wachovia Multifamily Conventional15 1 Ponte Vedra Inn & Club 200 Ponte Vedra Boulevard Ponte Vedra Beach FL 32082 Refinance Wachovia Hospitality Full Service16 2 Clinton Manor 535 West 51st Street & 540 West 52nd Street New York NY 10019 Refinance Barclays Multifamily Conventional
17 1 11001 Southern Boulevard Royal Palm Beach FL 33411 Refinance Wachovia Retail Anchored18 1 635 Madison Avenue 635 Madison Avenue New York NY 10022 Refinance Wachovia Office Medical19 1 Cherry Hill Corporate Center Pool Various Various MA Various Acquisition Wachovia Various Various
19.01 24-42 Cherry Hill Drive 24-42 Cherry Hill Drive Danvers MA 01923 Mixed Use Office/R&D19.02 71 Cherry Hill Drive 71 Cherry Hill Drive Beverly MA 01915 Mixed Use Office/R&D19.03 35 Cherry Hill Drive 35 Cherry Hill Drive Danvers MA 01923 Mixed Use Office/R&D19.04 37 Cherry Hill Drive 37 Cherry Hill Drive Danvers MA 01923 Mixed Use Office/R&D19.05 33 Cherry Hill Drive 33 Cherry Hill Drive Danvers MA 01923 Mixed Use Office/R&D19.06 54 Cherry Hill Drive 54 Cherry Hill Drive Danvers MA 01923 Mixed Use Office/R&D19.07 72 Cherry Hill Drive 72 Cherry Hill Drive Beverly MA 01915 Office Suburban19.08 66 Cherry Hill Drive 66 Cherry Hill Drive Beverly MA 01915 Office Suburban19.09 5 Cherry Hill Drive 5 Cherry Hill Drive Danvers MA 01923 Office Suburban
20 1 15201 - 15555 Southwest Freeway Sugarland TX 77478 Acquisition Wachovia Retail Anchored21 1 611 West 6th Street 611 West 6th Street Los Angeles CA 90017 Refinance Wachovia Office CBD22 2 Addison at Swift Creek Apartments 4100 Lonas Parkway Midlothian VA 23112 Refinance Nomura Multifamily Conventional23 1 Corporate Plaza 800 Delaware Avenue Wilmington DE 19801 Refinance Wachovia Office CBD24 2 Park Place Apartments 675 Town Center Drive Newport News VA 23606 Refinance Wachovia Multifamily Conventional
25 1 NWC IH-35 and Highway 6/Loop 340 Waco TX 76711 Acquisition Nomura Retail Anchored26 1 East Gate Square Phase II 1111 Nixon Drive Moorestown NJ 08057 East Gate Portfolio Refinance Wachovia Retail Anchored
27 1 660 Maryville Centre Drive Saint Louis MO 63141 Acquisition Wachovia Hospitality Full Service28 1 FMC Technologies 1701, 1777 & 1803 Gears Road Houston TX 77067 Acquisition Nomura Industrial Flex29 1 1020 19th Street 1020 19th Street, NW Washington DC 20036 Gravely Portfolio Acquisition Wachovia Office CBD30 1 1920 L Street 1920 L Street, NW Washington DC 20036 Gravely Portfolio Acquisition Wachovia Office CBD31 1 Scottsdale Medical Office 9700 North 91st Place; 10752 North 89th Place; 8952 East Desert Cove Drive Scottsdale AZ 85260 Acquisition Wachovia Office Medical32 2 Jacobs Woods 100 Jacobs Hall Lane Lansdale PA 19446 Refinance Barclays Multifamily Conventional33 2 The Overlook at St. Thomas Apartments 6800 Steeprun Road Louisville KY 40241 Acquisition Wachovia Multifamily Conventional34 1 Toll Brothers Corporate Headquarters 250 Gibralter Road Horsham PA 19044 Acquisition Wachovia Office Suburban35 2 Marquis at Caprock Canyon 4411 Spicewood Springs Austin TX 78759 Refinance Nomura Multifamily Conventional36 2 Regent Apartments 2750 Millerville Road Baton Rouge LA 70816 Refinance Wachovia Multifamily Conventional37 1 1900 L Street 1900 L Street, NW Washington DC 20036 Gravely Portfolio Refinance Wachovia Office CBD38 2 Colonial Grande at Promenade 2400 Central Parkway Montgomery AL 36106 Acquisition Wachovia Multifamily Conventional39 1 Whittier Marketplace 11701-11891 Whittier Boulevard Whittier CA 90601 Acquisition Wachovia Retail Anchored40 2 Wynn Palms Apartments 3756, 3800 & 3880 Wynn Road Las Vegas NV 89103 Refinance Nomura Multifamily Conventional41 2 Main Street Village Apartments I&II 5504 Town Center Drive Granger IN 46530 Refinance Wachovia Multifamily Conventional42 1 East Gate Square Phase IV 1311 Nixon Drive Mount Laurel NJ 08054 East Gate Portfolio Refinance Wachovia Retail Anchored43 1 East Gate Square Phase V 1520 Nixon Drive Moorestown NJ 08057 East Gate Portfolio Refinance Wachovia Retail Anchored
44 1 445 South Alvernon Way Tucson AZ 85711 Acquisition Wachovia Hospitality Full Service45 1 Whittier Center 15111 & 15141 Whittier Boulevard Whittier CA 90603 Acquisition Nomura Office Suburban46 1 Durham Office 3414, 3404 North Duke Street; 4117, 4101, 4020 North Roxborough Road Durham NC 27704 Acquisition Wachovia Office Suburban47 1 35 Nutmeg Drive 35 Nutmeg Drive Trumbull CT 06611 Acquisition Wachovia Office Suburban48 1 Parkway 400 11800 & 11720 Amberpark Road Alpharetta GA 30004 Acquisition Wachovia Office Suburban
49 1 2901-3103 West Broadway Columbia MO 65203 Refinance Wachovia Retail Anchored50 2 University Crescent Student Apartments 4500 Burbank Drive Baton Rouge LA 70820 Refinance Wachovia Multifamily Student Housing51 1 One & Two Decatur Town Center 150 East Ponce de Leon Avenue & 125 Clairmont Avenue Atlanta GA 30030 Acquisition Wachovia Office Suburban52 2 The Summit 1801 Monks Avenue Mankato MN 56001 Refinance Wachovia Multifamily Student Housing53 1 Beachwalk Shopping Center 437 South Highway 101 Solana Beach CA 92075 Acquisition Wachovia Mixed Use Office/Retail54 2 University Oaks Student Housing 21 National Guard Road Columbia SC 29201 Refinance Wachovia Multifamily Student Housing55 2 Royal Saint Moritz Apartments 2050 Grayson Drive Grapevine TX 76051 Refinance Wachovia Multifamily Conventional56 2 Vineyard Springs Apartments 18200 Blanco Springs Road San Antonio TX 78258 Acquisition Wachovia Multifamily Conventional57 1 The Phillips Building 7900-7920 Norfolk Avenue Bethesda MD 20814 Refinance Wachovia Office CBD58 1 200 Montague Street 200 Montague Street Brooklyn NY 11201 Acquisition Wachovia Office CBD59 2 Marquis at Carmel Commons Apartments 6818 Northbury Lane Charlotte NC 28226 Refinance Nomura Multifamily Conventional60 1 Courthouse Marketplace Retail Center 2476 Nimmo Parkway Virginia Beach VA 23456 Refinance Wachovia Retail Anchored61 2 The Depot Apartments 555 Elm Street Fort Worth TX 76102 Acquisition Wachovia Multifamily Conventional62 1 200 South Tryon 200 South Tryon Street Charlotte NC 28202 Acquisition Wachovia Office CBD63 2 Oaks at Broad River 100 Riverchase Boulevard Beaufort SC 29906 Acquisition Barclays Multifamily Conventional64 2 Walker Ranch Apartments 14500 Blanco Road San Antonio TX 78216 Refinance Wachovia Multifamily Conventional65 1 14700 Lee Road 14700 Lee Road Chantilly VA 20151 Acquisition Barclays Office Suburban66 1 East Gate Square Phase III 1420 Nixon Drive Mount Laurel NJ 08054 East Gate Portfolio Refinance Wachovia Retail Anchored67 1 St. Louis County Office Pool Various Various MO 63127 Acquisition Wachovia Office Various
67.01 9735 Landmark Parkway Drive 9735 Landmark Parkway Drive Saint Louis MO 63127 Office Suburban67.02 Laumeier III 3660 South Geyer Road Saint Louis MO 63127 Office Suburban67.03 9701 Landmark Parkway Drive 9701 Landmark Parkway Drive Sunset Hills MO 63127 Office Medical67.04 9717 Landmark Parkway Drive 9717 Landmark Parkway Drive Sunset Hills MO 63127 Office Suburban
68 1 Donald Ross Village 4500 Donald Ross Road Palm Beach Gardens FL 33418 Refinance Wachovia Mixed Use Retail/Office
69 1 185 Cotuit Road Sandwich MA 02563 Refinance Barclays Mobile Home Park Mobile Home Park70 1 5601 Cushing Parkway 5601 Cushing Parkway Fremont CA 94538 Refinance Barclays Retail Single Tenant71 1 901 7th Street 901 7th Street and 637 Eye Street, NW Washington DC 20001 Refinance Wachovia Office CBD72 1 1700 Higgins Center 1700 West Higgins Road Des Plaines IL 60018 Acquisition Barclays Office Suburban73 1 Shop-Rite BayShore 1905 Sunrise Highway Bay Shore NY 11706 Refinance Barclays Retail Single Tenant
74 2 1333 NW 3rd Street Deerfield Beach FL 33442 Acquisition Nomura Mobile Home Park Mobile Home Park75 2 Vista Pointe at the Valley Apartments 701 Cowboys Parkway Irving TX 75063 Acquisition Wachovia Multifamily Conventional76 1 Lexington Green Building I and II 220 & 230 Lexington Green Circle Lexington KY 40503 Acquisition Wachovia Office Suburban77 1 National Archives Building 8801 Kingsridge Drive Dayton OH 45458 Refinance Wachovia Industrial Warehouse78 2 The Marquis at Quarry Apartments 384 Treeline Park San Antonio TX 78209 Acquisition Wachovia Multifamily Conventional79 1 Sherwood Plaza 9990 Fairfax Boulevard Fairfax VA 22030 Acquisition Barclays Office Suburban80 1 801 West Easy Street 801 West Easy Street Rogers AR 72756 Refinance Barclays Industrial Warehouse81 2 Deerpath On The Lake 10200 North Armenia Avenue Tampa FL 33612 Acquisition Barclays Multifamily Conventional
82 1 19510-19530 Nordhoff Street Northridge CA 91324 Acquisition Wachovia Retail Anchored83 1 Residence Inn - Charleston, SC 90 Ripley Point Drive Charleston SC 29407 Acquisition Barclays Hospitality Extended Stay84 1 15 Broad Street 15 Broad Street Boston MA 02109 Acquisition Wachovia Office CBD85 2 Crossing Place 301 Lippencott Street Knoxville TN 37290 Acquisition Wachovia Multifamily Student Housing86 1 Hilton Garden Inn - Duncanville, TX 800 North Main Street Duncanville TX 75116 Refinance Nomura Hospitality Full Service87 2 Bremner Woods II Apartments 4501 Sprenkle Lane Richmond VA 23228 Refinance Nomura Multifamily Conventional88 2 Springfield Apartments 4600 University Drive Durham NC 27707 Acquisition Wachovia Multifamily Conventional89 1 Oakton Corporate Center 10467 White Granite Drive Oakton VA 22124 Acquisition Barclays Office Suburban90 1 Courtyard Matthews & Rock Hill Pool Various Various Various Various Acquisition Barclays Hospitality Limited Service
90.01 Courtyard - Matthews, NC 11425 East Independence Boulevard Matthews NC 28105 Hospitality Limited Service90.02 Courtyard - Rock Hill, SC 1300 River Run Court Rock Hill SC 29732 Hospitality Limited Service
91 2 Springhill 8030 East Lakeside Parkway Tucson AZ 85730 Acquisition Nomura Multifamily Conventional92 2 Stoney Brook Apartments 1301 East Dogwood Drive Mebane NC 27302 Refinance Nomura Multifamily Conventional93 1 East Gate Square Phase VI 1670 Nixon Drive Moorestown NJ 08057 East Gate Portfolio Refinance Wachovia Retail Shadow Anchored94 2 Valle West Tennis Club Apartments 13608 Pomerado Road Poway CA 92064 Acquisition Nomura Multifamily Conventional95 2 The Tower Apartments 2465 Shoreline Drive Alameda CA 94501 Refinance Nomura Multifamily Conventional96 1 Capital One Data Center 1500 East Plano Parkway Plano TX 75074 Acquisition Nomura Industrial Flex97 1 Wilmington Courthouse Parking Garage 6th and North King Streets Wilmington DE 19801 Refinance Wachovia Special Purpose Parking Garage98 2 Belmont Parkway Apartments 4300 Lamplighter Court Richmond VA 23234 Refinance Nomura Multifamily Conventional99 1 Cypress Business Center 8301 Cypress Plaza Drive Jacksonville FL 32256 Acquisition Wachovia Office Suburban100 2 Casas Lindas 699 West Magee Road Tucson AZ 85704 Acquisition Nomura Multifamily Conventional101 2 Sterling University at the Junction 5050 Sam Houston Avenue Huntsville TX 77340 Acquisition Wachovia Multifamily Student Housing102 1 Battleground Plaza 3712 Battleground Avenue Greensboro NC 27410 Acquisition Wachovia Retail Anchored103 2 Quail Creek 1651 South Dobson Road Mesa AZ 85202 Acquisition Nomura Multifamily Conventional
104 2 13607 Cordary Avenue Hawthorne CA 90250 Acquisition Nomura Multifamily Conventional105 2 Maple Village Apartments 2100 Maple Village Court Pell City AL 35128 Acquisition Barclays Multifamily Conventional106 2 Scripps Terrace Apartments 10940 Scripps Ranch Boulevard San Diego CA 92131 Acquisition Nomura Multifamily Conventional107 1 CentrePointe Office 1926 10th Avenue North Lake Worth FL 33461 Acquisition Wachovia Office Suburban108 2 Rancho Vista Apartments 3663 South Valley View Boulevard Las Vegas NV 89103 Refinance Nomura Multifamily Conventional109 2 Boulders Senior Living Apartments 3533 Willow Avenue White Bear Lake MN 55110 Acquisition Wachovia Multifamily Independent Living110 2 Prospect Place Apartments 1024 Prospect Avenue Santa Rosa CA 95409 Refinance Wachovia Multifamily Conventional111 1 Winchester Court 6600-6740 Winchester Court Memphis TN 38115 Acquisition Wachovia Retail Anchored
112 2 2140 Spring Grove Lane Middletown OH 45044 SSK Portfolio Refinance Barclays Mobile Home Park Mobile Home Park
Mortgage Loan Number
Loan Group Number
Cross Collateralized and Cross Defaulted Loan Flag
General Property Type
Five Times Square(1)
Beacon D.C. & Seattle Pool(1)
666 Fifth Avenue(1)
Peter Cooper Village & Stuyvesant Town Pool(1) (2)
Hyatt Regency Grand Cypress(3) (4)
Lembi Pool(11)
Osprey Pool(11)
Southern Palm Crossing Shopping Center(11)
First Colony Commons(5)
Central Texas Marketplace (6)
Saint Louis Marriott West(11)
Doubletree Hotel - Tucson, AZ(11)
THF-Fairview Marketplace(11)
Peters Pond RV Resort(7)
Pinetree Park ROC(8)
Northridge Promenade Shopping Center (9)
Laurel Pointe Apartments(11)
SSK Applewood Pointe(11)

$ 5,845,468,231 $ 4,517,838,123 $ 1,327,630,108
Original Loan Balance ($) Mortgage Rate ARD Loan
536,000,000.00 536,000,000.00 9.17% 11.86% 02/15/07 04/11/07 03/11/17 5.423125% 0.02038% Actual/360 Actual/360 120 118 118 IO IO IO 536,000,000.00 N
414,000,000.00 414,000,000.00 7.08% 9.16% 04/10/07 06/07/07 05/07/12 5.7970% 0.02038% Actual/360 Actual/360 60 60 60 IO IO IO 414,000,000.00 N63,968,571.5250,666,978.3047,643,888.9743,060,885.2036,313,349.7524,269,361.7222,552,246.8922,389,000.0918,356,198.8016,929,300.5712,817,899.0811,197,523.1710,641,274.6110,338,965.679,093,452.817,678,647.066,082,455.80
395,000,000.00 395,000,000.00 6.76% 8.74% 01/11/07 03/05/07 02/05/17 6.3530% 0.03038% Actual/360 Actual/360 120 117 117 IO IO IO 395,000,000.00 N260,000,000.00 260,000,000.00 4.45% 5.75% 03/01/07 04/10/07 03/10/17 5.6100% 0.02038% Actual/360 Actual/360 120 118 118 IO IO IO 260,000,000.00 N
247,727,272.72 247,727,272.72 4.24% 18.66% 11/17/06 01/08/07 12/08/16 6.4340% 0.02038% Actual/360 Actual/360 120 115 115 IO IO IO 247,727,272.72 N191,638,078.9056,089,193.82
200,000,000.00 199,757,745.13 3.42% 4.42% 04/09/07 05/11/07 04/11/14 5.7100% 0.02038% Actual/360 84 83 336 335 1,193,921.54 176,433,582.39 Y176,000,000.00 176,000,000.00 3.01% 3.90% 03/23/07 05/11/07 04/11/17 5.5800% 0.02038% Actual/360 Actual/360 120 119 119 IO IO IO 176,000,000.00 N128,408,000.00 128,408,000.00 2.20% 2.84% 04/11/07 05/11/07 04/11/17 5.9523333333% 0.02038% Actual/360 Actual/360 120 119 59 360 360 765,940.09 120,042,772.19 N68,540,000.0059,868,000.00126,466,000.00 126,466,000.00 2.16% 2.80% 04/11/07 05/11/07 04/11/17 5.9523333333% 0.02038% Actual/360 Actual/360 120 119 59 360 360 754,356.27 118,227,285.12 N23,150,000.0021,920,000.0020,230,000.0020,000,000.0015,286,000.0014,760,000.0011,120,000.00124,400,000.00 124,400,000.00 2.13% 2.75% 03/14/07 05/11/07 04/11/17 5.6020% 0.02038% Actual/360 Actual/360 120 119 59 360 360 714,311.15 115,738,151.68 N
122,500,000.00 122,500,000.00 2.10% 2.71% 04/10/07 05/11/07 04/11/12 6.4700% 0.02038% Actual/360 Actual/360 60 59 59 IO IO IO 122,500,000.00 N12,894,736.848,940,350.888,252,631.587,865,789.477,556,315.797,225,350.886,619,298.255,996,052.635,501,754.394,771,052.634,513,157.894,341,228.073,932,894.743,279,561.403,137,719.303,094,736.843,008,771.932,922,807.022,750,877.192,621,929.822,501,578.952,127,631.582,015,877.191,504,385.961,474,298.251,216,403.511,117,543.86945,614.04369,649.12
115,600,000.00 115,600,000.00 1.98% 2.56% 04/11/07 05/11/07 04/11/17 5.9523333333% 0.02038% Actual/360 Actual/360 120 119 59 360 360 689,541.73 108,069,158.19 N42,640,500.0024,002,182.0023,042,500.0019,688,000.006,226,818.00
113,360,000.00 113,360,000.00 1.94% 2.51% 04/11/07 05/11/07 04/11/17 5.6100% 0.02038% Actual/360 Actual/360 120 119 119 IO IO IO 113,360,000.00 N74,160,000.0039,200,000.0098,000,000.00 98,000,000.00 1.68% 7.38% 02/21/07 04/11/07 03/11/17 5.6500% 0.02038% Actual/360 Actual/360 120 118 118 IO IO IO 98,000,000.00 N80,000,000.00 80,000,000.00 1.37% 1.77% 04/02/07 05/11/07 04/11/17 5.8300% 0.02038% Actual/360 Actual/360 120 119 11 360 360 470,931.88 69,108,779.92 N79,000,000.00 79,000,000.00 1.35% 5.95% 04/12/07 06/01/07 05/01/17 5.5000% 0.02038% Actual/360 Actual/360 120 120 120 IO IO IO 79,000,000.00 N
69,675,000.00 69,675,000.00 1.19% 1.54% 04/13/07 06/11/07 05/11/17 5.9100% 0.02038% Actual/360 Actual/360 120 120 120 IO IO IO 69,675,000.00 N56,500,000.00 56,500,000.00 0.97% 1.25% 03/08/07 04/11/07 03/11/17 5.6000% 0.02038% Actual/360 Actual/360 120 118 118 IO IO IO 56,500,000.00 N51,700,000.00 51,700,000.00 0.88% 1.14% 03/09/07 04/11/07 03/11/17 5.7300% 0.02038% Actual/360 Actual/360 120 118 118 IO IO IO 51,700,000.00 N9,240,000.008,560,000.007,036,000.005,640,000.005,252,000.004,915,000.004,756,000.003,191,000.003,110,000.00
50,600,000.00 50,600,000.00 0.87% 1.12% 04/02/07 05/11/07 04/11/17 5.7300% 0.04038% Actual/360 Actual/360 120 119 119 IO IO IO 50,600,000.00 N50,000,000.00 50,000,000.00 0.86% 1.11% 03/16/07 05/11/07 04/11/17 5.7600% 0.02038% Actual/360 Actual/360 120 119 119 IO IO IO 50,000,000.00 N47,320,000.00 47,320,000.00 0.81% 3.56% 04/03/07 05/11/07 04/11/17 5.7800% 0.02038% Actual/360 Actual/360 120 119 119 IO IO IO 47,320,000.00 N47,000,000.00 47,000,000.00 0.80% 1.04% 03/09/07 04/11/07 03/11/17 5.6400% 0.02038% Actual/360 Actual/360 120 118 58 360 360 271,003.79 43,752,354.37 N46,400,000.00 46,400,000.00 0.79% 3.49% 02/28/07 04/11/07 03/11/17 5.53000% 0.02038% Actual/360 Actual/360 120 118 118 IO IO IO 46,400,000.00 N
45,386,369.00 45,386,369.00 0.78% 1.00% 03/21/07 05/11/07 04/11/17 5.4600% 0.02038% 30/360 30/360 120 119 119 IO IO IO 45,386,369.00 N41,480,000.00 41,480,000.00 0.71% 0.92% 02/28/07 04/11/07 03/11/17 5.4800% 0.02038% Actual/360 Actual/360 120 118 118 IO IO IO 41,480,000.00 N
39,712,500.00 39,712,500.00 0.68% 0.88% 03/01/07 04/11/07 03/11/17 6.0500% 0.04538% Actual/360 Actual/360 120 118 58 360 360 239,374.60 37,175,369.19 N39,000,000.00 39,000,000.00 0.67% 0.86% 03/23/07 05/11/07 04/11/17 5.6000% 0.02038% 30/360 30/360 120 119 119 IO IO IO 39,000,000.00 Y38,000,000.00 38,000,000.00 0.65% 0.84% 03/13/07 05/11/07 04/11/17 5.6500% 0.02038% Actual/360 Actual/360 120 119 119 IO IO IO 38,000,000.00 N36,600,000.00 36,600,000.00 0.63% 0.81% 12/15/06 02/11/07 01/11/17 5.6500% 0.02038% Actual/360 Actual/360 120 116 116 IO IO IO 36,600,000.00 N36,500,000.00 36,500,000.00 0.62% 0.81% 03/28/07 05/11/07 04/11/17 5.4400% 0.02038% Actual/360 Actual/360 120 119 119 IO IO IO 36,500,000.00 N36,200,000.00 36,200,000.00 0.62% 2.73% 03/29/07 05/01/07 04/01/17 5.6200% 0.02038% Actual/360 Actual/360 120 119 83 360 360 208,273.36 34,781,754.73 N36,000,000.00 35,962,199.35 0.62% 2.71% 03/14/07 05/11/07 04/11/17 5.7200% 0.04538% Actual/360 120 119 360 359 209,400.65 30,282,991.97 N35,125,000.00 35,125,000.00 0.60% 0.78% 03/06/07 04/11/07 03/11/17 5.9700% 0.02038% Actual/360 Actual/360 120 118 118 IO IO IO 35,125,000.00 N32,500,000.00 32,500,000.00 0.56% 2.45% 03/30/07 05/11/07 04/11/14 5.7400% 0.02038% Actual/360 Actual/360 84 83 83 IO IO IO 32,500,000.00 N32,000,000.00 32,000,000.00 0.55% 2.41% 01/31/07 03/11/07 02/11/12 6.1300% 0.02038% Actual/360 Actual/360 60 57 57 IO IO IO 32,000,000.00 N31,900,000.00 31,900,000.00 0.55% 0.71% 01/30/07 03/11/07 02/11/17 5.6500% 0.02038% Actual/360 Actual/360 120 117 117 IO IO IO 31,900,000.00 N30,400,000.00 30,400,000.00 0.52% 2.29% 02/14/07 04/11/07 03/11/17 5.7500% 0.02038% Actual/360 Actual/360 120 118 34 360 360 177,406.15 27,340,670.12 N30,400,000.00 30,400,000.00 0.52% 0.67% 03/30/07 05/11/07 04/11/17 5.6500% 0.02038% Actual/360 Actual/360 120 119 119 IO IO IO 30,400,000.00 N29,100,000.00 29,100,000.00 0.50% 2.19% 03/29/07 05/11/07 04/11/12 6.0000% 0.04538% Actual/360 Actual/360 60 59 59 IO IO IO 29,100,000.00 N28,700,000.00 28,700,000.00 0.49% 2.16% 02/01/07 03/11/07 02/11/12 5.9200% 0.02038% Actual/360 Actual/360 60 57 57 IO IO IO 28,700,000.00 N28,080,000.00 28,080,000.00 0.48% 0.62% 02/28/07 04/11/07 03/11/17 5.4800% 0.02038% Actual/360 Actual/360 120 118 118 IO IO IO 28,080,000.00 N28,020,000.00 28,020,000.00 0.48% 0.62% 02/28/07 04/11/07 03/11/17 5.4800% 0.02038% Actual/360 Actual/360 120 118 118 IO IO IO 28,020,000.00 N
27,500,000.00 27,471,119.03 0.47% 0.61% 03/27/07 05/11/07 04/11/17 5.7190% 0.02038% Actual/360 120 119 360 359 159,941.38 23,132,138.21 N26,100,000.00 26,100,000.00 0.45% 0.58% 02/08/07 03/11/07 02/11/17 6.0000% 0.02038% Actual/360 Actual/360 120 117 117 IO IO IO 26,100,000.00 N26,000,000.00 26,000,000.00 0.44% 0.58% 03/12/07 05/11/07 04/11/17 6.0000% 0.02038% Actual/360 Actual/360 120 119 59 360 360 155,883.14 24,321,716.01 N25,600,000.00 25,600,000.00 0.44% 0.57% 03/23/07 05/11/07 04/11/17 5.6000% 0.02038% Actual/360 Actual/360 120 119 59 360 360 146,964.22 23,816,829.11 N25,500,000.00 25,500,000.00 0.44% 0.56% 03/26/07 05/11/07 04/11/17 5.7500% 0.02038% Actual/360 Actual/360 120 119 95 360 360 148,811.08 24,871,681.69 N
25,000,000.00 25,000,000.00 0.43% 0.55% 04/03/07 05/11/07 04/11/17 6.0700% 0.02038% Actual/360 Actual/360 120 119 23 360 360 151,014.59 22,192,109.72 N24,150,000.00 24,150,000.00 0.41% 1.82% 02/27/07 04/11/07 03/11/17 5.6000% 0.02038% Actual/360 Actual/360 120 118 118 IO IO IO 24,150,000.00 N24,000,000.00 24,000,000.00 0.41% 0.53% 01/02/07 02/11/07 01/11/17 5.6700% 0.02038% Actual/360 Actual/360 120 116 56 360 360 138,840.17 22,353,152.35 N23,825,000.00 23,825,000.00 0.41% 1.79% 02/28/07 04/11/07 03/11/17 5.6000% 0.02038% Actual/360 Actual/360 120 118 118 IO IO IO 23,825,000.00 N22,520,000.00 22,520,000.00 0.39% 0.50% 03/20/07 05/11/07 04/11/17 5.6900% 0.02038% Actual/360 Actual/360 120 119 119 IO IO IO 22,520,000.00 N22,150,000.00 22,150,000.00 0.38% 1.67% 02/28/07 04/11/07 03/11/17 5.6000% 0.02038% Actual/360 Actual/360 120 118 118 IO IO IO 22,150,000.00 N22,000,000.00 22,000,000.00 0.38% 1.66% 03/30/07 05/11/07 04/11/17 5.6200% 0.04038% Actual/360 Actual/360 120 119 119 IO IO IO 22,000,000.00 N21,825,000.00 21,825,000.00 0.37% 1.64% 03/20/07 05/11/07 04/11/17 5.3100% 0.02038% Actual/360 Actual/360 120 119 59 360 360 121,330.81 20,220,798.28 N21,700,000.00 21,700,000.00 0.37% 0.48% 03/29/07 05/11/07 04/11/17 5.8600% 0.02038% Actual/360 Actual/360 120 119 119 IO IO IO 21,700,000.00 N21,000,000.00 21,000,000.00 0.36% 0.46% 03/16/07 05/11/07 04/11/17 5.6600% 0.02038% Actual/360 Actual/360 120 119 119 IO IO IO 21,000,000.00 N21,000,000.00 21,000,000.00 0.36% 1.58% 03/29/07 05/01/07 04/01/14 5.7300% 0.02038% Actual/360 Actual/360 84 83 83 IO IO IO 21,000,000.00 N20,750,000.00 20,750,000.00 0.35% 0.46% 04/05/07 05/11/07 04/11/17 5.6700% 0.02038% Actual/360 Actual/360 120 119 59 360 360 120,038.90 19,323,544.51 N20,560,000.00 20,560,000.00 0.35% 1.55% 03/21/07 05/11/07 04/11/12 5.8100% 0.06038% Actual/360 Actual/360 60 59 59 IO IO IO 20,560,000.00 N20,000,000.00 20,000,000.00 0.34% 0.44% 04/17/07 06/11/07 05/11/17 5.6600% 0.02038% Actual/360 Actual/360 120 120 120 IO IO IO 20,000,000.00 N20,000,000.00 20,000,000.00 0.34% 1.51% 02/26/07 04/01/07 03/01/12 5.7900% 0.02038% Actual/360 Actual/360 60 58 58 IO IO IO 20,000,000.00 N20,000,000.00 20,000,000.00 0.34% 1.51% 04/12/07 06/11/07 05/11/17 5.3600% 0.02038% Actual/360 Actual/360 120 120 120 IO IO IO 20,000,000.00 N19,300,000.00 19,300,000.00 0.33% 0.43% 03/01/07 04/01/07 03/01/12 5.6390% 0.02038% Actual/360 Actual/360 60 58 58 IO IO IO 19,300,000.00 N19,280,000.00 19,280,000.00 0.33% 0.43% 02/28/07 04/11/07 03/11/17 5.4800% 0.02038% Actual/360 Actual/360 120 118 118 IO IO IO 19,280,000.00 N18,500,000.00 18,500,000.00 0.32% 0.41% 03/14/07 05/11/07 04/11/17 5.5800% 0.02038% Actual/360 Actual/360 120 119 59 360 360 105,971.41 17,206,544.63 N
18,000,000.00 18,000,000.00 0.31% 0.40% 04/25/07 06/11/07 05/11/17 5.7000% 0.02038% Actual/360 Actual/360 120 120 60 360 360 104,472.08 16,770,073.73 N
18,000,000.00 18,000,000.00 0.31% 0.40% 02/09/07 04/01/07 03/01/12 6.7000% 0.02038% Actual/360 Actual/360 60 58 22 360 360 116,150.04 17,436,719.67 N17,670,000.00 17,670,000.00 0.30% 0.39% 04/10/07 06/01/07 05/01/17 5.9300% 0.02038% Actual/360 Actual/360 120 120 36 360 360 105,146.66 15,948,384.35 N17,250,000.00 17,250,000.00 0.30% 0.38% 03/19/07 05/11/07 04/11/17 5.7700% 0.02038% Actual/360 Actual/360 120 119 119 IO IO IO 17,250,000.00 N17,000,000.00 17,000,000.00 0.29% 0.38% 02/05/07 04/01/07 03/01/17 6.2500% 0.02038% Actual/360 Actual/360 120 118 118 IO IO IO 17,000,000.00 N17,000,000.00 17,000,000.00 0.29% 0.38% 04/13/07 06/01/07 05/01/17 5.9000% 0.02038% Actual/360 Actual/360 120 120 60 360 360 100,833.21 15,881,830.11 N
16,800,000.00 16,800,000.00 0.29% 1.27% 02/28/07 04/11/07 03/11/17 6.0000% 0.02038% Actual/360 Actual/360 120 118 118 IO IO IO 16,800,000.00 N16,480,000.00 16,480,000.00 0.28% 1.24% 03/15/07 05/11/07 04/11/17 5.6600% 0.04038% Actual/360 Actual/360 120 119 119 IO IO IO 16,480,000.00 N16,400,000.00 16,400,000.00 0.28% 0.36% 12/07/06 01/11/07 12/11/16 5.6700% 0.02038% Actual/360 Actual/360 120 115 55 360 360 94,874.12 15,275,224.31 N16,400,000.00 16,400,000.00 0.28% 0.36% 03/13/07 05/11/07 04/11/17 5.7100% 0.02038% Actual/360 Actual/360 120 119 11 360 360 95,289.62 14,122,095.87 N16,016,000.00 16,016,000.00 0.27% 1.21% 03/30/07 05/11/07 04/11/17 5.8750% 0.02038% Actual/360 Actual/360 120 119 119 IO IO IO 16,016,000.00 Y15,700,000.00 15,700,000.00 0.27% 0.35% 03/01/07 04/01/07 03/01/12 5.6390% 0.02038% Actual/360 Actual/360 60 58 58 IO IO IO 15,700,000.00 N15,600,000.00 15,600,000.00 0.27% 0.35% 04/25/07 06/01/07 05/01/12 6.0600% 0.02038% Actual/360 60 60 240 240 112,303.90 13,335,733.71 N15,150,000.00 15,150,000.00 0.26% 1.14% 03/29/07 05/01/07 04/01/17 5.5900% 0.02038% Actual/360 Actual/360 120 119 59 360 360 86,877.46 14,092,746.09 N
15,100,000.00 15,100,000.00 0.26% 0.33% 04/19/07 06/11/07 05/11/17 5.4600% 0.02038% Actual/360 Actual/360 120 120 84 360 360 88,695.89 14,530,796.90 N15,075,000.00 15,075,000.00 0.26% 0.33% 01/26/07 03/01/07 02/01/17 5.9000% 0.02038% Actual/360 Actual/360 120 117 33 360 360 89,415.33 13,594,663.14 N15,000,000.00 15,000,000.00 0.26% 0.33% 03/01/07 04/11/07 03/11/17 5.8000% 0.07038% Actual/360 Actual/360 120 118 118 IO IO IO 15,000,000.00 N14,950,000.00 14,950,000.00 0.26% 1.13% 03/22/07 05/11/07 04/11/17 6.0000% 0.02038% Actual/360 Actual/360 120 119 119 IO IO IO 14,950,000.00 Y14,200,000.00 14,200,000.00 0.24% 0.31% 05/01/07 06/11/07 05/11/17 5.8800% 0.02038% Actual/360 120 120 360 360 84,043.74 12,003,681.94 N13,640,000.00 13,640,000.00 0.23% 1.03% 03/29/07 05/11/07 04/11/17 5.7800% 0.02038% Actual/360 Actual/360 120 119 119 IO IO IO 13,640,000.00 N13,575,000.00 13,575,000.00 0.23% 1.02% 03/29/07 05/11/07 04/11/17 5.4000% 0.02038% Actual/360 Actual/360 120 119 59 360 360 76,227.80 12,593,588.55 N13,500,000.00 13,500,000.00 0.23% 0.30% 03/01/07 04/01/07 03/01/12 5.6390% 0.02038% Actual/360 Actual/360 60 58 58 IO IO IO 13,500,000.00 N13,375,000.00 13,375,000.00 0.23% 0.30% 01/26/07 03/01/07 02/01/17 5.9000% 0.02038% Actual/360 Actual/360 120 117 33 360 360 79,332.01 12,061,599.97 N7,125,000.006,250,000.0013,295,000.00 13,295,000.00 0.23% 1.00% 02/28/07 04/11/07 03/11/17 5.9400% 0.07038% Actual/360 Actual/360 120 118 118 IO IO IO 13,295,000.00 N13,200,000.00 13,200,000.00 0.23% 0.99% 02/26/07 04/01/07 03/01/17 6.1300% 0.02038% Actual/360 Actual/360 120 118 118 IO IO IO 13,200,000.00 N13,140,000.00 13,140,000.00 0.22% 0.29% 02/28/07 04/11/07 03/11/17 5.4800% 0.02038% Actual/360 Actual/360 120 118 118 IO IO IO 13,140,000.00 N12,760,000.00 12,760,000.00 0.22% 0.96% 03/30/07 05/11/07 04/11/17 5.6000% 0.07038% Actual/360 Actual/360 120 119 119 IO IO IO 12,760,000.00 N12,675,000.00 12,675,000.00 0.22% 0.95% 03/30/07 05/06/07 04/06/17 5.8800% 0.08038% Actual/360 Actual/360 120 119 119 IO IO IO 12,675,000.00 N12,500,000.00 12,500,000.00 0.21% 0.28% 05/08/07 06/11/07 05/11/14 5.6600% 0.02038% 30/360 30/360 84 84 84 IO IO IO 12,500,000.00 Y12,200,000.00 12,177,037.52 0.21% 0.27% 02/21/07 04/11/07 03/11/17 5.8700% 0.02038% Actual/360 120 118 360 358 72,128.63 10,310,146.45 N12,000,000.00 12,000,000.00 0.21% 0.90% 02/28/07 04/11/07 03/11/17 5.9700% 0.02038% Actual/360 Actual/360 120 118 118 IO IO IO 12,000,000.00 N12,000,000.00 12,000,000.00 0.21% 0.27% 12/21/06 02/11/07 01/11/17 5.6800% 0.02038% Actual/360 Actual/360 120 116 56 360 360 69,496.04 11,178,132.21 N11,513,000.00 11,513,000.00 0.20% 0.87% 02/28/07 04/11/07 03/11/17 5.9400% 0.07038% Actual/360 Actual/360 120 118 118 IO IO IO 11,513,000.00 N11,505,000.00 11,505,000.00 0.20% 0.87% 03/29/07 05/11/07 04/11/17 6.0000% 0.02038% Actual/360 Actual/360 120 119 119 IO IO IO 11,505,000.00 Y11,440,000.00 11,440,000.00 0.20% 0.25% 03/06/07 04/11/07 03/11/17 5.8500% 0.02038% Actual/360 Actual/360 120 118 58 360 360 67,489.24 10,680,391.88 N11,160,000.00 11,160,000.00 0.19% 0.84% 02/28/07 04/11/07 03/11/12 6.1800% 0.02038% Actual/360 Actual/360 60 58 58 IO IO IO 11,160,000.00 N
11,155,000.00 11,155,000.00 0.19% 0.84% 02/14/07 04/11/07 03/11/17 6.5900% 0.02038% Actual/360 Actual/360 120 118 58 360 360 71,168.73 10,514,835.20 N10,825,000.00 10,825,000.00 0.19% 0.82% 03/22/07 05/01/07 04/01/17 5.7200% 0.02038% Actual/360 Actual/360 120 119 59 360 360 62,965.61 10,087,828.03 N10,000,000.00 10,000,000.00 0.17% 0.75% 03/20/07 05/11/07 04/11/12 6.3500% 0.02038% Actual/360 Actual/360 60 59 59 IO IO IO 10,000,000.00 N9,600,000.00 9,600,000.00 0.16% 0.21% 03/07/07 04/11/07 03/11/12 5.8400% 0.02038% Actual/360 Actual/360 60 58 58 IO IO IO 9,600,000.00 N9,300,000.00 9,300,000.00 0.16% 0.70% 03/29/07 05/11/07 04/11/12 5.9000% 0.07038% Actual/360 Actual/360 60 59 59 IO IO IO 9,300,000.00 N9,200,000.00 9,200,000.00 0.16% 0.69% 04/03/07 05/11/07 04/11/17 5.6100% 0.02038% Actual/360 Actual/360 120 119 119 IO IO IO 9,200,000.00 N9,000,000.00 9,000,000.00 0.15% 0.68% 03/30/07 05/11/07 04/11/17 5.8900% 0.02038% Actual/360 Actual/360 120 119 119 IO IO IO 9,000,000.00 N8,810,000.00 8,810,000.00 0.15% 0.20% 11/07/06 12/11/06 11/11/11 6.0200% 0.02038% Actual/360 Actual/360 60 54 54 IO IO IO 8,810,000.00 N
8,648,000.00 8,648,000.00 0.15% 0.65% 03/06/07 05/01/07 04/01/17 5.8600% 0.02038% Actual/360 Actual/360 120 119 59 360 360 51,073.31 8,074,550.60 N
Cut-Off Date Loan Balance ($)
% of Aggregate Cut-Off Date
Balance
% of Aggregate Cut-Off Date
Group 1 Balance
% of Aggregate Cut-Off Date
Group 2 BalanceOrigination
DateFirst Pay
DateMaturity Date
or ARD
Loan Administrative
Cost Rate
Interest Accrual Method
Interest Accural Method
During IO
Original Term to Maturity or ARD (Mos.)
Remaining Term to
Maturity or ARD (Mos.)
Remaining IO Period (Mos.)
Original Amort Term
(Mos.)
Remaining Amort Term
(Mos.)Monthly P&I Payments ($)
Maturity Date or ARD Balloon Balance ($)

Prepayment Provisions Appraised Value ($) Appraisal Date DSCR (x) Year Renovated Number of Units Most Recent Period
L(26),D(91),O(3) 1,340,000,000 1 1 12/01/06 1.11 80.00% 80.00% 2002 1,101,779 Sq. Ft. 972.97 100.0% 01/31/07 2005
GRTR1%orYM(53),O(7) or L(24),D(29),O(7) 3,432,650,000 2 2 Various 1.27 78.66% 78.66% Various Various 9,848,341 Sq. Ft. 274.16 96.9% 04/01/07 Oct-06 TTM529,000,000 2.01 2.01 03/01/07 1991 678,348 Sq. Ft. 95.4% 04/01/07 Oct-06 TTM419,000,000 2.02 2.02 03/15/07 1970 2003 904,226 Sq. Ft. 100.0% 04/01/07 Oct-06 TTM394,000,000 2.03 2.03 03/01/07 1983 944,141 Sq. Ft. 92.8% 04/01/07 Oct-06 TTM356,100,000 2.04 2.04 03/01/07 1980 1993 711,495 Sq. Ft. 91.3% 04/01/07 Oct-06 TTM300,300,000 2.05 2.05 03/15/07 1980 731,234 Sq. Ft. 99.5% 04/01/07 Oct-06 TTM200,700,000 2.06 2.06 03/01/07 2000 473,988 Sq. Ft. 97.9% 04/01/07 Oct-06 TTM186,500,000 2.07 2.07 03/01/07 1999 463,182 Sq. Ft. 100.0% 04/01/07 Oct-06 TTM182,150,000 2.08 2.08 03/01/07 1986 465,765 Sq. Ft. 95.6% 04/01/07 Oct-06 TTM151,800,000 2.09 2.09 03/01/07 1978 466,948 Sq. Ft. 95.8% 04/01/07 Oct-06 TTM144,000,000 2.10 2.10 03/15/07 1975 294,521 Sq. Ft. 97.8% 04/01/07 Oct-06 TTM106,000,000 2.11 2.11 03/15/07 1985 329,695 Sq. Ft. 94.8% 04/03/07 Oct-06 TTM92,600,000 2.12 2.12 03/01/07 1985 251,088 Sq. Ft. 100.0% 04/01/07 Oct-06 TTM96,000,000 2.13 2.13 03/01/07 1991 163,936 Sq. Ft. 99.4% 04/01/07 Oct-06 TTM85,500,000 2.14 2.14 03/01/07 1984 277,672 Sq. Ft. 96.8% 04/01/07 Oct-06 TTM75,200,000 2.15 2.15 03/15/07 2000 216,469 Sq. Ft. 100.0% 04/01/07 Oct-06 TTM63,500,000 2.16 2.16 03/01/07 1913 1987 102,822 Sq. Ft. 100.0% 04/01/07 Oct-06 TTM50,300,000 2.17 2.17 03/01/07 1987 148,952 Sq. Ft. 91.5% 04/01/07 Oct-06 TTM440,000,000 2.18 2.18 03/15/07 1988 764,103 Sq. Ft. 98.3% 04/01/07 Oct-06 TTM200,000,000 2.19 2.19 03/15/07 1980 380,743 Sq. Ft. 99.4% 04/01/07 Oct-06 TTM378,684,000 2.20 2.20 03/01/07 1988 1,079,013 Sq. Ft. 96.9% 04/01/07 Oct-06 TTM
L(27),D(86),O(7) 2,000,000,000 3 3 03/01/07 1.46 60.75% 60.75% 1957 1999 1,454,110 Sq. Ft. 835.56 98.3% 01/11/07L(26),D(84),O(10) 353,900,000 4 4 02/12/07 1.34 73.47% 73.47% 1991 1998 382,012 Sq. Ft. 680.61 96.8% 01/22/07 Year End 12/31/2006
L(29),D(87),O(4) 5,400,000,000 5 5 11/01/06 1.73 55.56% 55.56% 1945 2006 11,227 Units 267,212.97 98.3% 11/10/06 20065.01 5.01 1945 2006 8,746 Units 98.5% 11/10/06 20065.02 5.02 1945 2006 2,481 Units 97.7% 11/10/06 2006
L(25),D(56),O(3) 245,000,000 6 6 03/01/07 1.05 81.53% 72.01% 1983 2007 750 Rooms 266,343.66 100.0% 04/09/07 2006L(25),D(91),O(4) 232,000,000 7 7 04/01/07 1.50 75.86% 75.86% 1982 2005 402 Rooms 437,810.95 83.8% 01/31/07 TTM Feb 06-Jan 07L(25),D(93),O(2) 168,000,000 8 8 Various 1.47 76.43% 71.45% Various Various 655 Rooms 196,042.75 79.1% 12/29/06 TTM 02/2007
95,000,000 8.01 8.01 03/01/07 2001 2006 405 Rooms 81.3% 12/29/06 TTM 02/200773,000,000 8.02 8.02 02/28/07 1999 250 Rooms 75.6% 12/29/06 TTM 02/2007
L(25),D(93),O(2) 157,700,000 9 9 Various 1.57 80.19% 74.97% Various 1,137 Rooms 111,227.79 75.9% 12/29/06 TTM 02/200728,500,000 9.01 9.01 02/27/07 1999 200 Rooms 75.1% 12/29/06 TTM 02/200727,400,000 9.02 9.02 03/05/07 2001 164 Rooms 80.5% 12/29/06 TTM 02/200725,600,000 9.03 9.03 03/05/07 2001 144 Rooms 86.2% 12/29/06 TTM 02/200725,000,000 9.04 9.04 02/21/07 2002 199 Rooms 66.5% 12/29/06 TTM 02/200717,500,000 9.05 9.05 02/23/07 2001 136 Rooms 73.0% 12/29/06 TTM 02/200717,700,000 9.06 9.06 02/26/07 1998 126 Rooms 75.4% 12/29/06 TTM 02/200716,000,000 9.07 9.07 03/02/07 2002 168 Rooms 77.4% 12/29/06 TTM 02/2007
GRTR2%orYM(116),O(4) 155,500,000 10 10 12/06/06 1.20 80.00% 74.43% 1981 369,853 Sq. Ft. 336.35 95.6% 02/01/07 2006
L(25),D(32),O(3) 171,230,000 11 11 Various 1.42 71.54% 71.54% Various Various Various Various Various 98.7% 04/01/07 3 Months Annualized 12/31/200617,600,000 11.01 11.01 04/01/08 1931 60 Units 100.0% 04/01/0711,800,000 11.02 11.02 04/01/08 1925 62 Units 100.0% 04/01/0710,600,000 11.03 11.03 04/01/08 1920 16 Units 100.0% 04/01/079,800,000 11.04 11.04 04/01/08 1926 37 Units 100.0% 04/01/0710,200,000 11.05 11.05 04/01/08 1922 28 Units 100.0% 04/01/079,100,000 11.06 11.06 04/01/08 1926 30 Units 96.7% 04/01/079,000,000 11.07 11.07 04/01/08 1963 16 Units 93.8% 04/01/078,800,000 11.08 11.08 04/01/08 1926 1999 43 Units 97.7% 04/01/078,700,000 11.09 11.09 04/01/08 1922 34 Units 100.0% 04/01/076,900,000 11.10 11.10 04/01/08 1919 29 Units 100.0% 04/01/075,900,000 11.11 11.11 04/01/08 1926 29 Units 100.0% 04/01/075,700,000 11.12 11.12 04/01/08 1910 37 Units 91.9% 04/01/076,300,000 11.13 11.13 04/01/08 1922 2001 28 Units 96.4% 04/01/075,400,000 11.14 11.14 04/01/08 1925 15 Units 93.3% 04/01/075,200,000 11.15 11.15 04/01/08 1925 12 Units 100.0% 04/01/074,700,000 11.16 11.16 04/01/08 1965 12 Units 100.0% 04/01/074,200,000 11.17 11.17 04/01/08 1913 2003 19 Units 100.0% 04/01/074,600,000 11.18 11.18 03/01/08 1922 21 Units 100.0% 04/01/073,300,000 11.19 11.19 03/12/07 1917 3,470 Sq. Ft. 100.0% 04/01/073,900,000 11.20 11.20 04/01/08 1923 23 Units 100.0% 04/01/073,600,000 11.21 11.21 04/01/08 1912 12 Units 100.0% 04/01/073,400,000 11.22 11.22 04/01/08 1914 18 Units 100.0% 04/01/072,600,000 11.23 11.23 04/01/08 1905 1 Units 100.0% 04/01/072,000,000 11.24 11.24 04/01/08 1908 8 Units 100.0% 04/01/072,300,000 11.25 11.25 03/01/08 1910 14 Units 100.0% 04/01/071,700,000 11.26 11.26 03/12/07 1911 6,500 Sq. Ft. 100.0% 04/01/071,350,000 11.27 11.27 03/12/07 1907 1 Units 100.0% 04/01/071,750,000 11.28 11.28 04/01/08 1963 7 Units 100.0% 04/01/07830,000 11.29 11.29 04/01/08 1908 1 Units 100.0% 04/01/07
L(25),D(93),O(2) 145,500,000 12 12 Various 1.54 79.45% 74.27% Various Various 905 Rooms 127,734.81 70.9% 12/29/06 TTM 02/200752,100,000 12.01 12.01 02/16/07 2001 235 Rooms 70.0% 12/29/06 TTM 02/200729,300,000 12.02 12.02 02/22/07 2001 2007 156 Rooms 81.5% 12/29/06 TTM 02/200728,500,000 12.03 12.03 02/28/07 1999 180 Rooms 66.1% 12/29/06 TTM 02/200723,600,000 12.04 12.04 02/27/07 1998 153 Rooms 77.9% 12/29/06 TTM 02/200712,000,000 12.05 12.05 03/02/07 2002 181 Rooms 61.6% 12/29/06 TTM 02/2007
L(25),D(92),O(3) 141,700,000 13 13 Various 1.35 80.00% 80.00% Various Various 724,097 Sq. Ft. 156.55 95.6% 04/06/07 In Place at Closing92,700,000 13.01 13.01 04/01/08 1986 2002 475,043 Sq. Ft. 96.2% 04/06/07 In Place at Closing49,000,000 13.02 13.02 09/28/06 1989 249,054 Sq. Ft. 94.3% 04/06/07 In Place at Closing
L(26),D(91),O(3) 120,000,000 14 14 01/25/07 1.20 81.67% 81.67% 1968 2006 687 Units 142,649.20 93.4% 02/20/07 2/20/07 RRL(25),D(92),O(3) 160,000,000 15 15 01/01/07 1.37 50.00% 43.19% 1928 2006 249 Rooms 321,285.14 72.3% 12/31/06 T12 Thru 12/06L(24),GRTR1%orYM(92),O(4) 113,200,000 16 16 03/01/07 1.32 69.79% 69.79% 1981 2003 241 Units 327,800.83 99.6% 03/31/07 12/31/2006
L(24),D(93),O(3) 87,100,000 17 17 03/01/08 1.24 79.99% 79.99% 2007 346,042 Sq. Ft. 201.35 90.0% 04/12/07 In Place at ClosingL(26),D(90),O(4) 96,100,000 18 18 01/26/07 1.36 58.79% 58.79% 1956 2005 143,825 Sq. Ft. 392.84 96.4% 01/01/07 2006L(11),GRTR1%orYM(105),O(4) 64,000,000 19 19 Various 1.23 80.78% 80.78% Various Various 601,889 Sq. Ft. 85.90 95.0% 03/01/07 2006
10,400,000 19.01 19.01 02/06/07 1984 100,612 Sq. Ft. 94.6% 03/01/07 20069,800,000 19.02 19.02 02/06/07 1987 100,928 Sq. Ft. 100.0% 03/01/07 20067,900,000 19.03 19.03 02/06/07 1985 2004 77,712 Sq. Ft. 100.0% 03/01/07 20066,100,000 19.04 19.04 02/06/07 1989 60,000 Sq. Ft. 100.0% 03/01/07 20066,300,000 19.05 19.05 02/06/07 1981 60,600 Sq. Ft. 100.0% 03/01/07 20065,800,000 19.06 19.06 02/06/07 1983 68,700 Sq. Ft. 100.0% 03/01/07 20067,800,000 19.07 19.07 02/06/07 1984 59,146 Sq. Ft. 58.0% 03/01/07 20064,700,000 19.08 19.08 02/06/07 1988 32,669 Sq. Ft. 100.0% 03/01/07 20065,200,000 19.09 19.09 02/06/07 1987 41,522 Sq. Ft. 100.0% 03/01/07 2006
L(25),D(92),O(3) 64,500,000 20 20 02/19/07 1.37 78.45% 78.45% 1993 410,117 Sq. Ft. 123.38 96.3% 03/08/07 2006 (Oct. Ann)L(25),D(91),O(4) 70,000,000 21 21 12/01/06 1.24 71.43% 71.43% 1967 274,528 Sq. Ft. 182.13 81.3% 03/01/07 2006 L(25),D(83),1%(6),O(6) 59,500,000 22 22 03/02/07 1.18 79.53% 79.53% 1999 432 Units 109,537.04 98.4% 03/15/07 T 12 Through 2/28/2007L(26),D(91),O(3) 54,000,000 23 23 01/22/07 1.20 87.04% 81.02% 1960 2006 277,799 Sq. Ft. 169.19 89.4% 01/21/07L(26),D(91),O(3) 58,000,000 24 24 08/28/06 1.36 80.00% 80.00% 2004 361 Units 128,531.86 87.8% 02/01/07
L(25),GRTR1%orYM(91),O(4) 78,370,000 25 25 12/15/06 2.20 57.91% 57.91% 2004 555,906 Sq. Ft. 81.64 93.6% 04/15/07L(26),GRTR1%orYM(88),O(6) 51,850,000 26 26 07/07/06 1.19 80.00% 80.00% 1996 154,742 Sq. Ft. 268.06 96.3% 01/03/07 2006
L(6),GRTR1%orYM(111),O(3) 59,600,000 27 27 01/01/09 1.35 66.63% 62.37% 1992 300 Rooms 132,375.00 65.9% 12/31/06 2006L(25),GRTR1%orYM(91),O(4) 65,000,000 28 28 12/22/06 1.87 60.00% 60.00% 1970 2006 462,717 Sq. Ft. 84.28 100.0% 02/01/07L(25),D(92)or(GRTR1%orYM(92)),O(3) 48,000,000 29 29 02/16/07 1.01 79.17% 79.17% 1982 1999 107,338 Sq. Ft. 354.02 87.9% 12/31/06 2006L(28),D(89)or(GRTR1%orYM(89)),O(3) 47,600,000 30 30 11/27/06 1.31 76.89% 76.89% 1963 1999 101,317 Sq. Ft. 361.24 100.0% 11/28/06 1/06-8/06 Ann.L(25),D(91),O(4) 46,000,000 31 31 03/09/07 1.37 79.35% 79.35% 1986 154,136 Sq. Ft. 236.80 92.2% 03/01/07 In-PlaceL(48),GRTR1%orYM(68),O(4) 53,200,000 32 32 03/12/07 1.03 68.05% 65.38% 1996 230 Units 157,391.30 94.8% 02/28/07 T-12 through 2/28/2007L(25),D(92),O(3) 46,100,000 33 33 02/12/07 1.20 78.01% 65.69% 1989 2005 484 Units 74,302.06 92.8% 02/28/07 2006L(26),D(91),O(3) 44,100,000 34 34 01/04/07 1.21 79.65% 79.65% 1984 2004 203,000 Sq. Ft. 173.03 100.0% 02/16/07L(25),D(35),O(24) 43,500,000 35 35 02/09/07 1.27 74.71% 74.71% 1994 336 Units 96,726.19 92.9% 03/01/07 T 12 Through 1/31/2007GRTR1%orYM(53),O(7) 40,200,000 36 36 01/05/07 1.40 79.60% 79.60% 2007 318 Units 100,628.93 55.0% 03/13/07L(27),D(90)or(GRTR1%orYM(90)),O(3) 46,800,000 37 37 12/04/06 1.39 68.16% 68.16% 1965 2002 104,394 Sq. Ft. 305.57 97.8% 01/19/07 2006 Ann.L(26),D(91),O(3) 39,000,000 38 38 01/06/07 1.22 77.95% 70.10% 1999 384 Units 79,166.67 84.4% 03/16/07 2006L(25),D(91),O(4) 38,000,000 39 39 02/16/07 1.21 80.00% 80.00% 1992 168,263 Sq. Ft. 180.67 100.0% 03/23/07 2006L(25),GRTR1%orYM(10),O(25) 42,600,000 40 40 02/23/07 1.36 68.31% 68.31% 1980 554 Units 52,527.08 91.3% 02/12/07 Year End 12/31/2006L(27),D(30),O(3) 36,000,000 41 41 11/21/06 1.40 79.72% 79.72% 2000 400 Units 71,750.00 91.5% 02/01/07 2006L(26),GRTR1%orYM(88),O(6) 35,100,000 42 42 07/07/06 1.36 80.00% 80.00% 1997 99,560 Sq. Ft. 282.04 100.0% 01/03/07 2006L(26),GRTR1%orYM(88),O(6) 35,025,000 43 43 07/07/06 1.27 80.00% 80.00% 2000 94,286 Sq. Ft. 297.18 100.0% 01/03/07 2006
L(48),D(69),O(3) 40,200,000 44 44 01/01/09 1.33 68.34% 57.54% 1974 2006 295 Rooms 93,122.44 75.1% 01/31/07 T12L(27),D(87),O(6) 29,000,000 45 45 01/16/07 1.15 90.00% 90.00% 1969 2005 143,450 Sq. Ft. 181.94 80.9% 02/01/07 7 Months Annualized 7/31/2006L(25),D(91),O(4) 35,000,000 46 46 01/23/07 1.50 74.29% 69.49% 1984 276,329 Sq. Ft. 94.09 99.2% 03/01/07 2006L(25),D(92),O(3) 32,300,000 47 47 02/27/07 1.33 79.26% 73.74% 1968 1996 278,655 Sq. Ft. 91.87 87.2% 03/20/07 2006L(25),D(91),O(4) 34,100,000 48 48 03/07/07 1.28 74.78% 72.94% 2000 192,786 Sq. Ft. 132.27 95.4% 03/15/07 Year One
L(25),D(91),O(4) 34,230,000 49 49 08/23/08 1.25 73.04% 64.83% 2006 219,096 Sq. Ft. 114.11 82.0% 03/22/07L(26),D(90),O(4) 32,500,000 50 50 02/01/07 1.38 74.31% 74.31% 1999 192 Units 125,781.25 97.1% 01/31/07 2006L(28),D(89),O(3) 30,400,000 51 51 12/06/06 1.21 78.95% 73.53% 1984 185,354 Sq. Ft. 129.48 95.4% 12/31/06 2006L(26),D(90),O(4) 29,600,000 52 52 02/05/07 1.36 80.49% 80.49% 2003 192 Units 124,088.54 97.8% 01/31/07 2006 L(25),D(92),O(3) 28,200,000 53 53 02/02/07 1.22 79.86% 79.86% 1993 52,875 Sq. Ft. 425.91 98.8% 02/28/07 2006L(26),D(90),O(4) 28,450,000 54 54 02/05/07 1.33 77.86% 77.86% 2004 180 Units 123,055.56 98.2% 01/31/07 2006 L(25),D(91),O(4) 27,500,000 55 55 02/07/07 1.21 80.00% 80.00% 1998 2006 336 Units 65,476.19 93.2% 02/16/07 T3 Thru 1/07L(25),D(91),O(4) 29,100,000 56 56 12/18/06 1.20 75.00% 69.49% 2001 364 Units 59,958.79 92.9% 03/16/07 2006L(25),D(92),O(3) 28,000,000 57 57 02/12/07 1.40 77.50% 77.50% 1964 1997 109,496 Sq. Ft. 198.18 92.3% 03/05/07 2006GRTR1%orYM(25),D(91),O(4) 27,600,000 58 58 02/07/07 1.16 76.09% 76.09% 1960 2006 45,335 Sq. Ft. 463.22 100.0% 04/01/07L(25),D(35),O(24) 28,600,000 59 59 02/20/07 1.42 73.43% 73.43% 1999 312 Units 67,307.69 98.4% 03/02/07 T 12 Through 1/31/2007L(25),D(92),O(3) 26,000,000 60 60 01/12/07 1.15 79.81% 74.32% 2005 103,263 Sq. Ft. 200.94 94.0% 03/26/07 2006L(25),GRTR1%orYM(31),O(4) 25,735,000 61 61 01/22/07 1.36 79.89% 79.89% 2005 210 Units 97,904.76 93.8% 04/17/07L(24),D(93),O(3) 39,100,000 62 62 03/01/07 1.54 51.15% 51.15% 1962 2001 210,426 Sq. Ft. 95.05 78.9% 02/14/07 2006L(26),D(32),O(2) 25,500,000 63 63 01/04/07 1.36 78.43% 78.43% 2001 248 Units 80,645.16 94.4% 02/11/07 2007 Annualized 01/31/2007L(24),D(92),O(4) 31,600,000 64 64 10/10/06 1.82 63.29% 63.29% 2006 325 Units 61,538.46 95.7% 03/21/07 T-3 Mos Jan-07L(26),D(10),DorGRTR1%orYM(21),O(3) 26,250,000 65 65 02/01/07 1.38 73.52% 73.52% 2000 84,652 Sq. Ft. 227.99 100.0% 05/01/07 12/31/2006L(26),GRTR1%orYM(88),O(6) 24,100,000 66 66 07/07/06 1.34 80.00% 80.00% 1995 128,898 Sq. Ft. 149.58 100.0% 01/03/07 2006L(25),D(91),O(4) 23,200,000 67 67 01/30/07 1.23 79.74% 74.17% Various 1990 182,955 Sq. Ft. 101.12 96.4% Various 2006 (Ann.)
10,400,000 67.01 67.01 01/30/07 1988 1990 84,905 Sq. Ft. 96.5% 04/19/07 2006 (Ann.)6,700,000 67.02 67.02 01/30/07 1981 1990 51,843 Sq. Ft. 100.0% 04/19/07 2006 (Ann.)3,800,000 67.03 67.03 01/30/07 1980 1990 22,600 Sq. Ft. 100.0% 04/17/07 2006 (Ann.)2,300,000 67.04 67.04 01/30/07 1980 1990 23,607 Sq. Ft. 84.9% 04/19/07 2006 (Ann.)
L(48),D(68)or(GRTR1%orYM(68)),O(4) 23,600,000 68 68 02/02/07 1.20 76.27% 71.06% 2006 53,709 Sq. Ft. 335.14 82.2% 04/24/07 In Place at Closing
L(26),D(9),O(25) 23,320,000 69 69 01/17/07 1.44 77.19% 74.77% 1930 1980 404 Pads 44,554.46 95.0% 05/01/07 T-12 through 03/31/2007L(24),D(92),O(4) 22,090,000 70 70 02/25/07 1.25 79.99% 72.20% 2005 50,654 Sq. Ft. 348.84 100.0% 05/01/07L(25),D(92),O(3) 23,000,000 71 71 02/12/07 1.37 75.00% 75.00% 1895 2003 39,236 Sq. Ft. 439.65 100.0% 09/13/06L(26),D(90),O(4) 25,100,000 72 72 02/01/07 1.19 67.73% 67.73% 1986 137,095 Sq. Ft. 124.00 93.5% 03/31/07 12/31/2006L(24),D(94),O(2) 21,400,000 73 73 03/27/07 1.01 79.44% 74.21% 1996 60,000 Sq. Ft. 283.33 100.0% 05/01/07 12/31/2006
L(26),D(91),O(3) 21,000,000 74 74 02/12/07 1.39 80.00% 80.00% 1968 315 Pads 53,333.33 80.6% 04/19/07 Year End 12/31/2006L(25),D(91),O(4) 20,000,000 75 75 01/04/07 1.38 82.40% 82.40% 1995 231 Units 71,341.99 87.9% 12/31/06 2006L(29),D(88),O(3) 20,500,000 76 76 11/10/06 1.22 80.00% 74.51% 1988 150,711 Sq. Ft. 108.82 95.6% 12/31/06 2006 Annlized 8/06L(25),D(92),O(3) 20,660,000 77 77 01/18/07 1.24 79.38% 68.35% 2002 217,394 Sq. Ft. 75.44 100.0% 02/02/07 2006L(25),GRTR1%orYM(92),O(3) 24,750,000 78 78 02/15/07 1.50 64.71% 64.71% 1994 224 Units 71,500.00 96.4% 01/29/07 T-3 Jan 2007L(26),D(10),DorGRTR1%orYM(21),O(3) 21,400,000 79 79 02/01/07 1.24 73.36% 73.36% 1985 92,960 Sq. Ft. 168.89 100.0% 02/28/07 12/31/2006L(24),GRTR1%orYM(34),O(2) 22,000,000 80 80 01/29/07 1.19 70.91% 60.62% 2007 165,000 Sq. Ft. 94.55 100.0% 05/01/07L(25),GRTR1%orYM(91),O(4) 22,000,000 81 81 01/11/07 1.17 68.86% 64.06% 1973 2006 292 Units 51,883.56 91.4% 03/07/07 T-12 through 02/28/2007
L(24),D(92),O(4) 22,500,000 82 82 03/07/07 1.21 67.11% 64.58% 1984 2002 90,344 Sq. Ft. 167.14 96.1% 04/12/07 In-placeL(27),D(91),O(2) 19,800,000 83 83 11/21/06 1.41 76.14% 68.66% 2000 2007 119 Rooms 126,680.67 86.0% 11/30/06 T-12 through 11/30/2006L(26),D(91),O(3) 20,000,000 84 84 02/01/07 1.36 75.00% 75.00% 1910 2001 70,787 Sq. Ft. 211.90 97.9% 04/19/07 2006L(25),GRTR1%orYM(92),O(3) 23,100,000 85 85 11/01/06 1.70 64.72% 64.72% 1995 192 Units 77,864.58 95.7% 03/12/07 FY 2006 JulL(24),D(93),O(3) 17,900,000 86 86 03/09/07 1.45 79.33% 67.06% 2005 142 Rooms 100,000.00 65.1% 03/31/07 T 12 Through 2/28/2007L(25),D(83),1%(6),O(6) 17,390,000 87 87 03/02/07 1.24 78.44% 78.44% 1970 201 Units 67,860.70 97.0% 03/15/07 T 12 Through 2/28/2007L(25),D(91),O(4) 18,200,000 88 88 01/25/07 1.31 74.59% 69.20% 1986 2004 288 Units 47,135.42 96.5% 03/20/07 T-3 Feb-07L(26),D(10),DorGRTR1%orYM(21),O(3) 18,400,000 89 89 02/01/07 1.06 73.37% 73.37% 1985 64,648 Sq. Ft. 208.82 85.0% 02/28/07 12/31/2006L(27),D(91),O(2) 19,300,000 90 90 Various 1.32 69.30% 62.50% Various 211 Rooms 63,388.63 73.6% Various Various
10,300,000 90.01 90.01 11/15/06 1997 121 Rooms 70.4% 11/30/06 T-12 through 11/30/20069,000,000 90.02 90.02 11/16/06 2000 90 Rooms 78.0% 10/31/06 T-12 through 10/31/2006
L(26),D(91),O(3) 18,300,000 91 91 02/01/07 1.24 72.65% 72.65% 1987 224 Units 59,352.68 94.6% 01/10/07 Year End 12/31/2006L(26),D(82),O(12) 18,300,000 92 92 02/07/07 1.46 72.13% 72.13% 1997 192 Units 68,750.00 99.0% 01/30/07 8 Months Annualized 1/31/2007L(26),GRTR1%orYM(88),O(6) 16,925,000 93 93 07/07/06 0.65 77.64% 77.64% 1998 36,273 Sq. Ft. 362.25 61.9% 01/03/07 2006L(25),D(92),O(3) 16,100,000 94 94 02/19/07 1.28 79.25% 79.25% 1976 128 Units 99,687.50 93.8% 02/20/07 Year End 12/31/2006L(25),D(92),O(3) 19,100,000 95 95 02/08/07 1.29 66.36% 66.36% 1968 76 Units 166,776.32 98.7% 01/16/07 Year End 12/31/2006L(24),GRTR1%orYM(56),O(4) 25,680,000 96 96 02/08/07 2.66 48.68% 48.68% 1992 2006 40,966 Sq. Ft. 305.13 100.0% 02/28/07L(26),D(91),O(3) 16,300,000 97 97 01/16/07 1.30 74.71% 63.25% 2002 30,000 Sq. Ft. 405.90 100.0% 01/29/07 2006L(26),D(82),1%(6),O(6) 15,210,000 98 98 01/31/07 1.28 78.90% 78.90% 1972 201 Units 59,701.49 97.5% 01/18/07 T 12 Through 1/31/2007L(28),D(89),O(3) 15,400,000 99 99 01/01/07 1.30 77.92% 72.59% 1989 121,758 Sq. Ft. 98.56 98.9% 09/01/06L(26),D(91),O(3) 14,700,000 100 100 02/01/07 1.25 78.32% 78.32% 1987 144 Units 79,951.39 95.8% 01/10/07 Year End 12/31/2006L(25),GRTR1%orYM(92),O(3) 17,800,000 101 101 01/27/07 1.60 64.63% 64.63% 2006 160 Units 71,906.25 95.4% 03/09/07 T-3 1/2006L(26),D(91),O(3) 14,300,000 102 102 01/17/07 1.22 80.00% 74.69% 1989 145,625 Sq. Ft. 78.56 93.4% 01/01/07 2006L(24),2%(11),O(25) 17,600,000 103 103 02/01/07 1.48 63.41% 63.41% 1979 269 Units 41,486.99 84.4% 04/02/07 3 Months Annualized 10/31/2006
L(26),D(91),O(3) 14,000,000 104 104 01/24/08 1.10 79.68% 75.11% 1971 2000 115 Units 97,000.00 93.9% 02/12/07 Year End 12/31/2006L(25),D(93),O(2) 13,600,000 105 105 01/16/07 1.10 79.60% 74.18% 2005 160 Units 67,656.25 84.4% 03/12/07 2007 Annualized 01/30/2007L(25),D(32),O(3) 13,250,000 106 106 02/13/07 1.10 75.47% 75.47% 1984 67 Units 149,253.73 95.5% 04/15/07 Year End 12/31/2006L(26),D(30),O(4) 12,000,000 107 107 01/26/07 1.20 80.00% 80.00% 1984 83,192 Sq. Ft. 115.40 96.0% 03/01/07 2006 ActualL(25),GRTR1%orYM(10),O(25) 13,700,000 108 108 02/23/07 1.39 67.88% 67.88% 1983 168 Units 55,357.14 94.6% 02/12/07 3 Months Annualized 2/28/2007L(25),D(92),O(3) 11,525,000 109 109 03/02/07 1.43 79.83% 79.83% 2002 93 Units 98,924.73 93.5% 02/28/07 2006L(25),D(92),O(3) 12,400,000 110 110 02/16/07 1.36 72.58% 72.58% 2003 90 Units 100,000.00 94.4% 03/22/07 2006L(30),D(5),O(25) 11,450,000 111 111 08/22/06 1.62 76.94% 76.94% 1987 251,613 Sq. Ft. 35.01 77.9% 11/01/06 2005
L(25),D(92),O(3) 10,810,000 112 112 01/25/07 1.19 74.44% 69.17% 1980 2000 253 Pads 34,181.82 91.3% 02/28/07 T-12 through 2/28/2007
Mortgage Loan Number
Mortgage Loan Number
Cut-Off Date LTV Ratio
LTV Ratio at Maturity or
ARDYearBuilt
Unit of Measure
Cut-Off Date Loan Amount Per (Unit) ($)
Occupancy Rate
Occupancy "as of" Date

Largest Tenant Name Largest Tenant Sq. Ft. 2nd Largest Tenant Name
62,415,473 10,479,240 51,936,233 51,881,144 77,789,438 13,349,014 64,440,424 64,298,257 Ernst & Young LLP 1,064,939 96.66% 05/30/2022 Red Lobster 14,513 1.32%
327,007,470 119,187,137 207,820,430 207,820,429 354,178,858 112,315,490 241,811,107 198,385,886 Various Various Various Various Various Various Various33,873,597 14,508,771 19,364,825 19,364,825 41,074,705 14,894,479 26,180,226 25,307,068 Fulbright & Jaworski 127,804 18.84% 06/30/2015 Shearman & Sterling 114,431 16.87% 28,418,173 8,034,399 20,383,775 20,383,775 30,545,603 7,021,511 23,524,092 22,263,095 GSA - Department of Defense 549,317 60.75% Multiple Spaces Polk GSA 354,909 39.25% 24,851,252 9,376,395 15,474,857 15,474,857 28,071,027 8,301,024 19,770,003 18,616,234 Wells Fargo Bank NA 188,141 19.93% Multiple Spaces King County 98,017 10.38% 28,239,791 12,135,536 16,104,255 16,104,255 30,980,759 12,711,966 18,268,793 17,388,129 Commodity Future 161,785 22.74% 09/30/2015 Jackson & Campbell 44,309 6.23% 23,650,430 8,244,888 15,405,541 15,405,541 24,118,681 7,495,676 16,623,006 15,469,519 Booz Allen Hamilton 714,237 97.68% Multiple Spaces Northern VA Family Sv 3,500 0.48% 15,713,099 5,874,901 9,838,199 9,838,198 17,634,675 5,634,675 11,838,738 11,014,878 Infospace 130,826 27.60% 02/28/2013 Keybank National Association 103,701 21.88% 13,455,754 4,880,754 8,575,097 8,575,097 13,695,876 4,460,723 9,235,154 8,370,682 Expedia 265,713 57.37% 09/30/2009 Sierra Entertainment 128,040 27.64% 15,314,056 4,751,796 10,562,260 10,562,260 14,212,550 4,356,452 9,856,098 9,183,434 HDR Engineering 54,290 11.66% 12/31/2012 Oracle USA 30,735 6.60% 10,742,669 3,908,408 6,834,261 6,834,261 12,942,281 3,754,953 9,187,329 8,466,919 US Bank National 45,784 9.80% 12/31/2013 Business Service Center 35,759 7.66% 8,387,241 3,753,307 4,633,934 4,633,934 11,000,543 3,398,937 7,701,606 7,127,979 DHS - GS-11B-01687 72,591 24.65% Multiple Spaces GSA 47,198 16.03% 6,896,599 3,157,440 3,739,160 3,739,160 10,080,811 2,814,064 7,266,746 6,801,602 SunTrust Bank 59,533 18.06% Multiple Spaces HQ Global Workplaces 21,410 6.49% 5,303,800 2,416,168 2,887,632 2,887,632 6,306,620 2,302,082 4,004,538 3,555,517 Fiserv Seattle 36,940 14.71% 07/31/2008 Orrtax Software 33,411 13.31% 7,429,280 3,101,959 4,327,320 4,327,320 8,901,737 3,370,195 5,531,542 5,225,760 GSA - Department of Justice 69,524 42.41% 01/31/2008 American Hospital Association 39,492 24.09% 5,660,488 2,477,344 3,183,144 3,183,144 6,692,458 2,332,365 4,360,093 3,898,128 High Tech Institute 31,244 11.25% 06/30/2014 John L Scott Real Estate Servi 26,683 9.61% 5,493,256 1,938,481 3,554,775 3,554,775 6,512,906 1,854,476 4,667,430 4,199,874 XO Communications 167,495 77.38% 11/30/2007 Stanley Martin 28,906 13.35% 5,354,835 2,454,415 2,900,420 2,900,420 5,101,921 2,523,180 2,578,741 2,376,221 New York Times 22,145 21.54% 12/31/2009 Jones Lang Lasalle 17,970 17.48% 3,482,935 1,329,274 2,153,661 2,153,661 3,941,992 1,323,042 2,618,950 2,352,485 Serena Software 28,803 19.34% 01/31/2012 Barclay Dean 13,148 8.83% 31,813,392 10,101,895 21,711,497 21,711,497 30,503,227 8,733,694 21,769,534 8,066,030 College Entrance Exam 70,834 9.27% 09/30/2009 Pfizer, Inc. 62,974 8.24% 13,540,261 4,431,668 9,108,594 9,108,594 15,077,516 3,851,100 11,226,415 5,900,879 BAE Systems 73,300 19.25% 05/31/2014 Federal Network Systems 42,802 11.24% 39,386,562 12,309,339 27,077,224 27,077,224 36,782,970 11,180,896 25,602,074 12,801,453 Perkins Coie 285,716 26.48% Multiple Spaces Washington Mutual Bank 181,103 16.78%
157,016,346 38,399,113 118,617,233 114,381,673 Citibank N.A. 365,070 25.11% 08/31/14 Orrick, Herrington & Sutcliffe 239,464 16.47% 29,869,645 9,736,061 20,133,584 20,133,584 30,562,245 10,212,867 20,349,377 19,771,637 The Gap 17,510 4.58% 01/31/10 H & M 15,283 4.00%
238,592,470 126,349,996 112,242,474 481,725,392 145,569,012 336,156,380 333,909,980181,967,659 97,840,141 84,127,51856,624,810 28,509,855 28,114,956
68,929,000 52,427,000 16,502,000 14,526,000 15,000,000 15,000,000 15,000,000 H.E. Grand Cypress (guaranteed by Global Hyatt Corporation) 750 Rooms / 689,469 Sq. Ft. (Improved Collateral) / 1,480,169 Sq. Ft. (Land & Improvements) 100.00% 04/09/3744,427,477 29,449,064 14,978,413 12,786,996 48,206,970 31,111,238 17,095,732 14,685,38336,732,454 24,134,025 12,598,429 10,761,807 39,392,369 23,914,730 15,477,639 13,508,02024,804,546 17,829,982 6,974,564 5,734,337 26,107,662 17,394,973 8,712,689 7,407,30611,927,908 6,304,043 5,623,865 5,027,470 13,284,707 6,519,756 6,764,950 6,100,71533,910,367 20,735,043 13,175,324 11,435,653 36,939,737 20,857,270 16,082,467 14,187,1116,085,926 3,595,540 2,490,386 2,186,090 6,631,928 3,573,780 3,058,148 2,726,5515,328,475 3,203,665 2,124,810 1,858,386 5,925,391 3,229,450 2,695,940 2,399,6714,415,402 2,373,543 2,041,859 1,776,936 4,836,949 2,258,811 2,578,137 2,287,9206,092,506 3,915,018 2,177,488 1,872,862 6,430,510 3,787,956 2,642,555 2,321,0293,798,900 2,149,535 1,649,365 1,459,420 4,062,458 2,226,161 1,836,297 1,633,1743,924,213 2,302,371 1,621,842 1,425,632 4,327,308 2,435,384 1,891,925 1,675,5594,264,945 3,195,371 1,069,574 856,327 4,725,193 3,345,728 1,379,466 1,143,20613,291,427 3,629,519 9,661,908 9,606,430 15,471,634 5,035,467 10,436,167 10,293,106 Bank of America 18,862 5.10% 09/29/2011 Kattan Diamonds 5,789 1.57%
9,759,646 3,064,898 6,694,747 6,694,747 14,278,954 2,899,474 11,379,480 11,379,480 Various Various Various Various Various Various Various
Sparky's Diner 2,135 61.53% MTM Just Deserts 1,345 38.76%
Zaki Mokhemer 4,400 67.69% 02/28/11 Turtle Towe Restaurant 2,100 32.31%
31,870,813 19,449,089 12,421,724 10,828,182 34,391,067 19,890,367 14,500,701 12,781,1479,599,679 5,037,977 4,561,702 4,081,718 10,234,281 5,120,857 5,113,425 4,601,7116,585,560 4,201,329 2,384,231 2,054,953 7,339,318 4,281,693 3,057,624 2,690,6595,749,672 3,317,803 2,431,869 2,144,385 6,119,979 3,388,051 2,731,928 2,425,9295,223,290 2,976,730 2,246,560 1,985,395 5,587,481 2,982,830 2,604,652 2,325,2784,712,612 3,915,250 797,362 561,731 5,110,008 4,116,937 993,072 737,571
16,870,102 8,507,761 8,362,341 7,476,644 18,032,382 8,542,629 9,489,752 8,604,056 Various Various Various Various Various Various Various9,906,765 4,888,894 5,017,871 4,579,532 11,069,045 4,923,762 6,145,283 5,706,944 Shaw Facilities, Inc. 238,248 50.15% 04/30/16 First Citizen's Bank 64,802 13.64% 6,963,337 3,618,867 3,344,470 2,897,112 6,963,337 3,618,867 3,344,470 2,897,112 Boars Head Provisions 40,362 16.21% 02/28/2013 Wachovia Bank 30,198 12.13% 9,259,978 3,461,315 5,798,663 5,661,263 10,268,634 3,483,279 6,785,355 6,647,95552,054,000 42,043,000 10,011,000 10,011,000 54,399,610 45,017,473 9,382,138 7,750,1497,965,929 3,189,730 4,776,199 4,598,566 9,138,981 3,247,637 5,891,344 5,831,094
6,746,226 2,933,125 3,813,101 3,660,262 8,209,642 2,977,027 5,232,615 5,086,065 Costco 144,758 41.83% 04/12/2032 Marshalls & Homegoods 55,671 16.09% 9,401,230 4,816,849 4,584,381 4,074,855 12,153,179 7,658,580 4,494,598 4,300,663 N.Y. Physicians P.C. 18,000 12.52% 06/30/2011 Seville Watch Corporation 11,500 8.00% 5,371,777 2,045,841 3,325,936 3,151,473 6,156,264 2,006,857 4,149,407 3,653,200 Various Various Various Various Various Various Various993,411 294,603 698,808 648,502 1,107,789 295,056 812,734 702,727 IBIS Technology Corporation 31,920 31.73% 06/30/2011 Advanced Photographics, Inc. 12,258 12.18% 744,648 260,472 484,176 457,935 955,060 259,503 695,557 634,652 Siemens Real Estate 100,928 100.00% 08/31/2016805,162 198,568 606,594 598,823 755,224 192,168 563,057 495,065 Medtronic, Inc. 77,712 100.00% 10/31/2009615,509 158,678 456,831 450,831 607,627 166,483 441,144 390,928 Medtronic, Inc. 60,000 100.00% 10/31/2009591,654 146,838 444,816 407,850 562,975 137,213 425,761 357,235 Shawmut Advertising, Inc. 21,953 36.23% 08/31/2012 Axcellis Technologies, Inc. 19,300 31.85% 353,047 123,968 229,079 222,209 526,414 138,523 387,891 360,066 Osram Sylvania Products, Inc. 68,700 100.00% 08/31/2016204,131 340,129 -135,998 -152,559 535,472 355,365 180,106 148,621 Amphenol PCD, Inc. 22,318 37.73% 03/31/2012 CP Media, Inc. 12,000 20.29% 509,833 192,083 317,750 302,723 509,362 178,294 331,068 290,880 American Renal Associates 18,893 57.83% 06/30/2011 Applied Materials, Inc. 11,456 35.07% 554,382 330,503 223,879 215,159 596,342 284,252 312,089 273,026 TUV America, Inc. 15,252 36.73% 09/11/2007 Selective Micro Technologies, Inc. 8,231 19.82%
5,571,028 1,375,511 4,195,517 4,109,392 5,835,941 1,621,699 4,214,242 3,970,280 Home Depot 132,183 32.23% 01/31/2013 Conn's Appliances (Ground Lease) 50,255 12.25% 6,599,158 4,075,287 2,523,871 2,468,965 6,870,908 2,976,686 3,894,222 3,576,330 HUD 87,613 31.91% 03/19/2013 GSA 74,615 27.18% 4,367,508 1,168,423 3,199,085 3,199,085 4,552,212 1,190,806 3,361,406 3,275,006
7,380,821 3,312,850 4,067,971 3,895,796 BCBS of DE., Inc. 160,848 57.90% 10/01/2017 Unicare Life & Health Insurance 31,648 11.39% 5,006,186 1,417,254 3,588,932 3,498,682
8,383,672 2,657,932 5,725,740 5,458,947 Belk 96,240 17.31% 03/24/24 Kohl's 88,408 15.90% 3,933,145 1,283,195 2,649,950 2,626,739 3,990,051 1,135,334 2,854,717 2,694,507 CVS 49,998 32.31% 01/31/2016 Michael's Store 24,107 15.58%
14,982,036 10,863,949 4,118,087 3,368,985 15,772,248 11,253,424 4,518,823 3,887,9334,160,000 83,200 4,076,800 4,076,800 FMC Technologies 462,717 100.00% 03/31/22
3,482,680 1,584,974 1,897,706 1,865,505 3,820,675 1,549,035 2,271,640 2,173,465 Hudson Cook LLP 12,383 11.54% 02/29/2016 Farr Miller & Washington 8,628 8.04% 3,967,102 1,461,883 2,505,219 2,484,956 4,340,299 1,471,439 2,868,860 2,716,428 Federal Insurance Company 13,161 12.99% 01/31/2016 Liquidity Services, Inc. 13,161 12.99% 3,626,572 926,743 2,699,829 2,662,837 3,691,570 928,508 2,763,062 2,726,070 SMIL 30,318 19.67% 02/28/2017 Scottsdale Healthcare Realty 15,288 9.92% 4,289,209 1,730,098 2,559,111 2,559,111 4,360,548 1,728,795 2,631,752 2,574,2525,022,610 2,135,589 2,887,021 2,790,221 5,300,941 2,192,021 3,108,920 3,012,120
2,669,115 26,691 2,642,424 2,531,789 Toll Brothers, Inc. 203,000 100.00% 10/31/20194,025,405 1,730,992 2,294,414 2,294,414 4,245,015 1,777,164 2,467,851 2,400,651
4,037,262 1,232,443 2,804,819 2,741,2193,484,492 1,205,010 2,279,482 2,253,384 3,879,359 1,183,817 2,695,542 2,508,911 Communications International Union 18,871 18.08% 01/31/2008 Change to Win 9,052 8.67% 3,943,515 1,089,851 2,853,664 2,757,664 4,040,592 1,342,154 2,698,438 2,602,4383,359,954 1,292,315 2,067,639 2,047,447 3,682,415 1,453,533 2,228,881 2,083,921 Ralphs 44,035 26.17% 09/10/2012 CVS 21,402 12.72% 3,888,948 1,966,099 1,922,849 1,922,849 4,549,303 2,015,208 2,534,095 2,415,5394,632,856 2,258,531 2,374,325 2,294,325 4,687,469 2,234,296 2,453,173 2,373,1732,658,490 802,770 1,855,720 1,840,786 2,913,159 755,984 2,157,175 2,085,267 Barnes & Noble Inc. 30,149 30.28% 01/31/2013 Petsmart Inc. 27,972 28.10% 2,371,567 784,038 1,587,529 1,573,386 2,817,959 764,764 2,053,195 1,957,309 Circuit City 32,900 34.89% 01/31/2016 Thomasville Home Furnishings 15,425 16.36%
11,510,595 8,713,546 2,797,049 2,335,933 11,865,589 8,847,416 3,018,173 2,543,5502,997,264 1,412,813 1,584,451 1,584,451 3,346,107 1,402,771 1,943,336 1,831,766 Whittier Hospital Medical Center 11,127 7.76% 04/30/09 First Team Real Estate 10,742 7.49% 4,377,946 1,408,379 2,969,567 2,914,301 4,283,601 1,367,639 2,915,962 2,805,507 Duke University Health System PRMO Group 106,998 38.72% 06/30/2010 Qualex, Inc. 98,603 35.68% 5,121,212 2,610,106 2,511,106 2,447,015 5,136,507 2,490,538 2,645,969 2,348,036 NASDAQ, Inc. 46,794 16.79% 07/31/2008 Gartner Group, Inc. 45,695 16.40% 4,072,078 1,504,963 2,567,115 2,538,197 3,722,155 1,415,114 2,307,041 2,278,123 Inovis, Inc. 53,501 27.75% 10/31/2014 Certegy 49,059 25.45%
2,875,233 583,031 2,292,202 2,263,932 Wal-Mart Supercenter 173,190 79.05% 10/17/2026 El Maguey Restaurant 3,483 1.59% 3,178,469 1,147,240 2,031,229 1,942,489 3,087,624 1,136,001 1,951,623 1,862,8823,748,336 1,584,740 2,163,596 2,132,225 3,822,038 1,685,036 2,137,002 2,012,108 Third Millennium Communications 21,683 11.70% 03/31/10 Third Millennium Healthcare 15,232 8.22% 3,513,408 1,544,205 1,969,203 1,879,155 3,499,039 1,599,690 1,899,349 1,809,3012,039,253 478,936 1,560,317 1,546,041 2,255,328 626,744 1,628,584 1,565,932 Coldwell Banker Residential Brokerage 5,051 9.55% 09/30/2007 California Pizza Kitchen 5,000 9.46% 3,574,134 1,844,415 1,729,719 1,643,918 3,566,950 1,826,918 1,740,032 1,654,2313,102,788 1,446,739 1,656,049 1,572,049 3,102,658 1,526,411 1,576,247 1,492,2473,414,193 1,937,435 1,476,758 1,394,494 3,604,172 1,779,203 1,824,969 1,742,7052,154,084 854,992 1,299,092 1,263,080 2,820,710 874,960 1,945,750 1,778,840 Seneca One Finanice, Inc. 16,979 15.51% 08/31/2008 Rock Bottom Restaurants, Inc. 12,953 11.83%
1,930,430 534,884 1,395,547 1,377,658 Health Insurance Plan of Greater NY 25,529 56.31% 10/31/2010 HSBC Bank USA 19,806 43.69% 3,046,190 1,272,948 1,773,242 1,773,242 3,096,863 1,306,582 1,790,281 1,727,8811,383,973 318,940 1,065,033 1,055,137 2,080,799 366,059 1,714,740 1,661,474 Harris Teeter, Inc. 48,756 47.22% 09/20/2025 Long & Foster Real Estate, Inc. 6,552 6.34%
2,513,310 852,414 1,660,896 1,618,8963,082,574 1,461,056 1,621,517 1,600,991 3,670,126 1,538,797 2,131,329 1,747,929 Wachovia Bank National Association 77,598 36.88% 05/31/08 HR America 13,556 6.44% 2,695,256 1,333,456 1,361,800 1,206,360 2,645,710 995,792 1,649,918 1,600,3183,746,920 1,553,024 2,193,896 2,128,896 3,621,767 1,610,658 2,011,109 1,946,1092,371,438 682,946 1,688,492 1,688,492 2,362,216 692,753 1,669,462 1,532,055 General Dynamics 84,652 100.00% 02/28/112,021,136 638,709 1,382,427 1,363,093 2,038,854 595,578 1,443,276 1,413,969 Dick's Sporting Goods, Inc. 70,000 54.31% 09/30/18 Best Buy 46,812 36.32% 3,497,204 1,341,703 2,155,501 2,109,774 3,212,303 1,400,583 1,811,720 1,568,326 Various Various Various Various Various Various Various1,721,224 585,344 1,135,880 1,114,666 1,477,860 614,677 863,183 750,879 Anheuser Busch Companies, Inc 69,026 81.30% 02/29/12 Delta Dental 9,201 10.84% 963,279 452,262 511,017 498,056 1,005,174 437,292 567,882 493,591 Anheuser Busch Companies, Inc 36,921 71.22% MTM Schmersahl, Treloar & Co., P.C. 10,120 19.52% 400,492 92,502 307,990 302,340 335,794 92,805 242,989 215,539 St. John's Mercy Medical Center 22,600 100.00% 05/31/2011412,209 211,595 200,614 194,712 393,475 255,809 137,666 108,317 Meier New Life Clinic 4,208 17.83% 03/31/2008 World Mortgage Company 3,968 16.81%
1,773,818 573,850 1,199,968 1,136,656 2,155,681 585,305 1,570,376 1,507,063 Raymonds Village Grill 4,389 8.17% 12/31/2016 Citibank 3,984 7.42%
2,800,787 749,379 2,051,408 2,051,408 2,829,848 805,143 2,024,705 2,004,5052,049,567 410,241 1,639,326 1,581,674 Sonic Fremont, Inc. 50,654 100.00% 12/31/211,973,508 561,150 1,412,358 1,361,940 Washington DC Convention & Tourism Corp 17,362 44.25% 01/31/2016 Commerce Bank 10,300 26.25%
2,766,600 1,482,321 1,284,279 1,284,170 2,993,707 1,519,880 1,473,827 1,285,842 SRDS, Inc. 36,981 26.97% 12/31/14 GSA 14,725 10.74% 1,506,864 322,030 1,184,834 1,182,483 1,568,187 335,317 1,232,870 1,217,277 ShopRite 60,000 100.00% 06/30/22
1,710,603 678,072 1,032,531 1,032,531 2,214,450 774,616 1,439,835 1,423,9852,347,772 1,161,851 1,185,921 1,124,013 2,562,903 1,209,804 1,353,099 1,291,1912,481,660 791,091 1,690,569 1,667,962 2,377,652 856,504 1,521,148 1,384,141 Risk Placement Service, Inc. 21,522 14.28% 04/30/12 Strayer University, Inc. 13,629 9.04% 1,906,940 584,709 1,322,231 1,300,491 1,878,284 444,107 1,434,177 1,412,438 GSA 217,394 100.00% 06/30/222,608,720 1,129,460 1,479,260 1,445,660 2,662,378 1,219,218 1,443,159 1,409,5592,250,051 753,541 1,496,510 1,496,510 2,126,023 862,707 1,263,316 1,115,677 Inforeliance Corporation 19,495 20.97% 07/31/09 Chadwick Washington 14,414 15.51%
2,061,676 392,038 1,669,638 1,598,887 Don's Cold Storage 165,000 100.00% 02/25/222,608,813 1,600,587 1,008,226 1,008,226 2,644,520 1,348,690 1,295,830 1,222,830
1,913,169 576,672 1,336,497 1,269,123 1,933,690 577,938 1,355,753 1,288,823 Guitar Center Stores, Inc. 15,140 16.76% 10/31/2015 Beverages & More, Inc. 14,240 15.76% 4,188,555 2,510,018 1,678,537 1,651,607 4,313,880 2,582,800 1,731,080 1,515,3861,786,298 623,073 1,163,225 1,149,572 1,896,793 626,614 1,270,179 1,178,892 EMI Strategic Marketing 11,911 16.83% 03/31/2011 Beecher Carlson Holdings, Inc. 7,345 10.38% 2,851,810 1,433,340 1,418,470 1,360,870 3,083,533 1,503,473 1,580,060 1,522,4605,281,043 3,623,477 1,657,565 1,657,565 5,391,566 3,714,436 1,677,129 1,461,4671,495,222 554,030 941,192 900,992 1,581,515 549,829 1,031,686 991,4862,082,064 800,148 1,281,916 1,217,116 2,113,088 847,866 1,265,221 1,200,4211,715,654 593,298 1,122,356 1,122,356 1,543,574 638,855 904,719 820,146 Vance International, Inc. 41,968 64.92% 04/30/12 General Dynamics AIS 7,625 11.79% 5,094,673 3,559,239 1,535,434 1,527,316 5,247,155 3,732,900 1,514,255 1,251,8962,772,237 1,946,271 825,966 825,966 2,855,026 2,018,274 836,752 694,0002,322,436 1,612,968 709,468 701,350 2,392,129 1,714,626 677,503 557,8961,697,232 704,550 992,682 992,682 1,764,510 717,392 1,047,118 991,1181,757,333 533,160 1,224,172 1,224,172 1,794,752 562,350 1,232,402 1,194,0021,154,863 389,480 765,383 759,942 824,807 321,884 502,923 469,089 Hallmark Creations 5,600 15.44% 02/28/2010 Modern Woman/Charming Shoppes 4,660 12.85% 1,519,533 428,843 1,090,690 1,090,690 1,597,212 637,909 959,303 927,3031,464,560 500,655 963,905 963,905 1,513,902 517,756 996,146 977,146
1,930,809 38,616 1,892,193 1,883,999 Dataside, LLC 40,966 100.00% 03/31/161,600,342 345,536 1,254,806 1,226,038 1,707,380 554,283 1,153,097 1,124,3291,524,774 582,650 942,124 942,124 1,540,665 559,985 980,680 930,430
1,609,073 455,702 1,153,371 1,080,576 Citizens Property Insurance 57,402 47.14% Multiple Spaces Washington Mutual Bank 18,630 15.30% 1,354,581 533,844 820,737 820,737 1,443,116 541,146 901,970 865,9702,336,880 828,540 1,508,340 1,470,900 2,236,922 1,097,907 1,139,015 1,101,5751,488,031 381,638 1,106,393 1,084,549 1,567,023 450,605 1,116,418 985,431 Big Lots Stores, Inc. 29,000 19.91% 07/31/2008 Triad Fitness Group Northwest, LLC 28,973 19.90% 1,573,552 909,032 664,520 664,520 1,921,381 834,916 1,086,464 1,032,664
1,131,810 484,415 647,395 647,395 1,503,669 560,395 943,274 943,2741,360,854 737,610 623,244 623,244 1,423,090 558,010 865,080 833,0801,028,872 474,332 554,540 554,540 1,120,089 395,489 724,600 711,2001,493,485 842,490 650,995 630,197 1,647,779 916,415 731,364 672,148 Realtors Association 11,897 14.30% 11/30/2008 Humana Medical Plan 11,684 14.04% 1,337,952 693,933 644,018 644,018 1,471,700 656,173 815,527 773,5271,138,957 455,442 683,515 660,265 1,201,000 440,801 760,199 736,9491,098,906 374,514 724,392 701,892 1,111,050 367,879 743,171 720,6711,827,675 587,287 1,240,388 1,202,646 1,672,259 685,128 987,131 857,560 Seessel's 53,700 21.34% 04/30/2010 Memphis Furniture Showroom 50,000 19.87%
895,156 215,769 679,387 679,387 888,248 171,362 716,886 706,806
Most Recent Revenues ($)
Most Recent Expenses ($)
Most Recent NOI ($)
Most Recent NCF
($)UW Revenues
($)UW Expenses
($)
UW Net Operating Income ($)
UW Net Cash Flow ($)
Largest Tenant
% of NRALargest Tenant
Exp. Date
2nd Largest Tenant Sq.
Ft.
2nd Largest
Tenant % of NRA

3rd Largest Tenant Name Lockbox
05/31/13 Disney Store 11,600 1.05% 11/30/18 Day 1 Allan V. Rose 1
Various Various Various Various Various Day 1 2Multiple Spaces Edison Electric Institute 76,793 11.32% 07/31/2015 2.01Multiple Spaces 2.02
07/31/2007 Moss Adams 93,582 9.91% Multiple Spaces 2.0305/31/2010 AT&T Corp. 40,254 5.66% Multiple Spaces 2.0412/31/2007 YK and Wang 2,800 0.38% 10/31/2011 2.0507/31/2010 Symetra Finacial Corporation 71,531 15.09% 07/31/2015 2.0602/28/2010 American Family Mutual Insuran 28,223 6.09% Multiple Spaces 2.0703/31/2009 Cisco Systems 28,058 6.02% 02/28/2013 2.0803/31/2009 Wells Fargo Bank NA 24,608 5.27% Multiple Spaces 2.0902/28/2011 EADS 37,018 12.57% 08/31/2014 2.1003/31/2011 GSA 21,214 6.43% 08/31/2013 2.1109/30/2013 Great American Insurance 24,770 9.87% 12/31/2009 2.1208/31/2014 National Retail Federation 26,752 16.32% 03/31/2014 2.1304/30/2014 Peacehealth 25,881 9.32% 03/31/2014 2.1401/31/2016 Akamai Technologies 15,511 7.17% 05/31/2011 2.15
Multiple Spaces Constantine Cannon 12,550 12.21% 03/31/2008 2.1608/31/2012 National Medical Management 12,681 8.51% 07/31/2008 2.1709/30/2009 National Amusements 51,511 6.74% 02/28/2011 2.1811/30/2008 BBN Technologies 41,031 10.78% 11/30/2010 2.1912/31/2010 Davis Wright Tremaine 169,533 15.71% 12/31/2018 2.20
03/31/10 Fulbright & Jaworski L.L.P. 139,177 9.57% 12/31/16 Day 1 310/31/11 Express - Men 13,441 3.52% 01/31/14 Day 1 4
Day 1 Tishman Speyer and BlackRock Realty Advisors, Inc. 55.015.02
Day 1 6Day 1 7Day 1 8
8.018.02
Day 1 99.019.029.039.049.059.069.07
09/30/2016 Oro King 5,522 1.49% Multiple Spaces Day 1 10
Various Day 1 1111.0111.0211.0311.0411.0511.0611.0711.0811.0911.1011.1111.1211.1311.1411.1511.1611.1711.18
06/30/07 11.1911.2011.2111.2211.2311.2411.25
MTM 11.2611.2711.2811.29
Day 1 1212.0112.0212.0312.0412.05
Various Various Various Various Various Day 1 1310/31/2036 HDR Engineering, Inc. 33,314 7.01% 04/30/09 13.0108/31/2013 Paine Webber 19,672 7.90% 04/30/2010 13.02
1415
Springing 16
10/31/2016 Stein Mart 36,000 10.40% 11/30/2016 Joseph Cogen and Gertz Builders & Developers 1705/31/2017 Tom Jones Inc. D.b.a. Searle 11,250 7.82% 03/31/2019 18
Various Various Various Various Various 1902/28/2008 Publishers Circulation Fulfillment, Inc. 11,300 11.23% 11/30/2011 19.01
19.0219.0319.04
07/31/2009 Advanced Ion Beam Technology, Inc. 10,847 17.90% 06/30/2010 19.0519.06
12/31/2010 19.0702/28/2008 Audiovox, Inc. 2,320 7.10% 03/31/2010 19.0806/30/2011 eAppraiseIT, LLC 7,040 16.95% 07/31/2011 19.09
02/28/2018 Babies R Us 41,462 10.11% 01/31/2014 Springing 20Multiple Spaces Arbinet-the exchange 16,089 5.86% 07/31/08 Day 1 21
2203/31/2015 Smith, Katzenstein & Furlow 15,857 5.71% 04/30/2010 23
24
01/31/25 Sports Authority / Oshman's 34,920 6.28% 01/31/15 Springing 2502/28/2009 Staples the Office Superstore East 23,907 15.45% 01/31/2011 26
27Day 1 28
03/31/2013 Abu Dhabi International 7,219 6.73% 03/31/2013 2901/31/2013 Americans for Tax Reforms 12,998 12.83% 10/31/2009 3010/31/2013 Phoenix Diagnostic Imaging 6,024 3.91% 03/01/2008 Springing 31
3233343536
Multiple Spaces Get Active Software, Inc. 8,474 8.12% Multiple Spaces 3738
09/30/12 Pacific Auto Spa 11,000 6.54% 05/31/25 39Day 1 40
4101/31/2018 Loehmann's Inc. 25,000 25.11% 05/31/2012 4203/31/2012 Moorestown Party City, LLC 11,681 12.39% 03/31/12 43
4410/31/11 Bergman Medical Group 9,397 6.55% 12/31/09 Day 1 4502/28/09 Duke University 42,080 15.23% 05/31/09 Springing 46
11/30/2010 General Reinsurance Corp. 42,125 15.12% 08/31/2017 Day 1 4703/31/12 Information Global Solutions, Inc 21,377 11.09% 01/31/10 Springing 48
04/30/2012 Eyemart Express 2,982 1.36% 03/31/2012 4950
05/31/11 Georgia Advocacy 9,353 5.05% 10/31/10 5152
06/30/2012 Pacific Coast Grill 4,759 9.00% 07/31/2010 535455
Springing 5606/30/2011 Riorey, Inc. 8,120 7.42% 04/30/2011 Day 1 5703/31/17 Day 1 58
5905/31/2011 Sun Trust Bank 4,300 4.16% 11/30/26 60
61Multiple Spaces ColeJenest & Stone, PA 10,220 4.86% 03/31/2011 62
6364
Day 1 6501/31/2018 Chick-Fil-A 4,200 3.26% 10/31/2017 66
Various Various Various Various Various 6711/30/2008 Preferred Resource Network 3,726 4.39% 09/30/2011 67.0104/30/2010 Law Offices of Steven M., LLC 3,651 7.04% 08/31/12 67.02
67.0302/28/2010 Ryder Truck Rental, Inc. 3,033 12.85% 12/31/07 67.0410/31/2016 Grandes Bella Cucina 3,901 7.26% 02/28/2012 68
Springing 69Day 1 70
12/31/27 Anderson Pitts 5,787 14.75% 11/30/15 Day 1 7109/20/15 Chicago Sweeteners, Inc. 12,614 9.20% 08/21/15 Day 1 72
Day 1 73
7475
10/31/15 Alltel Publishing Corporation aka Windstream Yellow Pages 13,231 8.78% 10/31/07 7677
Day 1 7801/31/13 Leros Technologies Corporation 11,406 12.27% 09/30/11 Day 1 79
8081
11/30/16 DD Car, Inc. 8,873 9.82% 02/28/2010 82Day 1 83
03/31/2013 Fay, Spofford & Thorndike 4,426 6.25% 10/31/2009 84Day 1 85Day 1 86
87Springing 88
12/31/07 Sun Trust Mortgage, Inc. 5,351 8.28% 12/31/09 Day 1 89Day 1 90
90.0190.02
Day 1 9192
04/30/2009 Jos A Bank Clothiers Inc. 3,980 10.97% 01/31/2009 93Day 1 94
95Springing 96
9798
06/30/09 AmTrak 7,314 6.01% 09/30/10 99Day 1 100Day 1 101
05/31/2016 Tuesday Morning 22,027 15.13% 07/15/12 102Springing 103
Springing 104105
Springing 10607/31/2008 Bomar Industries 9,150 11.00% 10/31/11 107
Day 1 108109110
07/31/2010 Winchester VIII Theater 23,904 9.50% 07/31/2009 Springing 111
Springing 112
2nd Largest Tenant Exp. Date
3rd Largest
Tenant Sq. Ft.
3rd Largest
Tenant % of NRA
3rd Largest Tenant Exp. Date
Largest Affiliated Sponsor Flag(> than 4% of Pool, Loan Group 1 or Loan Group 2)
Mortgage Loan
Number

WACHOVIA BANK COMMERCIAL MORTGAGE TRUST SERIES 2007-C31
ANNEX A-1 CERTAIN CHARACTERISTICS OF THE MORTGAGE LOANS AND MORTGAGED PROPERTIES
Property Name Address City State Zip Code Loan Purpose Mortgage Loan Seller Specific Property TypeMortgage
Loan Number
Loan Group Number
Cross Collateralized and Cross Defaulted Loan Flag
General Property Type
113 2 Artists in Residence Apartments 6161 & 6165 North Winthrop Avenue Chicago IL 60660 Refinance Wachovia Multifamily Conventional114 2 Bayberry Place Townhomes 2300 Deewood Drive Columbus OH 43229 Acquisition Nomura Multifamily Conventional115 1 Molly Gibson Lodge 101 West Main Street Aspen CO 81611 Acquisition Barclays Hospitality Limited Service116 1 Tyvola Center 6130 Tyvola Centre Drive Charlotte NC 28217 Acquisition Wachovia Office Suburban
117 2 1115 Penile Road Louisville KY 40272 SSK Portfolio Refinance Barclays Mobile Home Park Mobile Home Park118 1 Victoria Crossing 7808 NE Zac Lentz Parkway Victoria TX 77904 Acquisition Wachovia Retail Anchored119 2 Sunpointe Apartments 7077 West McDowell Road Phoenix AZ 85035 Acquisition Nomura Multifamily Conventional120 2 Collegiate Suites I 1310 Henry Lane Blacksburg VA 24060 Refinance Wachovia Multifamily Student Housing121 2 Park West Apartments 357 Hillandale Road Greenville SC 29609 Refinance Wachovia Multifamily Conventional122 1 Publix at Bayside Lakes 3540 Bayside Lakes Boulevard SE Palm Bay FL 32909 Refinance Wachovia Retail Anchored123 1 Evergreen Distribution Center 22990 NW Bennett Street Hillsboro OR 97214 Acquisition Wachovia Industrial Distribution124 1 Hampton Inn - Staunton, VA 40 Payne Lane Staunton VA 24401 Refinance Wachovia Hospitality Limited Service125 2 Wickatunk Village MHC 89 Village Road Morganville NJ 07751 Refinance Nomura Mobile Home Park Mobile Home Park126 1 Holiday Inn - Rockford, IL 7550 East State Street Rockford IL 61125 Refinance Wachovia Hospitality Full Service127 1 Berwick Marketplace 5710 Ogeechee Road Savannah GA 31405 Acquisition Wachovia Retail Shadow Anchored128 2 Wind Tree Apartments 2990 Trawood Drive El Paso TX 79936 Acquisition Wachovia Multifamily Conventional129 1 Gander Mountain - Cicero 5864 Carmenica Drive Cicero NY 13039 Acquisition Barclays Retail Single Tenant130 1 Burnsville Medical Center 14000 Nicollet Avenue Burnsville MN 55337 Acquisition Wachovia Office Medical131 1 52-15 Flushing Ave 5215 Flushing Avenue Maspeth NY 11378 Acquisition Barclays Industrial Warehouse
132 2 113 Sioux Trail Elsmere KY 41018 SSK Portfolio Refinance Barclays Mobile Home Park Mobile Home Park133 1 1603 North 35th Street 1603 North 35th Street Rogers AR 72756 Acquisition Barclays Industrial Warehouse
134 1 709 Church Street Bayport NY 11705 Acquisition Wachovia Self Storage Self Storage135 1 425 Meadowlands Parkway 425 Meadowlands Parkway Secaucus NJ 07094 Refinance Nomura Land Office136 1 CVS (Mixed Use Facility) 231 West 67th Street & Noth Graham Street Charlotte NC 28202 Refinance Wachovia Mixed Use Retail/Office137 1 Baldwin Transfer Pool Various Various Various Various Refinance Wachovia Industrial Distribution
137.01 1505 & 1507 Telegraph Road 1505 & 1507 Telegraph Road Mobile AL 36611 Industrial Distribution137.02 1400 James Street 1400 James Street Hattiesburg MS 39401 Industrial Distribution137.03 52 W.L. Runnels Drive 52 W.L. Runnels Drive Hattiesburg MS 39401 Industrial Distribution137.04 1700 A. Craft Highway 1700 A. Craft Highway Mobile AL 36611 Industrial Distribution137.05 201 Callahan Road 201 Callahan Road Mobile AL 36611 Industrial Distribution137.06 200 Callahan Road 200 Callahan Road Chickasaw AL 36611 Industrial Distribution
138 1 Wendover Plaza 901 North Wendover Road Charlotte NC 28211 Refinance Wachovia Retail Anchored139 1 Parkway Place 4205-4255 White Bear Parkway Vadnais Heights MN 55110 Refinance Wachovia Industrial Office/Showroom
140 1 355 Fox River Drive Appleton WI 54913 Acquisition Barclays Hospitality Limited Service141 2 Mirasol Apartments 8750 East McDowell Road Scottsdale AZ 85257 Acquisition Nomura Multifamily Conventional142 1 Lyon's Station 14250 Arminta Street Santa Clarita CA 91321 Acquisition Nomura Retail Unanchored143 1 Holiday Inn Express - Sebring, FL 4400 Highway US 27 North Sebring FL 33870 Refinance Barclays Hospitality Limited Service144 1 Sweetwater Shopping Center 17044 Lexington and 4720 Sweetwater Boulevards Sugar Land TX 77479 Acquisition Wachovia Retail Unanchored145 1 Orlando ICE Building 6643 Hazeltine National Drive Orlando FL 32822 Refinance Wachovia Industrial Flex146 1 Extra Space Storage - San Francisco, CA 2501 Cesar Chavez Street San Francisco CA 94110 Acquisition Wachovia Self Storage Self Storage147 1 Wingate Cool Springs 1738 Carothers Parkway Brentwood TN 37027 Refinance Barclays Hospitality Limited Service148 1 FBI Building - Nashville, TN 2868 Elm Hill Pike Nashville TN 37214 Refinance Wachovia Office Suburban149 1 Country Inn & Suites - Henrietta, NY 4635 West Henrietta Road Henrietta NY 14467 Refinance Wachovia Hospitality Limited Service150 2 Pear Tree Apartments 222 Bartlett Drive El Paso TX 79912 Acquisition Wachovia Multifamily Conventional151 1 400 Centennial Parkway 400 Centennial Parkway Louisville CO 80027 Refinance Nomura Office Suburban152 2 Holly Glen Apartments 2800-2848 Holly Glen Drive Greenville NC 27834 Refinance Wachovia Multifamily Conventional153 1 Center of Dover 261 North DuPont Highway Dover DE 19901 Acquisition Barclays Retail Anchored154 1 Best Buy - Kohler, WI 3600 County Highway A Kohler WI 53085 Refinance Wachovia Retail Single Tenant155 1 Blackhawk Office Building 15545 Devonshire Street Los Angeles CA 91345 Acquisition Wachovia Office Suburban
156 1 2500 Airport Road Paso Robles CA 93446 Refinance Barclays Mobile Home Park Mobile Home Park157 1 Ridgewood Industrial 75 Onderdonk Avenue Ridgewood NY 11385 Refinance Barclays Industrial Flex158 1 Mountain View Shopping Center Phase II 2355, 2407 & 2411 U.S. Highway 93 Kalispell MT 59901 Acquisition Nomura Retail Anchored159 2 The Three Crowns Apartments 2020 Sanata Clara Avenue Alameda CA 94501 Refinance Nomura Multifamily Conventional160 1 Hawthorn Suites - Austin, TX 7800 East Riverside Drive Austin TX 78744 Acquisition Wachovia Hospitality Limited Service161 1 Country Inn & Suites - Monona, WI 400 River Place Monona WI 53716 Refinance Barclays Hospitality Limited Service162 1 2580 Diehl Road 2580 Diehl Road Aurora IL 60504 Acquisition Wachovia Industrial Warehouse163 1 Extra Space Storage - Carson, CA 17510 South Figueroa Street Carson CA 90746 Acquisition Wachovia Self Storage Self Storage164 2 French Quarter Apartments 2211 West North Loop Boulevard Austin TX 78756 Acquisition Nomura Multifamily Conventional165 1 Metro Gardens Office Park 2830 Winkler Avenue Fort Myers FL 33619 Refinance Nomura Office Suburban166 2 Hillside Gardens 555 Greenbrier Drive Oceanside CA 92054 Refinance Nomura Multifamily Conventional167 1 Rite Aid - Boardman, OH 339 Boardman Canfield Road Boardman OH 44512 Acquisition Barclays Retail Single Tenant168 1 Comfort Suites - Charlotte, NC 7735 University City Boulevard Charlotte NC 28213 Refinance Nomura Hospitality Limited Service169 1 Extra Space Storage - Chatsworth, CA 21536 Devonshire Street Chatsworth CA 91311 Acquisition Wachovia Self Storage Self Storage170 2 Billboard Lofts 320 West Ash Street San Diego CA 92101 Refinance Nomura Multifamily Conventional171 1 CVS - San Antonio, TX 14900 Jones Maltsberger Road San Antonio TX 78247 Refinance Wachovia Retail Single Tenant172 1 Airport Center Warehouse 3750 NW 28th Street Miami FL 33142 Refinance Wachovia Industrial Warehouse/Distribution173 2 Redwood Terrace 9950 Redwood Street NW Coon Rapids MN 55433 Refinance Wachovia Multifamily Independent Living174 1 Shoppers World Duluth II 2605 Pleasant Hill Road Duluth GA 30096 Acquisition Wachovia Retail Shadow Anchored175 1 New Forest Crossing Shopping Center Phase II 6025 East Sam Houston Parkway Houston TX 77049 Acquisition Nomura Retail Shadow Anchored176 1 Oceana Distribution Center 2800 Crusader Circle Virginia Beach VA 23456 Refinance Wachovia Industrial Distribution/Warehouse177 1 Clanton Shopping Center 1100 - 1400 Woodfin Lane Clanton AL 35045 Acquisition Wachovia Retail Shadow Anchored178 1 Extra Space Storage - Oakland, CA 300 Market Street Oakland CA 94607 Acquisition Wachovia Self Storage Self Storage179 1 Bull Creek Market 6203 North Capital of Texas Highway Austin TX 78731 Refinance Barclays Retail Unanchored180 1 Gateway Retail Center II 16221 East 40th Avenue Denver CO 80239 Refinance Nomura Retail Unanchored181 1 La Marque Crossing 6408 Interstate 45 South La Marque TX 77568 Acquisition Wachovia Retail Shadow Anchored182 2 Mobile Gardens MHP 1901 North Glasscock Road Mission TX 78572 Acquisition Nomura Mobile Home Park Mobile Home Park183 1 Extra Space Storage - North Hollywood, CA 13434 Saticoy Street North Hollywood CA 91605 Acquisition Wachovia Self Storage Self Storage184 1 Bethel Self Storage 41 Durant Avenue Bethel CT 06801 Refinance Barclays Self Storage Self Storage185 1 Fry's Plaza 8350 West Lower Buckeye Road Phoenix AZ 85043 Refinance Wachovia Retail Shadow Anchored186 1 Rite Aid - Erie, PA 1709 Liberty Street Erie PA 16502 Acquisition Nomura Retail Single Tenant
187 2 500 North La Mesa Drive Sioux Falls SD 57107 Acquisition Barclays Mobile Home Park Mobile Home Park188 2 Saratoga Apartments 653 East Capitol Street, SE Washington DC 20003 Refinance Nomura Multifamily Conventional189 2 Blueberry Ridge Mobile Village 15 Valley Road Wells ME 04090 Refinance Nomura Mobile Home Park Mobile Home Park
(3) With respect to the Hyatt Regency Grand Cypress Loan (loan number 6), the mortgaged property consists of 750 rooms, 689,469 square feet of improved collateral and, 1,480,169 square feet of land and improvements.
(4) With respect to the Hyatt Regency Grand Cypress Loan (loan number 6), the Mortgage loan allows for partial release of the 9-hole pitch and putt at any time during the term of the Mortgage Loan subject to the satisfaction of certain tests and conditions as set forth in the related Mortgage Loan documents including, but not limited to prepayment of $10,000,000 plus a yield maintenance premium if the release occurs after May 11, 2009.
(5) With respect to the First Colony Commons Loan (loan number 20), Master Leased space fo 12,750 sq. ft. is included in the occupancy of 96.3%.
(6) With respect to the Central Texas Marketplace Loan (loan number 25), the Borrower and the Guarantor guarantees $6,335,310, or 59% the full purchase earn-out amount of $10,737,814. In the event that the full purchase earn-out amount is not paid to Seller by April 10, 2009, the Borrower shall pay down the loan by 59% of the remaining purchase earn-out plus any applicable yield maintenance penalty.
(7) With respect to Peters Pond RV Resort Loan (loan number 69), the Occupancy Rate is equal to the seasonal occupancy as determined in the related appraisal report and the Occupancy "as of" Date is the Cut-Off Date for such loan.
(8) With respect to the Pinetree Park ROC Loan (loan number 74), 50% of the proceeds from additional share sales can be used to pay down the loan. The first $1,500,000 in proceeds from additional share sales will be exempt from paying down the loan. If more than 10% of the loan amount is prepaid, a yield maintenance charge will apply.
(9) The interest rate with respect to the Northridge Promenade Shopping Center Loan (loan number 82) varies during the term of the Mortgage Loan. See ‘‘DESCRIPTION OF THE MORTGAGE POOL—Additional Mortgage Loan Information’’ in the Prospectus Supplement.
(10) With respect to Wine Country RV Loan (loan number 156), the Occupancy Rate is equal to the occupancy as determined in the related appraisal report and the Occupancy "as of" Date is the Cut-Off Date for such loan.
(11) Certain of the Mortgage Loans reflect LTV Ratios that have been calculated on an ‘‘as-stabilized’’ basis, or have LTV Ratios or DSC Ratios that have been adjusted to take into account certain cash reserves, holdbacks or letters of credit or were calculated based on assumptions regarding the future financial performance of the related Mortgaged Property. See ‘‘DESCRIPTION OF THE MORTGAGE POOL—Additional Mortgage Loan Information’’ and ‘‘RISK FACTORS—Risks Relating to Net Cash Flow’’ and ‘‘—Inspections and Appraisals May Not Accurately Reflect Value or Condition of Mortgaged Property’’ in the Prospectus Supplement.
SSK Ashley Pointe(11)
SSK Heartland Pointe(11)
Storage USA(11)
Country Inn & Suites - Appleton, WI(11)
Wine Country RV(10)
Gas Lite Manor(11)
See "DESCRIPTION OF THE MORTGAGED POOL—Additional Mortgage Loan Information" in the prospectus supplement.
(1) Four Mortgage Loans (loan numbers 1, 2, 3, and 5) are part of a split loan structure and the related pari passu companion loans are not included in the Trust Fund with respect to the Mortgage Loan, unless otherwise specified. With respect to these Mortgage Loans, unless otherwise specified, the calculations of LTV Ratios, DSC Ratio and Cut-Off Date Balance per unit are based on the aggregate indebtedness of or debt service on, as applicable, the related Mortgage Loan and the related
(2) The Peter Cooper Village & Stuyvesant Town Loan (loan number 5) is part of a split loan structure that includes one or more pari passu companion loans that are not included in the Trust Fund. With respect to this Mortgage Loan, unless otherwise specified, the calculations of LTV Ratios, DSC Ratio and Cut-Off Date Balance per unit are based on the aggregate indebtedness of or debt service on, as applicable, the related Mortgage Loan and the related

$ 5,845,468,231 $ 4,517,838,123 $ 1,327,630,108
Original Loan Balance ($) Mortgage Rate ARD LoanCut-Off Date
Loan Balance ($)
% of Aggregate Cut-Off Date
Balance
% of Aggregate Cut-Off Date
Group 1 Balance
% of Aggregate Cut-Off Date
Group 2 BalanceOrigination
DateFirst Pay
DateMaturity Date
or ARD
Loan Administrative
Cost Rate
Interest Accrual Method
Interest Accural Method
During IO
Original Term to Maturity or ARD (Mos.)
Remaining Term to
Maturity or ARD (Mos.)
Remaining IO Period (Mos.)
Original Amort Term
(Mos.)
Remaining Amort Term
(Mos.)Monthly P&I Payments ($)
Maturity Date or ARD Balloon Balance ($)
8,640,000.00 8,640,000.00 0.15% 0.65% 03/29/07 05/11/07 04/11/17 5.7200% 0.02038% Actual/360 Actual/360 120 119 119 IO IO IO 8,640,000.00 N8,640,000.00 8,640,000.00 0.15% 0.65% 04/10/07 05/11/07 04/11/17 5.7000% 0.02038% Actual/360 Actual/360 120 119 35 360 360 50,146.60 7,762,246.03 N8,600,000.00 8,600,000.00 0.15% 0.19% 04/02/07 06/01/07 05/01/17 6.0500% 0.02038% Actual/360 Actual/360 120 120 24 300 300 55,673.07 7,157,357.39 N8,500,000.00 8,500,000.00 0.15% 0.19% 03/13/07 05/11/07 04/11/17 5.7100% 0.02038% Actual/360 Actual/360 120 119 11 360 360 49,387.91 7,319,378.95 N
8,350,000.00 8,350,000.00 0.14% 0.63% 03/06/07 05/01/07 04/01/17 5.8600% 0.02038% Actual/360 Actual/360 120 119 59 360 360 49,313.38 7,796,310.99 N8,288,000.00 8,288,000.00 0.14% 0.18% 01/12/07 03/11/07 02/11/17 5.7100% 0.02038% Actual/360 Actual/360 120 117 117 IO IO IO 8,288,000.00 Y8,160,000.00 8,160,000.00 0.14% 0.61% 01/17/07 03/11/07 02/11/17 6.0500% 0.02038% Actual/360 Actual/360 120 117 117 IO IO IO 8,160,000.00 N8,100,000.00 8,100,000.00 0.14% 0.61% 03/30/07 05/11/07 04/11/17 5.7600% 0.02038% Actual/360 Actual/360 120 119 59 360 360 47,320.87 7,552,561.55 N8,000,000.00 8,000,000.00 0.14% 0.60% 02/02/07 03/11/07 02/11/17 5.6100% 0.02038% Actual/360 Actual/360 120 117 117 IO IO IO 8,000,000.00 N8,000,000.00 8,000,000.00 0.14% 0.18% 02/12/07 04/11/07 03/11/17 5.4600% 0.02038% Actual/360 Actual/360 120 118 118 IO IO IO 8,000,000.00 N7,900,000.00 7,900,000.00 0.14% 0.17% 03/28/07 05/11/07 04/11/17 5.6600% 0.04038% Actual/360 Actual/360 120 119 59 360 360 45,651.58 7,355,891.90 N7,550,000.00 7,541,966.61 0.13% 0.17% 03/14/07 05/11/07 04/11/17 5.6500% 0.02038% Actual/360 120 119 360 359 43,581.30 6,337,474.12 N7,500,000.00 7,500,000.00 0.13% 0.56% 03/30/07 05/06/07 04/06/17 6.0000% 0.07038% Actual/360 Actual/360 120 119 119 IO IO IO 7,500,000.00 N7,250,000.00 7,226,584.85 0.12% 0.16% 03/29/07 05/11/07 04/11/17 6.7300% 0.02038% Actual/360 120 119 180 179 64,075.57 3,338,774.36 N7,200,000.00 7,200,000.00 0.12% 0.16% 03/30/07 05/11/07 04/11/17 5.8200% 0.02038% Actual/360 Actual/360 120 119 119 IO IO IO 7,200,000.00 N7,140,000.00 7,140,000.00 0.12% 0.54% 03/28/07 04/11/07 03/11/17 5.3700% 0.02038% Actual/360 Actual/360 120 118 118 IO IO IO 7,140,000.00 N7,088,000.00 7,088,000.00 0.12% 0.16% 04/27/07 06/01/07 05/01/17 6.0000% 0.02038% Actual/360 Actual/360 120 120 36 360 360 42,496.14 6,406,159.16 N7,050,000.00 7,050,000.00 0.12% 0.16% 03/30/07 05/11/07 04/11/17 5.8000% 0.07038% Actual/360 Actual/360 120 119 119 IO IO IO 7,050,000.00 N7,000,000.00 6,993,031.46 0.12% 0.15% 03/14/07 05/01/07 04/01/17 6.0000% 0.02038% Actual/360 120 119 360 359 41,968.54 5,937,938.28 N
6,752,000.00 6,752,000.00 0.12% 0.51% 03/06/07 05/01/07 04/01/17 5.8600% 0.02038% Actual/360 Actual/360 120 119 59 360 360 39,875.92 6,304,274.47 N6,750,000.00 6,750,000.00 0.12% 0.15% 03/07/07 05/01/07 04/01/17 6.0400% 0.02038% Actual/360 Actual/360 120 119 23 360 360 40,643.41 5,987,826.51 N
6,480,000.00 6,480,000.00 0.11% 0.14% 03/15/07 05/11/07 04/11/17 5.5400% 0.02038% Actual/360 Actual/360 120 119 119 IO IO IO 6,480,000.00 N6,400,000.00 6,400,000.00 0.11% 0.14% 04/04/07 05/11/07 04/11/17 5.6100% 0.02038% Actual/360 Actual/360 120 119 119 IO IO IO 6,400,000.00 N6,250,000.00 6,250,000.00 0.11% 0.14% 03/01/07 04/11/07 03/11/17 5.5600% 0.02038% Actual/360 Actual/360 120 118 118 IO IO IO 6,250,000.00 N6,200,000.00 6,200,000.00 0.11% 0.14% 03/30/07 05/11/07 04/11/17 5.7500% 0.02038% Actual/360 Actual/360 120 119 23 300 300 39,004.60 5,119,199.72 N
6,200,000.00 6,193,465.17 0.11% 0.14% 04/02/07 05/11/07 04/11/17 5.7000% 0.02038% Actual/360 120 119 360 359 35,984.83 5,212,232.63 N6,100,000.00 6,100,000.00 0.10% 0.14% 03/14/07 05/11/07 04/11/17 5.8500% 0.07038% Actual/360 Actual/360 120 119 119 IO IO IO 6,100,000.00 N
6,016,800.00 6,016,800.00 0.10% 0.13% 04/24/07 06/01/07 05/01/17 5.9100% 0.02038% Actual/360 120 120 360 360 35,726.35 5,090,738.10 N6,000,000.00 6,000,000.00 0.10% 0.45% 03/09/07 04/11/07 03/11/17 5.8500% 0.02038% Actual/360 Actual/360 120 118 22 360 360 35,396.46 5,299,914.21 N5,950,000.00 5,950,000.00 0.10% 0.13% 03/14/07 05/11/07 04/11/12 5.6700% 0.02038% Actual/360 Actual/360 60 59 59 IO IO IO 5,950,000.00 N5,850,000.00 5,841,440.80 0.10% 0.13% 03/08/07 05/01/07 04/01/17 5.9100% 0.02038% Actual/360 120 119 300 299 37,370.45 4,517,558.48 N5,840,000.00 5,840,000.00 0.10% 0.13% 03/15/07 05/11/07 04/11/17 5.7500% 0.02038% Actual/360 Actual/360 120 119 119 IO IO IO 5,840,000.00 N5,840,000.00 5,833,856.26 0.10% 0.13% 03/13/07 05/11/07 04/11/17 5.7100% 0.02038% Actual/360 120 119 360 359 33,932.40 4,911,081.11 Y5,800,000.00 5,800,000.00 0.10% 0.13% 03/07/07 04/11/07 03/11/12 5.4800% 0.02038% Actual/360 Actual/360 60 58 58 IO IO IO 5,800,000.00 N5,750,000.00 5,750,000.00 0.10% 0.13% 04/26/07 06/01/07 05/01/17 6.4000% 0.02038% Actual/360 120 120 360 360 35,966.59 4,934,785.37 N5,680,000.00 5,680,000.00 0.10% 0.13% 04/17/07 06/11/07 05/11/17 5.8800% 0.02038% Actual/360 120 120 360 360 33,617.50 4,801,472.77 Y5,500,000.00 5,492,026.72 0.09% 0.12% 03/15/07 05/11/07 04/11/17 5.9700% 0.02038% Actual/360 120 119 300 299 35,335.78 4,255,939.67 N5,480,000.00 5,480,000.00 0.09% 0.41% 03/30/07 05/11/07 04/11/17 5.2800% 0.02038% Actual/360 Actual/360 120 119 119 IO IO IO 5,480,000.00 N5,370,000.00 5,370,000.00 0.09% 0.12% 02/06/07 03/11/07 02/11/17 5.8500% 0.02038% Actual/360 Actual/360 120 117 117 IO IO IO 5,370,000.00 N5,375,000.00 5,369,409.43 0.09% 0.40% 03/19/07 05/11/07 04/11/17 5.7700% 0.02038% Actual/360 120 119 360 359 31,435.37 4,528,275.07 N5,360,000.00 5,360,000.00 0.09% 0.12% 02/16/07 04/01/07 03/01/17 5.8300% 0.02038% Actual/360 Actual/360 120 118 58 360 360 31,552.44 5,002,736.40 N5,225,000.00 5,225,000.00 0.09% 0.12% 03/15/07 05/11/07 04/11/17 5.7300% 0.02038% Actual/360 Actual/360 120 119 23 360 360 30,425.33 4,602,174.47 N5,100,000.00 5,100,000.00 0.09% 0.11% 03/27/07 05/11/07 04/11/12 5.7000% 0.02038% Actual/360 Actual/360 60 59 59 IO IO IO 5,100,000.00 N
5,000,000.00 5,000,000.00 0.09% 0.11% 04/26/07 06/01/07 05/01/17 6.0000% 0.02038% Actual/360 120 120 360 360 29,977.53 4,241,749.91 N4,800,000.00 4,800,000.00 0.08% 0.11% 04/04/07 06/01/07 05/01/17 6.0700% 0.02038% Actual/360 120 120 360 360 28,994.80 4,080,477.01 N4,727,839.00 4,727,839.00 0.08% 0.10% 04/05/07 05/11/07 04/11/11 5.6730% 0.02038% 30/360 30/360 48 47 47 IO IO IO 4,727,839.00 N4,675,000.00 4,675,000.00 0.08% 0.35% 03/30/07 05/06/07 04/06/17 5.8800% 0.08038% Actual/360 Actual/360 120 119 119 IO IO IO 4,675,000.00 N4,580,000.00 4,571,681.60 0.08% 0.10% 03/08/07 04/11/07 03/11/17 6.0300% 0.02038% Actual/360 120 118 360 358 27,547.81 3,888,964.58 N4,540,000.00 4,535,322.56 0.08% 0.10% 03/16/07 05/01/07 04/01/17 5.8200% 0.02038% Actual/360 120 119 360 359 26,696.44 3,830,582.52 N4,480,000.00 4,480,000.00 0.08% 0.10% 03/09/07 04/11/07 03/11/17 5.7700% 0.02038% Actual/360 Actual/360 120 118 118 IO IO IO 4,480,000.00 N4,400,000.00 4,400,000.00 0.08% 0.10% 03/07/07 04/11/07 03/11/12 5.4800% 0.02038% Actual/360 Actual/360 60 58 58 IO IO IO 4,400,000.00 N4,398,000.00 4,398,000.00 0.08% 0.33% 04/12/07 06/11/07 05/11/12 6.0200% 0.02038% Actual/360 60 60 360 360 26,424.81 4,116,227.35 N4,350,000.00 4,350,000.00 0.07% 0.10% 04/12/07 06/11/07 05/11/17 5.7900% 0.02038% Actual/360 Actual/360 120 120 120 IO IO IO 4,350,000.00 N4,245,000.00 4,245,000.00 0.07% 0.32% 03/30/07 05/11/07 04/11/17 5.6500% 0.07038% Actual/360 Actual/360 120 119 119 IO IO IO 4,245,000.00 N4,026,638.00 4,009,732.11 0.07% 0.09% 12/06/06 02/01/07 01/01/17 5.7600% 0.02038% Actual/360 120 116 360 356 23,523.95 3,390,487.75 N4,000,000.00 4,000,000.00 0.07% 0.09% 05/03/07 07/01/07 06/01/17 6.3400% 0.06038% Actual/360 120 120 360 360 24,863.30 3,426,639.76 N4,000,000.00 4,000,000.00 0.07% 0.09% 03/07/07 04/11/07 03/11/12 5.4800% 0.02038% Actual/360 Actual/360 60 58 58 IO IO IO 4,000,000.00 N3,800,000.00 3,800,000.00 0.07% 0.29% 04/20/07 06/06/07 05/06/17 5.8700% 0.02038% Actual/360 Actual/360 120 120 120 IO IO IO 3,800,000.00 N3,750,000.00 3,750,000.00 0.06% 0.08% 03/21/07 05/11/07 04/11/17 5.9400% 0.02038% Actual/360 Actual/360 120 119 119 IO IO IO 3,750,000.00 N3,500,000.00 3,500,000.00 0.06% 0.08% 03/02/07 04/11/07 03/11/17 5.7000% 0.02038% Actual/360 Actual/360 120 118 46 360 360 20,314.01 3,204,800.75 N3,500,000.00 3,500,000.00 0.06% 0.26% 03/08/07 04/11/07 03/11/17 5.7700% 0.02038% Actual/360 Actual/360 120 118 58 360 360 20,469.54 3,264,029.42 N3,440,000.00 3,440,000.00 0.06% 0.08% 03/27/07 05/11/07 04/11/17 5.9100% 0.02038% Actual/360 Actual/360 120 119 119 IO IO IO 3,440,000.00 N3,437,500.00 3,437,500.00 0.06% 0.08% 03/12/07 05/11/07 04/11/12 5.6230% 0.02038% 30/360 30/360 60 59 59 IO IO IO 3,437,500.00 N3,400,000.00 3,400,000.00 0.06% 0.08% 04/13/07 06/11/07 05/11/17 5.7500% 0.02038% Actual/360 120 120 360 360 19,841.48 2,862,892.98 N3,308,000.00 3,304,668.89 0.06% 0.07% 04/10/07 05/11/07 04/11/17 5.9400% 0.02038% Actual/360 120 119 360 359 19,705.71 2,801,120.34 N3,200,000.00 3,200,000.00 0.05% 0.07% 03/07/07 04/11/07 03/11/12 5.4800% 0.02038% Actual/360 Actual/360 60 58 58 IO IO IO 3,200,000.00 N3,150,000.00 3,150,000.00 0.05% 0.07% 04/30/07 06/01/07 05/01/17 5.9900% 0.02038% Actual/360 120 120 360 360 18,865.59 2,671,512.86 N3,030,000.00 3,030,000.00 0.05% 0.07% 01/12/07 03/11/07 02/11/17 5.6100% 0.02038% Actual/360 Actual/360 120 117 33 360 360 17,413.70 2,716,695.96 N3,030,000.00 3,030,000.00 0.05% 0.07% 03/30/07 05/11/07 04/11/17 5.8000% 0.02038% Actual/360 Actual/360 120 119 59 360 360 17,778.62 2,826,767.95 N2,730,000.00 2,730,000.00 0.05% 0.21% 04/20/07 06/11/07 05/11/14 5.6800% 0.02038% Actual/360 Actual/360 84 84 36 360 360 15,810.35 2,584,763.05 N2,600,000.00 2,600,000.00 0.04% 0.06% 03/07/07 04/11/07 03/11/12 5.4800% 0.02038% Actual/360 Actual/360 60 58 58 IO IO IO 2,600,000.00 N2,600,000.00 2,597,436.34 0.04% 0.06% 03/09/07 05/01/07 04/01/17 6.0500% 0.02038% Actual/360 120 119 360 359 15,671.99 2,208,768.08 N2,070,000.00 2,070,000.00 0.04% 0.05% 04/10/07 05/11/07 04/11/17 5.7600% 0.04038% Actual/360 Actual/360 120 119 59 360 360 12,093.11 1,930,099.06 N1,605,000.00 1,605,000.00 0.03% 0.04% 04/23/07 06/11/07 05/11/17 5.8800% 0.02038% Actual/360 120 120 360 360 9,499.31 1,356,754.19 Y
1,590,000.00 1,590,000.00 0.03% 0.12% 03/27/07 05/01/07 04/01/12 6.1100% 0.02038% Actual/360 Actual/360 60 59 23 360 360 9,645.59 1,533,584.07 N1,523,600.00 1,520,544.17 0.03% 0.11% 03/02/07 04/11/07 03/11/17 5.5800% 0.02038% Actual/360 120 118 360 358 8,727.46 1,276,284.22 N1,375,000.00 1,373,682.72 0.02% 0.10% 04/04/07 05/11/07 04/11/12 6.2000% 0.02038% Actual/360 60 59 360 359 8,421.45 1,289,921.51 N
(11) Certain of the Mortgage Loans reflect LTV Ratios that have been calculated on an ‘‘as-stabilized’’ basis, or have LTV Ratios or DSC Ratios that have been adjusted to take into account certain cash reserves, holdbacks or letters of credit or were calculated based on assumptions regarding the future financial performance of the related Mortgaged Property. See ‘‘DESCRIPTION OF THE MORTGAGE POOL—Additional Mortgage Loan Information’’ and ‘‘RISK FACTORS—Risks Relating to Net Cash Flow’’ and ‘‘—Inspections and Appraisals May Not Accurately Reflect Value or Condition of Mortgaged Property’’ in the Prospectus Supplement.
companion loans are not included in the Trust Fund with respect to the Mortgage Loan, unless otherwise specified. With respect to these Mortgage Loans, unless otherwise specified, the calculations of LTV Ratios, DSC Ratio and Cut-Off Date Balance per unit are based on the aggregate indebtedness of or debt service on, as applicable, the related Mortgage Loan and the related pari passu companion loan.
companion loans that are not included in the Trust Fund. With respect to this Mortgage Loan, unless otherwise specified, the calculations of LTV Ratios, DSC Ratio and Cut-Off Date Balance per unit are based on the aggregate indebtedness of or debt service on, as applicable, the related Mortgage Loan and the related pari passu companion loan, but not any related future pari passu companion loan.

Prepayment Provisions Appraised Value ($) Appraisal Date DSCR (x) Year Renovated Number of Units Most Recent PeriodMortgage Loan
NumberMortgage
Loan NumberCut-Off Date
LTV Ratio
LTV Ratio at Maturity or
ARDYearBuilt
Unit of Measure
Cut-Off Date Loan Amount Per (Unit) ($)
Occupancy Rate
Occupancy "as of" Date
L(25),D(92),O(3) 10,800,000 113 113 02/07/07 1.20 80.00% 80.00% 1925 2006 155 Units 55,741.94 98.7% 04/01/07 2006L(25),D(89),O(6) 10,800,000 114 114 03/02/07 1.27 80.00% 71.87% 1973 296 Units 29,189.19 90.2% 03/07/07 T 12 Through 2/28/2007L(24),D(92),O(4) 13,500,000 115 115 11/03/06 1.21 63.70% 53.02% 1967 2005 52 Rooms 165,384.62 63.2% 02/28/07 T-12 through 2/28/2007L(25),D(92),O(3) 10,650,000 116 116 01/25/07 1.25 79.81% 68.73% 2003 52,000 Sq. Ft. 163.46 100.0% 02/02/07 2006
L(25),D(92),O(3) 10,640,000 117 117 01/25/07 1.19 74.44% 69.17% 1984 329 Pads 25,379.94 86.0% 02/28/07 T-12 through 2/28/2007L(48),D(68),O(4) 12,750,000 118 118 12/01/06 1.54 65.00% 65.00% 2006 86,725 Sq. Ft. 95.57 92.2% 01/01/07L(39),GRTR1%orYM(77),O(4) 10,200,000 119 119 11/02/06 1.26 80.00% 80.00% 1984 152 Units 53,684.21 94.7% 12/28/06 3 Months Annualized 10/31/2006L(25),D(92),O(3) 10,500,000 120 120 01/22/07 1.20 77.14% 71.93% 1995 78 Units 103,846.15 100.0% 02/28/07 T-12 (ending 1/07)L(27),GRTR1%orYM(88),O(5) 10,150,000 121 121 01/09/07 1.43 78.82% 78.82% 1972 2006 359 Units 22,284.12 90.3% 02/25/07 T6 (ending Feb 07)L(26),GRTR1%orYM(90),O(4) 12,600,000 122 122 01/23/07 1.65 63.49% 63.49% 2001 70,070 Sq. Ft. 114.17 100.0% 01/08/07 2006L(25),GRTR1%orYM(90),O(5) 10,900,000 123 123 02/08/07 1.20 72.48% 67.49% 1997 151,000 Sq. Ft. 52.32 100.0% 03/19/07 01/07 AnnualizedL(25),D(92),O(3) 10,100,000 124 124 01/01/07 1.49 74.67% 62.75% 1994 76 Rooms 99,236.40 80.8% 12/31/06 T-12 (ending 12/06)L(25),D(92),O(3) 9,400,000 125 125 02/21/07 1.22 79.79% 79.79% 1960 178 Pads 42,134.83 100.0% 02/16/07 Year End 12/31/2006L(25),D(92),O(3) 12,800,000 126 126 07/03/06 1.33 56.46% 26.08% 1976 2006 202 Rooms 35,775.17 68.6% 12/31/06 TTM - 12/06L(25),GRTR1%orYM(91),O(4) 10,300,000 127 127 02/19/07 1.55 69.90% 69.90% 2005 38,171 Sq. Ft. 188.62 94.7% 02/28/07L(26),D(90),O(4) 8,950,000 128 128 01/19/07 1.40 79.78% 79.78% 1982 176 Units 40,568.18 94.3% 02/28/07 2006L(24),D(94),O(2) 9,300,000 129 129 03/12/07 1.29 76.22% 68.88% 2004 65,556 Sq. Ft. 108.12 100.0% 05/01/07L(25),D(91),O(4) 8,850,000 130 130 02/01/07 1.40 79.66% 79.66% 1996 45,412 Sq. Ft. 155.25 100.0% 02/01/07 2006L(25),D(92),O(3) 10,400,000 131 131 01/18/07 1.21 67.24% 57.10% 1963 2005 65,000 Sq. Ft. 107.59 100.0% 05/01/07
L(25),D(92),O(3) 8,440,000 132 132 01/25/07 1.19 74.44% 69.17% 1979 203 Pads 33,261.08 97.5% 02/28/07 T-12 through 2/28/2007L(25),D(91),O(4) 9,500,000 133 133 08/14/06 1.40 71.05% 63.03% 2002 274,510 Sq. Ft. 24.59 100.0% 05/01/07
L(25),D(92),O(3) 8,100,000 134 134 12/01/07 1.20 80.00% 80.00% 2000 61,370 Sq. Ft. 105.59 73.0% 03/04/07 Jan 07 - TR 6 annualizedL(25),D(89),O(6) 8,200,000 135 135 01/01/07 1.29 78.05% 78.05% 1988 125,000 Sq. Ft. 51.20 100.0% 03/23/07L(26),D(90),O(4) 7,950,000 136 136 01/08/07 1.53 78.62% 78.62% 2005 27,379 Sq. Ft. 228.28 100.0% 01/08/07L(25),D(92),O(3) 13,150,000 137 137 Various 2.03 47.15% 38.93% Various Various 799,039 Sq. Ft. 7.76 100.0% 03/19/07
2,450,000 137.01 137.01 02/26/07 1967 1974 154,594 Sq. Ft. 100.0% 03/19/072,250,000 137.02 137.02 11/09/06 1975 150,000 Sq. Ft. 100.0% 03/19/072,950,000 137.03 137.03 11/09/06 2004 150,000 Sq. Ft. 100.0% 03/19/072,350,000 137.04 137.04 03/06/07 1978 148,968 Sq. Ft. 100.0% 03/19/071,550,000 137.05 137.05 03/06/07 1968 96,613 Sq. Ft. 100.0% 03/19/071,600,000 137.06 137.06 03/01/07 1975 98,864 Sq. Ft. 100.0% 03/19/07
L(25),D(92),O(3) 7,800,000 138 138 12/11/06 1.21 79.40% 66.82% 1979 78,099 Sq. Ft. 79.30 97.0% 03/26/07 2006L(25),D(91),O(4) 7,680,000 139 139 02/01/07 1.44 79.43% 79.43% 1988 93,294 Sq. Ft. 65.38 90.8% 03/12/07 2006
L(24),D(94),O(2) 8,700,000 140 140 09/01/07 1.65 69.16% 58.51% 1995 2007 106 Rooms 56,762.26 65.8% 01/31/07 T-12 through 01/31/2007L(26),D(91),O(3) 8,800,000 141 141 12/01/06 1.24 68.18% 60.23% 1970 2005 125 Units 48,000.00 94.4% 02/06/07 3 Months Annualized 1/31/2007L(25),D(29),O(6) 8,600,000 142 142 12/11/06 1.40 69.19% 69.19% 1977 28,554 Sq. Ft. 208.38 100.0% 03/12/07 Year End 12/31/2006L(25),D(93),O(2) 7,800,000 143 143 02/01/07 1.77 74.89% 57.92% 2005 66 Rooms 88,506.68 75.4% 01/31/07 T-12 through 1/31/2007L(25),D(92),O(3) 7,390,000 144 144 02/16/07 1.31 79.03% 79.03% 2006 12,020 Sq. Ft. 485.86 100.0% 01/16/07L(25),D(92),O(3) 7,300,000 145 145 01/06/07 1.32 79.92% 67.28% 2006 22,082 Sq. Ft. 264.19 100.0% 02/02/07GRTR1%orYM(53),O(7) or L(26),D(27),O(7) 14,050,000 146 146 01/27/07 2.57 41.28% 41.28% 2005 75,063 Sq. Ft. 77.27 69.2% 01/17/07 2006L(24),D(94),O(2) 7,200,000 147 147 03/06/07 1.22 79.86% 68.54% 2003 106 Rooms 54,245.28 62.4% 01/31/07 T-12 through 1/31/2007L(24),D(93),O(3) 7,100,000 148 148 01/23/07 1.23 80.00% 67.63% 2006 26,833 Sq. Ft. 211.68 100.0% 03/29/07L(25),D(92),O(3) 8,700,000 149 149 02/01/07 1.53 63.13% 48.92% 2000 77 Rooms 71,325.02 64.0% 11/30/06 FY 2006L(25),D(91),O(4) 6,975,000 150 150 03/07/07 1.63 78.57% 78.57% 1981 130 Units 42,153.85 91.5% 01/01/07 2006L(27),D(90),O(3) 7,200,000 151 151 11/27/06 1.51 74.58% 74.58% 1994 40,889 Sq. Ft. 131.33 93.0% 10/01/06 T 12 Through 9/30/2006L(25),D(92),O(3) 6,775,000 152 152 11/13/06 1.20 79.25% 66.84% 2006 104 Units 51,628.94 100.0% 02/14/07L(26),D(92),O(2) 6,900,000 153 153 01/05/07 1.29 77.68% 72.50% 1989 2005 38,495 Sq. Ft. 139.24 100.0% 08/23/06 12/31/2006L(25),D(92),O(3) 6,600,000 154 154 03/01/07 1.21 79.17% 69.73% 2006 30,038 Sq. Ft. 173.95 100.0% 03/01/07GRTR1%orYM(55),O(5) 6,700,000 155 155 03/10/07 1.36 76.12% 76.12% 1988 34,256 Sq. Ft. 148.88 100.0% 03/23/07 2006
L(24),D(94),O(2) 8,510,000 156 156 03/09/07 1.48 58.75% 49.84% 2002 2005 166 Pads 30,120.48 49.0% 05/01/07 T-12 through 02/28/2007L(24),D(94),O(2) 8,200,000 157 157 04/01/07 1.35 58.54% 49.76% 1951 2002 62,678 Sq. Ft. 76.58 100.0% 05/01/07 12/31/2006L(25),GRTR1%orYM(19),O(4) 8,100,000 158 158 02/12/07 1.90 58.37% 58.37% 2006 55,500 Sq. Ft. 85.19 100.0% 01/08/07 9 Months Annualized 9/30/2006L(25),D(92),O(3) 6,400,000 159 159 02/08/07 1.30 73.05% 73.05% 1970 2005 34 Units 137,500.00 97.1% 01/16/07 Year End 12/31/2006L(26),D(91),O(3) 5,746,000 160 160 11/20/06 1.31 79.56% 67.68% 2002 70 Rooms 65,309.74 84.4% 12/31/06 2006L(25),D(93),O(2) 6,000,000 161 161 02/01/07 1.33 75.59% 63.84% 1997 87 Rooms 52,130.14 62.7% 12/31/06 12/31/2006L(26),D(89),O(5) 5,600,000 162 162 02/06/07 1.43 80.00% 80.00% 2003 65,477 Sq. Ft. 68.42 100.0% 03/08/07GRTR1%orYM(53),O(7) or L(26),D(27),O(7) 11,000,000 163 163 01/24/07 2.22 40.00% 40.00% 2005 78,715 Sq. Ft. 55.90 83.4% 01/17/07 2006L(24),D(33),O(3) 5,600,000 164 164 02/20/07 1.24 78.54% 73.50% 1963 104 Units 42,288.46 98.1% 02/21/07 Year End 12/31/2006L(24),D(93),O(3) 5,600,000 165 165 03/01/07 1.44 77.68% 77.68% 1985 46,590 Sq. Ft. 93.37 100.0% 04/10/07 T 2 Through 2/28/2007L(25),D(92),O(3) 5,600,000 166 166 02/19/07 1.34 75.80% 75.80% 1967 44 Units 96,477.27 93.2% 02/16/07 Year End 12/31/2006L(28),D(88),O(4) 5,060,000 167 167 11/09/06 1.27 79.24% 67.01% 2006 14,564 Sq. Ft. 275.32 100.0% 05/01/07L(23),D(94),O(3) 7,300,000 168 168 03/06/07 1.35 54.79% 46.94% 1998 120 Rooms 33,333.33 47.7% 01/31/07 T 12 Through 1/31/2007GRTR1%orYM(53),O(7) or L(26),D(27),O(7) 10,000,000 169 169 01/24/07 2.66 40.00% 40.00% 2005 68,380 Sq. Ft. 58.50 86.8% 01/17/07 2006L(24),D(93),O(3) 5,000,000 170 170 02/27/07 1.26 76.00% 76.00% 2004 24 Units 158,333.33 100.0% 02/01/07 Year End 12/31/2006L(23),GRTR1%orYM(93),O(4) 4,700,000 171 171 02/10/07 1.27 79.79% 79.79% 1998 10,908 Sq. Ft. 343.78 100.0% 02/27/07 2006L(26),D(88)or(GRTR1%orYM(88)),O(6) 4,500,000 172 172 01/19/07 1.22 77.78% 71.22% 1978 50,800 Sq. Ft. 68.90 100.0% 02/21/07 Thru 1/31/07L(26),GRTR1%orYM(91),O(3) 4,400,000 173 173 12/18/06 1.15 79.55% 74.18% 1998 54 Units 64,814.81 96.3% 02/01/07L(25),D(91),O(4) 4,300,000 174 174 09/26/06 1.26 80.00% 80.00% 2006 13,650 Sq. Ft. 252.01 100.0% 03/31/07L(25),GRTR1%orYM(31),O(4) 6,280,000 175 175 10/18/06 2.03 54.74% 54.74% 2006 26,680 Sq. Ft. 128.84 94.0% 11/28/06L(24),D(93),O(3) 4,800,000 176 176 01/03/07 1.42 70.83% 59.64% 1988 96,000 Sq. Ft. 35.42 100.0% 02/20/07 2006L(24),GRTR1%orYM(89),O(7) 4,200,000 177 177 02/09/07 1.21 78.68% 66.69% 1996 2006 29,728 Sq. Ft. 111.16 100.0% 04/23/07GRTR1%orYM(53),O(7) or L(26),D(27),O(7) 7,700,000 178 178 01/26/07 1.92 41.56% 41.56% 1968 2004 52,485 Sq. Ft. 60.97 64.8% 01/17/07 2006L(24),D(94),O(2) 4,220,000 179 179 03/20/07 1.27 74.64% 63.31% 1999 2004 27,035 Sq. Ft. 116.52 100.0% 04/01/07 T-12 through 3/31/2007L(27),D(90),O(3) 3,700,000 180 180 11/11/06 1.21 81.89% 73.42% 2005 10,000 Sq. Ft. 303.00 80.0% 01/08/07L(25),D(91),O(4) 4,125,000 181 181 12/01/06 1.20 73.45% 68.53% 2005 14,231 Sq. Ft. 212.92 100.0% 03/21/07 2006L(24),D(57),O(3) 3,425,000 182 182 02/22/07 1.24 79.71% 75.47% 1971 185 Pads 14,756.76 100.0% 01/19/07 Year End 12/31/2007GRTR1%orYM(53),O(7) or L(26),D(27),O(7) 6,500,000 183 183 02/13/07 2.49 40.00% 40.00% 2004 46,585 Sq. Ft. 55.81 85.1% 01/17/07 2006L(25),D(93),O(2) 3,400,000 184 184 01/19/07 1.25 76.40% 64.96% 1987 51,950 Sq. Ft. 50.00 84.6% 02/01/07 12/31/2006L(25),D(92),O(3) 2,610,000 185 185 01/05/07 1.21 79.31% 73.95% 2006 7,574 Sq. Ft. 273.30 100.0% 03/31/07L(24),D(93),O(3) 2,050,000 186 186 03/20/07 1.34 78.29% 66.18% 1996 11,325 Sq. Ft. 141.72 100.0% 03/06/07
L(25),D(22),O(13) 2,300,000 187 187 02/16/07 1.31 57.39% 54.94% 1972 1993 80 Pads 19,875.00 86.3% 03/01/07 T-12 through 2/28/2007L(38),GRTR1%orYM(78),O(4) 2,460,000 188 188 01/24/07 1.60 61.81% 51.88% 1910 1989 31 Units 49,049.81 96.8% 01/31/07 Year End 12/31/2006L(25),D(32),O(3) 1,800,000 189 189 01/31/07 1.30 76.32% 71.66% 1988 53 Pads 25,918.54 96.2% 01/31/07 Year End 12/31/2006

Largest Tenant Name Largest Tenant Sq. Ft. 2nd Largest Tenant NameMost Recent Revenues ($)
Most Recent Expenses ($)
Most Recent NOI ($)
Most Recent NCF
($)UW Revenues
($)UW Expenses
($)
UW Net Operating Income ($)
UW Net Cash Flow ($)
Largest Tenant
% of NRALargest Tenant
Exp. Date
2nd Largest Tenant Sq.
Ft.
2nd Largest
Tenant % of NRA
1,101,479 501,436 600,043 564,548 1,133,048 502,175 630,873 595,3781,765,041 953,669 811,372 811,372 1,817,824 976,782 841,042 767,0422,268,095 1,330,328 937,767 869,724 2,258,502 1,361,764 896,739 806,3981,081,982 382,550 699,432 694,232 1,070,053 326,393 743,660 738,460 United States Government, Department of Homeland Security 52,000 100.00% 07/28/23
629,817 212,907 629,817 629,817 836,507 170,867 665,640 652,4401,138,474 383,979 754,495 726,978 Ross Dress for Less 30,187 34.81% 01/31/2017 Bed Bath & Beyond 23,000 26.52%
1,178,084 694,072 484,012 484,012 1,169,034 501,983 667,051 629,0511,128,193 381,396 746,797 701,089 1,093,072 365,661 727,411 681,7031,786,356 1,023,566 762,790 673,040 1,802,480 1,070,638 731,842 642,0921,071,172 387,587 683,585 676,578 1,160,962 399,719 761,243 721,067 Publix 44,270 63.18% 07/31/2021 Beef O'Brady's 4,000 5.71% 949,962 147,183 802,779 780,129 849,663 141,404 708,259 658,485 BACE Manufacturing, Inc. 151,000 100.00% 04/30/2012
2,071,028 1,161,635 909,393 826,552 2,066,627 1,204,094 862,534 779,869889,492 492,066 397,426 397,426 966,935 401,110 565,825 556,925
4,622,274 3,269,238 1,353,036 1,353,036 4,576,017 3,369,631 1,206,386 1,023,345893,230 196,572 696,658 651,081 Fuddruckers 4,203 11.01% 10/31/2016 Rug Decor 3,999 10.48%
1,284,275 733,920 550,355 506,355 1,268,570 687,929 580,642 536,642956,535 254,803 701,732 659,206 Gander Mountain 65,556 100.00% 09/30/19
1,131,164 504,511 626,653 614,392 1,111,258 502,686 608,572 573,932 Quello Clinic 27,831 61.29% 10/31/2016 Suburban Radiology 4,629 10.19% 837,464 198,923 638,541 611,802 Liber Chocolate & Food Co., Inc. 65,000 100.00% 03/30/22
693,510 179,544 513,966 513,966 682,268 157,473 524,796 516,676959,648 206,839 752,809 684,181 Stribling Packaging, Inc 274,510 100.00% 02/28/22
790,236 370,176 420,060 420,060 821,551 385,589 435,963 429,825470,250 470,250 470,250 Meadowland Parkway Associates 125,000 100.00% 12/31/09645,205 110,255 534,950 530,843 CVS 13,796 50.39% 01/30/2028 Perkins Eastman Architects 10,909 39.84%
1,418,293 324,027 1,094,267 949,372 Baldwin Transfer Various Various Various304,351 91,570 212,780 195,775 Baldwin Transfer 154,594 100.00% 11/30/21276,981 69,559 207,422 162,422 Baldwin Transfer 150,000 100.00% 11/30/21233,646 37,607 196,039 151,039 Baldwin Transfer 150,000 100.00% 07/31/19240,961 33,171 207,790 191,404 Baldwin Transfer 148,968 100.00% 11/30/21178,195 44,586 133,609 122,981 Baldwin Transfer 96,613 100.00% 11/30/21184,159 47,533 136,626 125,751 Baldwin Transfer 98,864 100.00% 11/30/21
763,372 214,788 548,584 540,774 854,171 259,496 594,676 523,562 Food Lion 29,000 37.13% 11/01/2014 USPS 15,660 20.05% 888,988 347,238 541,750 526,823 939,511 364,005 575,506 513,951 AccuTronics 19,123 20.50% 06/30/2010 MaxCam Corp 10,178 10.91%
2,315,147 1,488,103 827,044 734,438 2,314,827 1,515,157 799,670 707,077983,196 466,832 516,364 516,364 980,499 422,065 558,434 527,184690,588 218,794 471,794 471,794 720,440 216,682 503,757 479,487 China Palace 4,200 14.71% 12/31/08 Video Depot 3,574 12.52%
2,048,265 1,059,292 988,973 988,973 2,038,767 1,164,638 874,129 792,578531,195 79,273 451,922 438,895 Wachovia Bank National Association 4,000 33.28% 08/31/2026 Sugar Land Uniforms 3,315 27.58% 796,811 257,543 539,268 537,060 GSA 22,082 100.00% 07/31/20
433,959 534,757 -100,798 -100,798 1,431,785 608,911 822,873 815,3611,931,088 1,344,126 586,962 586,962 1,931,053 1,327,479 603,574 526,331
687,843 188,976 498,867 495,781 FBI 26,833 100.00% 02/08/211,889,639 1,118,225 771,414 694,320 1,908,109 1,180,754 727,355 650,4251,068,074 632,772 435,302 402,802 1,090,426 587,413 503,013 470,513866,008 400,059 465,949 465,949 875,116 360,669 514,447 480,179 McStain 25,722 62.91% 11/07/14 Holcim 7,247 17.72%
741,300 262,239 479,061 453,061554,879 89,170 465,709 465,709 628,451 116,808 511,643 489,015 Happy Harry's 12,000 31.17% 08/31/22 Dollar Tree 10,000 25.98%
464,799 4,648 460,151 442,699 Best Buy 30,038 100.00% 01/31/2018742,329 275,877 466,452 452,064 710,915 266,720 444,195 396,484 City of Los Angeles - LAPD 4,480 13.08% MTM Timothy Larson 3,335 9.74%
1,284,072 692,095 591,977 591,977 1,284,274 743,466 540,808 532,508441,502 117,882 323,620 323,620 674,245 180,552 493,692 470,782 National Compressor Exchange of New York, Inc. 51,278 81.81% 06/30/28 National Brand Coffee Service, Inc. 11,400 18.19% 703,006 235,625 467,380 467,380 734,057 195,862 538,195 508,833 Bed Bath & Beyond 23,000 41.44% 01/31/16 Best Buy 20,000 36.04% 459,455 164,277 295,178 295,178 575,206 205,749 369,456 360,956
1,636,934 1,086,371 550,563 485,086 1,585,596 1,088,058 497,538 434,1141,723,572 1,174,232 549,341 479,734 1,726,918 1,214,656 512,262 426,134
496,602 103,757 392,845 369,672 Dupage County election commission 28,414 43.40% 09/30/11 Norandex Distribution Inc. 14,511 22.16% 665,684 357,097 308,587 308,587 915,274 371,150 544,124 534,084862,028 453,242 408,786 408,786 865,997 445,489 420,508 394,508754,146 408,618 345,528 345,528 722,236 306,845 415,390 368,148 State of Florida Department of Revenue 21,139 45.37% 12/31/10 Center for Independent Living Inc. 5,227 11.22% 513,393 205,303 308,090 308,090 520,735 184,491 336,244 325,244
382,704 11,481 371,223 357,096 Rite Aid 14,564 100.00% 07/31/261,474,023 1,061,759 412,264 412,264 1,502,538 1,040,324 462,214 402,112840,162 331,556 508,606 508,606 908,596 317,903 590,694 583,855395,622 99,048 296,574 296,574 394,827 104,057 290,770 284,770296,152 296,152 295,061 287,044 2,870 284,174 283,083 CVS 10,908 100.00% 09/03/18473,714 161,359 312,355 302,703 507,172 188,386 318,786 298,315 Danial Casabona 3,335 6.56% 12/31/2007 Angel Leonardo Estralla 1,805 3.55%
540,778 245,289 295,489 281,989388,242 111,071 277,172 256,642 Radio Shack 2,432 17.82% 01/31/2012 AZP Inc d/b/a Jang 1,976 14.48% 574,988 163,780 411,209 391,900 Anna's Linens 8,050 30.17% 05/02/16 Buffalo Wild Wings 5,614 21.04%
518,049 90,673 427,376 417,776 484,206 102,091 382,115 338,343 Shed Manufacturing, Inc. 38,400 40.00% 01/31/2010 Community Alternatives, Inc. 28,200 29.38% 370,229 65,729 304,499 285,685 Dollar Tree 8,000 26.91% 09/30/2011 CATO 5,200 17.49%
485,826 393,289 92,537 92,537 734,309 390,277 344,032 337,307872,554 505,281 367,273 367,273 849,790 528,517 321,273 287,605 Bull Creek Restaurant 5,200 19.23% 03/31/10 Waterloo Restaurant 4,999 18.49%
332,918 70,817 262,101 252,621 Jack-n-Grill Mexican Restaurant 4,000 40.00% 06/26/16 Heidi's Deli 2,000 20.00% 291,533 91,315 200,218 198,772 353,429 87,239 266,191 256,611 Regions Bank 4,000 28.11% 03/31/2015 Cingular Wireless 1,600 11.24% 498,445 240,500 257,945 257,945 482,804 239,060 243,744 234,344560,002 277,175 282,827 282,827 637,846 279,377 358,469 354,839437,170 176,380 260,790 252,997 437,170 194,039 243,131 235,339
238,686 55,014 183,672 175,401 Nancy McEachern & Frank Turner 1,898 25.06% 01/31/2012 Suiyen He 1,800 23.77% 157,197 3,144 154,053 152,354 Rite Aid 11,325 100.00% 05/31/17
226,380 60,570 165,810 165,810 226,200 96,548 129,652 125,652277,512 107,486 170,026 170,026 314,675 138,940 175,735 167,985176,228 38,718 137,510 137,510 181,260 46,445 134,815 131,847

3rd Largest Tenant Name Lockbox2nd Largest
Tenant Exp. Date
3rd Largest
Tenant Sq. Ft.
3rd Largest
Tenant % of NRA
3rd Largest Tenant Exp. Date
Largest Affiliated Sponsor Flag(> than 4% of Pool, Loan Group 1 or Loan Group 2)
Mortgage Loan
Number113114
Springing 115116
Springing 11701/31/2017 Petsmart 20,071 23.14% 05/30/16 Springing 118
119120121
03/31/2008 Washington Mutual Bank 3,600 5.14% 11/30/2011 122Day 1 123
124125126
05/31/2011 Papa's Pizza 3,232 8.47% 04/30/2011 127128
Day 1 12910/31/11 Minnesota Sport and Spine 4,166 9.17% 11/30/2011 130
Day 1 131
Springing 132Day 1 133
134135
12/31/18 Dunkin Donuts 2,674 9.77% 12/31/18 136137
137.01137.02137.03137.04137.05137.06
04/19/2011 Family Dollar 8,450 10.82% 12/31/2007 13810/12/09 EPIEN Medical 7,591 8.14% 05/31/2009 139
Day 1 140141
12/31/07 Radio Shack 2,700 9.46% 11/09/08 Springing 142Day 1 143
01/31/2012 Starbuck's 1,730 14.39% 09/30/2016 144145146
Day 1 147Springing 148
149150
12/31/10 CoBiz Bank 5,065 12.39% 11/07/09 Day 1 151152
04/30/11 Slim-Z, LLC 8,495 22.07% 12/31/22 Day 1 153Springing 154
01/31/2009 Bowker and Roth Property Services, Inc. 2,508 7.32% 06/30/2007 155
Springing 15606/30/11 Day 1 15701/31/16 Dollar Tree 12,500 22.52% 08/31/15 Springing 158
159160
Day 1 16111/30/09 Midwest Envelopes 11,622 17.75% 06/30/11 162
163164
09/30/13 State of Florida Department of Lottery 4,100 8.80% 12/31/07 Day 1 165Day 1 166
Springing 167168169170171
02/28/2007 Maintenance Storage Bay 1,685 3.32% 12/31/2008 172173
12/14/2011 Fiji Corp 1,900 13.92% 12/14/2011 17405/31/16 Dots Fashions 4,000 14.99% 05/31/11 175
12/31/2009 Harbour Graphics, Inc. 10,200 10.63% 02/28/2019 17601/31/2012 Hibbbett Sports 5,000 16.82% 10/31/2011 177
17810/31/10 Chase Carpets 4,763 17.62% 10/31/09 17912/31/25 Anthony's Pizza & Pasta 2,000 20.00% 07/15/13 180
11/30/2011 Citi Financial 1,600 11.24% 04/30/2010 181182183
Springing 18407/31/2011 H&R Block Enterprises 1,380 18.22% 04/30/2011 185
Day 1 186
187188189

WACHOVIA BANK COMMERCIAL MORTGAGE TRUST SERIES 2007-C31
ANNEX A-2 CERTAIN INFORMATION REGARDING MULTIFAMILY MORTGAGED PROPERTIES
Property Name Property Address Property City County Specific Property Type
5 2 Wachovia Various New York New York NY Various Multifamily Conventional 247,727,273 $267,213 6.4340%5.01 Stuyvesant Town 317 Avenue C (General Management Office); Various Others New York New York NY 10009 Multifamily Conventional
Deregulated - Stuyvesant TownStabilized - Stuyvesant Town
5.02 Peter Cooper Village 4 Peter Cooper Road (Security Office); Various Others New York New York NY 10016 Multifamily ConventionalDeregulated - Peter Cooper VillageStabilized - Peter Cooper Village
11 1 Nomura Lembi Pool Various San Francisco San Francisco CA Various Various Various 122,500,000 Various 6.4700%11.01 300 Buchanan Street 300 Buchanan Street San Francisco San Francisco CA 94102 Multifamily Conventional11.02 536 Leavenworth Street 536 Leavenworth Street San Francisco San Francisco CA 94109 Multifamily Conventional11.03 210-218 Church Street 210-218 Church Street San Francisco San Francisco CA 94114 Multifamily Conventional11.04 1405 Franklin Street 1405 Franklin Street San Francisco San Francisco CA 94109 Multifamily Conventional11.05 610 Leavenworth Street 610 Leavenworth Street San Francisco San Francisco CA 94109 Multifamily Conventional11.06 350 Judah Street 350 Judah Street San Francisco San Francisco CA 94122 Multifamily Conventional11.07 2080 Gough Street 2080 Gough Street San Francisco San Francisco CA 94114 Multifamily Conventional11.08 455 Hyde Street 455 Hyde Street San Francisco San Francisco CA 94109 Multifamily Conventional11.09 1035 Sutter Street 1035 Sutter Street San Francisco San Francisco CA 94109 Multifamily Conventional11.10 969 Bush Street 969 Bush Street San Francisco San Francisco CA 94109 Multifamily Conventional11.11 345 Fulton Street 345 Fulton Street San Francisco San Francisco CA 94102 Multifamily Conventional11.12 516 Ellis Street 516 Ellis Street San Francisco San Francisco CA 94109 Multifamily Conventional11.13 721 Geary Street 721 Geary Street San Francisco San Francisco CA 94109 Multifamily Conventional11.14 11 Dolores Street 11 Dolores Street San Francisco San Francisco CA 94103 Multifamily Conventional11.15 2335 Larkin Street 2335 Larkin Street San Francisco San Francisco CA 94109 Multifamily Conventional11.16 3875 18th Street 3875 18th Street San Francisco San Francisco CA 94114 Multifamily Conventional11.17 1025 Sutter Street 1025 Sutter Street San Francisco San Francisco CA 94109 Multifamily Conventional11.18 828 Jones Street 828 Jones Street San Francisco San Francisco CA 94109 Multifamily Conventional11.20 735 O'Farrell Street 735 O'Farrell Street San Francisco San Francisco CA 94109 Multifamily Conventional11.21 2337-2339 Market Street 2337-2339 Market Street San Francisco San Francisco CA 94114 Multifamily Conventional11.22 635 Ellis Street 635 Ellis Street San Francisco San Francisco CA 94109 Multifamily Conventional11.23 215-219 Church Street 215-219 Church Street San Francisco San Francisco CA 94114 Multifamily Conventional11.24 1385 Kansas Street 1385 Kansas Street San Francisco San Francisco CA 94107 Multifamily Conventional11.25 747 Ellis Street 747 Ellis Street San Francisco San Francisco CA 94109 Multifamily Conventional11.27 601 Larkin Street 601 Larkin Street San Francisco San Francisco CA 94109 Multifamily Conventional11.28 1520-1524 Geneva Avenue 1520-1524 Geneva Avenue San Francisco San Francisco CA 94112 Multifamily Conventional11.29 1199 DeHaro Street 1199 DeHaro Street San Francisco San Francisco CA 94107 Multifamily Conventional
14 2 Wachovia City Heights Apartment Homes 209 South Westmoreland Avenue Los Angeles Los Angeles CA 90004 Multifamily Conventional 98,000,000 $142,649 5.6500%16 2 Barclays Clinton Manor 535 West 51st Street & 540 West 52nd Street New York New York NY 10019 Multifamily Conventional 79,000,000 $327,801 5.5000%22 2 Nomura Addison at Swift Creek Apartments 4100 Lonas Parkway Midlothian Chesterfield VA 23112 Multifamily Conventional 47,320,000 $109,537 5.7800%24 2 Wachovia Park Place Apartments 675 Town Center Drive Newport News Newport News City VA 23606 Multifamily Conventional 46,400,000 $128,532 5.5300%32 2 Barclays Jacobs Woods 100 Jacobs Hall Lane Lansdale Montgomery PA 19446 Multifamily Conventional 36,200,000 $157,391 5.6200%33 2 Wachovia The Overlook at St. Thomas Apartments 6800 Steeprun Road Louisville Jefferson KY 40241 Multifamily Conventional 35,962,199 $74,302 5.7200%35 2 Nomura Marquis at Caprock Canyon 4411 Spicewood Springs Austin Travis TX 78759 Multifamily Conventional 32,500,000 $96,726 5.7400%36 2 Wachovia Regent Apartments 2750 Millerville Road Baton Rouge East Baton Rouge LA 70816 Multifamily Conventional 32,000,000 $100,629 6.1300%38 2 Wachovia Colonial Grande at Promenade 2400 Central Parkway Montgomery Montgomery AL 36106 Multifamily Conventional 30,400,000 $79,167 5.7500%40 2 Nomura Wynn Palms Apartments 3756, 3800 & 3880 Wynn Road Las Vegas Clark NV 89103 Multifamily Conventional 29,100,000 $52,527 6.0000%41 2 Wachovia Main Street Village Apartments I&II 5504 Town Center Drive Granger St Joseph IN 46530 Multifamily Conventional 28,700,000 $71,750 5.9200%50 2 Wachovia University Crescent Student Apartments 4500 Burbank Drive Baton Rouge East Baton Rouge LA 70820 Multifamily Student Housing 24,150,000 $125,781 5.6000%52 2 Wachovia The Summit 1801 Monks Avenue Mankato Blue Earth MN 56001 Multifamily Student Housing 23,825,000 $124,089 5.6000%54 2 Wachovia University Oaks Student Housing 21 National Guard Road Columbia Richland SC 29201 Multifamily Student Housing 22,150,000 $123,056 5.6000%55 2 Wachovia Royal Saint Moritz Apartments 2050 Grayson Drive Grapevine Tarrant TX 76051 Multifamily Conventional 22,000,000 $65,476 5.6200%56 2 Wachovia Vineyard Springs Apartments 18200 Blanco Springs Road San Antonio Bexar TX 78258 Multifamily Conventional 21,825,000 $59,959 5.3100%59 2 Nomura Marquis at Carmel Commons Apartments 6818 Northbury Lane Charlotte Mecklenburg NC 28226 Multifamily Conventional 21,000,000 $67,308 5.7300%61 2 Wachovia The Depot Apartments 555 Elm Street Fort Worth Tarrant TX 76102 Multifamily Conventional 20,560,000 $97,905 5.8100%63 2 Barclays Oaks at Broad River 100 Riverchase Boulevard Beaufort Beaufort SC 29906 Multifamily Conventional 20,000,000 $80,645 5.7900%64 2 Wachovia Walker Ranch Apartments 14500 Blanco Road San Antonio Bexar TX 78216 Multifamily Conventional 20,000,000 $61,538 5.3600%69 1 Barclays Peters Pond RV Resort 185 Cotuit Road Sandwich Barnstable MA 02563 Mobile Home Park Mobile Home Park 18,000,000 $44,554 6.7000%74 2 Nomura Pinetree Park ROC 1333 NW 3rd Street Deerfield Beach Broward FL 33442 Mobile Home Park Mobile Home Park 16,800,000 $53,333 6.0000%75 2 Wachovia Vista Pointe at the Valley Apartments 701 Cowboys Parkway Irving Dallas TX 75063 Multifamily Conventional 16,480,000 $71,342 5.6600%78 2 Wachovia The Marquis at Quarry Apartments 384 Treeline Park San Antonio Bexar TX 78209 Multifamily Conventional 16,016,000 $71,500 5.8750%81 2 Barclays Deerpath On The Lake 10200 North Armenia Avenue Tampa Hillsborough FL 33612 Multifamily Conventional 15,150,000 $51,884 5.5900%85 2 Wachovia Crossing Place 301 Lippencott Street Knoxville Knox TN 37290 Multifamily Student Housing 14,950,000 $77,865 6.0000%87 2 Nomura Bremner Woods II Apartments 4501 Sprenkle Lane Richmond Henrico VA 23228 Multifamily Conventional 13,640,000 $67,861 5.7800%88 2 Wachovia Springfield Apartments 4600 University Drive Durham Durham NC 27707 Multifamily Conventional 13,575,000 $47,135 5.4000%91 2 Nomura Springhill 8030 East Lakeside Parkway Tucson Pima AZ 85730 Multifamily Conventional 13,295,000 $59,353 5.9400%92 2 Nomura Stoney Brook Apartments 1301 East Dogwood Drive Mebane Alamance County NC 27302 Multifamily Conventional 13,200,000 $68,750 6.1300%94 2 Nomura Valle West Tennis Club Apartments 13608 Pomerado Road Poway San Diego CA 92064 Multifamily Conventional 12,760,000 $99,688 5.6000%95 2 Nomura The Tower Apartments 2465 Shoreline Drive Alameda Alameda CA 94501 Multifamily Conventional 12,675,000 $166,776 5.8800%98 2 Nomura Belmont Parkway Apartments 4300 Lamplighter Court Richmond Chesterfield VA 23234 Multifamily Conventional 12,000,000 $59,701 5.9700%100 2 Nomura Casas Lindas 699 West Magee Road Tucson Pima AZ 85704 Multifamily Conventional 11,513,000 $79,951 5.9400%101 2 Wachovia Sterling University at the Junction 5050 Sam Houston Avenue Huntsville Walker TX 77340 Multifamily Student Housing 11,505,000 $71,906 6.0000%103 2 Nomura Quail Creek 1651 South Dobson Road Mesa Maricopa AZ 85202 Multifamily Conventional 11,160,000 $41,487 6.1800%104 2 Nomura Laurel Pointe Apartments 13607 Cordary Avenue Hawthorne Los Angeles CA 90250 Multifamily Conventional 11,155,000 $97,000 6.5900%105 2 Barclays Maple Village Apartments 2100 Maple Village Court Pell City Saint Clair AL 35128 Multifamily Conventional 10,825,000 $67,656 5.7200%106 2 Nomura Scripps Terrace Apartments 10940 Scripps Ranch Boulevard San Diego San Diego CA 92131 Multifamily Conventional 10,000,000 $149,254 6.3500%108 2 Nomura Rancho Vista Apartments 3663 South Valley View Boulevard Las Vegas Clark NV 89103 Multifamily Conventional 9,300,000 $55,357 5.9000%109 2 Wachovia Boulders Senior Living Apartments 3533 Willow Avenue White Bear Lake Ramsey MN 55110 Multifamily Independent Living 9,200,000 $98,925 5.6100%110 2 Wachovia Prospect Place Apartments 1024 Prospect Avenue Santa Rosa Sonoma CA 95409 Multifamily Conventional 9,000,000 $100,000 5.8900%112 2 Barclays SSK Applewood Pointe 2140 Spring Grove Lane Middletown Butler OH 45044 Mobile Home Park Mobile Home Park 8,648,000 $34,182 5.8600%113 2 Wachovia Artists in Residence Apartments 6161 & 6165 North Winthrop Avenue Chicago Cook IL 60660 Multifamily Conventional 8,640,000 $55,742 5.7200%114 2 Nomura Bayberry Place Townhomes 2300 Deewood Drive Columbus Franklin OH 43229 Multifamily Conventional 8,640,000 $29,189 5.7000%117 2 Barclays SSK Ashley Pointe 1115 Penile Road Louisville Jefferson KY 40272 Mobile Home Park Mobile Home Park 8,350,000 $25,380 5.8600%119 2 Nomura Sunpointe Apartments 7077 West McDowell Road Phoenix Maricopa AZ 85035 Multifamily Conventional 8,160,000 $53,684 6.0500%120 2 Wachovia Collegiate Suites I 1310 Henry Lane Blacksburg Montgomery VA 24060 Multifamily Student Housing 8,100,000 $103,846 5.7600%121 2 Wachovia Park West Apartments 357 Hillandale Road Greenville Greenville SC 29609 Multifamily Conventional 8,000,000 $22,284 5.6100%125 2 Nomura Wickatunk Village MHC 89 Village Road Morganville Monmouth NJ 7751 Mobile Home Park Mobile Home Park 7,500,000 $42,135 6.0000%128 2 Wachovia Wind Tree Apartments 2990 Trawood Drive El Paso El Paso TX 79936 Multifamily Conventional 7,140,000 $40,568 5.3700%132 2 Barclays SSK Heartland Pointe 113 Sioux Trail Elsmere Kenton KY 41018 Mobile Home Park Mobile Home Park 6,752,000 $33,261 5.8600%141 2 Nomura Mirasol Apartments 8750 East McDowell Road Scottsdale Maricopa AZ 85257 Multifamily Conventional 6,000,000 $48,000 5.8500%150 2 Wachovia Pear Tree Apartments 222 Bartlett Drive El Paso El Paso TX 79912 Multifamily Conventional 5,480,000 $42,154 5.2800%152 2 Wachovia Holly Glen Apartments 2800-2848 Holly Glen Drive Greenville Pitt NC 27834 Multifamily Conventional 5,369,409 $51,629 5.7700%156 1 Barclays Wine Country RV 2500 Airport Road Paso Robles San Luis Obispo CA 93446 Mobile Home Park Mobile Home Park 5,000,000 $30,120 6.0000%159 2 Nomura The Three Crowns Apartments 2020 Sanata Clara Avenue Alameda Alameda CA 94501 Multifamily Conventional 4,675,000 $137,500 5.8800%164 2 Nomura French Quarter Apartments 2211 West North Loop Boulevard Austin Travis TX 78756 Multifamily Conventional 4,398,000 $42,288 6.0200%166 2 Nomura Hillside Gardens 555 Greenbrier Drive Oceanside San Diego CA 92054 Multifamily Conventional 4,245,000 $96,477 5.6500%170 2 Nomura Billboard Lofts 320 West Ash Street San Diego San Diego CA 92101 Multifamily Conventional 3,800,000 $158,333 5.8700%173 2 Wachovia Redwood Terrace 9950 Redwood Street NW Coon Rapids Anoka MN 55433 Multifamily Independent Living 3,500,000 $64,815 5.7700%182 2 Nomura Mobile Gardens MHP 1901 North Glasscock Road Mission Hidalgo TX 78572 Mobile Home Park Mobile Home Park 2,730,000 $14,757 5.6800%187 2 Barclays Gas Lite Manor 500 North La Mesa Drive Sioux Falls Minnehaha SD 57107 Mobile Home Park Mobile Home Park 1,590,000 $19,875 6.1100%188 2 Nomura Saratoga Apartments 653 East Capitol Street, SE Washington District of Columbia DC 20003 Multifamily Conventional 1,520,544 $49,050 5.5800%189 2 Nomura Blueberry Ridge Mobile Village 15 Valley Road Wells York ME 4090 Mobile Home Park Mobile Home Park 1,373,683 $25,919 6.2000%
(1) In determining the average rent for units in a multifamily property having a given number of bedrooms, the rent used is the "Contract Rent", defined as the total rent that is, or is anticipated to be, specified in the lease or other rental contract as payable by the tenant to the property owner for the rental of a dwelling unit, including fees or charges for management and maintenance services. In determining Contract Rent for each unit, the following rules have been applied: (i) the average Contract Rent for each unit type was based upon a rent roll certified by the owner of the property, or was computed by the appraiser of the mortgaged property based upon a borrower-certified rent roll and (ii) rent concessions were not considered (Contract Rent was not reduced by any rent concessions delineated in the borrower rent-roll).
Mortgage Loan
Number
Loan Group Number
Loan Seller
Property State
Property Zip Code
General Property Type
Cut-Off Date Loan Balance
($)Cut-Off Date Loan
Amount Per (Unit) ($)Mortgage
Rate
Peter Cooper Village & Stuyvesant Town Pool (2)
(2) The Peter Cooper Village & Stuyvesant Town Loan (loan number 5) is part of a split loan structure that includes one or more pari passu companion loans that are not included in the Trust Fund. With respect to this Mortgage Loan, unless otherwise specified, the calculations of LTV Ratios, DSC Ratio and Cut-Off Date Balance per unit are based upon the aggregate indebtedness of or debt service on, as applicable, the related Mortgage Loan and the related

Number of Units Elevators
11/17/06 1.74x 1.73 55.56% 120 IO 11,227 5,740 Various 4,976 Various 472 Various 2 Various 37 Various 98.3% E,G Y $481,725,392 58,746 4,531 1,566 3,725 1,809 452 1,949 1 4,950 37 2,574 98.5% E,G Y 5.012,459 1,435 2,518 946 3,068 71 4,120 1 4,950 6 5,7546,287 3,096 1,125 2,779 1,380 381 1,544 31 1,9582,481 1,209 1,771 1,251 2,014 20 2,354 1 2,705 97.7% E,G Y 5.02730 433 2,825 294 3,829 3 6,520
1,751 776 1,183 957 1,457 17 1,619 1 2,70504/10/07 1.42x 1.42 71.54% 60 IO Various Various Various Various Various Various Various Various Various Various Various 98.7% Various Various $14,278,954 11
60 12 1,148 48 1,370 100.0% None Y 11.0162 62 992 100.0% None Y 11.0216 10 1,091 6 1,340 100.0% None Y 11.0337 32 1,098 5 1,565 100.0% None Y 11.0428 12 1,033 15 1,362 1 1,663 100.0% None Y 11.0530 19 1,217 10 1,461 1 1,795 96.7% None Y 11.0616 1 200 7 2,536 8 2,726 93.8% None Y 11.0743 42 945 1 1,025 97.7% None Y 11.0834 16 919 16 1,208 2 1,342 100.0% None Y 11.0929 23 1,066 4 1,431 2 1,588 100.0% E Y 11.1029 29 1,051 100.0% None Y 11.1137 28 743 9 882 91.9% None Y 11.1228 9 754 17 1,262 2 943 96.4% None Y 11.1315 3 1,029 12 1,410 93.3% None N 11.1412 7 1,663 5 1,763 100.0% E Y 11.1512 5 1,202 7 1,880 100.0% None Y 11.1619 7 842 10 1,312 2 1,191 100.0% None Y 11.1721 20 920 1 1,000 100.0% None Y 11.1823 20 825 3 1,217 100.0% None Y 11.2012 7 860 5 1,084 100.0% None N 11.2118 9 670 4 772 5 1,372 100.0% None N 11.221 1 3,000 100.0% None N 11.238 6 1,110 2 1,588 100.0% None N 11.2414 5 607 9 899 100.0% None N 11.251 1 3,000 100.0% None N 11.277 1 995 6 1,017 100.0% None N 11.281 1 1,205 100.0% None N 11.29
02/21/07 1.23x 1.20 81.67% 120 IO 687 280 1,039 280 1,269 127 1,667 93.4% E,W,S Y $10,268,634 1404/12/07 1.34x 1.32 69.79% 120 IO 241 30 2,369 181 3,133 30 3,885 99.6% E Y $9,138,981 1604/03/07 1.21x 1.18 79.53% 120 IO 432 166 773 216 910 50 1,050 98.4% E,S,W N $4,552,212 2202/28/07 1.40x 1.36 80.00% 120 IO 361 139 893 201 1,128 21 1,477 87.8% E Y $5,006,186 2403/29/07 1.05x 1.03 68.05% 120 360 230 60 1,350 140 1,717 30 1,975 94.8% E N $4,360,548 3203/14/07 1.24x 1.20 78.01% 120 360 484 160 761 200 906 124 1,232 92.8% E,G,W,S Y $5,300,941 3303/30/07 1.30x 1.27 74.71% 84 IO 336 172 1,052 164 1,324 2 92.9% E,G,W,S,T N $4,245,015 3501/31/07 1.43x 1.40 79.60% 60 IO 318 150 924 168 1,189 55.0% E,G,W,S,T N $4,037,262 3602/14/07 1.27x 1.22 77.95% 120 360 384 104 785 192 920 88 1,031 84.4% E,W N $4,040,592 3803/29/07 1.43x 1.36 68.31% 60 IO 554 368 601 183 768 3 875 91.3% E,W,S,T N $4,549,303 4002/01/07 1.44x 1.40 79.72% 60 IO 400 184 789 188 997 28 1,522 91.5% E,G N $4,687,469 4102/27/07 1.44x 1.38 74.31% 120 IO 192 24 1,232 108 1,473 60 1,744 97.1% E N $3,087,624 5002/28/07 1.42x 1.36 80.49% 120 IO 192 48 1,120 144 1,640 97.8% None N $3,499,039 5202/28/07 1.40x 1.33 77.86% 120 IO 180 60 1,440 120 1,833 98.2% E,W,S N $3,566,950 5403/30/07 1.27x 1.21 80.00% 120 IO 336 152 765 176 972 8 1,333 93.2% E,W,S,T N $3,102,658 5503/20/07 1.25x 1.20 75.00% 120 360 364 176 777 176 1,090 12 1,480 92.9% E,W,S,T N $3,604,172 5603/29/07 1.47x 1.42 73.43% 84 IO 312 152 783 130 955 30 1,367 2 98.4% E,G,W,S N $3,096,863 5903/21/07 1.39x 1.36 79.89% 60 IO 210 42 740 63 912 105 1,279 93.8% E Y $2,513,310 6102/26/07 1.41x 1.36 78.43% 60 IO 248 72 753 120 857 56 965 94.4% E, S, W N $2,645,710 6304/12/07 1.88x 1.82 63.29% 120 IO 325 198 798 109 1,154 18 1,476 95.7% E,W,S N $3,621,767 6402/09/07 1.45x 1.44 77.19% 60 360 404 95.0% 404 524.8 $2,829,848 6902/28/07 1.41x 1.39 80.00% 120 IO 315 80.6% 315 531 40 $212,625 $2,214,450 7403/15/07 1.45x 1.38 82.40% 120 IO 231 119 891 88 1,203 24 1,478 87.9% E,G,W,T N $2,562,903 7503/30/07 1.53x 1.50 64.71% 120 IO 224 88 835 88 1,135 48 1,400 96.4% E N $2,662,378 7803/29/07 1.24x 1.17 68.86% 120 360 292 24 608 100 732 134 871 34 1,046 91.4% E,W,S N $2,644,520 8103/22/07 1.76x 1.70 64.72% 120 IO 192 24 940 168 1,480 95.7% E,W N $3,083,533 8503/29/07 1.29x 1.24 78.44% 120 IO 201 201 674 97.0% E,W,S N $1,581,515 8703/29/07 1.38x 1.31 74.59% 120 360 288 196 665 92 809 96.5% E,W,S N $2,113,088 8802/28/07 1.31x 1.24 72.65% 120 IO 224 80 591 144 687 1 94.6% UAV N $1,764,510 9102/26/07 1.50x 1.46 72.13% 120 IO 192 64 701 64 833 64 933 3 99.0% E N $1,794,752 9203/30/07 1.32x 1.28 79.25% 120 IO 128 2 825 68 930 56 1,213 2 1,425 93.8% E,G N $1,597,212 9403/30/07 1.32x 1.29 66.36% 120 IO 76 20 1,327 56 1,701 98.7% E,W,S,T Y $1,513,902 9502/28/07 1.35x 1.28 78.90% 120 IO 201 41 552 119 660 41 763 97.5% E,W,S N $1,540,665 9802/28/07 1.30x 1.25 78.32% 120 IO 144 40 697 88 827 16 963 95.8% E,G,W,S N $1,443,116 10003/29/07 1.65x 1.60 64.63% 120 IO 160 32 550 64 980 64 1,610 95.4% E,W Y $2,236,922 10102/28/07 1.55x 1.48 63.41% 60 IO 269 66 488 139 589 62 682 2 850 84.4% E,G,T N $1,921,381 10302/14/07 1.10x 1.10 79.68% 120 360 115 24 877 82 983 8 1,238 1 1,465 1 93.9% W,S N $1,503,669 10403/22/07 1.14x 1.10 79.60% 120 360 160 32 650 96 785 32 1,000 84.4% E,W,S N $1,423,090 10503/20/07 1.13x 1.10 75.47% 60 IO 67 4 963 63 1,181 95.5% E,G,W,S,T N $1,120,089 10603/29/07 1.47x 1.39 67.88% 60 IO 168 112 649 56 808 94.6% W,S,T N $1,471,700 10804/03/07 1.47x 1.43 79.83% 120 IO 93 58 981 35 1,493 93.5% E Y $1,201,000 10903/30/07 1.40x 1.36 72.58% 120 IO 90 52 939 38 1,158 94.4% E,W,S,T N $1,111,050 11003/06/07 1.17x 1.19 74.44% 120 360 253 91.3% 253 285 $888,248 11203/29/07 1.28x 1.20 80.00% 120 IO 155 105 553 50 681 98.7% None Y $1,133,048 11304/10/07 1.40x 1.27 80.00% 120 360 296 296 582 2 90.2% E,G N $1,817,824 11403/06/07 1.12x 1.19 74.44% 120 360 329 86.0% 329 241 $836,507 11701/17/07 1.33x 1.26 80.00% 120 IO 152 64 581 88 684 94.7% E N $1,169,034 11903/30/07 1.28x 1.20 77.14% 120 360 78 18 773 60 1,343 100.0% E,G,W,S,T N $1,093,072 12002/02/07 1.63x 1.43 78.82% 120 IO 359 175 404 184 546 90.3% E,W,S N $1,802,480 12103/30/07 1.24x 1.22 79.79% 120 IO 178 100.0% 178 460 $966,935 12503/28/07 1.51x 1.40 79.78% 120 IO 176 88 545 88 710 94.3% E N $1,268,570 12803/06/07 1.10x 1.19 74.44% 120 360 203 97.5% 203 282 $682,268 13203/09/07 1.31x 1.24 68.18% 120 360 125 1 500 50 575 72 664 2 779 94.4% E,G,W,S,T N $980,499 14103/30/07 1.74x 1.63 78.57% 120 IO 130 6 460 29 568 59 735 36 897 91.5% E,W,S N $1,090,426 15003/19/07 1.27x 1.20 79.25% 120 360 104 48 588 56 688 100.0% E N $741,300 1524/26/2007 1.50x 1.48 58.75% 120 360 166 49.0% 166 1034.17 $1,284,274 15603/30/07 1.33x 1.30 73.05% 120 IO 34 3 1,118 31 1,381 97.1% E,W,S,T Y $575,206 15904/12/07 1.33x 1.24 78.54% 60 360 104 55 564 49 838 98.1% E,W N $865,997 16403/30/07 1.38x 1.34 75.80% 120 IO 44 32 920 12 1,046 1 93.2% E,G N $520,735 16604/20/07 1.29x 1.26 76.00% 120 IO 24 24 1,478 100.0% E N $394,827 17003/08/07 1.20x 1.15 79.55% 120 360 54 14 760 40 870 96.3% E Y $540,778 17304/20/07 1.28x 1.24 79.71% 84 360 185 100.0% 185 215 3 $7,740 $482,804 18203/27/07 1.12x 1.31 57.39% 60 360 80 86.3% 80 265.72 $226,200 18703/02/07 1.68x 1.60 61.81% 120 360 31 17 800 9 900 5 1,425 96.8% E,G N $314,675 18804/04/07 1.33x 1.30 76.32% 60 360 53 1 96.2% 53 290 $181,260 189
(1) In determining the average rent for units in a multifamily property having a given number of bedrooms, the rent used is the "Contract Rent", defined as the total rent that is, or is anticipated to be, specified in the lease or other rental contract as payable by the tenant to the property owner for the rental of a dwelling unit, including fees or charges for management and maintenance services. In determining Contract Rent for each unit, the following rules have been applied: (i) the average Contract Rent for each unit type was based upon a rent roll certified by the owner of the property, or was computed by the appraiser of the mortgaged property based upon a borrower-certified rent roll and (ii) rent concessions were not considered (Contract Rent was not reduced by any rent concessions delineated in the borrower rent-roll).
Origination Date
UW NOI DSCR (x)
UW NCF DSCR (x)
Cut-Off Date LTV Ratio
Original Term to Maturity or ARD (Mos.)
Original Amort Term
(Mos.)Number of
Studio Units
Average Contract
Rent - Studio Units(1)
Number of 1 BR Units
Average Contract Rent - 1 BR Units(1)
Number of 2 BR Units
Average Contract Rent - 2 BR Units(1)
Number of 3 BR Units
Average Contract Rent - 3 BR Units(1)
Number of 4 BR Units
Average Contract Rent - 4 BR Units(1)
Number of 4+ BR Units
Average Contract Rent
- 4+ BR Units(1)
Number of Under
Renovation, Model or Rental
Office UnitsOccupancy
RateUtilities
Tenant PaysTotal Number
of Pads
Average Contract Rent per Pads(1)
Number of RV Sites
Total Gross Income from
RV SitesUW Total Revenues
Mortgage Loan
Number
companion loans that are not included in the Trust Fund. With respect to this Mortgage Loan, unless otherwise specified, the calculations of LTV Ratios, DSC Ratio and Cut-Off Date Balance per unit are based upon the aggregate indebtedness of or debt service on, as applicable, the related Mortgage Loan and the related pari passu companion loans, but not any related future pari passu companion loan.

WACHOVIA BANK COMMERCIAL MORTGAGE TRUST SERIES 2007-C31
ANNEX A-3 RESERVE ACCOUNT INFORMATION
Property Name General Property Type Specific Property Type Monthly Insurance Escrow Annual Deposit to Replacement Reserves Initial TI/LC Escrow
1 1 Office CBD 32,170 215,678 57,638 12 1 Beacon D.C. & Seattle Pool Various Various 18,200,095 2
2.01 Market Square Office CBD 2.012.02 Polk & Taylor Buildings Office Suburban 2.022.03 Wells Fargo Center Office CBD 2.032.04 One, Two & Three Lafayette Centre Office CBD 2.042.05 Booz Allen Complex Office Suburban 2.052.06 Key Center Office CBD 2.062.07 Sunset North Office Suburban 2.072.08 City Center Bellevue Office CBD 2.082.09 Plaza Center and US Bank Tower Office CBD 2.092.10 1616 Fort Myer Drive Office Suburban 2.102.11 American Center Office Suburban 2.112.12 Eastgate Office Park Office Suburban 2.122.13 Liberty Place Office CBD 2.132.14 Lincoln Executive Center Buildings I, II, III, A&B Office Suburban 2.142.15 11111 Sunset Hills Road Office Suburban 2.152.16 Army and Navy Club Building Office CBD 2.162.17 Plaza East Office CBD 2.172.18 Reston Town Center Mixed Use Office/Retail 2.182.19 1300 North Seventeenth Street Office Suburban 2.192.20 Washington Mutual Tower Office CBD 2.20
3 1 666 Fifth Avenue Office CBD 1,800,000 232,443 100,000,000 (2) 34 1 Mall at Rockingham Park Retail Anchored 45 2 Peter Cooper Village & Stuyvesant Town Pool Multifamily Conventional 3,539,035 493,599 2,808,000 5
5.01 Stuyvesant Town Multifamily Conventional 5.015.02 Peter Cooper Village Multifamily Conventional 5.02
6 1 Hyatt Regency Grand Cypress Hospitality Full Service 6
7 1 Hospitality Full Service 177,898 4.0% of Yearly Gross Revenue 171,750 78 1 Ashford Hospitality Pool 3 Hospitality Limited Service 110,321 4.0% of Yearly Gross Revenue 4,375 8
8.01 Courtyard - San Francisco, CA Hospitality Limited Service 8.018.02 Courtyard - Seattle, WA Hospitality Limited Service 8.02
9 1 Ashford Hospitality Pool 2 Hospitality Various 126,278 4.0% of Yearly Gross Revenue 119,250 99.01 Residence Inn - Phoenix , AZ Hospitality Extended Stay 9.019.02 SpringHill Suites - Hawthorne, CA Hospitality Limited Service 9.029.03 Towne Place Suites - Hawthorne, CA Hospitality Extended Stay 9.039.04 SpringHill Suites - Plymouth Meeting, PA Hospitality Limited Service 9.049.05 SpringHill Suites - Glen Allen, VA Hospitality Limited Service 9.059.06 Residence Inn - Plano, TX Hospitality Extended Stay 9.069.07 Residence Inn - Newark, CA Hospitality Extended Stay 9.07
10 1 Mixed Use Office/Retail 53,478 11,243 55,586 2,000,000 1011 1 Lembi Pool Various Various 71,438 31,121 73,594 11
11.01 300 Buchanan Street Multifamily Conventional 11.0111.02 536 Leavenworth Street Multifamily Conventional 11.0211.03 210-218 Church Street Multifamily Conventional 11.0311.04 1405 Franklin Street Multifamily Conventional 11.0411.05 610 Leavenworth Street Multifamily Conventional 11.0511.06 350 Judah Street Multifamily Conventional 11.0611.07 2080 Gough Street Multifamily Conventional 11.0711.08 455 Hyde Street Multifamily Conventional 11.0811.09 1035 Sutter Street Multifamily Conventional 11.0911.10 969 Bush Street Multifamily Conventional 11.1011.11 345 Fulton Street Multifamily Conventional 11.1111.12 516 Ellis Street Multifamily Conventional 11.1211.13 721 Geary Street Multifamily Conventional 11.1311.14 11 Dolores Street Multifamily Conventional 11.1411.15 2335 Larkin Street Multifamily Conventional 11.1511.16 3875 18th Street Multifamily Conventional 11.1611.17 1025 Sutter Street Multifamily Conventional 11.1711.18 828 Jones Street Multifamily Conventional 11.1811.19 240 Church Street Retail Unanchored 11.1911.20 735 O'Farrell Street Multifamily Conventional 11.2011.21 2337-2339 Market Street Multifamily Conventional 11.2111.22 635 Ellis Street Multifamily Conventional 11.2211.23 215-219 Church Street Multifamily Conventional 11.2311.24 1385 Kansas Street Multifamily Conventional 11.2411.25 747 Ellis Street Multifamily Conventional 11.2511.26 631 Larkin Street Retail Unanchored 11.2611.27 601 Larkin Street Multifamily Conventional 11.2711.28 1520-1524 Geneva Avenue Multifamily Conventional 11.2811.29 1199 DeHaro Street Multifamily Conventional 11.29
12 1 Ashford Hospitality Pool 1 Hospitality Limited Service 147,658 4.0% of Yearly Gross Revenue 24,063 1212.01 Courtyard - Basking Ridge, NJ Hospitality Limited Service 12.0112.02 Courtyard - Oakland Airport, CA Hospitality Limited Service 12.0212.03 Courtyard - Scottsdale, AZ Hospitality Limited Service 12.0312.04 Courtyard - Plano, TX Hospitality Limited Service 12.0412.05 Courtyard - Newark, CA Hospitality Limited Service 12.05
13 1 Osprey Pool Office CBD 109,270 167,208 2,863,657 1313.01 First Citizens Plaza Office CBD 13.0113.02 Sarasota City Center Office CBD 13.02
14 2 Multifamily Conventional 53,193 11,667 59,082 1415 1 Ponte Vedra Inn & Club Hospitality Full Service 4.0% of Yearly Gross Revenue 1516 2 Clinton Manor Multifamily Conventional 106,895 60,240 26,875 16
17 1 Retail Anchored 20,925 27,333 17,302 870,000 1718 1 635 Madison Avenue Office Medical 169,332 28,765 (2) 1819 1 Cherry Hill Corporate Center Pool Various Various 60,972 8,964 174,463 284,819 1,050,000 19
19.01 24-42 Cherry Hill Drive Mixed Use Office/R&D 19.0119.02 71 Cherry Hill Drive Mixed Use Office/R&D 19.0219.03 35 Cherry Hill Drive Mixed Use Office/R&D 19.0319.04 37 Cherry Hill Drive Mixed Use Office/R&D 19.0419.05 33 Cherry Hill Drive Mixed Use Office/R&D 19.0519.06 54 Cherry Hill Drive Mixed Use Office/R&D 19.0619.07 72 Cherry Hill Drive Office Suburban 19.0719.08 66 Cherry Hill Drive Office Suburban 19.0819.09 5 Cherry Hill Drive Office Suburban 19.09
20 1 First Colony Commons Retail Anchored 55,313 11,859 86,125 39,093 100,000 2021 1 611 West 6th Street Office CBD 41,000 41,661 80,400 (2) 2122 2 Addison at Swift Creek Apartments Multifamily Conventional 27,152 5,288 86,400 2223 1 Corporate Plaza Office CBD 18,857 5,452 27,780 (2) 2324 2 Park Place Apartments Multifamily Conventional 36,599 12,172 2425 1 Central Texas Marketplace Retail Anchored 2526 1 East Gate Square Phase II Retail Anchored 55,913 26
27 1 Hospitality Full Service 41,453 15,419 668,354 2728 1 FMC Technologies Industrial Flex 2829 1 1020 19th Street Office CBD 47,549 32,201 7,500 450,000 2930 1 1920 L Street Office CBD 43,617 20,263 35,000 250,000 30
31 1 Office Medical 26,591 2,960 36,992 13,750 1,750,000 3132 2 Jacobs Woods Multifamily Conventional 31,942 6,651 57,504 98,469 3233 2 The Overlook at St. Thomas Apartments Multifamily Conventional 3334 1 Toll Brothers Corporate Headquarters Office Suburban 3435 2 Marquis at Caprock Canyon Multifamily Conventional 61,687 67,200 29,063 3536 2 Regent Apartments Multifamily Conventional 19,500 9,667 63,600 3637 1 1900 L Street Office CBD 27,608 26,099 550,000 3738 2 Colonial Grande at Promenade Multifamily Conventional 18,340 9,087 96,000 3839 1 Whittier Marketplace Retail Anchored 27,408 4,425 17,820 3940 2 Wynn Palms Apartments Multifamily Conventional 17,772 7,951 118,556 4041 2 Main Street Village Apartments I&II Multifamily Conventional 55,184 7,276 80,000 4142 1 East Gate Square Phase IV Retail Anchored 36,599 4243 1 East Gate Square Phase V Retail Anchored 32,872 43
44 1 Hospitality Full Service 28,666 10,715 474,617 85,938 4445 1 Whittier Center Office Suburban 28,569 2,634 21,432 (2) 45
46 1 Office Suburban 20,691 3,869 55,266 134,200 3,500,000 4647 1 35 Nutmeg Drive Office Suburban 40,768 64,091 900,000 47
48 1 Office Suburban 26,094 3,774 28,918 3,000,000 (2) 4849 1 THF-Fairview Marketplace Retail Anchored 4950 2 University Crescent Student Apartments Multifamily Student Housing 10,916 2,852 88,740 50
51 1 Office Suburban 30,795 3,164 31,371 200,000 5152 2 The Summit Multifamily Student Housing 20,488 4,734 90,048 28,125 5253 1 Beachwalk Shopping Center Mixed Use Office/Retail 9,370 1,758 14,276 150,000 (2) 5354 2 University Oaks Student Housing Multifamily Student Housing 39,534 4,498 85,800 5455 2 Royal Saint Moritz Apartments Multifamily Conventional 48,749 6,720 84,000 20,000 5556 2 Vineyard Springs Apartments Multifamily Conventional 55,822 3,474 82,264 5657 1 The Phillips Building Office CBD 17,691 789 36,012 12,125 (2) 5758 1 200 Montague Street Office CBD 19,601 9,067 250,000 5859 2 Marquis at Carmel Commons Apartments Multifamily Conventional 25,244 3,197 62,400 5960 1 Courthouse Marketplace Retail Center Retail Anchored 10,855 1,665 6061 2 The Depot Apartments Multifamily Conventional 22,253 42,000 6162 1 200 South Tryon Office CBD 23,009 2,819 6263 2 Oaks at Broad River Multifamily Conventional 14,740 6,200 49,600 9,625 6364 2 Walker Ranch Apartments Multifamily Conventional 53,818 2,943 65,000 6465 1 14700 Lee Road Office Suburban 22,000 6566 1 East Gate Square Phase III Retail Anchored 31,123 6667 1 St. Louis County Office Pool Office Various 37,522 4,279 45,726 38,940 1,257,000 (2) 67
67.01 9735 Landmark Parkway Drive Office Suburban 38,940 67.0167.02 Laumeier III Office Suburban 67.0267.03 9701 Landmark Parkway Drive Office Medical 67.0367.04 9717 Landmark Parkway Drive Office Suburban 67.04
68 1 Donald Ross Village Mixed Use Retail/Office 6,340 6869 1 Peters Pond RV Resort Mobile Home Park Mobile Home Park 4,223 2,216 20,220 6970 1 5601 Cushing Parkway Retail Single Tenant 7071 1 901 7th Street Office CBD 18,954 457 5,885 (2) 7172 1 1700 Higgins Center Office Suburban 60,000 7,212 27,419 36,844 11,667 (2) 7273 1 Shop-Rite BayShore Retail Single Tenant 15,593 (2) 7374 2 Pinetree Park ROC Mobile Home Park Mobile Home Park 18,104 6,329 15,175 74
75 2 Multifamily Conventional 32,635 4,889 61,908 7576 1 Lexington Green Building I and II Office Suburban 13,379 2,432 22,607 300,000 7677 1 National Archives Building Industrial Warehouse 13,498 1,655 21,739 7778 2 The Marquis at Quarry Apartments Multifamily Conventional 38,348 3,666 33,648 7879 1 Sherwood Plaza Office Suburban 79
Mortgage Loan
Number
Loan Group Number
Monthly Tax Escrow
Initial Deposit to Capital Improvements Reserve
Ongoing TI/LC Footnote
Mortgage Loan Number
Five Times Square(1)
Boston Marriott Long Wharf(3)
Los Angeles International Jewelry Center (4)
City Heights Apartment Homes(5)
Southern Palm Crossing Shopping Center (6)
Saint Louis Marriott West(7)
Scottsdale Medical Office(8)
Doubletree Hotel - Tucson, AZ(9)
Durham Office(10)
Parkway 400(11)
One & Two Decatur Town Center(12)
Vista Pointe at the Valley Apartments(13)
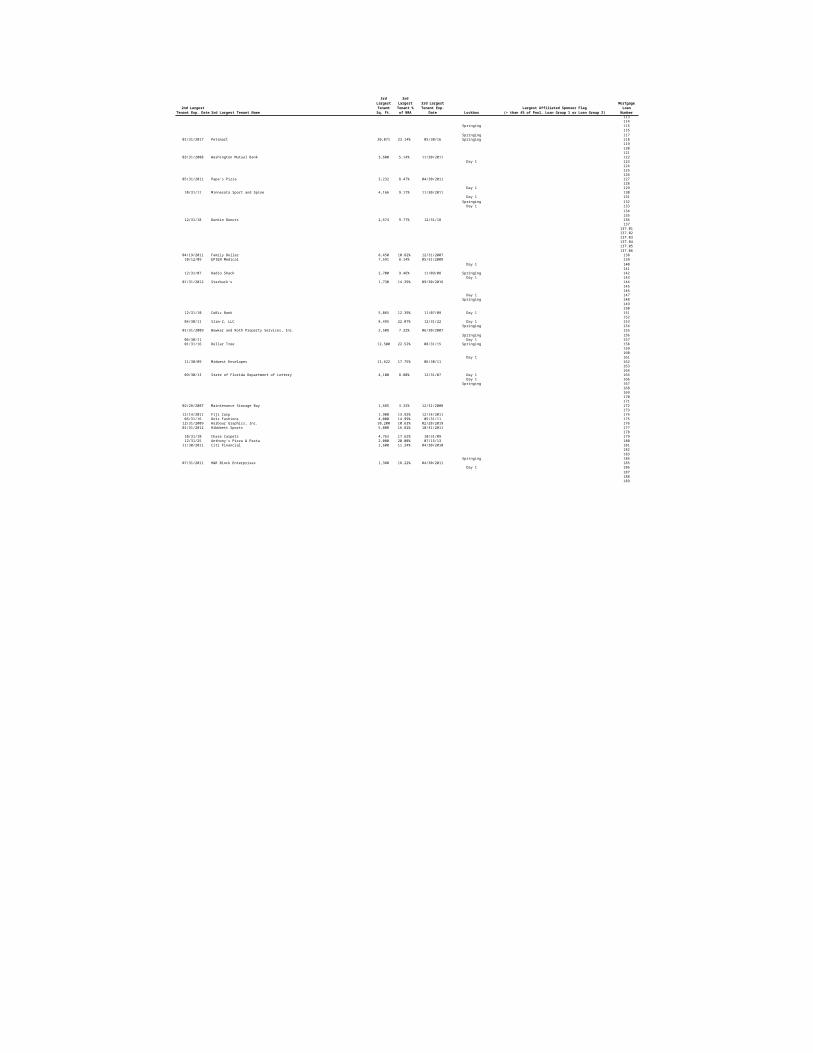
WACHOVIA BANK COMMERCIAL MORTGAGE TRUST SERIES 2007-C31
ANNEX A-3 RESERVE ACCOUNT INFORMATION
Property Name General Property Type Specific Property Type Monthly Insurance Escrow Annual Deposit to Replacement Reserves Initial TI/LC Escrow
Mortgage Loan
Number
Loan Group Number
Monthly Tax Escrow
Initial Deposit to Capital Improvements Reserve
Ongoing TI/LC Footnote
Mortgage Loan Number
80 1 801 West Easy Street Industrial Warehouse 8081 2 Deerpath On The Lake Multifamily Conventional 28,763 18,200 73,008 124,775 81
82 1 Retail Anchored 10,064 4,074 13,552 187,873 8283 1 Residence Inn - Charleston, SC Hospitality Extended Stay 9,284 9,757 215,694 8384 1 15 Broad Street Office CBD 21,656 2,852 12,742 (2) 8485 2 Crossing Place Multifamily Student Housing 22,675 4,753 57,600 85
86 1 Hospitality Full Service 25,803 2,999 211,242 8687 2 Bremner Woods II Apartments Multifamily Conventional 7,969 2,706 40,200 8788 2 Springfield Apartments Multifamily Conventional 14,882 2,573 64,800 8889 1 Oakton Corporate Center Office Suburban 8990 1 Courtyard Matthews & Rock Hill Pool Hospitality Limited Service 10,536 10,978 262,357 90
90.01 Courtyard - Matthews, NC Hospitality Limited Service 90.0190.02 Courtyard - Rock Hill, SC Hospitality Limited Service 90.02
91 2 Springhill Multifamily Conventional 9,390 2,335 56,000 313 9192 2 Stoney Brook Apartments Multifamily Conventional 8,961 5,590 38,400 9293 1 East Gate Square Phase VI Retail Shadow Anchored 11,963 9394 2 Valle West Tennis Club Apartments Multifamily Conventional 14,944 1,305 32,000 36,113 9495 2 The Tower Apartments Multifamily Conventional 12,183 2,029 19,000 4,375 9596 1 Capital One Data Center Industrial Flex 9697 1 Wilmington Courthouse Parking Garage Special Purpose Parking Garage 29,078 9798 2 Belmont Parkway Apartments Multifamily Conventional 7,071 1,492 40,200 4,625 9899 1 Cypress Business Center Office Suburban 9,691 6,506 12,176 200,000 99
100 2 Casas Lindas Multifamily Conventional 8,452 1,837 36,000 100101 2 Sterling University at the Junction Multifamily Student Housing 4,500 3,130 40,584 101102 1 Battleground Plaza Retail Anchored 9,896 3,015 21,844 32,275 102
103 2 Multifamily Conventional 6,343 3,152 66,174 4,375 103104 2 Laurel Pointe Apartments Multifamily Conventional 11,908 2,791 104105 2 Maple Village Apartments Multifamily Conventional 6,720 3,438 32,004 105
106 2 Multifamily Conventional 5,735 1,858 14,740 106
107 1 Office Suburban 710,000 225,000 107108 2 Rancho Vista Apartments Multifamily Conventional 5,814 3,453 34,776 108
109 2 Multifamily Independent Living 8,428 2,948 46,500 109110 2 Prospect Place Apartments Multifamily Conventional 6,975 2,121 16,830 110111 1 Winchester Court Retail Anchored 26,156 36,418 20,400 925,000 111112 2 SSK Applewood Pointe Mobile Home Park Mobile Home Park 5,834 590 10,080 625 112113 2 Artists in Residence Apartments Multifamily Conventional 9,913 3,648 35,495 113114 2 Bayberry Place Townhomes Multifamily Conventional 16,748 5,211 74,000 836,250 114115 1 Molly Gibson Lodge Hospitality Limited Service 4,260 2,392 90,720 115116 1 Tyvola Center Office Suburban 8,274 1,134 5,200 116117 2 SSK Ashley Pointe Mobile Home Park Mobile Home Park 4,234 1,309 13,200 625 117118 1 Victoria Crossing Retail Anchored 118119 2 Sunpointe Apartments Multifamily Conventional 5,419 3,552 38,012 104,531 119120 2 Collegiate Suites I Multifamily Student Housing 5,460 2,376 45,708 120121 2 Park West Apartments Multifamily Conventional 12,040 89,750 17,500 121122 1 Publix at Bayside Lakes Retail Anchored 11,949 122123 1 Evergreen Distribution Center Industrial Distribution 6,562 1,456 22,650 340,000 123
124 1 Hospitality Limited Service 1,260 1,455 82,665 124125 2 Wickatunk Village MHC Mobile Home Park Mobile Home Park 9,366 1,517 8,900 125126 1 Holiday Inn - Rockford, IL Hospitality Full Service 19,673 4,469 161,600 77,500 126127 1 Berwick Marketplace Retail Shadow Anchored 4,008 127
128 2 Multifamily Conventional 9,827 3,319 44,000 128129 1 Gander Mountain - Cicero Retail Single Tenant 687 9,840 129130 1 Burnsville Medical Center Office Medical 14,495 655 12,261 (2) 130131 1 52-15 Flushing Ave Industrial Warehouse 9,751 1,280 6,504 131132 2 SSK Heartland Pointe Mobile Home Park Mobile Home Park 3,325 1,946 8,124 625 132133 1 1603 North 35th Street Industrial Warehouse 27,456 (2) 133134 1 Storage USA Self Storage Self Storage 8,475 1,120 6,138 134135 1 425 Meadowlands Parkway Land Office 135136 1 CVS (Mixed Use Facility) Mixed Use Retail/Office 3,069 993 2,760 136
137 1 Industrial Distribution 8,468 10,256 79,908 200,000 137.00137.01 1505 & 1507 Telegraph Road Industrial Distribution 137.01137.02 1400 James Street Industrial Distribution 137.02137.03 52 W.L. Runnels Drive Industrial Distribution 137.03137.04 1700 A. Craft Highway Industrial Distribution 137.04137.05 201 Callahan Road Industrial Distribution 137.05137.06 200 Callahan Road Industrial Distribution 137.06
138 1 Wendover Plaza Retail Anchored 5,768 1,019 7,810 55,316 138139 1 Parkway Place Industrial Office/Showroom 15,418 932 139140 1 Country Inn & Suites - Appleton, WI Hospitality Limited Service 6,681 839 92,593 10,625 140141 2 Mirasol Apartments Multifamily Conventional 3,761 1,529 31,250 27,188 141142 1 Lyon's Station Retail Unanchored 4,335 600 75,000 (2) 142143 1 Holiday Inn Express - Sebring, FL Hospitality Limited Service 6,878 3,306 81,000 143144 1 Sweetwater Shopping Center Retail Unanchored 2,514 144145 1 Orlando ICE Building Industrial Flex 263 4,590 2,208 (2) 145146 1 Extra Space Storage - San Francisco, CA Self Storage Self Storage 146147 1 Wingate Cool Springs Hospitality Limited Service 4,624 1,548 79,104 147148 1 FBI Building - Nashville, TN Office Suburban 6,115 1,218 3,086 (2) 148
149 1 Hospitality Limited Service 8,358 1,450 76,930 149
150 2 Multifamily Conventional 8,498 2,356 33,280 32,616 150151 1 400 Centennial Parkway Office Suburban 9,113 852 8,174 (2) 151152 2 Holly Glen Apartments Multifamily Conventional 3,991 1,785 26,000 152153 1 Center of Dover Retail Anchored 2,186 1,025 7,230 7,466 (2) 153154 1 Best Buy - Kohler, WI Retail Single Tenant 332 154155 1 Blackhawk Office Building Office Suburban 4,359 535 14,388 67,673 (2) 155156 1 Wine Country RV Mobile Home Park Mobile Home Park 2,544 976 8,304 156157 1 Ridgewood Industrial Industrial Flex 1,863 1,853 6,276 179,100 (2) 157158 1 Mountain View Shopping Center Phase II Retail Anchored 158159 2 The Three Crowns Apartments Multifamily Conventional 3,384 812 8,750 3,125 159160 1 Hawthorn Suites - Austin, TX Hospitality Limited Service 7,237 2,567 63,424 118,603 160161 1 Country Inn & Suites - Monona, WI Hospitality Limited Service 7,196 2,417 86,128 161162 1 2580 Diehl Road Industrial Warehouse 3,380 301 6,548 162163 1 Extra Space Storage - Carson, CA Self Storage Self Storage 163164 2 French Quarter Apartments Multifamily Conventional 8,124 2,275 26,000 164165 1 Metro Gardens Office Park Office Suburban 7,497 6,462 19,556 250,000 165166 2 Hillside Gardens Multifamily Conventional 1,224 678 11,616 20,030 166167 1 Rite Aid - Boardman, OH Retail Single Tenant 167
168 1 Hospitality Limited Service 5,027 1,166 58,961 168169 1 Extra Space Storage - Chatsworth, CA Self Storage Self Storage 169170 2 Billboard Lofts Multifamily Conventional 3,575 630 6,000 170171 1 CVS - San Antonio, TX Retail Single Tenant 171172 1 Airport Center Warehouse Industrial Warehouse/Distribution 9,652 172
173 2 Multifamily Independent Living 4,939 1,273 27,000 173174 1 Shoppers World Duluth II Retail Shadow Anchored 355 750 1,365 (2) 174175 1 New Forest Crossing Shopping Center Phase II Retail Shadow Anchored 175176 1 Oceana Distribution Center Industrial Distribution/Warehouse 2,915 1,116 176177 1 Clanton Shopping Center Retail Shadow Anchored 579 462 2,973 (2) 177178 1 Extra Space Storage - Oakland, CA Self Storage Self Storage 178179 1 Bull Creek Market Retail Unanchored 10,118 1,623 4,596 4,375 60,000 (2) 179180 1 Gateway Retail Center II Retail Unanchored 2,112 534 1,500 (2) 180181 1 La Marque Crossing Retail Shadow Anchored 3,149 593 1,446 (2) 181182 2 Mobile Gardens MHP Mobile Home Park Mobile Home Park 2,937 936 182183 1 Extra Space Storage - North Hollywood, CA Self Storage Self Storage 183184 1 Bethel Self Storage Self Storage Self Storage 3,792 779 7,793 184
185 1 Retail Shadow Anchored 399 122 905 (2) 185186 1 Rite Aid - Erie, PA Retail Single Tenant 1,699 (2) 186187 2 Gas Lite Manor Mobile Home Park Mobile Home Park 1,667 168 4,008 187188 2 Saratoga Apartments Multifamily Conventional 1,566 741 7,750 188189 2 Blueberry Ridge Mobile Village Mobile Home Park Mobile Home Park 670 245 10,000 189
(1) Annual deposits to the replacement reserve are $57,638 through the first year and adjusted for CPI as of November 2006 thereafter.
(2) In addition to any escrows funded at loan closing for potential TI/LC expenses, the related Mortgage Loan requires funds to be escrowed during some or all of the loan terms for TI/LC expenses, which may be incurred during the term of the related Mortgage Loans. In certain instances, escrowed funds may be released to the borrower upon satisfaction of certain leasing conditions.
(3) Annual deposits to the replacement reserve are the greater of (i) Management Agreement or (ii) 4% of the Gross Revenues. (4) Commencing May 11, 2010, annual deposits to the replacement reserves are $55,586. (5) Commencing April 11, 2011, annual deposits to the replacement reserve are $59,082. (6) Initial letter of credit deposit to TI/LC reserve in the amount $870,000. (7) Annual deposits to the replacement reserve are $668,354 through March 11, 2008 and 4.0% of yearly gross revenues thereafter. (8) Commencing May 11, 2012, annual deposits to the replacement reserve are $36,992. (9) Annual deposits to the replacement reserve are $474,617 through April 11, 2008 and 4.0% of gross revenues thereafter. (10) Commencing April 11, 2012, annual deposits to the replacement reserve are $55,266. (11) Commencing May 11, 2012, annual deposits to the replacement reserve are $28,918. (12) Initial letter of credit deposit to TI/LC reserve in the amount of $200,000. (13) Commencing May 11, 2009, annual deposits to the replacement reserve are $61,908. (14) Annual deposits to the replacement reserve are $13,552 until the reserve balance reaches or exceeds $40,655. Deposits will resume if the reserve balance falls below $13,552. Such payments will cease on June 11, 2016.
(15) Annual deposits to the replacement reserve are $211,242 and can be adjusted at Lender's discretion.
(16) Commencing March 11, 2009, annual deposits to the replacement reserve are $66,174. (17) Commencing on May 11, 2009 annual deposits to the replacement reserve are $14,740. (18) Initial deposit to replacement reserves in the amount of $710,000. (19) Initial letter of credit deposit to TI/LC reserve in the amount of $225,000. (20) Annual deposits to the replacement reserve are $23,250 and $250 per unit. (21) Annual deposits to the replacement reserve are $82,665 and can be adjusted at Lender's discretion. (22) Commencing April 11, 2009, annual deposits to the replacement reserve are $44,000. (23) Annual deposits to the replacement reserve are $79,908 commencing May 11, 2011 through April 11, 2015 and resume if the reserve balance falls below cap. (24) Annual deposits to the replacement reserve are $76,930 through April 11, 2008 and 3.0% of prior year's gross revenues thereafter. (25) Commencing May 11, 2009, annual deposits to the replacement reserve are $33,280.
(26) Annual deposits to the replacement reserve are $58,961 adjustable at Lender's discretion
(27) Annual deposits to the replacement reserve are $13,500 and $250 per unit.
(28) Annual deposits to the replacement reserve are $905 through April 11, 2010 and resume if balance the falls below the cap.
Northridge Promenade Shopping Center (14)
Hilton Garden Inn - Duncanville, TX(15)
Quail Creek(16)
Scripps Terrace Apartments(17)
CentrePointe Office(18)(19)
Boulders Senior Living Apartments(20)
Hampton Inn - Staunton, VA(21)
Wind Tree Apartments(22)
Baldwin Transfer Pool(23)
Country Inn & Suites - Henrietta, NY(24)
Pear Tree Apartments(25)
Comfort Suites - Charlotte, NC(26)
Redwood Terrace(27)
Fry's Plaza(28)
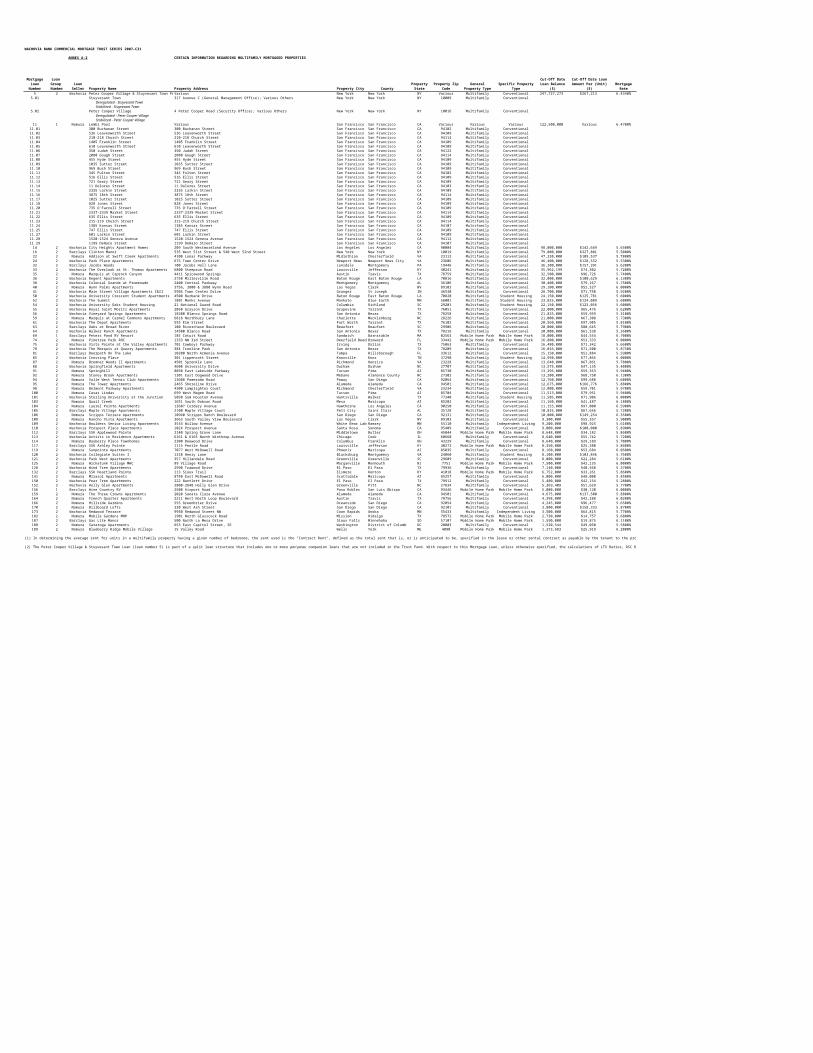
WACHOVIA BANK COMMERCIAL MORTGAGE TRUST SERIES 2007-C31
ANNEX A-4 COMMERCIAL TENANT SCHEDULE
Property Name Specific Property Type Largest Tenant1 1 Five Times Square Office CBD 536,000,000.00 1,101,779 Sq. Ft. Ernst & Young LLP2 1 Beacon D.C. & Seattle Pool Various Various 414,000,000.00 9,848,341 Sq. Ft. Various
2.01 Market Square Office CBD 678,348 Sq. Ft. Fulbright & Jaworski2.02 Polk & Taylor Buildings Office Suburban 904,226 Sq. Ft. GSA - Department of Defense2.03 Wells Fargo Center Office CBD 944,141 Sq. Ft. Wells Fargo Bank NA2.04 One, Two & Three Lafayette Centre Office CBD 711,495 Sq. Ft. Commodity Future2.05 Booz Allen Complex Office Suburban 731,234 Sq. Ft. Booz Allen Hamilton2.06 Key Center Office CBD 473,988 Sq. Ft. Infospace2.07 Sunset North Office Suburban 463,182 Sq. Ft. Expedia2.08 City Center Bellevue Office CBD 465,765 Sq. Ft. HDR Engineering2.09 Plaza Center and US Bank Tower Office CBD 466,948 Sq. Ft. US Bank National2.10 1616 Fort Myer Drive Office Suburban 294,521 Sq. Ft. DHS - GS-11B-016872.11 American Center Office Suburban 329,695 Sq. Ft. SunTrust Bank2.12 Eastgate Office Park Office Suburban 251,088 Sq. Ft. Fiserv Seattle2.13 Liberty Place Office CBD 163,936 Sq. Ft. GSA - Department of Justice2.14 Lincoln Executive Center Buildings I, II, III, A&B Office Suburban 277,672 Sq. Ft. High Tech Institute2.15 11111 Sunset Hills Road Office Suburban 216,469 Sq. Ft. XO Communications2.16 Army and Navy Club Building Office CBD 102,822 Sq. Ft. New York Times2.17 Plaza East Office CBD 148,952 Sq. Ft. Serena Software2.18 Reston Town Center Mixed Use Office/Retail 764,103 Sq. Ft. College Entrance Exam2.19 1300 North Seventeenth Street Office Suburban 380,743 Sq. Ft. BAE Systems2.20 Washington Mutual Tower Office CBD 1,079,013 Sq. Ft. Perkins Coie
3 1 666 Fifth Avenue Office CBD 395,000,000.00 1,454,110 Sq. Ft. Citibank N.A. 4 1 Mall at Rockingham Park Retail Anchored 260,000,000.00 382,012 Sq. Ft. The Gap10 1 Los Angeles International Jewelry Center Mixed Use Office/Retail 124,400,000.00 369,853 Sq. Ft. Bank of America11 1 Lembi Pool Various Various 122,500,000.00 Various Various Various
11.19 240 Church Street Retail Unanchored 3,470 Sq. Ft. Sparky's Diner11.26 631 Larkin Street Retail Unanchored 6,500 Sq. Ft. Zaki Mokhemer
13 1 Osprey Pool Office CBD 113,360,000.00 724,097 Sq. Ft. Various13.01 First Citizens Plaza Office CBD 475,043 Sq. Ft. Shaw Facilities, Inc.13.02 Sarasota City Center Office CBD 249,054 Sq. Ft. Boars Head Provisions
17 1 Southern Palm Crossing Shopping Center Retail Anchored 69,675,000.00 346,042 Sq. Ft. Costco18 1 635 Madison Avenue Office Medical 56,500,000.00 143,825 Sq. Ft. N.Y. Physicians P.C.19 1 Cherry Hill Corporate Center Pool Various Various 51,700,000.00 601,889 Sq. Ft. Various
19.01 24-42 Cherry Hill Drive Mixed Use Office/R&D 100,612 Sq. Ft. IBIS Technology Corporation19.02 71 Cherry Hill Drive Mixed Use Office/R&D 100,928 Sq. Ft. Siemens Real Estate19.03 35 Cherry Hill Drive Mixed Use Office/R&D 77,712 Sq. Ft. Medtronic, Inc.19.04 37 Cherry Hill Drive Mixed Use Office/R&D 60,000 Sq. Ft. Medtronic, Inc.19.05 33 Cherry Hill Drive Mixed Use Office/R&D 60,600 Sq. Ft. Shawmut Advertising, Inc.19.06 54 Cherry Hill Drive Mixed Use Office/R&D 68,700 Sq. Ft. Osram Sylvania Products, Inc.19.07 72 Cherry Hill Drive Office Suburban 59,146 Sq. Ft. Amphenol PCD, Inc.19.08 66 Cherry Hill Drive Office Suburban 32,669 Sq. Ft. American Renal Associates19.09 5 Cherry Hill Drive Office Suburban 41,522 Sq. Ft. TUV America, Inc.
20 1 First Colony Commons Retail Anchored 50,600,000.00 410,117 Sq. Ft. Home Depot21 1 611 West 6th Street Office CBD 50,000,000.00 274,528 Sq. Ft. HUD23 1 Corporate Plaza Office CBD 47,000,000.00 277,799 Sq. Ft. BCBS of DE., Inc.25 1 Central Texas Marketplace Retail Anchored 45,386,369.00 555,906 Sq. Ft. Belk26 1 East Gate Square Phase II Retail Anchored 41,480,000.00 154,742 Sq. Ft. CVS28 1 FMC Technologies Industrial Flex 39,000,000.00 462,717 Sq. Ft. FMC Technologies29 1 1020 19th Street Office CBD 38,000,000.00 107,338 Sq. Ft. Hudson Cook LLP30 1 1920 L Street Office CBD 36,600,000.00 101,317 Sq. Ft. Federal Insurance Company31 1 Scottsdale Medical Office Office Medical 36,500,000.00 154,136 Sq. Ft. SMIL34 1 Toll Brothers Corporate Headquarters Office Suburban 35,125,000.00 203,000 Sq. Ft. Toll Brothers, Inc.37 1 1900 L Street Office CBD 31,900,000.00 104,394 Sq. Ft. Communications International Union39 1 Whittier Marketplace Retail Anchored 30,400,000.00 168,263 Sq. Ft. Ralphs42 1 East Gate Square Phase IV Retail Anchored 28,080,000.00 99,560 Sq. Ft. Barnes & Noble Inc.43 1 East Gate Square Phase V Retail Anchored 28,020,000.00 94,286 Sq. Ft. Circuit City45 1 Whittier Center Office Suburban 26,100,000.00 143,450 Sq. Ft. Whittier Hospital Medical Center46 1 Durham Office Office Suburban 26,000,000.00 276,329 Sq. Ft. Duke University Health System PRMO Group47 1 35 Nutmeg Drive Office Suburban 25,600,000.00 278,655 Sq. Ft. NASDAQ, Inc.48 1 Parkway 400 Office Suburban 25,500,000.00 192,786 Sq. Ft. Inovis, Inc.49 1 THF-Fairview Marketplace Retail Anchored 25,000,000.00 219,096 Sq. Ft. Wal-Mart Supercenter51 1 One & Two Decatur Town Center Office Suburban 24,000,000.00 185,354 Sq. Ft. Third Millennium Communications53 1 Beachwalk Shopping Center Mixed Use Office/Retail 22,520,000.00 52,875 Sq. Ft. Coldwell Banker Residential Brokerage57 1 The Phillips Building Office CBD 21,700,000.00 109,496 Sq. Ft. Seneca One Finanice, Inc.58 1 200 Montague Street Office CBD 21,000,000.00 45,335 Sq. Ft. Health Insurance Plan of Greater NY60 1 Courthouse Marketplace Retail Center Retail Anchored 20,750,000.00 103,263 Sq. Ft. Harris Teeter, Inc.62 1 200 South Tryon Office CBD 20,000,000.00 210,426 Sq. Ft. Wachovia Bank National Association65 1 14700 Lee Road Office Suburban 19,300,000.00 84,652 Sq. Ft. General Dynamics66 1 East Gate Square Phase III Retail Anchored 19,280,000.00 128,898 Sq. Ft. Dick's Sporting Goods, Inc.67 1 St. Louis County Office Pool Office Various 18,500,000.00 182,955 Sq. Ft. Various
67.01 9735 Landmark Parkway Drive Office Suburban 84,905 Sq. Ft. Anheuser Busch Companies, Inc67.02 Laumeier III Office Suburban 51,843 Sq. Ft. Anheuser Busch Companies, Inc67.03 9701 Landmark Parkway Drive Office Medical 22,600 Sq. Ft. St. John's Mercy Medical Center67.04 9717 Landmark Parkway Drive Office Suburban 23,607 Sq. Ft. Meier New Life Clinic
68 1 Donald Ross Village Mixed Use Retail/Office 18,000,000.00 53,709 Sq. Ft. Raymonds Village Grill70 1 5601 Cushing Parkway Retail Single Tenant 17,670,000.00 50,654 Sq. Ft. Sonic Fremont, Inc.71 1 901 7th Street Office CBD 17,250,000.00 39,236 Sq. Ft. Washington DC Convention & Tourism Corp72 1 1700 Higgins Center Office Suburban 17,000,000.00 137,095 Sq. Ft. SRDS, Inc.73 1 Shop-Rite BayShore Retail Single Tenant 17,000,000.00 60,000 Sq. Ft. ShopRite76 1 Lexington Green Building I and II Office Suburban 16,400,000.00 150,711 Sq. Ft. Risk Placement Service, Inc.77 1 National Archives Building Industrial Warehouse 16,400,000.00 217,394 Sq. Ft. GSA79 1 Sherwood Plaza Office Suburban 15,700,000.00 92,960 Sq. Ft. Inforeliance Corporation80 1 801 West Easy Street Industrial Warehouse 15,600,000.00 165,000 Sq. Ft. Don's Cold Storage82 1 Northridge Promenade Shopping Center Retail Anchored 15,100,000.00 90,344 Sq. Ft. Guitar Center Stores, Inc.84 1 15 Broad Street Office CBD 15,000,000.00 70,787 Sq. Ft. EMI Strategic Marketing 89 1 Oakton Corporate Center Office Suburban 13,500,000.00 64,648 Sq. Ft. Vance International, Inc.93 1 East Gate Square Phase VI Retail Shadow Anchored 13,140,000.00 36,273 Sq. Ft. Hallmark Creations96 1 Capital One Data Center Industrial Flex 12,500,000.00 40,966 Sq. Ft. Dataside, LLC99 1 Cypress Business Center Office Suburban 12,000,000.00 121,758 Sq. Ft. Citizens Property Insurance
102 1 Battleground Plaza Retail Anchored 11,440,000.00 145,625 Sq. Ft. Big Lots Stores, Inc.107 1 CentrePointe Office Office Suburban 9,600,000.00 83,192 Sq. Ft. Realtors Association111 1 Winchester Court Retail Anchored 8,810,000.00 251,613 Sq. Ft. Seessel's116 1 Tyvola Center Office Suburban 8,500,000.00 52,000 Sq. Ft. United States Government, Department of Homeland Security118 1 Victoria Crossing Retail Anchored 8,288,000.00 86,725 Sq. Ft. Ross Dress for Less122 1 Publix at Bayside Lakes Retail Anchored 8,000,000.00 70,070 Sq. Ft. Publix123 1 Evergreen Distribution Center Industrial Distribution 7,900,000.00 151,000 Sq. Ft. BACE Manufacturing, Inc.127 1 Berwick Marketplace Retail Shadow Anchored 7,200,000.00 38,171 Sq. Ft. Fuddruckers129 1 Gander Mountain - Cicero Retail Single Tenant 7,088,000.00 65,556 Sq. Ft. Gander Mountain130 1 Burnsville Medical Center Office Medical 7,050,000.00 45,412 Sq. Ft. Quello Clinic 131 1 52-15 Flushing Ave Industrial Warehouse 6,993,031.46 65,000 Sq. Ft. Liber Chocolate & Food Co., Inc.133 1 1603 North 35th Street Industrial Warehouse 6,750,000.00 274,510 Sq. Ft. Stribling Packaging, Inc135 1 425 Meadowlands Parkway Land Office 6,400,000.00 125,000 Sq. Ft. Meadowland Parkway Associates136 1 CVS (Mixed Use Facility) Mixed Use Retail/Office 6,250,000.00 27,379 Sq. Ft. CVS137 1 Baldwin Transfer Pool Industrial Distribution 6,200,000.00 799,039 Sq. Ft. Baldwin Transfer
137.01 1505 & 1507 Telegraph Road Industrial Distribution 154,594 Sq. Ft. Baldwin Transfer137.02 1400 James Street Industrial Distribution 150,000 Sq. Ft. Baldwin Transfer137.03 52 W.L. Runnels Drive Industrial Distribution 150,000 Sq. Ft. Baldwin Transfer137.04 1700 A. Craft Highway Industrial Distribution 148,968 Sq. Ft. Baldwin Transfer137.05 201 Callahan Road Industrial Distribution 96,613 Sq. Ft. Baldwin Transfer137.06 200 Callahan Road Industrial Distribution 98,864 Sq. Ft. Baldwin Transfer
138 1 Wendover Plaza Retail Anchored 6,193,465.17 78,099 Sq. Ft. Food Lion139 1 Parkway Place Industrial Office/Showroom 6,100,000.00 93,294 Sq. Ft. AccuTronics142 1 Lyon's Station Retail Unanchored 5,950,000.00 28,554 Sq. Ft. China Palace144 1 Sweetwater Shopping Center Retail Unanchored 5,840,000.00 12,020 Sq. Ft. Wachovia Bank National Association145 1 Orlando ICE Building Industrial Flex 5,833,856.26 22,082 Sq. Ft. GSA148 1 FBI Building - Nashville, TN Office Suburban 5,680,000.00 26,833 Sq. Ft. FBI151 1 400 Centennial Parkway Office Suburban 5,370,000.00 40,889 Sq. Ft. McStain153 1 Center of Dover Retail Anchored 5,360,000.00 38,495 Sq. Ft. Happy Harry's154 1 Best Buy - Kohler, WI Retail Single Tenant 5,225,000.00 30,038 Sq. Ft. Best Buy155 1 Blackhawk Office Building Office Suburban 5,100,000.00 34,256 Sq. Ft. City of Los Angeles - LAPD157 1 Ridgewood Industrial Industrial Flex 4,800,000.00 62,678 Sq. Ft. National Compressor Exchange of New York, Inc.158 1 Mountain View Shopping Center Phase II Retail Anchored 4,727,839.00 55,500 Sq. Ft. Bed Bath & Beyond162 1 2580 Diehl Road Industrial Warehouse 4,480,000.00 65,477 Sq. Ft. Dupage County election commission165 1 Metro Gardens Office Park Office Suburban 4,350,000.00 46,590 Sq. Ft. State of Florida Department of Revenue167 1 Rite Aid - Boardman, OH Retail Single Tenant 4,009,732.11 14,564 Sq. Ft. Rite Aid171 1 CVS - San Antonio, TX Retail Single Tenant 3,750,000.00 10,908 Sq. Ft. CVS172 1 Airport Center Warehouse Industrial Warehouse/Distribution 3,500,000.00 50,800 Sq. Ft. Danial Casabona174 1 Shoppers World Duluth II Retail Shadow Anchored 3,440,000.00 13,650 Sq. Ft. Radio Shack175 1 New Forest Crossing Shopping Center Phase II Retail Shadow Anchored 3,437,500.00 26,680 Sq. Ft. Anna's Linens176 1 Oceana Distribution Center Industrial Distribution/Warehouse 3,400,000.00 96,000 Sq. Ft. Shed Manufacturing, Inc.177 1 Clanton Shopping Center Retail Shadow Anchored 3,304,668.89 29,728 Sq. Ft. Dollar Tree179 1 Bull Creek Market Retail Unanchored 3,150,000.00 27,035 Sq. Ft. Bull Creek Restaurant180 1 Gateway Retail Center II Retail Unanchored 3,030,000.00 10,000 Sq. Ft. Jack-n-Grill Mexican Restaurant 181 1 La Marque Crossing Retail Shadow Anchored 3,030,000.00 14,231 Sq. Ft. Regions Bank185 1 Fry's Plaza Retail Shadow Anchored 2,070,000.00 7,574 Sq. Ft. Nancy McEachern & Frank Turner186 1 Rite Aid - Erie, PA Retail Single Tenant 1,605,000.00 11,325 Sq. Ft. Rite Aid
Mortgage Loan
Number
Loan Group Number
General Property Type
Cut-Off Date Loan Balance ($)
Number of Units (Units)
Unit of Measure

2nd Largest Tenant Name 3rd Largest Tenant Name96.66% 05/30/2022 Red Lobster 1.32% 05/31/13 Disney Store 1.05% 11/30/18 1Various Various Various Various Various Various Various Various 218.84% 06/30/2015 Shearman & Sterling 16.87% Multiple Spaces Edison Electric Institute 11.32% 07/31/2015 2.0160.75% Multiple Spaces Polk GSA 39.25% Multiple Spaces 2.0219.93% Multiple Spaces King County 10.38% 07/31/2007 Moss Adams 9.91% Multiple Spaces 2.0322.74% 09/30/2015 Jackson & Campbell 6.23% 05/31/2010 AT&T Corp. 5.66% Multiple Spaces 2.0497.68% Multiple Spaces Northern VA Family Sv 0.48% 12/31/2007 YK and Wang 0.38% 10/31/2011 2.0527.60% 02/28/2013 Keybank National Association 21.88% 07/31/2010 Symetra Finacial Corporation 15.09% 07/31/2015 2.0657.37% 09/30/2009 Sierra Entertainment 27.64% 02/28/2010 American Family Mutual Insuran 6.09% Multiple Spaces 2.0711.66% 12/31/2012 Oracle USA 6.60% 03/31/2009 Cisco Systems 6.02% 02/28/2013 2.089.80% 12/31/2013 Business Service Center 7.66% 03/31/2009 Wells Fargo Bank NA 5.27% Multiple Spaces 2.0924.65% Multiple Spaces GSA 16.03% 02/28/2011 EADS 12.57% 08/31/2014 2.1018.06% Multiple Spaces HQ Global Workplaces 6.49% 03/31/2011 GSA 6.43% 08/31/2013 2.1114.71% 07/31/2008 Orrtax Software 13.31% 09/30/2013 Great American Insurance 9.87% 12/31/2009 2.1242.41% 01/31/2008 American Hospital Association 24.09% 08/31/2014 National Retail Federation 16.32% 03/31/2014 2.1311.25% 06/30/2014 John L Scott Real Estate Servi 9.61% 04/30/2014 Peacehealth 9.32% 03/31/2014 2.1477.38% 11/30/2007 Stanley Martin 13.35% 01/31/2016 Akamai Technologies 7.17% 05/31/2011 2.1521.54% 12/31/2009 Jones Lang Lasalle 17.48% Multiple Spaces Constantine Cannon 12.21% 03/31/2008 2.1619.34% 01/31/2012 Barclay Dean 8.83% 08/31/2012 National Medical Management 8.51% 07/31/2008 2.179.27% 09/30/2009 Pfizer, Inc. 8.24% 09/30/2009 National Amusements 6.74% 02/28/2011 2.1819.25% 05/31/2014 Federal Network Systems 11.24% 11/30/2008 BBN Technologies 10.78% 11/30/2010 2.1926.48% Multiple Spaces Washington Mutual Bank 16.78% 12/31/2010 Davis Wright Tremaine 15.71% 12/31/2018 2.2025.11% 08/31/14 Orrick, Herrington & Sutcliffe 16.47% 03/31/10 Fulbright & Jaworski L.L.P. 9.57% 12/31/16 34.58% 01/31/10 H & M 4.00% 10/31/11 Express - Men 3.52% 01/31/14 45.10% 09/29/2011 Kattan Diamonds 1.57% 09/30/2016 Oro King 1.49% Multiple Spaces 10Various Various Various Various Various 1161.53% MTM Just Deserts 38.76% 06/30/07 11.1967.69% 02/28/11 Turtle Towe Restaurant 32.31% MTM 11.26Various Various Various Various Various Various Various Various 1350.15% 04/30/16 First Citizen's Bank 13.64% 10/31/2036 HDR Engineering, Inc. 7.01% 04/30/09 13.0116.21% 02/28/2013 Wachovia Bank 12.13% 08/31/2013 Paine Webber 7.90% 04/30/2010 13.0241.83% 04/12/2032 Marshalls & Homegoods 16.09% 10/31/2016 Stein Mart 10.40% 11/30/2016 1712.52% 06/30/2011 Seville Watch Corporation 8.00% 05/31/2017 Tom Jones Inc. D.b.a. Searle 7.82% 03/31/2019 18Various Various Various Various Various Various Various Various 1931.73% 06/30/2011 Advanced Photographics, Inc. 12.18% 02/28/2008 Publishers Circulation Fulfillment, Inc. 11.23% 11/30/2011 19.01
100.00% 08/31/2016 19.02100.00% 10/31/2009 19.03100.00% 10/31/2009 19.0436.23% 08/31/2012 Axcellis Technologies, Inc. 31.85% 07/31/2009 Advanced Ion Beam Technology, Inc. 17.90% 06/30/2010 19.05
100.00% 08/31/2016 19.0637.73% 03/31/2012 CP Media, Inc. 20.29% 12/31/2010 19.0757.83% 06/30/2011 Applied Materials, Inc. 35.07% 02/28/2008 Audiovox, Inc. 7.10% 03/31/2010 19.0836.73% 09/11/2007 Selective Micro Technologies, Inc. 19.82% 06/30/2011 eAppraiseIT, LLC 16.95% 07/31/2011 19.0932.23% 01/31/2013 Conn's Appliances (Ground Lease) 12.25% 02/28/2018 Babies R Us 10.11% 01/31/2014 2031.91% 03/19/2013 GSA 27.18% Multiple Spaces Arbinet-the exchange 5.86% 07/31/08 2157.90% 10/01/2017 Unicare Life & Health Insurance 11.39% 03/31/2015 Smith, Katzenstein & Furlow 5.71% 04/30/2010 2317.31% 03/24/24 Kohl's 15.90% 01/31/25 Sports Authority / Oshman's 6.28% 01/31/15 2532.31% 01/31/2016 Michael's Store 15.58% 02/28/2009 Staples the Office Superstore East 15.45% 01/31/2011 26
100.00% 03/31/22 2811.54% 02/29/2016 Farr Miller & Washington 8.04% 03/31/2013 Abu Dhabi International 6.73% 03/31/2013 2912.99% 01/31/2016 Liquidity Services, Inc. 12.99% 01/31/2013 Americans for Tax Reforms 12.83% 10/31/2009 3019.67% 02/28/2017 Scottsdale Healthcare Realty 9.92% 10/31/2013 Phoenix Diagnostic Imaging 3.91% 03/01/2008 31
100.00% 10/31/2019 3418.08% 01/31/2008 Change to Win 8.67% Multiple Spaces Get Active Software, Inc. 8.12% Multiple Spaces 3726.17% 09/10/2012 CVS 12.72% 09/30/12 Pacific Auto Spa 6.54% 05/31/25 3930.28% 01/31/2013 Petsmart Inc. 28.10% 01/31/2018 Loehmann's Inc. 25.11% 05/31/2012 4234.89% 01/31/2016 Thomasville Home Furnishings 16.36% 03/31/2012 Moorestown Party City, LLC 12.39% 03/31/12 437.76% 04/30/09 First Team Real Estate 7.49% 10/31/11 Bergman Medical Group 6.55% 12/31/09 4538.72% 06/30/2010 Qualex, Inc. 35.68% 02/28/09 Duke University 15.23% 05/31/09 4616.79% 07/31/2008 Gartner Group, Inc. 16.40% 11/30/2010 General Reinsurance Corp. 15.12% 08/31/2017 4727.75% 10/31/2014 Certegy 25.45% 03/31/12 Information Global Solutions, Inc 11.09% 01/31/10 4879.05% 10/17/2026 El Maguey Restaurant 1.59% 04/30/2012 Eyemart Express 1.36% 03/31/2012 4911.70% 03/31/10 Third Millennium Healthcare 8.22% 05/31/11 Georgia Advocacy 5.05% 10/31/10 519.55% 09/30/2007 California Pizza Kitchen 9.46% 06/30/2012 Pacific Coast Grill 9.00% 07/31/2010 5315.51% 08/31/2008 Rock Bottom Restaurants, Inc. 11.83% 06/30/2011 Riorey, Inc. 7.42% 04/30/2011 5756.31% 10/31/2010 HSBC Bank USA 43.69% 03/31/17 5847.22% 09/20/2025 Long & Foster Real Estate, Inc. 6.34% 05/31/2011 Sun Trust Bank 4.16% 11/30/26 6036.88% 05/31/08 HR America 6.44% Multiple Spaces ColeJenest & Stone, PA 4.86% 03/31/2011 62
100.00% 02/28/11 6554.31% 09/30/18 Best Buy 36.32% 01/31/2018 Chick-Fil-A 3.26% 10/31/2017 66Various Various Various Various Various Various Various Various 6781.30% 02/29/12 Delta Dental 10.84% 11/30/2008 Preferred Resource Network 4.39% 09/30/2011 67.0171.22% MTM Schmersahl, Treloar & Co., P.C. 19.52% 04/30/2010 Law Offices of Steven M., LLC 7.04% 08/31/12 67.02
100.00% 05/31/2011 67.0317.83% 03/31/2008 World Mortgage Company 16.81% 02/28/2010 Ryder Truck Rental, Inc. 12.85% 12/31/07 67.048.17% 12/31/2016 Citibank 7.42% 10/31/2016 Grandes Bella Cucina 7.26% 02/28/2012 68
100.00% 12/31/21 7044.25% 01/31/2016 Commerce Bank 26.25% 12/31/27 Anderson Pitts 14.75% 11/30/15 7126.97% 12/31/14 GSA 10.74% 09/20/15 Chicago Sweeteners, Inc. 9.20% 08/21/15 72
100.00% 06/30/22 7314.28% 04/30/12 Strayer University, Inc. 9.04% 10/31/15 Alltel Publishing Corporation aka Windstream Yellow Pages 8.78% 10/31/07 76
100.00% 06/30/22 7720.97% 07/31/09 Chadwick Washington 15.51% 01/31/13 Leros Technologies Corporation 12.27% 09/30/11 79
100.00% 02/25/22 8016.76% 10/31/2015 Beverages & More, Inc. 15.76% 11/30/16 DD Car, Inc. 9.82% 02/28/2010 8216.83% 03/31/2011 Beecher Carlson Holdings, Inc. 10.38% 03/31/2013 Fay, Spofford & Thorndike 6.25% 10/31/2009 8464.92% 04/30/12 General Dynamics AIS 11.79% 12/31/07 Sun Trust Mortgage, Inc. 8.28% 12/31/09 8915.44% 02/28/2010 Modern Woman/Charming Shoppes 12.85% 04/30/2009 Jos A Bank Clothiers Inc. 10.97% 01/31/2009 93
100.00% 03/31/16 9647.14% Multiple Spaces Washington Mutual Bank 15.30% 06/30/09 AmTrak 6.01% 09/30/10 9919.91% 07/31/2008 Triad Fitness Group Northwest, LLC 19.90% 05/31/2016 Tuesday Morning 15.13% 07/15/12 10214.30% 11/30/2008 Humana Medical Plan 14.04% 07/31/2008 Bomar Industries 11.00% 10/31/11 10721.34% 04/30/2010 Memphis Furniture Showroom 19.87% 07/31/2010 Winchester VIII Theater 9.50% 07/31/2009 111
100.00% 07/28/23 11634.81% 01/31/2017 Bed Bath & Beyond 26.52% 01/31/2017 Petsmart 23.14% 05/30/16 11863.18% 07/31/2021 Beef O'Brady's 5.71% 03/31/2008 Washington Mutual Bank 5.14% 11/30/2011 122
100.00% 04/30/2012 12311.01% 10/31/2016 Rug Decor 10.48% 05/31/2011 Papa's Pizza 8.47% 04/30/2011 127
100.00% 09/30/19 12961.29% 10/31/2016 Suburban Radiology 10.19% 10/31/11 Minnesota Sport and Spine 9.17% 11/30/2011 130
100.00% 03/30/22 131100.00% 02/28/22 133100.00% 12/31/09 13550.39% 01/30/2028 Perkins Eastman Architects 39.84% 12/31/18 Dunkin Donuts 9.77% 12/31/18 136Various Various 137
100.00% 11/30/21 137.01100.00% 11/30/21 137.02100.00% 07/31/19 137.03100.00% 11/30/21 137.04100.00% 11/30/21 137.05100.00% 11/30/21 137.0637.13% 11/01/2014 USPS 20.05% 04/19/2011 Family Dollar 10.82% 12/31/2007 13820.50% 06/30/2010 MaxCam Corp 10.91% 10/12/09 EPIEN Medical 8.14% 05/31/2009 13914.71% 12/31/08 Video Depot 12.52% 12/31/07 Radio Shack 9.46% 11/09/08 14233.28% 08/31/2026 Sugar Land Uniforms 27.58% 01/31/2012 Starbuck's 14.39% 09/30/2016 144
100.00% 07/31/20 145100.00% 02/08/21 14862.91% 11/07/14 Holcim 17.72% 12/31/10 CoBiz Bank 12.39% 11/07/09 15131.17% 08/31/22 Dollar Tree 25.98% 04/30/11 Slim-Z, LLC 22.07% 12/31/22 153
100.00% 01/31/2018 15413.08% MTM Timothy Larson 9.74% 01/31/2009 Bowker and Roth Property Services, Inc. 7.32% 06/30/2007 15581.81% 06/30/28 National Brand Coffee Service, Inc. 18.19% 06/30/11 15741.44% 01/31/16 Best Buy 36.04% 01/31/16 Dollar Tree 22.52% 08/31/15 15843.40% 09/30/11 Norandex Distribution Inc. 22.16% 11/30/09 Midwest Envelopes 17.75% 06/30/11 16245.37% 12/31/10 Center for Independent Living Inc. 11.22% 09/30/13 State of Florida Department of Lottery 8.80% 12/31/07 165
100.00% 07/31/26 167100.00% 09/03/18 1716.56% 12/31/2007 Angel Leonardo Estralla 3.55% 02/28/2007 Maintenance Storage Bay 3.32% 12/31/2008 17217.82% 01/31/2012 AZP Inc d/b/a Jang 14.48% 12/14/2011 Fiji Corp 13.92% 12/14/2011 17430.17% 05/02/16 Buffalo Wild Wings 21.04% 05/31/16 Dots Fashions 14.99% 05/31/11 17540.00% 01/31/2010 Community Alternatives, Inc. 29.38% 12/31/2009 Harbour Graphics, Inc. 10.63% 02/28/2019 17626.91% 09/30/2011 CATO 17.49% 01/31/2012 Hibbbett Sports 16.82% 10/31/2011 17719.23% 03/31/10 Waterloo Restaurant 18.49% 10/31/10 Chase Carpets 17.62% 10/31/09 17940.00% 06/26/16 Heidi's Deli 20.00% 12/31/25 Anthony's Pizza & Pasta 20.00% 07/15/13 18028.11% 03/31/2015 Cingular Wireless 11.24% 11/30/2011 Citi Financial 11.24% 04/30/2010 18125.06% 01/31/2012 Suiyen He 23.77% 07/31/2011 H&R Block Enterprises 18.22% 04/30/2011 185
100.00% 05/31/17 186
Largest Tenant % of NRA
Largest Tenant Exp. Date
2nd Largest Tenant % of
NRA2nd Largest
Tenant Exp. Date
3rd Largest Tenant % of
NRA
3rd Largest Tenant Exp.
DateMortgage Loan
Number

WACHOVIA BANK COMMERCIAL MORTGAGE TRUST SERIES 2007-C31
ANNEX A-5 CERTAIN CHARACTERISTICS OF THE MORTGAGE LOANS AND MORTGAGED PROPERTIES (CROSSED & PORTFOLIOS)
Property Name City State Original Loan Balance ($) DSCR (x)
2 1 Various Various 414,000,000.00 414,000,000.00 7.08% 60 60 60 IO IO IO 414,000,000.00 3,432,650,000.00 1.27 78.66% 78.66% 9,848,341 Sq. Ft. 42.04 198,385,886.00 2
2.01 Market Square Washington DC 63,968,571.52 529,000,000.00 678,348 Sq. Ft. 25,307,068.36 2.01
2.02 Polk & Taylor Buildings Arlington VA 50,666,978.30 419,000,000.00 904,226 Sq. Ft. 22,263,095.04 2.02
2.03 Wells Fargo Center Seattle WA 47,643,888.97 394,000,000.00 944,141 Sq. Ft. 18,616,234.01 2.03
2.04 One, Two & Three Lafayette Centre Washington DC 43,060,885.20 356,100,000.00 711,495 Sq. Ft. 17,388,129.24 2.04
2.05 Booz Allen Complex Mc Lean VA 36,313,349.75 300,300,000.00 731,234 Sq. Ft. 15,469,518.68 2.05
2.06 Key Center Bellevue WA 24,269,361.72 200,700,000.00 473,988 Sq. Ft. 11,014,878.43 2.06
2.07 Sunset North Bellevue WA 22,552,246.89 186,500,000.00 463,182 Sq. Ft. 8,370,682.01 2.07
2.08 City Center Bellevue Bellevue WA 22,389,000.09 182,150,000.00 465,765 Sq. Ft. 9,183,434.32 2.08
2.09 Plaza Center and US Bank Tower Bellevue WA 18,356,198.80 151,800,000.00 466,948 Sq. Ft. 8,466,918.79 2.09
2.10 1616 Fort Myer Drive Arlington VA 16,929,300.57 144,000,000.00 294,521 Sq. Ft. 7,127,979.35 2.10
2.11 American Center Vienna VA 12,817,899.08 106,000,000.00 329,695 Sq. Ft. 6,801,601.61 2.11
2.12 Eastgate Office Park Bellevue WA 11,197,523.17 92,600,000.00 251,088 Sq. Ft. 3,555,517.01 2.12
2.13 Liberty Place Washington DC 10,641,274.61 96,000,000.00 163,936 Sq. Ft. 5,225,760.11 2.13
2.14 Lincoln Executive Center Buildings I, II, III, A&B Bellevue WA 10,338,965.67 85,500,000.00 277,672 Sq. Ft. 3,898,128.06 2.14
2.15 11111 Sunset Hills Road Reston VA 9,093,452.81 75,200,000.00 216,469 Sq. Ft. 4,199,873.62 2.15
2.16 Army and Navy Club Building Washington DC 7,678,647.06 63,500,000.00 102,822 Sq. Ft. 2,376,220.85 2.16
2.17 Plaza East Bellevue WA 6,082,455.80 50,300,000.00 148,952 Sq. Ft. 2,352,484.57 2.17
2.18 Reston Town Center Reston VA 440,000,000.00 764,103 Sq. Ft. 8,066,029.59 2.18
2.19 1300 North Seventeenth Street Arlington VA 200,000,000.00 380,743 Sq. Ft. 5,900,879.02 2.19
2.20 Washington Mutual Tower Seattle WA 378,684,000.00 1,079,013 Sq. Ft. 12,801,453.00 2.20
5 2 New York NY 247,727,272.72 247,727,272.72 4.24% 120 115 115 IO IO IO 247,727,272.72 5,400,000,000.00 1.73 55.56% 55.56% 11,227 Units 22,065.31 333,909,980.08 5
5.01 Stuyvesant Town New York NY 191,638,078.90 8,746 Units 5.01
5.02 Peter Cooper Village New York NY 56,089,193.82 2,481 Units 5.02
Various 1 East Gate Portfolio Various NJ East Gate Portfolio 130,000,000.00 130,000,000.00 2.22% 120 118 118 IO IO IO 130,000,000.00 163,000,000.00 1.21 79.75% 79.75% 513,759 Sq. Ft. 253.04 8,620,142.12 Various
26 1 East Gate Square Phase II Moorestown NJ East Gate Portfolio 41,480,000.00 41,480,000.00 0.71% 120 118 118 IO IO IO 41,480,000.00 51,850,000.00 1.19 80.00% 80.00% 154,742 Sq. Ft. 268.06 2,694,506.93 2642 1 East Gate Square Phase IV Mount Laurel NJ East Gate Portfolio 28,080,000.00 28,080,000.00 0.48% 120 118 118 IO IO IO 28,080,000.00 35,100,000.00 1.36 80.00% 80.00% 99,560 Sq. Ft. 282.04 2,085,267.30 4243 1 East Gate Square Phase V Moorestown NJ East Gate Portfolio 28,020,000.00 28,020,000.00 0.48% 120 118 118 IO IO IO 28,020,000.00 35,025,000.00 1.27 80.00% 80.00% 94,286 Sq. Ft. 297.18 1,957,309.28 4366 1 East Gate Square Phase III Mount Laurel NJ East Gate Portfolio 19,280,000.00 19,280,000.00 0.33% 120 118 118 IO IO IO 19,280,000.00 24,100,000.00 1.34 80.00% 80.00% 128,898 Sq. Ft. 149.58 1,413,969.42 6693 1 East Gate Square Phase VI Moorestown NJ East Gate Portfolio 13,140,000.00 13,140,000.00 0.22% 120 118 118 IO IO IO 13,140,000.00 16,925,000.00 0.65 77.64% 77.64% 36,273 Sq. Ft. 362.25 469,089.19 93
8 1 Ashford Hospitality Pool 3 Various Various 128,408,000.00 128,408,000.00 2.20% 120 119 59 360 360 765,940.09 120,042,772.19 168,000,000.00 1.47 76.43% 71.45% 655 Rooms 196,042.75 13,508,020.35 8
8.01 Courtyard - San Francisco, CA San Francisco CA 68,540,000.00 95,000,000.00 405 Rooms 7,407,305.56 8.01
8.02 Courtyard - Seattle, WA Seattle WA 59,868,000.00 73,000,000.00 250 Rooms 6,100,714.79 8.02
9 1 Ashford Hospitality Pool 2 Various Various 126,466,000.00 126,466,000.00 2.16% 120 119 59 360 360 754,356.27 118,227,285.12 157,700,000.00 1.57 80.19% 74.97% 1,137 Rooms 111,227.79 14,187,110.97 9
9.01 Residence Inn - Phoenix , AZ Phoenix AZ 23,150,000.00 28,500,000.00 200 Rooms 2,726,551.41 9.01
9.02 SpringHill Suites - Hawthorne, CA Hawthorne CA 21,920,000.00 27,400,000.00 164 Rooms 2,399,670.83 9.02
9.03 Towne Place Suites - Hawthorne, CA Hawthorne CA 20,230,000.00 25,600,000.00 144 Rooms 2,287,920.32 9.03
9.04 SpringHill Suites - Plymouth Meeting, PA Plymouth Meeting PA 20,000,000.00 25,000,000.00 199 Rooms 2,321,029.11 9.04
9.05 SpringHill Suites - Glen Allen, VA Glen Allen VA 15,286,000.00 17,500,000.00 136 Rooms 1,633,174.08 9.05
9.06 Residence Inn - Plano, TX Plano TX 14,760,000.00 17,700,000.00 126 Rooms 1,675,559.20 9.06
9.07 Residence Inn - Newark, CA Newark CA 11,120,000.00 16,000,000.00 168 Rooms 1,143,206.02 9.07
11 1 Lembi Pool San Francisco CA 122,500,000.00 122,500,000.00 2.10% 60 59 59 IO IO IO 122,500,000.00 171,230,000.00 1.42 71.54% 71.54% Various Various Various 11,379,480.00 11
11.01 300 Buchanan Street San Francisco CA 12,894,736.84 17,600,000.00 60 Units 11.01
11.02 536 Leavenworth Street San Francisco CA 8,940,350.88 11,800,000.00 62 Units 11.02
11.03 210-218 Church Street San Francisco CA 8,252,631.58 10,600,000.00 16 Units 11.03
11.04 1405 Franklin Street San Francisco CA 7,865,789.47 9,800,000.00 37 Units 11.04
11.05 610 Leavenworth Street San Francisco CA 7,556,315.79 10,200,000.00 28 Units 11.05
11.06 350 Judah Street San Francisco CA 7,225,350.88 9,100,000.00 30 Units 11.06
11.07 2080 Gough Street San Francisco CA 6,619,298.25 9,000,000.00 16 Units 11.07
11.08 455 Hyde Street San Francisco CA 5,996,052.63 8,800,000.00 43 Units 11.08
11.09 1035 Sutter Street San Francisco CA 5,501,754.39 8,700,000.00 34 Units 11.09
11.10 969 Bush Street San Francisco CA 4,771,052.63 6,900,000.00 29 Units 11.10
11.11 345 Fulton Street San Francisco CA 4,513,157.89 5,900,000.00 29 Units 11.11
11.12 516 Ellis Street San Francisco CA 4,341,228.07 5,700,000.00 37 Units 11.12
11.13 721 Geary Street San Francisco CA 3,932,894.74 6,300,000.00 28 Units 11.13
11.14 11 Dolores Street San Francisco CA 3,279,561.40 5,400,000.00 15 Units 11.14
11.15 2335 Larkin Street San Francisco CA 3,137,719.30 5,200,000.00 12 Units 11.15
11.16 3875 18th Street San Francisco CA 3,094,736.84 4,700,000.00 12 Units 11.16
11.17 1025 Sutter Street San Francisco CA 3,008,771.93 4,200,000.00 19 Units 11.17
11.18 828 Jones Street San Francisco CA 2,922,807.02 4,600,000.00 21 Units 11.18
11.19 240 Church Street San Francisco CA 2,750,877.19 3,300,000.00 3,470 Sq. Ft. 11.19
11.20 735 O'Farrell Street San Francisco CA 2,621,929.82 3,900,000.00 23 Units 11.20
11.21 2337-2339 Market Street San Francisco CA 2,501,578.95 3,600,000.00 12 Units 11.21
11.22 635 Ellis Street San Francisco CA 2,127,631.58 3,400,000.00 18 Units 11.22
11.23 215-219 Church Street San Francisco CA 2,015,877.19 2,600,000.00 1 Units 11.23
11.24 1385 Kansas Street San Francisco CA 1,504,385.96 2,000,000.00 8 Units 11.24
11.25 747 Ellis Street San Francisco CA 1,474,298.25 2,300,000.00 14 Units 11.25
11.26 631 Larkin Street San Francisco CA 1,216,403.51 1,700,000.00 6,500 Sq. Ft. 11.26
11.27 601 Larkin Street San Francisco CA 1,117,543.86 1,350,000.00 1 Units 11.27
11.28 1520-1524 Geneva Avenue San Francisco CA 945,614.04 1,750,000.00 7 Units 11.28
11.29 1199 DeHaro Street San Francisco CA 369,649.12 830,000.00 1 Units 11.29
12 1 Ashford Hospitality Pool 1 Various Various 115,600,000.00 115,600,000.00 1.98% 120 119 59 360 360 689,541.73 108,069,158.19 145,500,000.00 1.54 79.45% 74.27% 905 Rooms 127,734.81 12,781,147.32 12
12.01 Courtyard - Basking Ridge, NJ Basking Ridge NJ 42,640,500.00 52,100,000.00 235 Rooms 4,601,710.70 12.01
12.02 Courtyard - Oakland Airport, CA Oakland CA 24,002,182.00 29,300,000.00 156 Rooms 2,690,658.53 12.02
12.03 Courtyard - Scottsdale, AZ Scottsdale AZ 23,042,500.00 28,500,000.00 180 Rooms 2,425,929.23 12.03
12.04 Courtyard - Plano, TX Plano TX 19,688,000.00 23,600,000.00 153 Rooms 2,325,277.56 12.04
12.05 Courtyard - Newark, CA Newark CA 6,226,818.00 12,000,000.00 181 Rooms 737,571.30 12.05
13 1 Osprey Pool Various Various 113,360,000.00 113,360,000.00 1.94% 120 119 119 IO IO IO 113,360,000.00 141,700,000.00 1.35 80.00% 80.00% 724,097 Sq. Ft. 156.55 8,604,055.96 13
13.01 First Citizens Plaza Charlotte NC 74,160,000.00 92,700,000.00 475,043 Sq. Ft. 5,706,943.95 13.01
13.02 Sarasota City Center Sarasota FL 39,200,000.00 49,000,000.00 249,054 Sq. Ft. 2,897,112.01 13.02
Various 1 Gravely Portfolio Washington DC Gravely Portfolio 106,500,000.00 106,500,000.00 1.82% 120 Various Various IO IO IO 106,500,000.00 142,400,000.00 1.23 74.79% 74.79% 313,049 Sq. Ft. 340.20 7,398,804.00 Various
30 1 1920 L Street Washington DC Gravely Portfolio 36,600,000.00 36,600,000.00 0.63% 120 116 116 IO IO IO 36,600,000.00 47,600,000.00 1.31 76.89% 76.89% 101,317 Sq. Ft. 361.24 2,716,427.55 3037 1 1900 L Street Washington DC Gravely Portfolio 31,900,000.00 31,900,000.00 0.55% 120 117 117 IO IO IO 31,900,000.00 46,800,000.00 1.39 68.16% 68.16% 104,394 Sq. Ft. 305.57 2,508,911.03 3729 1 1020 19th Street Washington DC Gravely Portfolio 38,000,000.00 38,000,000.00 0.65% 120 119 119 IO IO IO 38,000,000.00 48,000,000.00 1.01 79.17% 79.17% 107,338 Sq. Ft. 354.02 2,173,465.42 29
19 1 Cherry Hill Corporate Center Pool Various MA 51,700,000.00 51,700,000.00 0.88% 120 118 118 IO IO IO 51,700,000.00 64,000,000.00 1.23 80.78% 80.78% 601,889 Sq. Ft. 85.90 3,653,200.39 19
19.01 24-42 Cherry Hill Drive Danvers MA 9,240,000.00 10,400,000.00 100,612 Sq. Ft. 702,727.33 19.01
19.02 71 Cherry Hill Drive Beverly MA 8,560,000.00 9,800,000.00 100,928 Sq. Ft. 634,652.35 19.02
19.03 35 Cherry Hill Drive Danvers MA 7,036,000.00 7,900,000.00 77,712 Sq. Ft. 495,064.82 19.03
19.04 37 Cherry Hill Drive Danvers MA 5,640,000.00 6,100,000.00 60,000 Sq. Ft. 390,927.85 19.04
19.05 33 Cherry Hill Drive Danvers MA 5,252,000.00 6,300,000.00 60,600 Sq. Ft. 357,235.07 19.05
19.06 54 Cherry Hill Drive Danvers MA 4,915,000.00 5,800,000.00 68,700 Sq. Ft. 360,065.68 19.06
19.07 72 Cherry Hill Drive Beverly MA 4,756,000.00 7,800,000.00 59,146 Sq. Ft. 148,620.68 19.07
19.08 66 Cherry Hill Drive Beverly MA 3,191,000.00 4,700,000.00 32,669 Sq. Ft. 290,880.47 19.08
19.09 5 Cherry Hill Drive Danvers MA 3,110,000.00 5,200,000.00 41,522 Sq. Ft. 273,026.14 19.09
Various 2 SSK Portfolio Various Various SSK Portfolio 23,750,000.00 23,750,000.00 0.41% 120 119 59 360 360 140,262.62 22,175,136.06 29,890,000.00 1.19 74.44% 69.17% 785 Pads 30,254.78 1,875,922.00 Various112 2 SSK Applewood Pointe Middletown OH SSK Portfolio 8,648,000.00 8,648,000.00 0.15% 120 119 59 360 360 51,073.31 8,074,550.60 10,810,000.00 1.19 74.44% 69.17% 253 Pads 34,181.82 706,806.00 112
117 2 SSK Ashley Pointe Louisville KY SSK Portfolio 8,350,000.00 8,350,000.00 0.14% 120 119 59 360 360 49,313.38 7,796,310.99 10,640,000.00 1.19 74.44% 69.17% 329 Pads 25,379.94 652,440.00 117132 2 SSK Heartland Pointe Elsmere KY SSK Portfolio 6,752,000.00 6,752,000.00 0.12% 120 119 59 360 360 39,875.92 6,304,274.47 8,440,000.00 1.19 74.44% 69.17% 203 Pads 33,261.08 516,676.00 132
67 1 St. Louis County Office Pool Various MO 18,500,000.00 18,500,000.00 0.32% 120 119 59 360 360 105,971.41 17,206,544.63 23,200,000.00 1.23 79.74% 74.17% 182,955 Sq. Ft. 101.12 1,568,325.85 67
67.01 9735 Landmark Parkway Drive Saint Louis MO 10,400,000.00 84,905 Sq. Ft. 750,878.71 67.01
67.02 Laumeier III Saint Louis MO 6,700,000.00 51,843 Sq. Ft. 493,591.00 67.02
67.03 9701 Landmark Parkway Drive Sunset Hills MO 3,800,000.00 22,600 Sq. Ft. 215,538.94 67.03
67.04 9717 Landmark Parkway Drive Sunset Hills MO 2,300,000.00 23,607 Sq. Ft. 108,317.20 67.04
90 1 Courtyard Matthews & Rock Hill Pool Various Various 13,375,000.00 13,375,000.00 0.23% 120 117 33 360 360 79,332.01 12,061,599.97 19,300,000.00 1.32 69.30% 62.50% 211 Rooms 63,388.63 1,251,896.00 90
90.01 Courtyard - Matthews, NC Matthews NC 7,125,000.00 10,300,000.00 121 Rooms 694,000.00 90.01
90.02 Courtyard - Rock Hill, SC Rock Hill SC 6,250,000.00 9,000,000.00 90 Rooms 557,896.00 90.02
137 1 Baldwin Transfer Pool Various Various 6,200,000.00 6,200,000.00 0.11% 120 119 23 300 300 39,004.60 5,119,199.72 13,150,000.00 2.03 47.15% 38.93% 799,039 Sq. Ft. 7.76 949,372.25 137
137.01 1505 & 1507 Telegraph Road Mobile AL 2,450,000.00 154,594 Sq. Ft. 195,775.06 137.01
137.02 1400 James Street Hattiesburg MS 2,250,000.00 150,000 Sq. Ft. 162,422.33 137.02
137.03 52 W.L. Runnels Drive Hattiesburg MS 2,950,000.00 150,000 Sq. Ft. 151,039.37 137.03
137.04 1700 A. Craft Highway Mobile AL 2,350,000.00 148,968 Sq. Ft. 191,403.56 137.04
137.05 201 Callahan Road Mobile AL 1,550,000.00 96,613 Sq. Ft. 122,981.23 137.05
137.06 200 Callahan Road Chickasaw AL 1,600,000.00 98,864 Sq. Ft. 125,750.70 137.06
Mortgage Loan
Number
Loan Group Number
Cross Collateralized and Cross Defaulted Loan Flag
Cut-Off Date Loan Balance
($)
% of Aggregate Cut-Off Date
Balance
Original Term to
Maturity or ARD (Mos.)
Remaining Term to
Maturity or ARD (Mos.)
Remaining IO Period (Mos.)
Original Amort Term (Mos.)
Remaining Amort Term
(Mos.)Monthly P&I Payments ($)
Maturity Date or ARD Balloon
Balance ($)Appraised Value
($)
Cut-off Date LTV
Ratio
LTV Ratio at Maturity
or ARDNumber of
Units (Units)Unit of
Measure
Cut-Off Date Loan
Amount Per (Unit)
($)
UW Net Cash Flow
($)Mortgage
Loan Number
Beacon D.C. & Seattle Pool*
Peter Cooper Village & Stuyvesant Town Pool*
* The Beacon D.C. and Seattle Pool Loan and the Peter Cooper Village & Stuyvesant Town Loan (loan numbers 2 and 5) are each a part of split loan structures that include one or more pari passu companion loans that are not included in the Trust Fund. With respect to these Mortgage Loans, unless otherwise specified, the calculations of LTV Ratios, DSC Ratio and Cut-Off Date Blanace per unit are based upon the aggregate indebtedness of or debt service on, as applicable, the related Mortgage Loan and the related pari passu companion loans, and not any related future pari passu

loans, and not any related future pari passu companion loan.

WACHOVIA BANK COMMERCIAL MORTGAGE TRUST SERIES 2007-C31
ANNEX A-6 DEBT SERVICE PAYMENT SCHEDULE FOR THE NORTHRIDGE PROMENADE SHOPPING CENTER MORTGAGE LOAN
Principal ($) Interest ($) Principal ($) Interest ($)1 - 59,942.81 59,942.81 4.6100% 61 - 75,546.14 75,546.14 5.8100%2 - 58,009.17 58,009.17 4.6100% 62 - 73,109.17 73,109.17 5.8100%3 - 59,942.81 59,942.81 4.6100% 63 - 75,546.14 75,546.14 5.8100%4 - 59,942.81 59,942.81 4.6100% 64 - 75,546.14 75,546.14 5.8100%5 - 58,009.17 58,009.17 4.6100% 65 - 73,109.17 73,109.17 5.8100%6 - 59,942.81 59,942.81 4.6100% 66 - 75,546.14 75,546.14 5.8100%7 - 58,009.17 58,009.17 4.6100% 67 - 73,109.17 73,109.17 5.8100%8 - 59,942.81 59,942.81 4.6100% 68 - 75,546.14 75,546.14 5.8100%9 - 59,942.81 59,942.81 4.6100% 69 - 75,546.14 75,546.14 5.8100%
10 - 56,075.53 56,075.53 4.6100% 70 - 68,235.22 68,235.22 5.8100%11 - 59,942.81 59,942.81 4.6100% 71 - 75,546.14 75,546.14 5.8100%12 - 58,009.17 58,009.17 4.6100% 72 - 73,109.17 73,109.17 5.8100%13 - 63,193.50 63,193.50 4.8600% 73 - 75,546.14 75,546.14 5.8100%14 - 61,155.00 61,155.00 4.8600% 74 - 73,109.17 73,109.17 5.8100%15 - 63,193.50 63,193.50 4.8600% 75 - 75,546.14 75,546.14 5.8100%16 - 63,193.50 63,193.50 4.8600% 76 - 75,546.14 75,546.14 5.8100%17 - 61,155.00 61,155.00 4.8600% 77 - 73,109.17 73,109.17 5.8100%18 - 63,193.50 63,193.50 4.8600% 78 - 75,546.14 75,546.14 5.8100%19 - 61,155.00 61,155.00 4.8600% 79 - 73,109.17 73,109.17 5.8100%20 - 63,193.50 63,193.50 4.8600% 80 - 75,546.14 75,546.14 5.8100%21 - 63,193.50 63,193.50 4.8600% 81 - 75,546.14 75,546.14 5.8100%22 - 57,078.00 57,078.00 4.8600% 82 - 68,235.22 68,235.22 5.8100%23 - 63,193.50 63,193.50 4.8600% 83 - 75,546.14 75,546.14 5.8100%24 - 61,155.00 61,155.00 4.8600% 84 - 73,109.17 73,109.17 5.8100%25 - 66,444.19 66,444.19 5.1100% 85 13,149.75 75,546.14 88,695.89 5.8100%26 - 64,300.83 64,300.83 5.1100% 86 15,650.39 73,045.50 88,695.89 5.8100%27 - 66,444.19 66,444.19 5.1100% 87 13,293.84 75,402.05 88,695.89 5.8100%28 - 66,444.19 66,444.19 5.1100% 88 13,360.35 75,335.54 88,695.89 5.8100%29 - 64,300.83 64,300.83 5.1100% 89 15,855.21 72,840.68 88,695.89 5.8100%30 - 66,444.19 66,444.19 5.1100% 90 13,506.52 75,189.37 88,695.89 5.8100%31 - 64,300.83 64,300.83 5.1100% 91 15,997.37 72,698.52 88,695.89 5.8100%32 - 66,444.19 66,444.19 5.1100% 92 13,654.13 75,041.76 88,695.89 5.8100%33 - 66,444.19 66,444.19 5.1100% 93 13,722.44 74,973.45 88,695.89 5.8100%34 - 60,014.11 60,014.11 5.1100% 94 21,039.94 67,655.95 88,695.89 5.8100%35 - 66,444.19 66,444.19 5.1100% 95 13,896.36 74,799.53 88,695.89 5.8100%36 - 64,300.83 64,300.83 5.1100% 96 16,376.53 72,319.36 88,695.89 5.8100%37 - 69,694.89 69,694.89 5.3600% 97 14,047.81 74,648.08 88,695.89 5.8100%38 - 67,446.67 67,446.67 5.3600% 98 16,523.83 72,172.06 88,695.89 5.8100%39 - 69,694.89 69,694.89 5.3600% 99 14,200.77 74,495.12 88,695.89 5.8100%40 - 69,694.89 69,694.89 5.3600% 100 14,271.81 74,424.08 88,695.89 5.8100%41 - 67,446.67 67,446.67 5.3600% 101 16,741.69 71,954.20 88,695.89 5.8100%42 - 69,694.89 69,694.89 5.3600% 102 14,426.98 74,268.92 88,695.89 5.8100%43 - 67,446.67 67,446.67 5.3600% 103 16,892.60 71,803.29 88,695.89 5.8100%44 - 69,694.89 69,694.89 5.3600% 104 14,583.67 74,112.22 88,695.89 5.8100%45 - 69,694.89 69,694.89 5.3600% 105 14,656.63 74,039.26 88,695.89 5.8100%46 - 62,950.22 62,950.22 5.3600% 106 19,501.96 69,193.94 88,695.89 5.8100%47 - 69,694.89 69,694.89 5.3600% 107 14,827.53 73,868.36 88,695.89 5.8100%48 - 67,446.67 67,446.67 5.3600% 108 17,282.17 71,413.72 88,695.89 5.8100%49 - 72,945.58 72,945.58 5.6100% 109 14,988.18 73,707.71 88,695.89 5.8100%50 - 70,592.50 70,592.50 5.6100% 110 17,438.41 71,257.48 88,695.89 5.8100%51 - 72,945.58 72,945.58 5.6100% 111 15,150.41 73,545.48 88,695.89 5.8100%52 - 72,945.58 72,945.58 5.6100% 112 15,226.21 73,469.68 88,695.89 5.8100%53 - 70,592.50 70,592.50 5.6100% 113 17,669.92 71,025.97 88,695.89 5.8100%54 - 72,945.58 72,945.58 5.6100% 114 15,390.79 73,305.10 88,695.89 5.8100%55 - 70,592.50 70,592.50 5.6100% 115 17,829.98 70,865.91 88,695.89 5.8100%56 - 72,945.58 72,945.58 5.6100% 116 15,556.99 73,138.90 88,695.89 5.8100%57 - 72,945.58 72,945.58 5.6100% 117 15,634.82 73,061.07 88,695.89 5.8100%58 - 68,239.42 68,239.42 5.6100% 118 22,775.90 65,919.99 88,695.89 5.8100%59 - 72,945.58 72,945.58 5.6100% 119 15,827.00 72,868.89 88,695.89 5.8100%60 - 70,592.50 70,592.50 5.6100% 120 14,549,051.11 70,441.66 14,619,492.77 5.8100%
Loan PayPeriod
Monthly DebtService ($)
MortgageRate (%)
Loan PayPeriod
Monthly DebtService ($)
MortgageRate (%)