co-movements of index options and futures quotes satellite markets transferred to the lifie connect...
TRANSCRIPT
Co-Movements of Index Options and Futures Quotes ∗
Rudiger Fahlenbrach† Patrik Sandas‡
Current Draft: November 10, 2005
∗We thank the London International Financial Futures and Options Exchange for providing the sample,the Rodney L. White Center for financial support, and Amber Anand, Burton Hollifield, Eric Hughson,Haitao Li, Pam Moulton, Pascal St-Amour, Mike Stutzer and seminar participants at the American Uni-versity, the European Finance Association meeting, the 2003 NBER Market Microstructure meeting, the2003 IFM2 Conference on Asset Pricing and Microstructure in Montreal, SUNY-Binghamton, Universityof Colorado at Boulder and Wharton for helpful comments. An earlier version of this paper was entitled“Market Frictions and Seemingly Anomalous Co-Movements of Index Options and Index Futures Quotes.”
†Finance Department, Fisher College of Business, The Ohio State University, 2100 Neil Avenue, Colum-bus, OH 43210-1144, E-mail: [email protected].
‡McIntire School of Commerce, University of Virginia, Charlottesville, VA 22904-4173, and CEPR, E-mail: [email protected]. Part of this research was conducted while Sandas was a faculty member atUniversity of Pennsylvania and a visiting economist at the New York Stock Exchange. The commentsand opinions expressed in this paper are the authors’ and do not necessarily reflect those of the directors,members, or officers of the New York Stock Exchange.

Abstract
We re-examine the co-movements of index options and futures quotes first studied in Bakshi,
Cao, and Chen (2000). We show that the frequency of quote co-movements that are inconsistent
with standard option pricing models is significantly higher around option trades. We examine em-
pirically two explanations for these co-movements. First, we show that in simulations the stochastic
volatility model can generate approximately the right frequency of inconsistent co-movements when
its parameters are chosen to match observed option prices. But even allowing for different regimes
in trade and no-trade periods the model generates virtually the same frequency of inconsistent
co-movements. Second, we examine the quote co-movements in event-time around trades and show
that they are consistent with either traders picking off stale option quotes or with traders sub-
mitting aggressive limit orders. Our evidence suggest that inconsistent co-movements reflect both
departures from the univariate diffusion model and market microstructure frictions.
Keywords: Options; Frictions; Market Microstructure; Stale Quotes; Market and Limit Orders
JEL codes: G13; G14; C33

1 Introduction
Recent studies document discrepancies between theoretical and actual co-movements of index op-
tions and futures. Bakshi, Cao and Chen (2000) report that co-movements of S&P 500 index
options and futures often violate the predictions of standard option pricing models. Bossaerts and
Hillion (2003) apply a new methodology that uses only local information on co-movements of index
options and futures to price and hedge options on the DAX index. Their new methodology displays
superior performance on simulated data (see Bossaerts and Hillion (1997)) but performs poorly on
actual data, a finding that the authors attribute to frequent anomalous co-movements of the index
options and futures. Both studies suggest that the observed co-movements may reflect a stochastic
volatility process for the underlying asset. But they also suggest that even a richer process for the
underlying asset may not completely rationalize the co-movements leaving market microstructure
frictions as another possible explanation.1 The existing evidence on the relative importance of such
frictions is incomplete because variables that play a key role in most microstructure models, namely
trades and signed orders, have not been considered.
We use a one-year sample of quotes and trades for European-style options and futures on
the Financial Times Stock Exchange 100 stock index (FTSE 100) from the London International
Financial Futures and Options Exchange (Liffe). Like Bakshi, Cao, and Chen (2000) we find that
contrary to the predictions of standard option pricing models quote changes for call options and
index futures frequently have opposite signs whereas quote changes for put options and index futures
frequently have the same sign. We compute the frequency of such co-movements in periods with
and without option trades and find large differences. For example, quote changes for call options
and index futures are of opposite signs for approximately 30% of all one-minute intervals before
and after an option trade but only for 7% of all one-minute intervals that are at least a minute
away from a trade. Can these patterns in co-movements be reconciled with a stochastic volatility
model?1Bakshi et al. (2000) report that a stochastic volatility model fitted to their data can correctly predict 47% of the
observations of a negative correlation between the call price and the price of the underlying asset leading them toconclude that “Thus, the SV [stochastic volatility model] explains about half of the type I violations, but it cannotbe expected to be completely consistent with option data.”
1

A stochastic volatility model can generate different predictions for trade and no-trade periods
provided that trade and no-trade periods represent different regimes with innovations in the under-
lying stock index being more negatively correlated with innovations in volatility in trade periods.
We use end-of-day option prices to estimate the model parameters for no-trade periods and all
traded option prices to estimate the model parameters for trade periods. Using the two sets of
parameter estimates we generate a series of predicted co-movements for the options and future
quotes. The stochastic volatility model generates negative co-movements for call option and index
futures for 10.8% of the observations using the no-trade period parameter values and for 12.0%
of the observations using the trade period parameter values. The small difference implies that
while the stochastic volatility model generates approximately the correct frequency of anomalous
co-movements, it cannot rationalize the observed sharp increase in such violations around option
trades.
An alternative explanation is that the observed patterns in co-movements are driven by market
microstructure effects. But such explanations need to go beyond the predictions of a standard
market maker framework. It is hard to reconcile the anomalous quote co-movements with rational
quote updating by market makers. Why would market makers move their call option quotes down
or their put option quotes up when the underlying stock index goes up?2 Such quote co-movements
are not consistent with frictions created by the minimum tick size, or the bid-ask spread, nor
are they consistent with adverse selection or inventory based explanations. But the actual quote
dynamics on both the Chicago Board Options Exchange (Cboe) and the Liffe reflect traders’ limit
order submissions which may be driven by different considerations than that of market makers’
quote updates.
To gain a better understanding of the quote dynamics around trades we study the movements in
the options and futures quotes for one-half hour intervals centered around the time of option trades.
We compute the average mid-quote changes for the options and the futures both ten minutes before
and after buyer- and seller-initiated option trades and identify two types of trader behavior that
are associated with different patterns of co-movements.2Bakshi, Cao, and Chen (2000) makes this point on page 551.
2

In the first case, a buyer-initiated trade in a call option occurs shortly after a trader submits
an aggressive sell limit order that undercuts the current best ask quote by, on average, six ticks
causing the call option mid-quote to temporarily decrease while the futures mid-quote is virtually
unchanged. The quotes therefore move in opposite directions in 30% of the observations both before
and after the trade as the option’s mid-quote is temporarily pushed down before the trade and
reverts back after the trade. In the second case, the change in the futures mid-quote over the 10
minutes before the buyer-initiated trade implies, on average, a two to three tick increase in the
value of the call option but the call option’s mid-quote is virtually unchanged and adjusts upwards
only after the trade. The quotes therefore move in opposite directions for approximately 12% of the
observations before and 30% of the observations after the trade because of the stale quote before
and the delayed quote adjustment after the trade. We report analogous patterns for seller-initiated
trades in call options and buyer- and seller-initiated trades in put options. In the first case traders
seek liquidity by placing aggressive limit order that are likely to be executed quickly offering them
a better price than a market order and in the second case traders pick off stale quotes.
We interpret our findings as evidence that the above market microstructure effects explain a
significant fraction of the observed anomalous co-movements of index options and futures quotes
around trades. It is plausible that aggressive limit orders that fail to execute and stale quotes that
are not picked off explain some of the anomalous co-movements in intervals without trades. An
implication is that in order to draw reliable inference from tests using high frequency data it is
necessary to explicitly isolate market microstructure effects.
2 Description of the Market and the Sample
2.1 The Market
As of May 2000 all trading in financial contracts on Liffe takes place in an electronic limit order
book system called Liffe Connect. In January 2002, Liffe became a part of Euronext to form a
market called Euronext-Liffe. Euronext was formed by the merger of the Amsterdam, Brussels, and
Paris stock and derivatives exchanges in September 2000. All derivatives trading on the different
3

Euronext satellite markets transferred to the Liffe Connect trading system in 2003.3
In the first half of 2001, the European-style FTSE 100 index option contract had an average
monthly volume of 1.25 million contracts and an average monthly open interest of over 1.4 million
contracts, and ranked fourth worldwide in trading volume among index option contract after the
index option contracts on the S&P 100 and S&P 500 indices of the CBOE and on the DAX index
of the Eurex.4
Orders are submitted electronically to the central limit order book. Incoming market orders are
automatically matched with orders in the order book to produce trades. Orders are given priority
according to price and orders at the same price are filled in a pro rata fashion according to order
size.
Information on the best quotes and depths as well as quotes and depths away from the best
quotes is distributed in real-time via Liffe Connect to the members’ computer screens. In contrast,
no information on the identity of members submitting orders is distributed. Trading is anonymous
both before and after a trade.
Only exchange members can submit orders directly to Liffe Connect. There are no designated
market makers with special quoting obligations or privileges in the FTSE 100 index options. In
October 2002, there were 143 public order members. Public order members can trade on their own
account or on behalf of their customers. There were also 60 non-public order members. Non-public
order members can trade on their own account or on behalf of other members as brokers. Any
member firm can use software, known as automated price injection models, that automatically
generate order submissions or cancel outstanding orders.
2.2 The Sample
We obtained our sample from Liffe’s market data services. It consists of time-series of all quotes
and trades for all the European-style FTSE 100 index option contracts and the FTSE 100 index
futures contracts. We also obtained the daily time-series of closing prices, open interest, and implied3Other markets that use the Liffe Connect trading system are the Chicago Board of Trade and the Tokyo Inter-
national Financial Futures Exchange.4The rankings are based on volume figures provided by the Institute for Financial Markets (www.theifm.org).
American-style options on the FTSE 100 index also exists on Liffe but they are less actively traded.
4
volatilities for all contracts.
Our sample period covers 242 trading days between August 1, 2001 and July 30, 2002. Six
days were dropped from our sample because the quote and trade records are missing for more than
three hours. For each contract, the sample consists of a time-series of the best bid and ask quotes
with the corresponding total depths. A new observation is generated in the quote series for every
change in either the best bid or ask quote or in the best bid or ask depth. All quotes are binding
since trading is computerized.
Trading of the FTSE 100 index options and index futures is fully electronic and takes place
in a common trading system which brings two advantages for empirical work. First, trades can
be classified as buyer- or seller-initiated without error.5 Second, option and futures quotes are
synchronous, allowing us to determine the exact order and timing of quote changes around trades.
We use information on interest rates and dividend yields for computing the options’ delta. We
construct a proxy for the risk free interest rate using the overnight, one week, one month, three
months and one year Sterling London Interbank Offered Rates (Libor), provided by Datastream.
We construct a proxy for the interest rates for maturities other than the ones above via linear
interpolation. We obtain daily dividend yields on the FTSE 100 index from Datastream. Our proxy
for the dividend yield implicitly assumes market participants expect that the current dividend yield
is an unbiased forecast of the dividend yield during the rest of the life of the option.
We drop all observations from our sample that violate one or more of the following criteria: (i)
the bid or ask quote differs from the mid-quote by more than £30, (ii) the current bid or ask quote
has not changed for more than 30 minutes, and (iii) the bid or the ask quote does not satisfy either
the upper or lower bounds for rational call and put option prices. Applying the above criteria
leaves us with 8,238,375 observations or approximately 95% of the original sample. Stale quotes
and violations of the upper and lower bound for call and put option prices account for 80% of the
excluded observations.
The first four rows of Table 1 report the mean and standard deviation for the bid-ask spread,
the mid-quote, the depth at the best quotes, and the trade size for call options, put options, and5Savickas and Wilson (2003) show, for a sample from CBOE’s floor-based market, that trade classification algo-
rithms that are often used for equity data correctly classify between 59 and 83% of option trades.
5
index futures. The mean spread is £8.7 for the call options and £8.6 for the put options. The
minimum tick size of £0.5 is therefore not binding for a typical observation in our sample.6 The
mean depth and trade size are between 17 and 19 contracts for the call and put options. The mean
trade size is close to the mean depth. The last two rows report the number of trades and quote
updates.
We focus exclusively on the lead-month index futures contract because it is far more actively
traded than the contracts with longer time to expiration. The mean spread is £1.5 or approximately
17% of the mean index option spread. The mean depth and trade size are approximately equal for
the index futures and both are approximately one fifth of the corresponding means for the index
options. The index futures are actively traded; there are approximately 30 index futures trades for
every index option trade.
The total number of quote updates is approximately eight million for the index options compared
to approximately six million for the lead-month index futures contract. But many different option
series are traded on any given day. The number of index option contracts that are actively quoted
varies across days, but at a minimum three strike prices with five different expiration dates are
quoted for call and put options implying a total of 30 option series. With the index options’ quote
updates spread evenly over 30 different option series we have about 22 times as many quote updates
for the index futures as for the typical option series.
Table 2 reports the mean of the quoted bid-ask spread, the option price, the quoted depth,
the daily number of quote updates, the daily number of regular trades, and the trade size for
regular trades for call and put options, sorted into three categories based on moneyness or time to
expiration. The quoted bid-ask spread varies systematically with moneyness and time to expiration;
in general at-the-money and out-of-the-money options and short time to expiration options have
narrower spreads. The mean quoted depth varies between 15 and 24 contracts. Longer time to
expiration and out-of-the-money contracts have higher quoted depths.
Quote updates outnumber trades for all moneyness and expiration categories. For example,
for at-the-money calls there are 321 quote updates for every trade and for the shortest time to6The FTSE 100 index options are quoted in index points. Each contract is valued at £10 per index point. The
tick size is 0.5 index points or £5. We omit the index-point multiplier of ten in our empirical analysis.
6

expiration calls there are 192 quote updates for every trade. Quotes for at-the-money and short
time to expiration options are updated more frequently than quotes for in-the-money options and
longer time to expiration options.
3 Basic Properties of Option Prices
Bergman, Grundy, and Wiener (1996) show that when the underlying asset price follows a diffusion
whose volatility depends only on time and the concurrent asset price, then a call option price is
always increasing and convex in the underlying asset price. When volatility is stochastic, however,
or the underlying asset price does not follow a diffusion, then the call price can be a decreasing
or concave function of the stock price. One implication of their results is that the delta of a
European-style option is bounded at any time t < T before the option’s expiration date T :
0 ≤ ∂c(S, t)∂S
≤ 1 (1)
and
−1 ≤ ∂p(S, t)∂S
≤ 0, (2)
where c(·) denotes the value of the call and p(·) denotes the value of the put option and S denotes
the value of the underlying asset. Bergman et al. (1996) also show that as long as the option has
some positive time value the inequalities in equations 1 and 2 are strict.
Following Bakshi, Cao, and Chen (2000) we use the mid-quotes of the options and the index
futures as proxies for the value of the option and the the underlying index. We consider four types
of violations of the inequalities in equations 1 and 2. Denote the time t mid-quote of the index
futures by St and the time t mid-quotes of the call and put options by Ct and Pt. Denote the
changes in the mid-quotes between t − τ < t and t by dS = St − St−τ , dC = Ct − Ct−τ , and
dP = Pt − Pt−τ . The four violations are then defined as follows where τ is small enough to ignore
the effects of the option’s time decay.
Definition 1 The following four types of situations are violations of the basic properties in Equa-
7

tions 1 and 2
Type I :
dCdS < 0 and dS 6= 0,
ordPdS > 0 and dS 6= 0.
Type II :
dS 6= 0 and dC = 0,or
dS 6= 0 and dP = 0.
Type III :
dS = 0 and dC 6= 0,or
dS = 0 and dP 6= 0.
Type IV :
dCdS > 1 and dS 6= 0,
ordPdS < −1 and dS 6= 0.
Type I violations occur when the call option mid-quote moves in the opposite direction of the index
futures mid-quote or when the put option mid-quote moves in the same direction as the index
mid-quote. Type II violations occur when the option mid-quote is unchanged and the index futures
mid-quote changes. Type III violations occur when the index futures mid-quote is unchanged and
the option mid-quote changes. Type IV violations occur when the magnitude of change in the
option mid-quote is greater than the magnitude of the change in the index futures mid-quote. As
Bakshi et al. (2000) we will primarily focus on violations of type I and IV, which are more puzzling
than violations of type II and III because they involve changes in both the option and the index
futures mid-quotes.7
4 Empirical Results
4.1 Violation Rates: Trade versus No-Trade Intervals
Table 3 reports the mean rates of type I, II, III, and IV violations across all non-overlapping 30-
minute intervals in our sample. The top panel reports mean violation rates for call options and the
bottom panel reports the mean violation rates for put options. The top row of each panel reports
the overall mean violation rates. The overall mean rates of type I and IV violations are of the same7In our empirical analysis, we use the FTSE 100 index futures as a proxy for the underlying asset price. One
advantage of the index futures price is that it is more likely to reflect all available information about the componentstocks than the underlying index itself which may be based on individual stock quotes that are stale. Our proxyshould not affect the frequency of violations I-III at all, but it may bias our result against finding evidence of violationIV. During our sample period, the interpolated interest rate r was always larger than the dividend yield δ on theFTSE 100 index. Therefore, the theoretical futures price FT,t = St × exp(r − δ)(T − t) is larger than the underlyingindex inflating the denominators in the inequalities for Type IV violations.
8

order of magnitude as the ones reported in Table 3 of Bakshi, Cao, and Chen (2000) suggesting
that the violations may be a regularity of options data that holds across different markets, trading
systems, and time periods. We find that type I violations occur in 8.9% of all call option intervals
and in 9.2% of all put option intervals compared with 9.3% and 9.9% in their study. We find that
type IV violations occur in 4.5% of all call option intervals and in 4.3% of all put option intervals
compared with 7.3% and 9.8% in their study. Violations of type III occur in less than 2% of the
intervals in both studies.
Violations of type II have a mean rate of 47.7% for call option intervals and 51.8% for the
put option intervals which is much higher than in the sample of Bakshi et al. (2000) where the
corresponding mean rates are 34.3% and 32.0%. A potential explanation is the difference in the
relative tick size for the index futures in the two samples; in our sample the average value of the
FTSE 100 index is around 5,000 and the tick size is 0.5 index points whereas the average value of
the S&P 500 index was around 500 and the tick size was 0.1 index points in the period studied by
Bakshi et al. (2000). The relative tick size in our sample is therefore approximately one-half of
the one in their sample implying that we may observe more frequent changes in the index futures
mid-quote, holding everything else equal, which would produce a higher rate of type II violations.
A smaller relative tick size may also explain why we find a lower rate of type IV violations
because a finer tick size would tend to reduce any stickiness in the option quotes; a small quote
change for the index futures may not cause the option quotes to change especially if the options are
quoted in multiples of a relatively large tick size. In our sample it is also the case that the tick size
is the same across the two markets implying that situations where a change in the index futures
quote is smaller than the minimum tick size for the options cannot occur.
The second and third row of each panel report mean violation rates across all intervals in which
no trades occur and all intervals in which at least one trade occurs. The differences in the rates
of type I, II, and IV violations are large and a test of the null hypothesis that the violation rates
are equal across trade and no-trade intervals strongly rejects the null in all cases. Type I and type
IV violations occur on average twice as often in trade intervals as in no-trade intervals, while the
Type II violations are more than five times as common in no-trade intervals as they are in trade
9

intervals. The decrease in the rate of type II violations is not surprising because option quotes tend
to change around the time of option trades. What is more surprising is that quote co-movements
where option quotes move in either the ‘wrong direction’ or move by ‘too much’ are more common
in periods when the options are traded.
We next examine finer time intervals to establish a closer link between the violations and
trades. The bottom halves of each panel of Table 3 report the mean violation rates for 30 one-
minute intervals centered around each option trade. We report four sets of mean violation rates:
the overall violation rate across all 30 one-minute intervals for all trades, a mean violation rate for
the one-minute intervals before a trade, a mean violation rate for the one-minute intervals after a
trade, and a mean violation rate for all one-minute intervals at least one minute away from the
trade.
Overall, Type I and IV violations are approximately four times as likely during the two one-
minute intervals before and after a trade than during the other one-minute intervals. For example,
in the one-minute interval before a put option trade the option mid-quote moves in the same
direction as the index futures 26.3% of the time and moves in the opposite direction by more than
the change in the index futures 15.6% of the time. The corresponding violation rates for the one-
minute intervals away from the trade are 6.9% and 3.9%. The results show that there is a sharp
increase in the anomalous quote co-movements right around the time of a trades that deserves a
closer examination.
One possibility is that the correlation between trades and violations is indirect; perhaps the
violation rates depend on the option characteristics such as moneyness or time to expiration which
in turn are correlated with the trading activity. Table 4 and 5 report the mean rates of violation
by type for different sub-groups formed based on the options’ moneyness and time to expiration
categories. Both tables show the non-overlapping 30-minute interval violation rates for nine different
categories that consist of three moneyness and three time to expiration categories. The first number
in each column is the violation rate for no-trade intervals, and the number in parentheses is the
violation rate for trade intervals. While there are differences across categories, we find that for
all moneyness and all time to expiration categories the violations of type I and IV occur more
10

frequently in trade than in no-trade intervals for both call and put options. On average, across all
nine categories type I and IV violations occur about three times as often in trade as in no-trade
intervals.8
The bottom two rows in each panel report the mean of the absolute change in the mid-quote of
the option and the index futures for each category and no-trade and trade intervals. For both call
and put options and index futures the mean absolute mid-quote change is greater in trade intervals
than in no-trade intervals across all categories. The difference is on average approximately 2.5
index points for the index futures and 5.5 index points for the index options.
Overall, type I and IV violations are strongly associated with trades and there is little evidence
that the higher violation rates are systematically related to the options’ moneyness or time to
expiration. Mean absolute quote changes are greater in trade intervals than in no-trade intervals
pointing to at least two possibilities. One possible explanation for this finding is that the underlying
stock index follows a process that is characterized by stochastic volatility and a negative correlation
between innovations in the underlying index and the volatility.
4.2 Can a Stochastic Volatility Model Explain the Violation Rates?
We design a simulation to explore to what extent a two-dimensional Markov diffusion model can
help explain the different violation frequencies we observe for trade and no-trade intervals. We
concentrate on Heston’s (1993) stochastic volatility option pricing model. Heston suggest the
following specification for the stock price and volatility process:
dS(t)/S(t) = rdt +√
ν(t)dWS(t) (3)
dν(t) = [θ − κν(t)] dt + σ√
ν(t)dWν(t), (4)
where dWS and dWν are two Brownian motions with an instantaneous correlation coefficient
ρ. A stochastic volatility model for option prices can explain some of the type I violations if the8Dennis and Mayhew (2003) point out that price discreteness and rounding cause violations even when theoretically
there should be none, i.e., when the underlying process is a one-dimensional diffusion. Their arguments apply in anysetting including ours since prices are always discrete, but the differences across trade and no-trade periods that wefind cannot be explained by price discreteness or rounding.
11

innovation in the stock price and the innovation in the volatility process are negatively correlated:
a negative innovation in the stock price could be more than offset by a positive innovation to
volatility, leading to a higher call option price, and causing dS and dC to be of opposite signs.
Following Bakshi, Cao, and Chen, we back out the stochastic volatility model’s parameters from
observed option prices. We define a parameter vector Φ = {κ, θ, σ, ρ, ν}. We then minimize the
sum of squared pricing errors:
minΦ
N∑
n=1
(Cn(t, τ, K, S)− Cn(t, τ, K, S)
)2, (5)
where Cn is the observed option price for the nth call, and Cn is its model price.
To capture the difference between trade and no-trade intervals, we use two different sub-samples.
The first sub-sample consists of end-of-day mid-quotes for call options with a time-to-maturity of
more than a week and a moneyness between 0.85, and 1.05. We assume that the end-of-day mid-
quotes provide a good proxy for the behavior of the stock and volatility process during no-trade
intervals.
The second sub-sample consists of all transaction prices for call options and the associated level
of the index futures, with the same restrictions on moneyness and time-to-maturity. We assume
that the traded call option prices capture the information available to traders around the trades,
and provide a good proxy for the stock and volatility process during trade-intervals.
We fit the model each day of our sample period, and report an average of all daily parameter
estimates in Table 6. The first column reports the average parameter estimates of the trades
sample, the second column reports the parameter estimates of the end-of-day sample, and third
column repeats the values of Bakshi, Cao, and Chen (2000). The estimate for ρ is −0.70 for
trade periods and −0.53 implying that stock index and volatility innovations are more negatively
correlated in trade periods.
In the next step, we use the above parameters to generate changes in S and ν, using the
discretized versions of the continuous time stochastic processes for dS and dν:
S (t + ∆t)− S (t) = rS (t)∆t +√
ν(t)S(t)ε1(t)√
∆t (6)
12

ν(t + ∆t)− ν(t) = [θ − κν(t)]∆t + σ√
ν(t)ε2(t)√
∆t (7)
We set ∆t = 1/(365×24×2) and generate 10,000 changes over 30-minute intervals. We calculate
a change in the price of a typical call option of our sample (S = 5, 000, K = 5, 125, r = 0.041,
t = 0.22) using Heston’s formula and the simulated prices S(t + ∆t) and ν(t + ∆t).
The bottom row of Table 6 reports the simulated frequencies of type I violations based on the
two sets of parameter estimates for trade vs. no-trade periods and the parameter values used in
Bakshi, Cao, and Chen (2000) (page 577). All three violation frequencies are relatively close to
each other with the one based on no-trade periods being the lowest at 10.79%. For trade intervals
this frequency increases to 12.01%. Thus, we cannot explain the large difference between the trade
and no-trade intervals we document in Table 3. The violation frequency derived from the stochastic
volatility model that is fitted to the trades sub-sample is only 1.2 percentage points or 11.3% higher
than the frequency derived from the model fitted to the no-trades sub-sample. The 11.3% increase
in the violation frequency is about one-tenth of the observed increase in violations for the 30-minute
trade vs. no-trade intervals.
The violation rates of Table 6 are upper bounds for the explanatory potential of a stochastic
volatility model. A generated type I violation by the stochastic volatility model does not necessarily
coincide with an observed type I violation. There are two possible errors: the stochastic volatility
model can generate a violation where there is none or it can miss an observed violation. For
example, in Bakshi, Cao, and Chen (2000), the stochastic volatility model correctly predicts 47%
of the observed violations of type I, which corresponds to 55% of the total type I predictions
generated by the stochastic volatility model.
To determine whether similar results are obtained for our sample we randomly select one day
from each month of our sample and divide the twelve days into sixteen one-half hour intervals.
We fit a stochastic volatility model to all option prices within each interval by minimizing the
sum of squared pricing errors. Using the estimated parameters we compute the change in the
instantaneous volatility between two consecutive intervals and use it together with the observed
change in the stock index futures to compute the predicted change in the options’ mid-quotes
13
between the consecutive intervals. We compute the observed mid-quote change using the mid-
quotes prevailing at the beginning of each interval. For our sub-sample we observe 908 type I
violations out of which 55% are predicted by the stochastic volatility model. There are also 422
observations for which the stochastic volatility model predicts a violation of type I but no violation
is observed.
To summarize, we find that a stochastic volatility model can generate a frequency of violations
of type I of approximately the right order of magnitude. But the difference in generated violation
frequencies is small across trade and no-trade periods compared with the large difference observed in
our sample. Furthermore, the stochastic volatility model when fitted to the data correctly predicts
approximately half of the observed violations implying that approximately half of the violations are
unexplained by the stochastic volatility model and there is a substantial fraction of false positives.
So while a stochastic volatility model may accurately describe the cross-section of option prices and
quotes on lower frequencies it seems to fail to capture many aspects of high frequency co-movements
of the stock index and the option quotes. These findings suggest that there is considerable scope
for alternative explanations of the observed quote co-movements.
4.3 Stale Quotes and Adverse Selection
Stale quotes may explain why violations of type I and IV are more frequent around trades than at
other times. Stale quotes may attract traders because stale quotes typically imply a more favorable
price for either buyers or sellers. If the index futures but not the option quotes reflect recent
changes in the index we may observe a delayed quote revision for the options. A delayed quote
revision may cause violations because the quote changes for the options and the index futures are
asynchronous. For example, suppose the index futures quotes change by several ticks before the
trade, while the option quotes remain constant. After the trade, the option quotes are revised to
reflect the cumulative change in the index, which may cause the options quotes to change more
than the index futures quotes after a trade. As a consequence we may observe both more frequent
type I and type IV violations.
Adverse selection may also explain why violations of type I and IV are more frequent around
14

trades than at other times. Suppose some traders have private information about the value of
the index. Suppose the informed traders try to exploit their informational advantage in the index
futures and index options market. If they trade on their information in both markets it is possible
that we observe non-synchronous quote adjustments as trades in one market cause quotes in that
market to reflect some of the informed traders’ information that is not yet reflected in the quotes
of the other market. When information is first reflected in index futures quotes we may observe
that some option quotes are stale as discussed above. But if the new information is reflected in
the option quotes first we may observe that the index futures respond to quote revisions in the
options market. In such a situation, more frequent type I and IV violations may occur because we
observe option quote revisions that go in the wrong direction or are too large when compared to
contemporaneous index futures quote changes because they reflect new information. Subsequently
we may observe the opposite situation when the index futures quotes change to reflect information
that already is reflected in the option quotes.
Before examining whether stale quotes or adverse selection can explain the anomalous quote co-
movements we address an even more basic question: Do the option trades convey new information?
If option trades signal new information we may observe that the mid-quotes change after trades.
The results on absolute mid-quote changes reported in Tables 4 and 5 suggest that quotes do change
around the time of trades but do not tell us whether the quote changes are driven by the trades.
We therefore test the following non-informative option trades hypothesis: The expected change in
the option’s mid-quote after a buyer- or a seller-initiated trade from the time of the trade to τ
minutes after the trade is zero. Table 7 reports the mean changes in the option mid-quotes in the
5 minute period after buyer and seller initiated trades in the call and put options. Table 7 shows
that the quotes are revised upwards after buyer-initiated trades and downwards after seller-initiated
trades. In all cases the quote revisions are positive after buyer-initiated trades and negative after
seller-initiated trades. The ‘non-informative option trades’ hypothesis is rejected at the 1%-level for
all cases. Overall, the quote revisions are approximately 70% of the half-spread for buyer-initiated
trades and 56% for seller-initiated trades implying that the realized spread earned by the liquidity
provider is substantially smaller than the quoted spread; the liquidity providers earn 30% of the
15

quoted half-spread on buyer-initiated and 44% of the quoted half-spread on seller-initiated trades.
But the results of Table 7 are consistent with both adverse selection and stale quotes. If quotes
are stale at the time of the trade, then we should observe a positive quote revision following a
buyer-initiated trade, and a negative quote revision following a seller-initiated trade. If there is
adverse selection, then we should also observe a positive quote revision following a buyer-initiated
trade, and a negative quote revision following a seller-initiated trade. In both cases the liquidity
provider’s realized spread is smaller than the quoted spread. The difference is that in the former
case the quote revision follows a change in the index whereas in the latter case the trade itself may
be followed by a change in the index.
We can use the index futures quotes to distinguish between the adverse selection and stale quote
explanations. The option’s delta multiplied by the change in the index futures mid-quote provides
an implied change in the value of the option. The implied change is only an approximation since we
ignore time decay, the option’s gamma, and the difference between the index futures and the actual
index. But for the short time intervals we are interested in we believe the approximation error
is small enough to not affect the results. The descriptive statistics in Table 1 demonstrate that
the index futures are more frequently traded than the options and that the index futures quotes
are updated more frequently than the option quotes. It is therefore informative to ask whether
the index futures changes after buyer- and seller-initiated trades in the options are consistent with
adverse selection. We therefore test the following no adverse selection hypothesis: The expected
change in the index futures mid-quote, multiplied by the option’s delta, from the time of a trade
t to τ minutes after the trade is non-positive for a buyer-initiated trades and non-negative for a
seller-initiated trades. Table 8 reports the mean change in the index futures mid-quotes, multiplied
by the options’ delta, in the 5 minute period after call and put options trades. The top left
panel reports the mean changes for buyer-initiated trades in call options and the top right panel
reports the mean changes for seller-initiated trades in call options. The bottom panel reports the
corresponding results for put options. The top row of each panel reports the overall results, and
the next six rows report the results by three moneyness and three time to expiration categories.
The number of observations and the average half-spread at the time of the trades is reported next
16

to each mean change.
The average changes in the index futures mid-quote, multiplied by the option’s delta, are close
to zero in all cases. Overall, a small positive change is observed after buyer-initiated trades although
only the change for call options is significantly different from zero. For seller-initiated trades the
overall mean change is negative for call options and positive for put options, but in both cases we
do not reject the ‘no adverse selection’ hypothesis. The results suggest that the changes in the
option values implied by index futures quote changes after option trades are consistent with no
adverse selection.
The results above points to stale quotes as the more plausible explanation for the option quote
revisions reported in Table 7 following trades. If the option quotes are stale relative to the index
futures quotes we would observe that the index futures quotes imply a change in the option value
before a buyer- or seller-initiated trade. We therefore test the following no stale quotes hypothesis:
The expected change in the index futures mid-quote, multiplied by the option’s delta, from τ
minutes before a trade to the time of a trade is non-positive for a buyer-initiated trade and non-
negative for a seller-initiated trade. Table 9 reports the mean changes in the index mid-quotes,
multiplied by the options’ delta, from 5 minutes before buyer- and seller-initiated trades in the call
and put options to the time of the trade.9 In all cases the mean changes are positive for buyer-
initiated trades and negative for seller-initiated trades. We reject the ‘no stale quotes’ hypothesis in
all cases with the exception of two: The longest time to expiration buyer-initiated call category and
the longest time to expiration seller-initiated put category. Overall, the average change is around
30% of the half-spread for buyer-initiated trades and 16% of the half-spread for seller-initiated
trades suggesting that a substantial fraction of the option quote revisions reported in Table 7 are
actually implied by index futures changes before the trades occur.
Overall, the results in Table 7 together with the results in Tables 8 and 9 are consistent with stale
quotes in the sense that the index futures imply positive changes in the value of the options before
the buyer-initiated trades and negative changes in the value of the options before seller-initiated
trades.9The number of observations and the mean spreads differ slightly between Table 9 and Table 8 because some
observations lack valid quotes either before or after a trade.
17

Our results so far suggest stale quotes play a role but they do not imply the option quotes
do not change before trades; the above results simply imply that the options quotes at the time
of a trade are at least partly stale. From Table 9 we know that the index futures quotes change
systematically before option trades. If the option quotes partly reflect the changes in the option
values implied by the index futures quote we should observe positive option quote revisions before
buyer-initiated trades and negative quote revisions before seller-initiated trades. We therefore test
the following partial quote revision hypothesis: The expected change in the option’s mid-quote
from τ minutes before a trade to the time of a trade is non-positive for a buyer-initiated trade
and non-negative for a seller-initiated trade. Table 10 reports the mean changes in the option
mid-quotes from 5 minutes before a trade to the time of a trade for buyer- and seller-initiated
trades in the call and put options. While the delta-weighted index futures changes reported in
Table 9 imply that option mid-quotes—if not stale—increase before buyer-initiated trades and
decrease before seller-initiated trades we find the exact opposite pattern for option mid-quotes.
Before buyer-initiated trades the option mid-quote decreases and before seller-initiated trades the
option mid-quote increases. Overall, the increase is approximately 36% of the quoted spread for
buyer-initiated trades and the decrease is 41% of the quoted spread for seller-initiated trades. The
‘partial quote revision’ hypothesis is rejected in all cases with the exception of buyer-initiated trades
in at- and in-the-money put options.
The last set of results suggests that stale or partly stale quotes cannot be the whole story.
On average it appears that the mid-quotes change before trades, but that the mid-quote changes
are in a direction opposite of the one implied by the index futures quotes. The results suggest
that before the time of a trade the option quotes and the index futures quotes display anomalous
co-movements. To gain a better understanding of the trading behavior around the option trades
we examine in more detail the co-movements of the option and index futures quotes around buyer-
and seller-initiated option trades.
18

4.4 Trader Behavior Around Trades
Figure 1 plots, in event time, the average changes in the mid-quotes of the index futures (thick solid
line) and the index options (dotted line) around buyer-initiated trades in the call and put options.
For each trade the series of mid-quotes are normalized so that changes are measured relative to the
index futures mid-quote and the option mid-quote at the time of each trade. Note that unlike the
results in Tables 8 and 9 we do not multiply the index futures quote change by the option’s delta.
Changes are plotted for every 10 second interval from 15 minutes before a trade to 15 minutes after
a trade. The normalized bid quote for the index option is plotted with a dashed-dotted line and
the normalized ask quote is plotted with a dashed line.10
Before a buyer-initiated trade the index mid-quote increases for call options and decreases for
put options. The increase starts at about five minutes before the trade for calls and up to 15
minutes before the trade for puts although the most rapid change occurs in the last few minutes
before the trade. If the value of the call option is increasing and the value of the put option is
decreasing in the underlying index, the observed movements are consistent with the trade resulting
from a stale limit order being picked off by a market order.
Figure 2 plots the corresponding picture for seller-initiated trades. The pattern of the index
mid-quote changes is the reverse for seller-initiated trades. The index return is negative over our
sample period which may explain why the average index decrease is larger in absolute value.
The changes in the index futures mid-quote are consistent with the 5-minute changes reported
in Table 9. The relatively small changes in the index futures mid-quote after a trade are consistent
with the results in Table 8.
The increase in the option mid-quote after a buyer-initiated trade is at least partly due to the
ask quote shifting up; on average the bid quote has already adjusted before the buyer-initiated
trade. Similarly for seller-initiated trades the decrease in the mid-quote after a trade is partly
driven by a decrease in the bid quote. The above evidence is consistent with the quotes being stale
at the time of the trade.10Unconditionally, the index futures mid-quotes are slightly positively autocorrelated for very short horizons. The
first-order autocorrelation coefficient for minute-by-minute mid-quote returns is 0.08 and we reject the null of zeroautocorrelation at the 1% level or better. Higher-order autocorrelations are close to zero.
19

But the discrete negative jump in the ask quote within the last minute before a buyer-initiated
trade and the discrete positive jump in the bid quote before a seller-initiated trade are not consistent
with stale quotes. The plots show why the ‘partial quote revision’ hypothesis was rejected. In the
case of stale quotes we would expect that the passive side of the trade—the ask quote for buyer-
initiated trades and the bid quote for seller-initiated trades—would be a quote that has been in
effect for some time and therefore does not reflect all available information including the recent
changes in the index futures quote. But the plots show that instead the ask quote for buyer-initiated
trades and the bid quote for seller-initiated trades are submitted shortly before the trade so the
quotes are not stale.
The discrete negative jump in the ask quote before a buyer-initiated trade and the discrete
positive jump in the bid quote before a seller-initiated trade are puzzling. They contradict the
stale quote explanation because the quotes involved in the trades are evidently not stale. Yet, the
jumps are hard to reconcile with standard quote updating since they are in a direction opposite
to that implied by the change in the underlying index. In principle, such updates could reflect
innovations in expected volatility that are negatively correlated with innovations in the underlying
asset, but that seems doubtful given the symmetric update patterns across calls and puts. In the
next section we examine the quote co-movements more closely by splitting the trades into aggressive
quotes that involve a discrete jump and stale quotes that involve no quote change prior to a trade.
4.4.1 Aggressive Quotes versus Stale Quotes
To potentially distinguish between different trading behaviors we separate our sample of trades
into three categories: The first category contains all buyer-initiated trades for which the option’s
ask quote was not updated during the 30 seconds prior to the trade. The second category contains
all seller-initiated trades for which the option’s bid quote was not updated during the 30 seconds
prior to the trade, and the third category contains all remaining options.11 We refer to the first
two categories as the stale quote categories. The third category, which we refer to as the aggressive
quote category, contains approximately 35% of all call option trades, and 37% of all put option11The choice of thirty seconds is arbitrary. We have also used 60 seconds and 45 seconds, with virtually the same
results.
20

trades.
Figures 3 and 4 plot the mean of the normalized mid-quotes series for the index futures and
the mean of the normalized ask, bid, and mid-quotes for the options. Each option quote series is
normalized by subtracting the option mid-quote at the time of the trade, and each index futures
mid-quote series is normalized by subtracting the index future mid-quote value at the time of the
trade.
The index movements prior to the trade and the behavior of the ask and bid quote series around
the trade are different for the stale quote and aggressive quote categories. The top sub-plots of
Figure 3 show the series for seller-initiated trades for which the option’s mid-quote changed in the
30 seconds prior to the trade. The index movements before and after the trade exhibit a slight
downward trend but there are no drastic changes over the 30-minute window. The ask quote series
is relatively smooth, but the bid quote series contains—on average—a positive jump of almost 6
ticks at the time of the trade. Compared to the jump of Figure 2, it is more than 50% larger. Note
that the bid reverts to its level before the trade shortly after the trade; consistent with that, there
does not appear to be a systematic revision in the option’s mid-quote after the trade ignoring the
jump.
The bottom sub-plots of Figure 3 show that on average the index decreases by about 12 ticks
before seller-initiated trades in the calls and increases by about 10 ticks before seller-initiated trades
in the puts. The directions of the quote changes for both call and put options are consistent with
stale quotes being picked off. Consistent with a stale quotes explanation, the bid and mid-quotes
are revised downward post trade. Figure 4 shows the corresponding figures for buyer-initiated
trades. Figure 4 demonstrates that the patterns described for seller-initiated trades also hold for
buyer-initiated trades.
By splitting the sample into the two groups, we demonstrate that there are two scenarios for
trades. In the first scenario, stale quotes are picked off. In the second scenario, traders post
aggressive bid and ask quotes right before a trade. In the next section we revisit the violations and
examine whether the violation rates differ for trades associated with aggressive and stale quotes.
21

4.4.2 Frequency of Violations Revisited
Table 11 reports the violation frequencies of one-minute intervals centered around trades, similar
to the lower half of the call and put panel of Table 3. We use the three categories obtained by the
separation of trades into trades most likely caused by stale quotes and trades caused by liquidity
seeking behavior, either through an aggressive ask or bid quote. For each option trade, we again
construct 30 one-minute intervals centered around the trade (which are potentially overlapping for
different trades). We aggregate the intervals into three groups, the one-minute intervals immediately
before the trade, immediately after the trade, and all other one-minute intervals, and document
average violation frequencies for all such intervals.
Table 3 demonstrates that there are different violation patterns for quotes in the two minutes
immediately surrounding the trades and the other 28 one-minute intervals, but that there is no
substantial difference in the one-minute pre- and post-trade. Table 11 shows that there is a consid-
erable difference in violations within the two one-minute intervals surrounding the trade once we
separate them into trades against stale quotes and trade against aggressive quotes. Violations I and
IV are much less likely in the minute prior to the trade for both call and put options when quotes
are stale, but in the minute after the trades, the quotes often generate such violations consistent
with the quotes being adjusted to the index changes plotted in Figures 3 and 4.
The last six rows of the call and put panel of Table 11 shows that around trades preceded by
aggressive quotes violations of type I and IV occur both before and after a trade with approximately
the same frequencies. This makes sense because the aggressive quotes appear to be submitted
independently of index movements (see the upper subplots of Figures 3 and 4), and they undercut
the current ask or bid by multiple tick sizes. After the trade, the ask or bid revert to their pre-
trade level, and if the index movement surrounding the trade is small, or moving in the opposite
direction, we observe a type IV or type I violation. Interestingly, the differences in violation rates
for the three categories is small for the other intervals surrounding the trade.
22

5 Conclusions
We re-examine the role of market microstructure effects in explaining the anomalous co-movements
of index options and futures quotes first reported by Bakshi, Cao, and Chen (2000). We show that
the frequency of co-movements that are inconsistent with the predictions of standard option pricing
models is much higher in periods around option trades and that the patterns of co-movements
around option trades are consistent with specific order submission strategies.
We show that in our sample a stochastic volatility model can explain approximately half of the
observed negative co-movements for call options but it does not explain the higher frequency of
such co-movements around option trades. Overall our results imply that market microstructure
effects play a bigger role in explaining high frequency co-movements of index options and index
futures quotes.
One promising direction for future research is to consider model frameworks that combine some
of the key elements of traders’ order submission behavior with some plausible pricing model. Such
frameworks may, for example, be useful in refining the types of high-frequency pricing and hedging
approaches used by Bossaerts and Hillion (2003). Such frameworks may also allow us to draw useful
inference about the motives for option trading from high frequency options data.
23

References
Bakshi, G., C. Cao, and Z. Chen, 1997, Empirical Performance of Alternative Option PricingModels, Journal of Finance 52, 2003-2049.
Bakshi, G., C. Cao, and Z. Chen, 2000, Do Call Prices and the Underlying Stock Always Move inthe Same Direction?, Review of Financial Studies 13, 549-584.
Bergman, Y., B. Grundy, and Z. Wiener, 1996, General Properties of Option Prices, Journal ofFinance 51, 1573-1610.
Bossaerts, P. and P. Hillion, 1997, Local Parametric Analysis of Hedging in Discrete Time, Journalof Econometrics 81, 243-272.
Bossaerts, P. and P. Hillion, 2003, Local Parametric Analysis of Derivatives Pricing and Hedging,Journal of Financial Markets 6, 573-605.
Dennis, P. and S. Mayhew, 2003, Microstructural Biases in Empirical Tests of Option PricingModels, working paper, University of Virginia.
Heston, S., 1993, A Closed-Form Solution for Options with Stochastic Volatility with Applicationsto Bond and Currency Options, Review of Financial Studies 6, 1049-1075.
LIFFE trading statistics, downloaded from http://www.liffe.com/liffedata/contracts/monthly.csvon August 15, 2002.
Savickas, R., and A. Wilson, 2003, On Inferring the Direction of Option Trades, Journal of Fi-nancial And Quantitative Analysis 38, 881-902.
24

Table 1: Descriptive Statistics
Call Options Put Options Index FuturesVariable Mean Std.Dev. Mean Std.Dev. Mean Std.Dev.Quoted bid-ask spread [£] 8.7 5.9 8.6 5.8 1.5 1.0Mid-quote 126.9 105.3 128.8 111.7 5003.1 386.1Quoted depth 17.3 13.6 18.8 14.5 3.1 3.9Trade size 17.0 71.3 19.7 60.4 3.4 7.2
Number of trades 29,456 36,227 2,433,108Number of quote updates 4,135,543 4,103,832 5,953,337
The first four rows of the table report the mean and the standard deviation for the quoted bid-askspread, the mid-quote, the quoted depth, and the trade size for index call options, put options, andindex futures. The bottom two rows report the total number of trades and quote updates. A quoteupdate is defined as a change in either the best bid or ask quote or in the best bid or ask depth.The depth and the trade size are measured in number of contracts. The depth is the average of thebid depth and the ask depth at the best quotes.
25

Table 2: Descriptive Statistics by the Options’ Moneyness and Time to Expiration
Bid-ask Mid-quote Quoted No. of quote No. of Tradespread depth updates Trades size
Call optionsMoneynessout-of-the-money 8.9 81.4 19.3 10,074.2 73.1 20.9at-the-money 8.4 140.1 16.2 14,940.1 46.6 10.8in-the-money 12.0 373.7 14.9 1,353.2 5.7 19.5Time to Expirationless than 2 months 7.4 103.0 16.4 19,031.0 99.3 15.12 to 6 months 10.2 171.6 18.8 5,455.2 19.6 20.6more than 6 months 18.6 238.4 22.6 1,764.1 6.1 40.5
Put optionsMoneynessout-of-the-money 8.4 75.2 20.8 10,351.6 87.2 24.7at-the-money 8.3 139.1 17.6 14,017.7 53.6 13.6in-the-money 12.0 377.3 16.8 2,040.3 13.0 9.6Time to Expirationless than 2 months 7.4 106.1 18.0 19,325.3 117.6 19.72 to 6 months 9.7 177.1 20.1 5,333.1 28.1 19.6more than 6 months 18.0 228.6 23.6 1,588.3 8.2 20.1
The table reports, for call and put options, the means of six variables for the call and the putoptions for two sub-samples based on the options’ moneyness and time to expiration. A calloption’s moneyness depends on the ratio of its strike price to the underlying; if the ratio is lessthan 0.97 the call is out-of-the-money; if the ratio is between 0.97 and 1.03 it is at-the-money; andif the ratio is above 1.03 it is in-the-money. Put options are classified similarly using the underlyingdivided by the strike price. Means for the following six variables are reported: the quoted bid-askspread, the mid-quote, the quoted depth, the daily number of quote updates, the daily number oftrades, and the trade size. A Wilcoxon test rejects the null hypothesis of equal median values foreach variable across the moneyness and time to expiration categories for all cases with p-values lessthan 0.001.
26
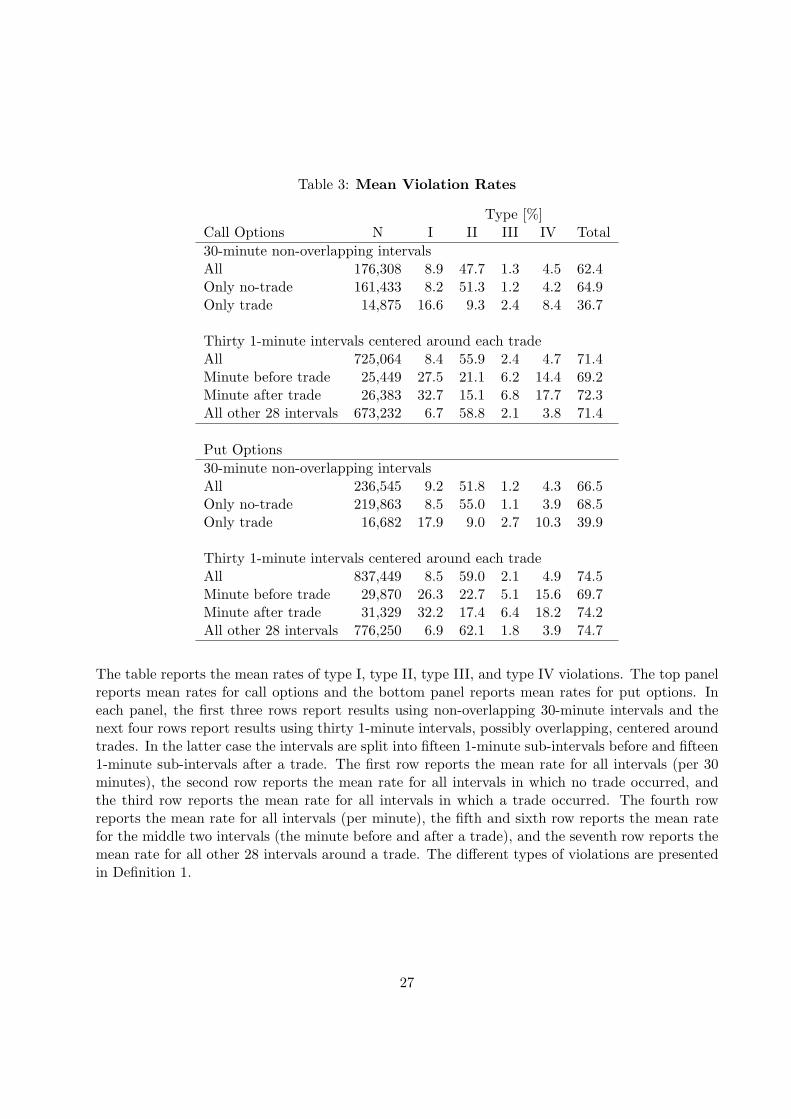
Table 3: Mean Violation Rates
Type [%]Call Options N I II III IV Total30-minute non-overlapping intervalsAll 176,308 8.9 47.7 1.3 4.5 62.4Only no-trade 161,433 8.2 51.3 1.2 4.2 64.9Only trade 14,875 16.6 9.3 2.4 8.4 36.7
Thirty 1-minute intervals centered around each tradeAll 725,064 8.4 55.9 2.4 4.7 71.4Minute before trade 25,449 27.5 21.1 6.2 14.4 69.2Minute after trade 26,383 32.7 15.1 6.8 17.7 72.3All other 28 intervals 673,232 6.7 58.8 2.1 3.8 71.4
Put Options30-minute non-overlapping intervalsAll 236,545 9.2 51.8 1.2 4.3 66.5Only no-trade 219,863 8.5 55.0 1.1 3.9 68.5Only trade 16,682 17.9 9.0 2.7 10.3 39.9
Thirty 1-minute intervals centered around each tradeAll 837,449 8.5 59.0 2.1 4.9 74.5Minute before trade 29,870 26.3 22.7 5.1 15.6 69.7Minute after trade 31,329 32.2 17.4 6.4 18.2 74.2All other 28 intervals 776,250 6.9 62.1 1.8 3.9 74.7
The table reports the mean rates of type I, type II, type III, and type IV violations. The top panelreports mean rates for call options and the bottom panel reports mean rates for put options. Ineach panel, the first three rows report results using non-overlapping 30-minute intervals and thenext four rows report results using thirty 1-minute intervals, possibly overlapping, centered aroundtrades. In the latter case the intervals are split into fifteen 1-minute sub-intervals before and fifteen1-minute sub-intervals after a trade. The first row reports the mean rate for all intervals (per 30minutes), the second row reports the mean rate for all intervals in which no trade occurred, andthe third row reports the mean rate for all intervals in which a trade occurred. The fourth rowreports the mean rate for all intervals (per minute), the fifth and sixth row reports the mean ratefor the middle two intervals (the minute before and after a trade), and the seventh row reports themean rate for all other 28 intervals around a trade. The different types of violations are presentedin Definition 1.
27

Table 4: Violation Rates and Moneyness and Time to Expiration—Call Options
Time to ExpirationMonyeness less than 2 2-6 months more than 6out-of-the-money
ViolationsI 11.1 (18.7) 8.6 (22.6) 6.8 (22.6)II 50.4 (13.5) 55.5 (11.8) 50.2 (13.3)III 1.3 (2.6) 1.1 (2.5) 1.7 (2.4)IV 2.4 (4.1) 2.8 (8.8) 3.1 (8.1)Total 65.2 (38.9) 68.0 (45.7) 61.8 (46.4)Mean of absolute mid-quote changeOption 1.1 (2.6) 1.3 (3.4) 1.4 (3.6)Index Futures 9.5 (12.3) 9.3 (10.9) 8.0 (10.9)
at-the-moneyViolationsI 7.9 (11.9) 7.5 (14.4) 6.4 (20.7)II 32.1 (4.4) 44.4 (6.0) 51.3 (4.6)III 1.5 (2.1) 1.3 (2.7) 1.5 (3.4)IV 6.7 (9.8) 6.8 (15.3) 6.8 (17.2)Total 48.2 (28.2) 60.0 (38.4) 65.9 (45.9)Mean of absolute mid-quote changeOption 3.0 (4.9) 2.8 (5.8) 2.3 (7.7)Index Futures 8.6 (10.2) 8.7 (10.1) 7.8 (8.7)
in-the-moneyViolationsI 4.3 (20.3) 3.5 (23.0) 3.1 (∗)II 80.2 (5.9) 81.1 (8.2) 76.0 (∗)III 0.5 (1.7) 0.3 (1.6) 0.8 (∗)IV 4.3 (31.8) 3.6 (27.9) 3.9 (∗)Total 89.3 (59.7) 88.5 (60.7) 83.8 (∗)Mean of absolute mid-quote changeOption 1.7 (14.5) 1.3 (10.0) 1.0 (∗)Index Futures 9.1 (13.6) 9.3 (10.3) 8.0 (∗)
∗ Less than 25 observations and thus omitted.
The table reports mean rate of type I, type II, type III, type IV and the total rate violations for call options bymoneyness and time to expiration categories, each as a percentage of total numbers of 30-minutes intervals.A call option’s moneyness depends on the ratio of its strike price to the underlying; if the ratio is less than0.97 the call is out-of-the-money; if the ratio is between 0.97 and 1.03 it is at-the-money; and if the ratio isabove 1.03 it is in-the-money. The mean rate for intervals with a trade are reported in parenthesis next tothe mean rates for intervals with no trade. The mean absolute mid-quote change for the call options and theindex futures are reported below the total violation rates. The mean absolute mid-quote change for intervalswith a trade is reported in parenthesis next to the mean for no-trade intervals. The mid-quote changes aremeasured in pounds and for the index futures the nearest-to-maturity index futures are used.
28

Table 5: Violation Rates and Moneyness and Time to Expiration—Put Options
Time to ExpirationMonyeness less than 2 2-6 months more than 6out-of-the-money
ViolationsI 10.6 (20.2) 8.6 (24.0) 8.3 (24.9)II 54.5 (12.5) 60.0 (12.8) 55.4 (11.4)III 1.0 (2.1) 1.1 (3.1) 1.4 (1.3)IV 2.3 (5.4) 2.6 (7.6) 3.0 (9.1)Total 67.4 (40.2) 72.3 (47.5) 68.1 (46.7)Mean of absolute mid-quote changeOption 0.9 (2.7) 1.1 (3.6) 1.1 (3.7)Index Futures 8.9 (11.6) 8.9 (11.1) 8.2 (11.1)
at-the-moneyViolationsI 8.6 (11.6) 8.1 (15.8) 7.9 (18.6)II 32.0 (4.1) 43.5 (5.2) 51.4 (6.8)III 1.5 (2.3) 1.1 (3.4) 1.4 (3.4)IV 7.0 (10.8) 6.6 (14.3) 6.1 (25.4)Total 49.1 (28.8) 59.3 (38.7) 66.8 (54.2)Mean of absolute mid-quote changeOption 3.1 (6.1) 2.8 (6.7) 2.3 (7.5)Index Futures 8.6 (11.7) 9.0 (11.5) 8.4 (11.0)
in-the-moneyViolationsI 4.3 (22.9) 3.7 (22.2) 5.2 (25.0)II 80.0 (7.5) 78.1 (11.1) 71.8 (3.1)III 0.6 (6.3) 0.8 (8.1) 1.1 (12.5)IV 5.1 (30.4) 4.5 (26.2) 5.4 (28.1)Total 90.0 (67.1) 87.1 (67.6) 83.5 (68.7)Mean of absolute mid-quote changeOption 2.0 (17.6) 1.8 (17.7) 2.0 (9.1)Index Futures 10.4 (14.1) 10.5 (13.8) 9.3 (6.4)
The table reports mean rate of type I, type II, type III, type IV and the total rate violations for put options bymoneyness and time to expiration categories, each as a percentage of total numbers of 30-minutes intervals.A put option’s moneyness depends on the ratio of the underlying to its strike price to; if the ratio is lessthan 0.97 the call is out-of-the-money; if the ratio is between 0.97 and 1.03 it is at-the-money; and if theratio is above 1.03 it is in-the-money. The mean rate for intervals with a trade are reported in parenthesisnext to the mean rates for intervals with no trade. The mean absolute mid-quote change for the call optionsand the index futures are reported below the total violation rates. The mean absolute mid-quote changefor intervals with a trade is reported in parenthesis next to the mean for no-trade intervals. The mid-quotechanges are measured in pounds and for the index futures the nearest-to-maturity index futures are used.
29

Table 6: Stochastic Volatility Model Parameters and Simulated Violation Frequencies
The first six rows of the table report three different sets of daily average parameter estimates for astochastic volatility model. The first column labeled ‘Trades’ reports the parameters using trans-action prices for all options with that with moneyness between 0.85 and 1.15 and time-to-maturityof more than one week. The second column labeled ‘No-Trade’ reports the daily average parameterestimates using the end-of-day mid-quotes for options with moneyness between 0.85 and 1.15 andtime-to-maturity of more than one week. The third column reports the corresponding parametervalues of Bakshi, Cao, and Chen (2000). The bottom row reports the simulated frequencies ofviolation of Type I corresponding to each set of parameters values.
Parameter Trade No-Trade BCC (2000)κ 2.455 4.190 2.180θ 0.103 0.029 0.080σ 0.663 0.463 0.530ρ -0.697 -0.527 -0.700ν 0.038 0.031 0.023√
ν 0.195 0.176 0.150Type I Violations 12.01% 10.79% 12.79%
30

Table 7: Option Mid-quote Changes 5 Minutes After Option Trades
Buyer initiated Seller initiatedN Spread Change N Spread Change
Call options
All 13,795 2.15 1.60∗∗ 14,705 2.31 -1.23∗∗
Moneynessout-of-the-money 8,045 1.98 1.41∗∗ 7,878 2.10 -1.07∗∗
at-the-money 5,153 2.21 1.69∗∗ 6,170 2.46 -1.30∗∗
in-the-money 597 3.97 3.37∗∗ 657 3.49 -2.54∗∗
Expirationless than 2 months 11,128 1.99 1.57∗∗ 11,787 2.20 -1.17∗∗
2-6 months 2,145 2.79 1.75∗∗ 2,291 2.67 -1.35∗∗
more than 6 months 522 2.93 1.67∗∗ 627 3.06 -1.85∗∗
Put options
All 17,040 2.40 1.57∗∗ 17,888 2.45 -1.44∗∗
Moneynessout-of-the-money 9,641 1.93 1.29∗∗ 9,698 1.91 -1.07∗∗
at-the-money 5,937 2.67 1.85∗∗ 6,419 2.73 -1.70∗∗
in-the-money 1,462 4.37 2.31∗∗ 1,771 4.36 -2.46∗∗
Expirationless than 2 months 12,960 2.24 1.58∗∗ 14,065 2.31 -1.36∗∗
2-6 months 3,238 2.89 1.52∗∗ 3,083 2.98 -1.77∗∗
more than 6 months 842 3.01 1.72∗∗ 740 2.77 -1.46∗∗
The table reports for all option trades the mean change in the option’s mid-quote from the time of a tradeto 5 minutes after the trade. The top panel reports the means for call options and the bottom panel reportsthe means for put options. The means for buyer initiated trades are reported on the left and the meansfor seller initiated trades on the right. The number of observations and the mean quoted half-spread at thetime of a trade are reported next to the mean changes for each category. A ∗∗ indicates that the change isstatistically significant at the 1% level or better.
31

Table 8: Index Mid-quote Changes 5 Minutes After Option Trades
Buyer initiated Seller initiatedDelta∗ Delta∗
N Spread Change N Spread Change
Call options
All 14,190 2.01 0.05∗∗ 15,110 2.25 -0.04Moneynessout-of-the-money 8,458 1.86 0.01 8,315 2.15 -0.06at-the-money 5,163 2.07 -0.15∗∗ 6,178 2.30 -0.06in-the-money 569 3.62 0.16 617 3.17 0.27
Expirationless than 2 months 11,497 1.84 0.06∗∗ 12,113 2.11 0.042-6 months 2,186 2.66 0.02 2,343 2.67 0.00more than 6 months 507 2.90 0.13 654 3.40 0.22∗∗
Put options
All 17,700 2.14 0.08 18,553 2.23 0.01Moneynessout-of-the-money 10,401 1.87 0.03 10,452 1.85 0.02at-the-money 5,939 2.28 0.08 6,458 2.41 0.04in-the-money 1,360 3.57 0.39 1,643 3.88 -0.06
Expirationless than 2 months 13,347 1.99 0.09 14,669 2.08 0.032-6 months 3,480 2.59 0.01 3,110 2.77 0.04more than 6 months 873 2.59 0.09∗ 774 2.84 0.06
The table reports for all option trades the mean changes in the index futures mid-quote from the time of atrade to 5 minutes after the trade multiplied by the option’s delta. The top panel reports the means for calloptions and the bottom panel reports the means for put options. The means for buyer initiated trades arereported on the left and the means for seller initiated trades on the right. The number of observations andthe mean quoted half-spread at the time of a trade are reported next to the mean changes for each category.A ∗ (∗∗) indicates that the change is statistically significant at the 5% (1%) level or better.
32

Table 9: Index Mid-quote Changes 5 Minutes Before Option Trades
Buyer initiated Seller initiatedDelta∗ Delta∗
N Spread Change N Spread Change
Call options
All 13,910 1.98 0.51∗∗ 14,740 2.23 -0.28∗∗
Moneynessout-of-the-money 8,305 1.85 0.24∗∗ 8,135 2.14 -0.19∗∗
at-the-money 5,043 2.04 0.75∗∗ 5,996 2.27 -0.34∗∗
in-the-money 562 3.58 2.29∗∗ 609 3.15 -1.06∗∗
Expirationless than 2 months 11,248 1.82 0.59∗∗ 11,795 2.09 -0.28∗∗
2-6 months 2,162 2.64 0.26∗∗ 2,296 2.65 -0.30∗∗
more than 6 months 500 2.86 0.03 649 3.41 -0.31∗∗
Put options
All 17,444 2.13 0.77∗∗ 18,284 2.22 -0.45∗∗
Moneynessout-of-the-money 10,273 1.87 0.25∗∗ 10,327 1.85 -0.13∗∗
at-the-money 5,825 2.26 1.42∗∗ 6,329 2.40 -0.81∗∗
in-the-money 1,346 3.57 1.98∗∗ 1,628 3.88 -1.04∗∗
Expirationless than 2 months 13,125 1.98 0.84∗∗ 14,427 2.07 -0.48∗∗
2-6 months 3,452 2.58 0.55∗∗ 3,085 2.77 -0.33∗∗
more than 6 months 867 2.59 0.55∗∗ 772 2.84 -0.20
The table reports for all option trades the mean changes in the index futures mid-quote from 5 minutesbefore a trade to the time of a trade multiplied by the option’s delta. The top panel reports the means forcall options and the bottom panel reports the means for put options. The means for buyer initiated tradesare reported on the left and the means for seller initiated trades on the right. The number of observationsand the mean quoted half-spread at the time of a trade are reported next to the mean changes for eachcategory. A ∗∗ indicates that the change is statistically significant at the 1% level or better.
33

Table 10: Option Mid-quote Changes 5 Minutes Before Option Trades
Buyer initiated Seller initiatedN Spread Change N Spread Change
Call options
All 10,944 1.97 -0.94∗∗ 11,540 2.18 0.90∗∗
Moneynessout-of-the-money 6,230 1.83 -1.03∗∗ 5,969 2.00 0.82∗∗
at-the-money 4,456 2.05 -0.89∗∗ 5,313 2.32 0.89∗∗
in-the-money 258 4.01 0.57 258 3.41 3.03∗∗
Expirationless than 2 months 9,434 1.86 -0.83∗∗ 9,855 2.11 0.85∗∗
2-6 months 1,308 2.59 -1.57∗∗ 1,423 2.54 1.12∗∗
more than 6 months 202 2.77 -2.04∗∗ 262 2.98 1.55∗∗
Put options
All 12,409 2.23 -0.55∗∗ 13,016 2.23 0.93∗∗
Moneynessout-of-the-money 6,754 1.82 -0.99∗∗ 6,877 1.77 0.86∗∗
at-the-money 5,097 2.52 -0.09 5,449 2.54 0.92∗∗
in-the-money 558 4.43 0.66∗ 690 4.28 1.86∗∗
Expirationless than 2 months 10,178 2.13 -0.45∗∗ 11,000 2.14 0.84∗∗
2-6 months 1,833 2.70 -0.99∗∗ 1,711 2.69 1.43∗∗
more than 6 months 398 2.49 -1.00∗∗ 305 2.71 1.67∗∗
The table reports for all option trades the mean changes in the option’s mid-quote from 5 minutes before atrade to the time of a trade. The top panel reports the means for call options and the bottom panel reportsthe means for put options. The means for buyer initiated trades are reported on the left and the meansfor seller initiated trades on the right. The number of observations and the mean quoted half-spread at thetime of a trade are reported next to the mean changes for each category. A ∗∗ indicates that the change isstatistically significant at the 1% level or better.
34
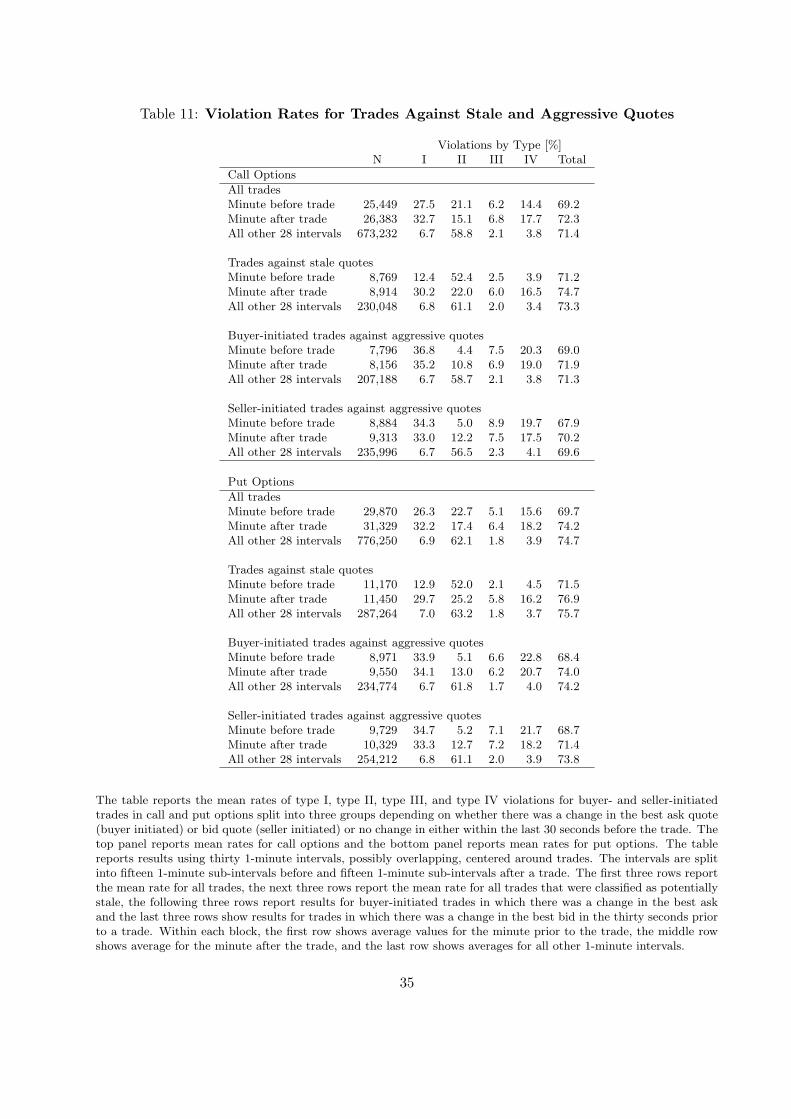
Table 11: Violation Rates for Trades Against Stale and Aggressive Quotes
Violations by Type [%]N I II III IV Total
Call Options
All tradesMinute before trade 25,449 27.5 21.1 6.2 14.4 69.2Minute after trade 26,383 32.7 15.1 6.8 17.7 72.3All other 28 intervals 673,232 6.7 58.8 2.1 3.8 71.4
Trades against stale quotesMinute before trade 8,769 12.4 52.4 2.5 3.9 71.2Minute after trade 8,914 30.2 22.0 6.0 16.5 74.7All other 28 intervals 230,048 6.8 61.1 2.0 3.4 73.3
Buyer-initiated trades against aggressive quotesMinute before trade 7,796 36.8 4.4 7.5 20.3 69.0Minute after trade 8,156 35.2 10.8 6.9 19.0 71.9All other 28 intervals 207,188 6.7 58.7 2.1 3.8 71.3
Seller-initiated trades against aggressive quotesMinute before trade 8,884 34.3 5.0 8.9 19.7 67.9Minute after trade 9,313 33.0 12.2 7.5 17.5 70.2All other 28 intervals 235,996 6.7 56.5 2.3 4.1 69.6
Put Options
All tradesMinute before trade 29,870 26.3 22.7 5.1 15.6 69.7Minute after trade 31,329 32.2 17.4 6.4 18.2 74.2All other 28 intervals 776,250 6.9 62.1 1.8 3.9 74.7
Trades against stale quotesMinute before trade 11,170 12.9 52.0 2.1 4.5 71.5Minute after trade 11,450 29.7 25.2 5.8 16.2 76.9All other 28 intervals 287,264 7.0 63.2 1.8 3.7 75.7
Buyer-initiated trades against aggressive quotesMinute before trade 8,971 33.9 5.1 6.6 22.8 68.4Minute after trade 9,550 34.1 13.0 6.2 20.7 74.0All other 28 intervals 234,774 6.7 61.8 1.7 4.0 74.2
Seller-initiated trades against aggressive quotesMinute before trade 9,729 34.7 5.2 7.1 21.7 68.7Minute after trade 10,329 33.3 12.7 7.2 18.2 71.4All other 28 intervals 254,212 6.8 61.1 2.0 3.9 73.8
The table reports the mean rates of type I, type II, type III, and type IV violations for buyer- and seller-initiatedtrades in call and put options split into three groups depending on whether there was a change in the best ask quote(buyer initiated) or bid quote (seller initiated) or no change in either within the last 30 seconds before the trade. Thetop panel reports mean rates for call options and the bottom panel reports mean rates for put options. The tablereports results using thirty 1-minute intervals, possibly overlapping, centered around trades. The intervals are splitinto fifteen 1-minute sub-intervals before and fifteen 1-minute sub-intervals after a trade. The first three rows reportthe mean rate for all trades, the next three rows report the mean rate for all trades that were classified as potentiallystale, the following three rows report results for buyer-initiated trades in which there was a change in the best askand the last three rows show results for trades in which there was a change in the best bid in the thirty seconds priorto a trade. Within each block, the first row shows average values for the minute prior to the trade, the middle rowshows average for the minute after the trade, and the last row shows averages for all other 1-minute intervals.
35
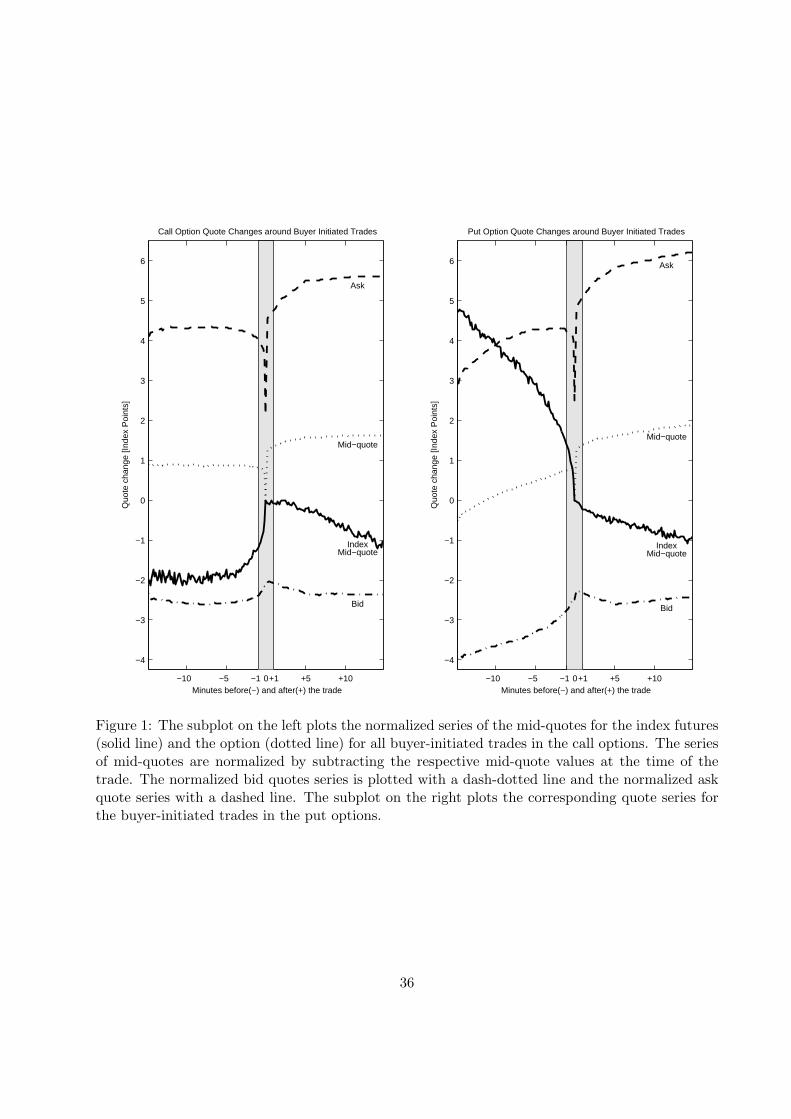
−10 −5 −1 0+1 +5 +10
−4
−3
−2
−1
0
1
2
3
4
5
6
Call Option Quote Changes around Buyer Initiated Trades
Mid−quote
IndexMid−quote
Ask
Bid
Quo
te c
hang
e [In
dex
Poi
nts]
Minutes before(−) and after(+) the trade−10 −5 −1 0+1 +5 +10
−4
−3
−2
−1
0
1
2
3
4
5
6
Put Option Quote Changes around Buyer Initiated Trades
Mid−quote
IndexMid−quote
Ask
Bid
Quo
te c
hang
e [In
dex
Poi
nts]
Minutes before(−) and after(+) the trade
Figure 1: The subplot on the left plots the normalized series of the mid-quotes for the index futures(solid line) and the option (dotted line) for all buyer-initiated trades in the call options. The seriesof mid-quotes are normalized by subtracting the respective mid-quote values at the time of thetrade. The normalized bid quotes series is plotted with a dash-dotted line and the normalized askquote series with a dashed line. The subplot on the right plots the corresponding quote series forthe buyer-initiated trades in the put options.
36

−10 −5 −1 0+1 +5 +10−6
−5
−4
−3
−2
−1
0
1
2
3
Call Option Quote Changes around Seller Initiated Trades
Mid−quote
IndexMid−quote
Ask
Bid
Quo
te c
hang
e [In
dex
Poi
nts]
Minutes before(−) and after(+) the trade−10 −5 −1 0+1 +5 +10
−6
−5
−4
−3
−2
−1
0
1
2
3
Put Option Quote Changes around Seller Initiated Trades
Mid−quote
IndexMid−quote
Ask
Bid
Quo
te c
hang
e [In
dex
Poi
nts]
Minutes before(−) and after(+) the trade
Figure 2: The subplot on the left plots the normalized series of the mid-quotes for the index futures(solid line) and the option (dotted line) for all seller-initiated trades in the call options. The seriesof mid-quotes are normalized by subtracting the respective mid-quote values at the time of thetrade. The normalized bid quotes series is plotted with a dash-dotted line and the normalized askquote series with a dashed line. The subplot on the right plots the corresponding quote series forthe seller-initiated trades in the put options.
37

−10 −5 −1 0+1 +5 +10−6
−4
−2
0
2
4
6
Calls−−Seller Initiated−−Aggressive Quote
Mid−quote
IndexMid−quote
Ask
Bid
Quo
te c
hang
e [In
dex
Poi
nts]
Minutes before(−) and after(+) the trade−10 −5 −1 0+1 +5 +10
−6
−4
−2
0
2
4
6
Puts−−Seller Initiated−−Aggressive Quote
Mid−quote
IndexMid−quote
Ask
Bid
Quo
te c
hang
e [In
dex
Poi
nts]
Minutes before(−) and after(+) the trade
−10 −5 −1 0+1 +5 +10−6
−4
−2
0
2
4
6
Calls−−Seller Initiated−−Stale Quote
Mid−quote
IndexMid−quote
Ask
Bid
Quo
te c
hang
e [In
dex
Poi
nts]
Minutes before(−) and after(+) the trade−10 −5 −1 0+1 +5 +10
−6
−4
−2
0
2
4
6
Puts−−Seller Initiated−−Stale Quote
Mid−quote
IndexMid−quote
Ask
Bid
Quo
te c
hang
e [In
dex
Poi
nts]
Minutes before(−) and after(+) the trade
Figure 3: The top left subplot plots the normalized series of the mid-quotes for the index futures(solid line) and the option (dotted line) for all seller-initiated trades in the call options for which thebid quote changed in the last 30 seconds before the trade. The series of mid-quotes are normalizedby subtracting the respective mid-quote values at the time of the trade. The normalized bid quotesseries is plotted with a dash-dotted line and the normalized ask quote series with a dashed line. Thebottom left subplot plots the corresponding series for call options for which the best bid quote didnot change in the last 30 seconds before the trade. The subplot on the right plots the correspondingquote series for the seller-initiated trades in the put options for which the ask quote change (topright) and did not change (bottom right).
38
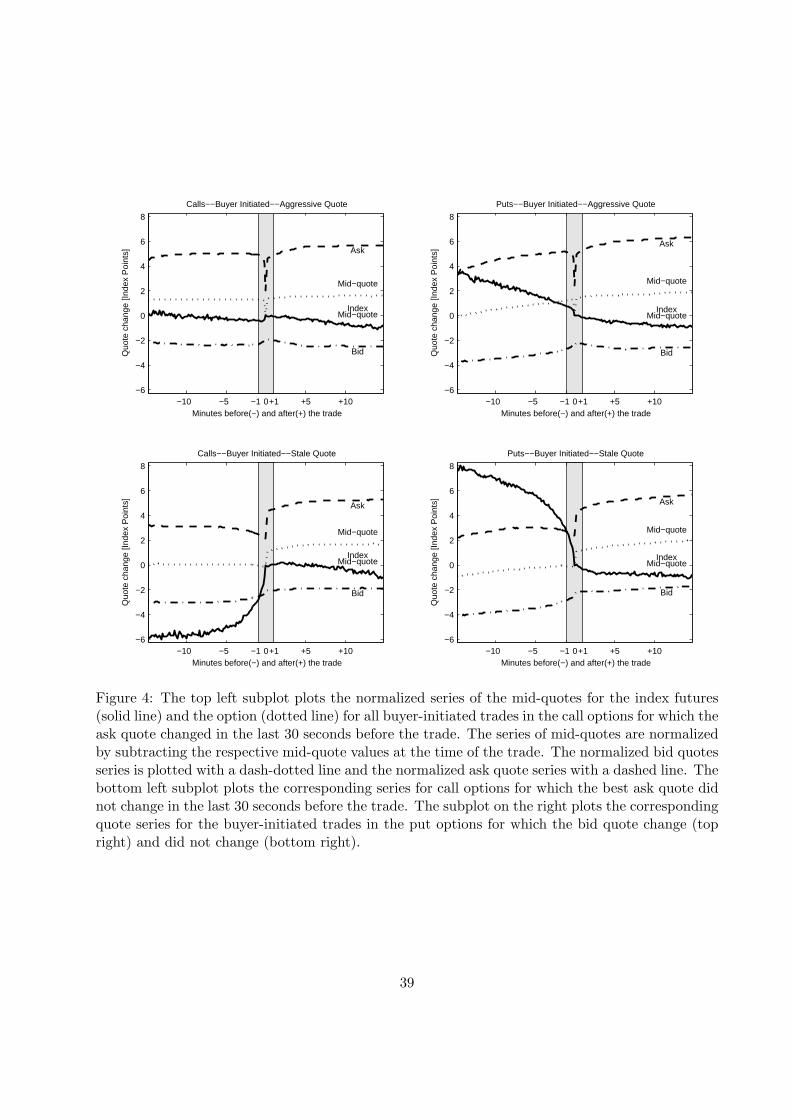
−10 −5 −1 0+1 +5 +10−6
−4
−2
0
2
4
6
8
Calls−−Buyer Initiated−−Aggressive Quote
Mid−quote
IndexMid−quote
Ask
BidQuo
te c
hang
e [In
dex
Poi
nts]
Minutes before(−) and after(+) the trade−10 −5 −1 0+1 +5 +10
−6
−4
−2
0
2
4
6
8
Puts−−Buyer Initiated−−Aggressive Quote
Mid−quote
IndexMid−quote
Ask
BidQuo
te c
hang
e [In
dex
Poi
nts]
Minutes before(−) and after(+) the trade
−10 −5 −1 0+1 +5 +10−6
−4
−2
0
2
4
6
8
Calls−−Buyer Initiated−−Stale Quote
Mid−quote
IndexMid−quote
Ask
Bid
Quo
te c
hang
e [In
dex
Poi
nts]
Minutes before(−) and after(+) the trade−10 −5 −1 0+1 +5 +10
−6
−4
−2
0
2
4
6
8
Puts−−Buyer Initiated−−Stale Quote
Mid−quote
IndexMid−quote
Ask
Bid
Quo
te c
hang
e [In
dex
Poi
nts]
Minutes before(−) and after(+) the trade
Figure 4: The top left subplot plots the normalized series of the mid-quotes for the index futures(solid line) and the option (dotted line) for all buyer-initiated trades in the call options for which theask quote changed in the last 30 seconds before the trade. The series of mid-quotes are normalizedby subtracting the respective mid-quote values at the time of the trade. The normalized bid quotesseries is plotted with a dash-dotted line and the normalized ask quote series with a dashed line. Thebottom left subplot plots the corresponding series for call options for which the best ask quote didnot change in the last 30 seconds before the trade. The subplot on the right plots the correspondingquote series for the buyer-initiated trades in the put options for which the bid quote change (topright) and did not change (bottom right).
39