co-supervisor: of university - university of cape town
TRANSCRIPT

Univers
ity of
Cap
e Tow
n
INVESTIGATING THE CHEMICAL SPACE AND METABOLIC BIOACTIVATION OF NATURAL PRODUCTS AND CROSS-REACTIVITY OF
CHEMICAL INHIBITORS IN CYP450 PHENOTYPING
Nicholas M. Njuguna
Supervisor: Prof. Kelly Chibale
Department of Chemistry, University of Cape Town
Co-supervisor: Dr. Collen Masimirembwa
African Institute of Biomedical Science and Technology, Harare, Zimbabwe
Thesis presented for the Degree of
Doctor of Philosophy
In the Department of Chemistry
UNIVERSITY OF CAPE TOWN
November 2014

Univeri
sty of
Cap
e Tow
n
The copyright of this thesis vests in the author. No quotation from it or information derived from it is to be published without full acknowledgement of the source. The thesis is to be used for private study or non-commercial research purposes only.
Published by the University of Cape Town (UCT) in terms of the non-exclusive license granted to UCT by the author.


i
DECLARATION I, Nicholas Mwaura Njuguna, hereby declare that: (i) This thesis is my own unaided work, both in conception and execution, and that apart from the normal guidance of my supervisors; I have received no assistance apart from that acknowledged; (ii) Neither the substance nor any part of the thesis has been submitted in the past, or is to be submitted for a Degree in the University of Cape Town or any other University. Signed: Date:

ii
DEDICATION
To my family:
Dad, Mum, Kim, Maureen, Joe and Shi
For your enduring love, steadfast support and unshakeable belief that have made my
journey into the unknown so much more bearable.

iii
ACKNOWLEDGEMENTS
I wish to convey my heartfelt gratitude to all the people that contributed in every
way, great or small, in the conceptualisation, execution and conclusion of this work.
To my supervisor, Prof. Kelly Chibale: no words in the English language (or any other)
can truly express the eternal gratitude and boundless appreciation I have for
granting me the opportunity to work under your guidance. Your exceptional
scientific mentorship, great vision, unrelenting work ethic, generosity, and humility
are a true inspiration. Ahsante sana!
To my co-supervisor, the indefatigable Dr. Collen Masimirembwa, who taught me
everything I know about drug metabolism, a bit about tae kwondo and lots more
besides, I extend my heartfelt thanks and utmost admiration. I shall always cherish
the unforgettable time I spent working on my project at AiBST and the unbelievable
warmth of our hosts in Zimbabwe. Shukran sensei Collen!
Past and present members of the Medicinal Chemistry and H3-D Research Groups,
too numerous to mention here, from whom I received invaluable advice, assistance,
support and genuine friendship throughout my time in Cape Town.
Special thanks go to Ms. Elaine Rutherfoord-Jones, for her amazing organizational
skills, warm spirit and generous heart - truly the ‘glue’ that binds our research group
so covalently together.
I also wish to wholeheartedly acknowledge Novartis Pharma AG for their
sponsorship to participate in the once-in-a-lifetime experience 2013 Novartis Next
Generation Scientist Program in Basel, Switzerland. Particular thanks go to our
mentors from the Novartis D&I Team: Drs. Colin Pillay, Fareed Mirza, Marcello
Gutierrez, Henri-Michelle Yere, Rita Michelle and Isabella Alberini. Special thanks
also go to my scientific mentors at the Novartis DMPK Department: Dr. Gian
Camenisch, Dr. Kenichi Umehara, Marc Witschi and Claire Juif.

iv
I also wish to gratefully acknowledge Prof. Peter J. Smith and Dr. Lubbe Weisner at
the UCT Department of Pharmacology for unfettered access to their laboratory
facilities and especially their expert advice on LC-MS instrumentation and
experimentation.
To Pete Roberts and Gianpiero Benincasa, many thanks for your technical assistance
in the characterisation of compounds using NMR and MS.
To the South African Medical Research Council, National Research Foundation and
the Novartis Research Foundation, I convey my heartfelt appreciation for generously
funding my studies.
Finally and most important, my eternal gratitude goes to our Heavenly Father God,
for mercifully granting me the health, strength and perseverance to see this through.

v
ABSTRACT Natural products have been exploited by humans as the most consistently reliable
source of medicines for hundreds of years. Owing to the great diversity in chemical
scaffolds they encompass, these compounds provide an almost limitless starting
point for the discovery and development of novel semi-synthetic or wholly synthetic
drugs. In Africa, and many other parts of the world, natural products in the form of
herbal remedies are still used as primary therapeutic interventions by populations
far removed from conventional healthcare facilities. However, unlike conventional
drugs that typically undergo extensive safety studies during development, traditional
remedies are often not subjected to similar evaluation and could therefore harbour
unforeseen risks alongside their established efficacy.
A comparison of the ‘drug-like properties’ of 335 natural products from medicinal
plants reported in the African Herbal Pharmacopoeia with those of 608 compounds
from the British Pharmacopoeia 2009 was performed using in silico tools. The data
obtained showed that the natural products differed significantly from conventional
drugs with regard to molecular weight, rotatable bonds and H-bond donor
distributions but not with regard to lipophilicity (cLogP) and H-bond acceptor
distributions. In general, the natural products were found to exhibit a higher degree
of deviation from Lipinski’s ‘Rule-of-Five’. Additionally, these compounds possessed
a slightly greater number of structural alerts per molecule compared to conventional
drugs, suggesting a higher likelihood of undergoing metabolic bioactivation.
A combination of CYP450 enzyme inactivation assays and reactive metabolite
trapping experiments was used to evaluate in vitro bioactivation of 15 natural
product and natural product-derived compounds. Gedunin, Justicidin A and
Jamaicin were found to be potent inhibitors of the main drug metabolizing isoform
CYP3A4. Gedunin also exhibited potent inhibition of CYP2C19. The inhibition of
CYP3A4 was, however, not time-dependent and therefore unlikely to be due to
reactive metabolite-mediated inactivation of the enzyme. Inhibition of the other

vi
main drug metabolizing isoforms, CYP1A2, CYP2C9 and CYP2C19 was markedly less
pronounced.
Direct assessment of the formation of electrophilic reactive metabolites was carried
out by incubating 11 of the 15 compounds in hepatic microsomal preparations
fortified with nucleophilic trapping agents. Using methoxylamine as a trapping agent,
incubations of the monosubstituted furan ring-containing compounds Gedunin and
the tetraol DC3 were found to contain components strongly suspected to be trapped
reactive metabolites. None of the compounds tested formed detectable adducts
when incubated in the presence of either reduced glutathione or potassium cyanide.
The cross-reactivity of eight chemical inhibitors commonly used in early CYP450
phenotyping assays revealed the relatively low selectivity of ticlopidine and
diethyldithiocarbamate. These assays also highlighted the particularly low potency of
diethylthiocarbamate as the routinely preferred inhibitor for determining the
contribution of hepatic CYP2E1 to xenobiotic metabolism. The data obtained
provided ample evidence for the need to identify and characterise a superior
replacement inhibitor for CYP2E1 phenotyping.
The determined cross-reactivity values of different inhibitors were used to formulate
a mathematical strategy to compensate for cross-inhibition in CYP450 enzyme
phenotyping calculations. Recalculation of previously obtained CYP3A4 phenotyping
data using the new strategy appeared to improve the correlation between
fm,CYP3A4 values determined using different phenotyping approaches. A similar
effect on phenotyping data from other CYP450 enzymes could not be established
owing to a limitation in the size of the pre-existing dataset.

vii
LIST OF ABBREVIATIONS AND SYMBOLS
°C Degrees Celsius
µg Microgram
µM Micromolar
Å Angstrӧm
ACE Angiotensin converting enzyme
ADMET Absorption, distribution, metabolism, excretion and toxicology
AHP African Herbal Pharmacopoeia
AKR Aldo-keto reductase enzyme
AO Aldehyde oxidase
APCI Atmospheric pressure chemical ionization
BFC 7-Benzyloxy-4-(trifluoromethyl)coumarin
BP British Pharmacopoeia
CDCl3 Deuterated chloroform
cDNA Complementary DNA
CEC 3-Cyano-7-ethoxycoumarin
cLogP Calculated water-octanol partition coefficient
CLPG Calopogonium isoflavone A
CNL Constant neutral loss
CNS Central Nervous System
COMT Catechol-O-methyl transferase enzyme
COX Cyclooxygenase enzyme
CQ-R Chloroquine resistant
CQ-S Chloroquine sensitive
CSIR Council for Scientific and Industrial Research (South Africa)
CUC-A Cucurbitacin A
CUC-B Cucurbitacin B
CUC-C Cucurbitacin C
CYP450 Cytochrome P450 Enzyme
Da Daltons
DC14 Leoleorin A

viii
DETC Diethyldithiocarbamate
DMF Dimethylformamide
DMPK Drug metabolism and pharmacokinetics
DMSO Dimethylsulfoxide
DNA Deoxyribonucleic acid
EMA European Medicines Agency
EMS Enhanced mass spectrum
EPI Enhanced product ion
ESI Electro-spray ionisation
FDA (United States) Food and Drug Administration
fm,CYP Fraction of substrate metabolized by CYP450 enzyme
FMO Flavin-containing monoxygenase
FMTN Formononetin
FSDA Fusidic acid
GB Gigabytes
GEDN Gedunin
GHz Gigahertz
GIT Gastro-intestinal tract
GSH Reduced glutathione
GST Glutathione transferase enzyme
HCOOH Formic acid
HCOONH4 Ammonium formate
HLM Human liver microsomes
HPLC High performance liquid chromatography
HTS High throughput screening
IADR Idiosyncratic adverse drug reaction
ICIPE International Centre of Insect Physiology and Ecology
InChI International chemical identifier
INN International non-proprietary name
ISEF Intersystem extrapolation factors
JMCN Jamaicin

ix
JSTN Justicidin A
KCN Potassium cyanide
KTZ Ketoconazole
LC-MS Tandem liquid chromatography - mass spectrometry
m/z Mass-to-charge ratio
MAO Monoamine oxidase enzyme
MFC 7-Methoxy-4-(trifluoromethyl)coumarin
mg Milligram
MHz Megahertz
min Minutes
mL Milliliter
mM Millimolar
mm Millimetre
MRM Multiple reaction monitoring
MTGN Metergoline
mwt Molecular weight
MZG Muzigadial
NADPH Nicotinamide adenine dinucleotide phosphate (reduced form)
NAT N-acetyl transferase enzyme
NH4OAc Ammonium acetate
nm Nanometer
NMR Nuclear magnetic resonance
OLE Object Linking and Embedding
PBS Phosphate buffered saline
PCA Principle component analysis
PI Precursor ion
pKa Acid dissociation constant
pmol Picomole
ppm Parts per million
PTFE Polytetrafluoroethylene
QSAR Quantitative Structure Activity Relationship

x
RAM Random access memory
rCYP Recombinant Cytochrome P450 Enzyme
Rf Retention factor
rhCYP450 Recombinant human Cytochrome P450 enzyme
RLM Rat liver microsomes
RNA Ribonucleic acid
rpm Revolutions per minute
Rt Retention time
SAM S-adenosyl methionine
SLN SYBYL line notation
SMILES Simplified molecular input line entry system
sp. Species
SQTL Sesquiterpene lactone (Dehydrobrachylaenolide)
TAO Troleandomycin
TDI Time dependent (enzyme) inhibition
THF Tetrahydrofuran
TIC Total ion current (chromatogram)
UDPGA Uridine 5’-diphosphoglucuronic acid
UGT Uridine glucuronosyl transferase
V Volts
WHO World Health Organization
XIC Extracted ion chromatogram

xi
TABLE OF CONTENTS
Page
Declaration i
Dedication ii
Acknowledgements iii
Abstract v
List of Abbreviations and Symbols vii
Table of Contents xi
List of Figures xvi
List of Tables xx
Publications and Conferences xxii
CHAPTER ONE: INTRODUCTION AND LITERATURE REVIEW
1.1 Summary 1
1.2 Natural Products 1
1.3 Natural Products as Sources of Drugs 2
1.3.1 Historical Perspective 2
1.3.2 Drugs from Plant Natural Products 3
1.3.3 Drug Discovery from Microbial Natural Products 5
1.3.4 Drug Discovery from Animal-Derived Natural Products 7
1.3.5 Marine Invertebrates 8
1.3.6 Other Potential Sources of Natural Product-Derived Drugs 12 1.4 Past Decline, Current Status and Future Prospects of Natural Product-Based
Drug Discovery 13
1.5 Metabolism of Xenobiotics 16
1.6 Classification of Metabolites 21
1.6.1 Stable Metabolites 21
1.6.1.1 Biologically inactive stable metabolites 21
1.6.1.2 Biologically active metabolites 21
1.6.2 Reactive Metabolites 22
1.7 Metabolism-Mediated Xenobiotic Toxicity 23
1.7.1 Metabolism-Mediated Toxicity of Conventional Drugs 24
1.7.2 Metabolism-Mediated Toxicity of Natural Products 26
1.8 Profiling ADME Properties in Early Drug Discovery 30
1.8.1 Computational Tools in ADMET Profiling 30
1.8.2 Metabolic Stability and Enzyme Phenotyping 31
1.8.3 Predicting Formation of Reactive Metabolites from Structural Alerts 33
1.9 In vitro Determination of Reactive Metabolite Formation 35

xii
Page
1.9.1 Enzyme Inhibition Assays 35
1.9.2 Reactive Metabolite Trapping Assays 36
1.9.3 Covalent Binding Studies 37
1.10 Research Program 38
1.10.1 Study Justification 38
1.10.2 Aims and Objectives 39
1.10.3 Specific Aims 39
References 40
CHAPTER TWO: IN SILICO PROFILING OF NATURAL PRODUCT CHEMICAL SPACE 61
2.1 Summary 61
2.2 General Introduction 61
2.3 Natural Product Database 62
2.3.1 Database Design 62
2.3.2 Data Entry 64
2.3.3 Summary Statistics 66
2.4 In silico Chemical Space Property Calculations and Predictions 66
2.4.1 Molecular Weight 67
2.4.2 Predicted cLogP 68
2.4.3 Rotatable Bonds 69
2.4.4 Hydrogen Bond Donors and Acceptors 70
2.5 Statistical Evaluation and Comparison of Compound Datasets 72
2.6 C-Lab Chemical Space Prediction and Principal Component Data Analysis 74
2.7 Overall Compliance with ‘Rule-of-Five’ 77
2.8 In silico Screening for Time Dependent Enzyme Inhibition Structural Alerts 78
2.9 Conclusions 80
References 81
CHAPTER THREE: IN VITRO EVALUATION OF NATURAL PRODUCT BIOACTIVATION 84
3.1 Summary 84
3.2 General Introduction 84
3.3 Bioactivation Evaluation Strategy 86
3.4 Selection of Natural Products 86
3.4.1 Gedunin 87
3.4.2 Justicidin A 88
3.4.3 Dehydrobrachylaenolide 89
3.4.4 Metergoline 89

xiii
Page
3.4.5 Fusidic acid 90
3.4.6 Muzigadial 90
3.4.7 Muzi-04 91
3.4.8 Cucurbitacin A, B and C 92
3.4.9 DC3 93
3.4.10 Leoleorin A 93
3.4.11 Jamaicin and Calopogonium isoflavone A 94
3.4.12 Formononetin 95
3.5 CYP450 Enzyme Inhibition Assays 97
3.5.1 CYP450 Inhibition Assay Procedure and Results 98
3.5.1.1 Inhibition of CYP1A2 100
3.5.1.2 Inhibition of CYP2C9 101
3.5.1.3 Inhibition of CYP2C19 102
3.5.1.4 Inhibition of CYP3A4 103
3.5.2 Time Dependent CYP3A4 Inhibition 104
3.5.3 Glutathione-Fortified rCYP3A4 Inhibition Assay 105
3.6 Reactive Metabolite Trapping Experiments 108
3.6.1 Trapping Reactive Metabolites Using Cyanide 109
3.6.2 Trapping Reactive Metabolites Using Glutathione 114
3.6.3 Trapping Reactive Metabolites Using Methoxylamine 121
3.7 Conclusion 126
References 127
CHAPTER FOUR: INVESTIGATING THE CROSS-REACTIVITY OF CHEMICAL INHIBITORS USED IN HEPATIC MICROSOMAL CYP450 ENZYME PHENOTYPING 136
4.1 Summary 136
4.2 General Introduction 136
4.3 In vitro CYP450 Phenotyping Techniques 137
4.3.1 Chemical Inhibition CYP450 Phenotyping 138
4.3.2 CYP450 Isoform Mapping 139
4.3.3 Phenoyping Using CYP450 Correlation Analysis 140
4.4 Drawbacks of Current CYP450 Phenotyping Methods 140
4.5 Probe CYP450 Isoform Reactions and Chemical Inhibitors 142
4.6 Methodology 145
4.6.1 Incubation Conditions 145
4.6.2 Quantification of Probe Metabolites and Inhibition of Isoform
Activity 146
4.7 Cross-Inhibition Assays Results 148

xiv
Page
4.7.1 Furafylline 148
4.7.2 Ticlopidine 149
4.7.3 Montelukast 150
4.7.4 Quinidine 151
4.7.5 Sulfaphenazole 152
4.7.6 Diethylthiocarbamate 153
4.7.7 Ketoconazole 154
4.7.8 Azamulin 155
4.8 Compensating for Inhibitor Cross-Reactivity in CYP450 Phenotyping Data 156
4.9 Application of Cross-Reactivity Correction to fm,CYP450 Data 159
4.10 Conclusions 165
References 167
CHAPTER FIVE: SUMMARY, CONCLUSIONS AND RECOMMENDATIONS FOR FUTURE WORK 172
5.1 Summary and Conclusions 172
5.2 Recommendations for Future Work 175
CHAPTER SIX: EXPERIMENTAL 178
6.1 Reagents and Solvents 178
6.2 Turbidimetric Solubility 178
6.3 Physical and Spectroscopic Characterization 180
6.4 Chromatography 180
6.4.1 Thin Layer Chromatography 180
6.4.2 Flash Column Chromatography 181
6.4.3 High Performance Liquid Chromatography 181
6.4.3.1 System 1 and 2 - Compound purity and molecular mass
checks 181
6.4.3.2 System 3 - Reactive metabolite trapping experiments 182
6.4.3.3 System 4 - CYP450 phenotyping chemical inhibitor cross-
reactivity assays 182
6.4.3.4 HPLC and LC-MS chromatographic conditions 183
6.5 rCYP450 Enzyme Inhibition Assays 184
6.5.1 Direct CYP450 Inhibition Assay 184
6.5.2 Time-Dependent CYP3A4 Inhibition Assay 188
6.5.2.1 Inactivation assay 188
6.5.2.2 Activity assay 188
6.6 Reactive Metabolite Trapping Experiments 189
6.6.1 Microsomal Incubation Conditions 189

xv
Page
6.6.2 LC-MS Analysis of Trapped Reactive Metabolite Samples 189
6.7 CYP450 Phenotyping Chemical Inhibitor Cross-Reactivity Assays 191
References 193
APPENDICES
Appendix 1 Experimentally determined Physico-Chemical Properties of Test Compounds A1
Appendix 2 Design and Synthesis of Fluorogenic CYP450 Probe Substrates A2

xvi
LIST OF FIGURES
Page
Figure 1.1: Earliest examples of drugs isolated from or inspired by natural products 3
Figure 1.2: Prototype antibiotics of different classes isolated from microbial sources 6
Figure 1.3: Drugs derived from microbial sources used for treatment of non-infectious diseases 7
Figure 1.4: ACE inhibitors developed from an animal derived natural product 8
Figure 1.5: Gila monster. Source of exendin-4, precursor of antidiabetic drug exenatide 8
Figure 1.6: Fish-hunting cone snail (Conus magus) 10
Figure 1.7: Examples of marine natural product derived drugs 11
Figure 1.8: Natural products isolated from organisms that inhabit extreme environments 13
Figure 1.9: Structure of chain A of human CYP3A4 enzyme 17
Figure 1.10: Location of CYP450 and related proteins in the endoplasmic reticulum membrane 17
Figure 1.11: Body map illustrating distribution of CYP isoforms in extra-hepatic tissues 18
Figure 1.12: Relative contribution of CYP450 isoforms to phase I drug metabolism 19
Figure 1.13: Simplified catalytic cycle illustrating substrate oxygenation by CYP450 enzymes 19
Figure 1.14: Glucuronide metabolites of morphine having different pharmacological activities 22
Figure 1.15: Generalised classification of reactive metabolites 23
Figure 1.16: Relationship between metabolism and toxicity 24
Figure 1.17: Metabolism and bioactivation of paracetamol 25
Figure 1.18: Bioactivation of clozapine 26
Figure 1.19: Metabolic bioactivation of aflatoxin B1 and formation of DNA and protein adducts 27
Figure 1.20: Bioactivation of aristolochic acids and binding to DNA residues 28
Figure 1.21: Proposed bioactivation of methysticin in kava preparations 29
Figure 1.22: Proposed bioactivation of bergamottin by intestinal CYPs and resultant CYP3A4 inhibition 29
Figure 1.23: Main causes of compound attrition during drug development (1991 vs 2000) 30
Figure 1.24: Example of possible decision scheme for handling bioactivation data at different stages of drug development 34
Figure 1.25: Examples of some common structural alerts associated with CYP450 inhibition 34
Figure 2.1: Screenshot of AHP Chemical Constituents and ICIPE Compounds Data
Entry Form 65 Figure 2.2: Screenshot of African Herbal Pharmacopoeia Table Data Entry Form 66

xvii
Page
Figure 2.3: Pie charts of molecular weight distributions for the three compound datasets 68
Figure 2.4: Frequency distribution histograms of predicted cLogP values for compounds in the three datasets 69
Figure 2.5: Frequency distribution histograms for number of rotatable bonds in the database compounds 70
Figure 2.6: Frequency distribution histograms of H-bond donors in the database compounds 71
Figure 2.7: Frequency distribution histograms of H-bond acceptors in the database compounds 71
Figure 2.8: 2-D PCA scatter plot of predicted chemical space parameters of BP 2009 drugs and AHP chemical constituents 75
Figure 2.9: 2-D PCA scatter plot of predicted chemical space parameters of BP drugs and ICIPE compounds 76
Figure 2.10: Cefixime - Five structural alerts but low toxicity in vivo 79
Figure 3.1: rCYP1A2 inhibition assay results 100
Figure 3.2: rCYP2C9 inhibition assay results 101
Figure 3.3: rCYP2C19 inhibition assay results 102
Figure 3.4: rCYP3A4 Inhibition Assay Results 103
Figure 3.5: Normalized ratios of rCYP3A4 inhibitors for determination of TDI 105
Figure 3.6: Effect of glutathione on inhibition of rCYP3A4 by selected natural products 106
Figure 3.7: Metabolic pathways of cyclic tertiary amines 110
Figure 3.8: Bioactivation of tertiary cyclic amine to iminium ion and trapping using KCN 110
Figure 3.9: Hypothesized bioactivation of rimonabant and subsequent trapping of reactive intermediate using KCN 111
Figure 3.10: XIC of T0 rimonabant incubation in presence of RLM fortified with KCN 111
Figure 3.11: XIC of rimonabant incubation in presence of RLM fortified with KCN after 60 min indicating presence of two suspected cyanide adduct peaks 112
Figure 3.12: XIC of rimonabant incubation in HLM fortified with KCN after 60 min indicating presence of single suspected cyanide adduct peak 112
Figure 3.13: EPI spectrum of suspected cyanide-trapped reactive rimonabant metabolite showing fragmentation involving loss of 27 Da HCN molecule 113
Figure 3.14: Metergoline with structural alerts circled 113
Figure 3.15: XIC of T60 incubation of metergoline in KCN fortified HLMs indicating presence of metabolite peaks but no obvious cyanide adducts 114
Figure 3.16: Reduced and oxidized forms of glutathione 115
Figure 3.17: Role of GSH in detoxification of reactive metabolites in vivo and the biochemical fate of resultant GSH conjugates 115
Figure 3.18: Major metabolites of amodiaquine and GSH trapping of reactive quinone imine intermediate 116
Figure 3.19: Detection of GSH adducts and characteristic fragments using different MS scanning modes 117
Figure 3.20: XIC +ve ion mode EMS of T60 aliquot of amodiaquine incubated with GSH fortified RLM 117

xviii
Page
Figure 3.21: XIC of -ve mode EMS of T60 amodiaquine incubation in GSH fortified RLMs indicating presence of GSH-conjugate co-eluting with desethylamodiaquine 118
Figure 3.22: TIC of -ve ion mode precursor ion scan of m/z 272 Da fragment of T60 amodiaquine incubation in GSH fortified RLMs 118
Figure 3.23: XIC of SQTL peak only observed in incubation preparations devoid of GSH. Absent in all incubations in which GSH was added 120
Figure 3.24: Proposed bioactivation of furan containing compounds to aldehyde intermediates 121
Figure 3.25: Trapping furan-derived aldehyde reactive intermediates using methoxylamine 122
Figure 3.26: Bioactivation of furan ring in prazosin and trapping of aldehyde intermediate using methoxylamine 122
Figure 3.27: Prazosin and some of its known metabolites detected from trapping incubations 123
Figure 3.28: XIC of +ve ion mode EMS of T60 incubation of prazosin in methoxylamine fortified RLM. 123
Figure 3.29: XICs of T60 gedunin incubation in methoxylamine fortified microsomes showing suspected trapped metabolites 124
Figure 3.30: Enhanced mass spectrum of peak in T60 gedunin incubation eluting at 8.46 min showing loss of 32 Da fragment from suspected methoxylamine trapped metabolite 124
Figure 3.31: XIC of T60 DC3 incubation in methoxylamine fortified microsomes indicating presence of suspected trapped metabolite 125
Figure 3.32: EPI of suspected methoxylamine trapped metabolite from T60 microsomal incubation of DC3 125
Figure 4.1: Schematic illustration of CYP450 phenotyping using chemical inhibitors or monoclonal antibodies 138
Figure 4.2: Schematic representation of CYP450 phenotyping data using recombinant enzymes 139
Figure 4.3: Probe metabolic reactions of CYP1A2, CYP2B6, CYP2C9 and CYP2C19 and their respective chemical inhibitors evaluated for cross-reactivity 143
Figure 4.4: Probe metabolic reactions of CYP2D6 and CYP2E1 and their respective chemical inhibitors evaluated for cross-reactivity 143
Figure 4.5: Probe metabolic reactions of CYP2C8 and CYP3A and their respective chemical inhibitors evaluated for cross-reactivity 144
Figure 4.6: Representative concentration vs response calibration curves of metabolite standard solutions used for LC-MS quantification of enzyme inhibition 147
Figure 4.7: Inhibitory effect of furafylline on 8 different CYP450 isoform metabolic probe reactions 148
Figure 4.8: Inhibitory effect of ticlopidine on 8 different CYP450 isoform metabolic probe reactions 149
Figure 4.9: Inhibitory effect of montelukast on 8 different CYP450 isoform metabolic probe reactions 150
Figure 4.10: Inhibitory effect of quinidine on 8 different CYP450 isoform metabolic probe reactions 151
Figure 4.11: Inhibitory effect of sulfaphenazole on 8 different CYP450 isoform metabolic probe reactions 152

xix
Page
Figure 4.12: Inhibitory effect of diethylthiocarbamate on 8 different CYP450 isoform metabolic probe reactions 153
Figure 4.13: Inhibitory effect of ketoconazole on 8 different CYP450 isoform metabolic probe reactions 154
Figure 4.14: Inhibitory effect of azamulin on 8 different CYP450 isoform metabolic probe reactions 155
Figure 4.15: Correlation plot of fm,CYP3A using rhCYP3A4 and HLM + ketoconazole before correction for inhibitor cross-reactivity 162
Figure 4.16: Correlation plot of fm,CYP3A data using rhCYP3A4 and HLM + ketoconazole after correction for inhibitor cross-reactivity 162
Figure 4.17: Correlation plot of fm,CYP3A using rCYP3A4 and HLM + azamulin before correction for inhibitor cross-reactivity 163
Figure 4.18: Correlation plot of fm,CYP3A using rCYP3A4 and HLM + azamulin after correction for inhibitor cross-reactivity 164
Figure 6.1: Turbidimetric solubility assay pre-dilution plate set-up 179
Figure 6.2: Turbidimetric assay plate lay-out 179
Figure 6.3: Incubation plate set-up for rCYP450 inhibition assays 185
Figure 6.4: Inactivation assay plate lay-out for rCYP3A4 TDI assay 188

xx
LIST OF TABLES
Page
Table 1.1: Examples of drugs obtained from plant derived natural products 4
Table 1.2: Examples of natural product antibiotics from microbial sources in current clinical use 6
Table 1.3: Examples of drugs obtained from marine-derived natural products currently in clinical trials 11
Table 1.4: Summary of other non-CYP450 enzymes involved in metabolism of xenobiotics 20
Table 2.1: Natural Product Database Structure 63
Table 2.2: Mean values of ‘Rule-of-Five’ properties 72
Table 2.3: Results for statistical tests for normal distribution of data 72
Table 2.4: Median values of ‘Rule-of-Five’ properties 73
Table 2.5: Mann-Whitney-Wilcoxon independent samples comparison test results 73
Table 2.6: Categorization of physico-chemical descriptors predicted using C-Lab Platform 74
Table 2.7: Summary of compound deviations from ‘Rule-of-Five’ 78
Table 2.8: Summary of number of TDI structural alerts detected per dataset 79
Table 3.1: CYP450 isoforms, probe substrates, fluorescent metabolites and spectrofluorometric conditions used for CYP inhibition assays 98
Table 3.2: Main diagnostic LC-MS peaks observed to determine presence of GSH trapped reactive metabolites 119
Table 4.1: CYP450 isoforms, their respective probe substrates, metabolites and chemical inhibitors evaluated in this work 142
Table 4.2: Summary of experimental probe substrate, chemical inhibitor and protein concentrations and experimental incubation duration 145
Table 4.3: Metabolites analysed and concentrations used for plotting calibration curves 146
Table 4.4: Percentage inhibition of CYP450 isoform activity by different chemical inhibitors 156
Table 4.5: Hypothetical CYP450 phenotyping data uncorrected for inhibitor cross-reactivity 156
Table 4.6: Unmodified and corrected fm,CYP data based on consideration of inhibitor cross-reactivity for a hypothetical drug 158
Table 4.7: Physico-chemical properties of 15 test compounds phenotyped for CYP450 metabolism using conventional in vitro methods 159
Table 4.8: CYP450 phenotyping data from incubation of 15 Novartis test compounds in recombinant CYP450 isoforms 160
Table 4.9: Original unmodified and modified chemical inhibition CYP450 phenotyping data for 15 Novartis test compounds after correction for inhibitor cross-reactivity 161
Table 4.10: Uncorrected fm,CYP3A values for compounds phenotyped using both azamulin and ketoconazole 164
Table 4.11: Modified fm,CYP3A values for compounds phenotyped using both azamulin and ketoconazole after correction for inhibitor cross-reactivity 164

xxi
Page
Table 6.1: Chromatographic method conditions used for HPLC and LC-MS sample analysis 183
Table 6.2: Summary incubation setup for CYP1A2 inhibition assay 186
Table 6.3: Summary incubation setup for rCYP2C9 inhibition assay 186
Table 6.4: Summary incubation setup for rCYP2C19 inhibition assay 187
Table 6.5: Summary incubation setup for rCYP3A4 inhibition assay 187
Table 6.6: Optimized ion source conditions for LC-MS analysis of reactive metabolite trapping incubations 190
Table 6.7: LC-MS Parameter settings for detection and quantification of chemical inhibitor cross reactivity 192

xxii
PUBLICATIONS AND CONFERENCES Publications arising from this Thesis
Nicholas M. Njuguna, Collen Masimirembwa and Kelly Chibale. Identification and
characterization of reactive metabolites in natural products-driven drug discovery.
Journal of Natural Products. 2012, 75(3): 507-513.
Marlene Espinoza-Moraga, Nicholas M. Njuguna, Grace Mugumbate, Julio Caballero
and Kelly Chibale. In silico comparison of antimycobacterial natural products with
known antituberculosis drugs. Journal of Chemical Information and Modeling. 2013,
53(3): 649-660.
Reviews and related peer reviewed journal articles Nicholas M. Njuguna, Dennis S. B. Ongarora and Kelly Chibale. Artemisinin
derivatives: a patent review (2006 - present). Expert Opinion on Therapeutic Patents.
2012, 22(10): 1179-1203.
Dyanne L. Cruickshank, Yassir Younis, Nicholas M. Njuguna, Dennis S. B. Ongarora,
Kelly Chibale and Mino R. Caira. Alternative solid-state forms of a potent antimalarial
aminopyridine: X-ray crystallographic, thermal and solubility aspects.
CrystEngComm. 2014, 16: 5781-5792.
Mathew Njoroge, Nicholas M. Njuguna, Peggoty Mutai, Dennis S. B. Ongarora, Paul
W. Smith, and Kelly Chibale. Recent Approaches to Chemical Discovery and
Development against Malaria and the Neglected Tropical Diseases Human African
Trypanosomiasis and Schistosomiasis. Chemical Reviews. 2014 (Article in Press:
dx.doi.org/10.1021/cr500098f).

xxiii
Conferences and Training Courses Inaugural H3-D Symposium (15 - 18 October 2012). Cape Town, South Africa. Poster
Presentation: In silico comparison of antimycobacterial natural products with
conventional antituberculosis drugs and compounds in preclinical/clinical
development.
Novartis Next Generation Scientist Program (June - August 2013). Novartis Pharma
AG, Basel, Switzerland. Novartis Research Day, 27th August 2013. Poster
Presentation: Estimation of relative contribution of CYP enzymes to hepatic
metabolism by a modified chemical inhibition approach evaluating cross-inhibition
potential of selective inhibitors.
17th World Congress on Basic and Clinical Pharmacology (13 - 18 July 2014). Cape
Town, South Africa. Poster Presentation: Investigating in vitro metabolic
bioactivation of the natural product Gedunin.
248th American Chemical Society National Meeting and Exposition (10 - 14 August
2014). San Francisco, USA. Poster Presentation: In vitro metabolic enzyme inhibition
and reactive metabolite trapping studies on natural and semi-synthetic furanoid
labdane terpenoids.


CHAPTER 1: INTRODUCTION AND LITERATURE REVIEW
NICHOLAS M. NJUGUNA - Ph.D. THESIS 2014
1
CHAPTER ONE:
INTRODUCTION AND LITERATURE REVIEW
1.1 Summary
In this Chapter, the role played by natural products as a well established resource
from which drugs have been discovered is discussed. Metabolism of xenobiotic
compounds through different enzymatic systems in man is highlighted as a primer to
more detailed discussions on metabolism-mediated adverse reactions to
xenobiotics. The potential for natural products to cause adverse reactions in humans
resulting from their metabolic bioactivation is discussed with reference to specific
examples cited in the literature. The different approaches used to predict, detect
and mitigate against undesirable toxicity arising from metabolism of xenobiotics in
the early stages of the drug development process are covered. The research
question to be answered, study justification and specific objectives of this work are
highlighted at the conclusion of the Chapter.
1.2 Natural Products
In medicinal chemistry, the term ‘natural product’ is used to describe a low
molecular weight chemical compound, usually excluding proteins and nucleic acids,
produced or extracted from living organisms. Natural products are therefore
obtained from terrestrial plants, microbes, marine organisms and animals.1,2 In many
instances, natural products are sometimes referred to as secondary metabolites,
usually because the exact physiological or biochemical role(s) they play in the source
organism is often unknown. In plants, however, some natural products are known to
play a variety of functions, including providing defence mechanisms against
predators or pathogens, or acting as chemo-attractants of pollinators and seed
dispersers.3,4 Microbes on the other hand are known to synthesize natural products
that kill or inhibit the growth of sensitive strains of the same or related microbial
species in their immediate environment.5

CHAPTER 1: INTRODUCTION AND LITERATURE REVIEW
NICHOLAS M. NJUGUNA - Ph.D. THESIS 2014
2
Although not usually essential for the survival of the host organisms, natural
products confer an evolutionary advantage that boosts chances of survival in
adverse environmental conditions.
1.3 Natural Products as Sources of Drugs
1.3.1 Historical Perspective
Since antiquity, natural products have been used, usually in crude form, as a key
component of ancient yet sophisticated traditional medicine systems to combat
disease.6 Paleoanthropological field studies have uncovered evidence suggesting
that prehistoric Neanderthal man may have been aware of the medicinal properties
of some plants more than 60,000 years ago. Records from ancient civilisations in
Mesopotamia, Egypt and Greece provide documented proof of the systematic use of
natural products in medicine in meticulously detailed pharmacopoeia dating back
many centuries before the current era. Traditional Chinese Medicine (TCM) and
Indian Ayurvedic therapies still in widespread use today both rely heavily on natural
product-derived remedies, which have been in use for hundreds of years.7
For centuries, natural products were used for therapeutic purposes in their crude
forms, usually as combinations of both pharmacologically active and inactive
compounds. In the early 1800s, however, the laboratory isolation of morphine as the
first pure natural compound by the German pharmacist Friedrich Wilhelm Adam
Sertürner opened a new age of medicinal natural product chemistry.8,9 Following this
discovery and subsequent commercialization of morphine by the pharmaceutical
company E. Merck, focus on natural products gradually shifted towards the
identification of active compounds, their isolation, purification and characterization
from crude preparations. By 1820, for example, isolation of the antimalarial drug
quinine from the bark of Cinchona species had been reported by Pierre Joseph
Pelletier and Joseph Bienamié Caventou.10 Yet another shift in the paradigm to
natural products chemistry was realized in the mid-nineteenth century. Although the
bark of the willow tree (Cortex salicis) had been used as early as 400 B.C. by the
Greeks and Romans to alleviate pain, its natural product active ingredient, salicin,
was only identified in the 1800s. Degradation of salicin yields salicylic acid, which has
superior analgesic and antipyretic properties. The German chemist, Hermann Kolbe,

CHAPTER 1: INTRODUCTION AND LITERATURE REVIEW
NICHOLAS M. NJUGUNA - Ph.D. THESIS 2014
3
reported the successful total synthesis of salicylic acid in 1859, the earliest recorded
instance of a natural product-derived medicinal compound being prepared in the
laboratory. Chemical modification of salicylic acid to the better tolerated acetyl
salicylic acid by Felix Hoffmann led to large scale manufacture and commercialization
of the drug Aspirin® by Bayer in 1899.11 Thus, the age of commercial drug discovery
based on chemical synthesis of natural product-inspired analogues was born.
O OHHO
N
H
H
N
NHOH
H3CO
COOH
O
O
Morphine QuinineAcetyl salicylic acid
(Aspirin Figure 1.1 Earliest examples of drugs isolated from or inspired by natural products
Natural products have contributed to the development of new drugs in mainly three
ways: (1) By serving as active medicinal compounds in their free unmodified state, as
illustrated by both morphine and quinine; (2) acting as chemical starting points or
building blocks for the synthesis of more complex molecules. For example, diosgenin
is used as the starting material for the synthesis of steroidal contraceptive drugs; (3)
providing insights into new modes of pharmacological action and paving way for the
preparation of novel or wholly synthetic analogues.2
Due to technical improvements in screening programs as well as in separation,
purification and characterization techniques, more than 1,000,000 natural
compounds have been discovered since the early efforts of Sertürner. An estimated
50 - 60% of these compounds are produced by plants while about 5% are of
microbial origin. Of all reported natural products, approximately 20 - 25% exhibit
some kind of biological activity.12
1.3.2 Drugs from Plant Natural Products
Plants are the oldest sources from which natural product-based remedies have been
obtained. It is, therefore, unsurprising that more than half of the natural products
successfully developed into medicines are derived from plants. Although

CHAPTER 1: INTRODUCTION AND LITERATURE REVIEW
NICHOLAS M. NJUGUNA - Ph.D. THESIS 2014
4
approximately 250,000 unique higher plant species have been identified to-date,
only about 5 - 15% of these have been investigated chemically and
pharmacologically. Considering the known potential for plants to produce hundreds
of secondary metabolites unique to certain species or genera, the possibilities of
sourcing still more novel medicinal compounds from such an array would appear
almost unlimited. The chemical diversity of plant-derived natural products is well
illustrated by the sheer volume of chemical scaffolds they encompass, including but
not limited to alkaloids, terpenoids, lignans, flavanoids, tannins and phytosteroids.13
This diversity in chemotypes has resulted in the isolation and development of
compounds that are used to treat a wide spectrum of medical conditions as briefly
summarized in Table 1.1.14,15
Table 1.1: Examples of drugs obtained from plant derived natural products
Drug Chemical Class Plant source Therapeutic use
Artemisinin Sesquiterpene Artemisia sp. Antimalarial
Atropine Alkaloid Atropa belladonna Anticholinergic
Digitalin, Digitoxin Cardiac glycosides Digitalis purpurea Cardiotonic
Ephedrine Phenylpropanolamine Ephedra sinica Sympathomimetic
Galanthamine Alkaloid Galanthus sp. Anti-Alzheimer
Paclitaxel Taxane diterpene Taxus brevifolia Antineoplastic
Podophyllotoxin Lignan Podophyllum peltatum Antiviral
Quinidine Alkaloid Cinchona ledgeriana Antiarrhythmic
Vincristine, Vinblastine
Vinca alkaloids Catharanthus roseus Antineoplastic
Plant-derived natural products have been particularly successful as sources of
antitumour and anti-infective agents. Of all drugs approved for the treatment of
cancer between 1940 and 2002, 40% were derived directly from or inspired by plant-
based natural products.16 This relatively high proportion may be partly explained by
the concerted efforts of the US National Cancer Institute to screen large numbers of
plant-based natural products for anti-tumour activity over the last 60 years. Between
1960 and 1982, over 35,000 plant samples mostly from temperate regions of the

CHAPTER 1: INTRODUCTION AND LITERATURE REVIEW
NICHOLAS M. NJUGUNA - Ph.D. THESIS 2014
5
world were collected randomly, from which more than 114,000 plant extracts were
screened for anti-tumour activity. It is from these efforts that anticancer drugs such
as paclitaxel and camptothecin were ultimately developed.17,18
In the treatment of malaria too, plant natural products play a central role in
chemotherapy. Quinine is still used as the drug of choice in the management of
severe complicated P. falciparum malaria while artemisinin derivatives are currently
recommended as first line treatments for uncomplicated P. falciparum malaria in the
form of artemisinin-based combination therapies.19
1.3.3 Drug Discovery from Microbial Natural Products
The discovery of the prototype antibiotic penicillin by Alexander Fleming from a
mould in 1929 and its subsequent commercialisation in the 1940s revolutionalized
the practice of medicine and ushered in the age of antibiotic drug discovery.20–22 Due
to the astounding impact of penicillin, pharmaceutical companies embarked on
concerted efforts to discover new antibiotics from microbial sources over the
following decade. This resulted in the discovery of such compounds as streptomycin
in 1943,23 chlortetracycline in 1945,24 chloramphenicol in 1947,25 cephalosporins
such as cephalosporin C in 1949, erythromycin in 195226 and vancomycin in 1953.27
Most of these compounds are still used clinically as drugs today.

CHAPTER 1: INTRODUCTION AND LITERATURE REVIEW
NICHOLAS M. NJUGUNA - Ph.D. THESIS 2014
6
HN
N
S
OOH
O
Penicillin G
O O
H2N
OH OH OH
ClO
NH H
OH
OH
Chlortetracycline
O2N
OH
HN
O
OH
Cl
Cl
Chloramphenicol
O
O
HOOH
NH
OHHN
HN
NH2O
OHO
HO
HO NH
O
HO NH2
NH
Streptomycin
O O
NHHN
O
HOOC
OHHOOH
HN
ONH
O HN
O
OCl
OH
NH
OHN
ClO
OHOH
O
O
HO
H2NHO
O
HO
NH2
O
Vancomycin
O
O
O O
OHN
O
O
HOOH
OO
OH
OH
Erythromycin
N
S
O
O
HN
HO
O
OHO
H
O
O
NH2
Cephalosporin C
Figure 1.2: Prototype antibiotics of different classes isolated from microbial sources
Microbes, especially fungi and actinobacteria, are perhaps the richest source of
drugs currently used as antibiotics in the treatment of infectious diseases as briefly
summarized in Table 1.2.
Table 1.2: Examples of natural product antibiotics from microbial sources in current clinical use
Compound Chemical Class Microbial source Species
Benzylpenicillin Penicillin Fungi Penicillium spp e.g. P. chrysogenum
Griseofulvin Antifungal Fungus Penicillium griseofulvum
Rifampicin Rifamycin Actinobacteria Amycolatopsis mediterranei
Gentamycin Aminoglycoside Actinobacteria Micromonospora purpurea
Oxytetracycline Tetracycline Actinomycete Streptomyces rimosus
Vancomycin Glycopeptide Actinobacteria Amycolatopsis orientalis
Daptomycin Lipopeptide Actinobacteria Streptomyces roseosporus

CHAPTER 1: INTRODUCTION AND LITERATURE REVIEW
NICHOLAS M. NJUGUNA - Ph.D. THESIS 2014
7
Compound Chemical Class Microbial source Species
Erythromycin Macrolide Actinomycete Saccharopolyspora erythraea
Lincomycin Lincosamide Actinobacteria Streptomyces lincolnensis
Bacitracin Polypeptide Bacteria (Gram+) Bacillus subtilis
Mupirocin Carboxylic acid Bacteria (Gram-) Pseudomonas fluorescens
Microbial natural product-derived drugs have also been licensed for use in the
treatment of non-infectious diseases. For example, the fungal metabolite mevastatin
is the natural-product inspiration behind the development of cholesterol lowering
statin drugs such as lovastatin, atorvastatin and rosuvastatin.28,29 Anthracycline
antibiotics such as the natural product daunorubicin and its semi-synthetic derivative
doxorubicin are clinically used as antineoplastic agents for the treatment of cancer
while the macrolide rapamycin (sirolimus) is used as an immunosuppressant to
prevent organ rejection following transplant surgery.30,31
N
N
F
OH
O
NS
OO
OH OH
Rosuvastatin
OOH
O
O OH
Mevastatin
OOH
O
O OH
Lovastatin
N
F
OH
OOH OH
Atorvastatin
O
NH
O
OO
O
O
OH
OH
OH
O
NH2
OHDaunorubicin
O
OO
O
O
OH
OH
OH
O
NH2
OH
OH
Doxorubicin Figure 1.3: Drugs derived from microbial sources used for treatment of non-infectious diseases
1.3.4 Drug Discovery from Animal-Derived Natural Products
Compared to plants and microbes, the animal kingdom has been relatively neglected
as a source of natural product-derived drugs.32 Nevertheless, some notable examples
of clinically used compounds from different animal species exist, mostly having been
developed from animal toxins, venoms or hormones. For instance, the discovery and
development of angiotensin converting enzyme (ACE) inhibitors such as captopril

CHAPTER 1: INTRODUCTION AND LITERATURE REVIEW
NICHOLAS M. NJUGUNA - Ph.D. THESIS 2014
8
and later analogues such as enalapril, ramipril and lisinopril was inspired from a
nonapeptide found in venom obtained from the Brazilian pit viper (Bothrops
jararaca).33 Since their launch in the early 1980s, ACE inhibitors have become some
of the most widely used drugs in the management of cardiovascular diseases
including hypertension and some types of congestive cardiac failure.34
LisinoprilCaptopril Enalapril Ramipril
N
HS OO
OH
N
OO
OH
NH
O
O
N
OO
OH
NH
O
O
N
OO
OH
NH
O
NH2
OH
Figure 1.4: ACE inhibitors developed from an animal derived natural product
The antidiabetic drug exenatide obtained from the hormone exendin-4 found in
saliva of the Gila monster (Heloderma suspectum) is another drug from an animal
derived natural product currently in clinical use. Other examples of drugs developed
from animal-derived natural products include the antiplatelet compounds
eptifibatide, derived from the peptide barbourin found in the venom of the south-
eastern pygmy rattlesnake (Sistrurus barbouri) and bivalirudin, engineered from
hirudin present in the saliva of leeches (Haementeria officinalis).35,36
Figure 1.5: Gila monster. Source of exendin-4, precursor of antidiabetic drug exenatide
1.3.5 Marine Invertebrates
Considering that oceans and seas make up almost 70% of the earth’s surface and are
home to an enormously rich biodiversity, the marine environment has been
comparatively frugal in yielding natural products that have been successfully
developed into drugs.37 Among the factors that have contributed to the relatively

CHAPTER 1: INTRODUCTION AND LITERATURE REVIEW
NICHOLAS M. NJUGUNA - Ph.D. THESIS 2014
9
low return in marine drug discovery may be the fact that a vast expanse of the
world’s oceans and seas still remains unexplored. Another challenge lies in the
reality that many of the rich sources of marine natural products, such as sponges and
their fauna, survive exclusively in marine environments and are virtually
uncultureable.38 Nevertheless, advances in marine research technology and
exploration have gradually made this environment more accessible and resulted in a
steady increase in the number of novel marine natural products isolated and
reported in the literature over the past 30 years as periodically reviewed by Faulkner
and Blunt et al. 39–45 A common feature that has raised interest in marine natural
products as potential sources of drugs is the extremely high potency exhibited by
many of the bioactive marine compounds thus far isolated. This characteristic is
thought to be most likely a means of circumventing the inevitable dilution of
secondary metabolites produced by marine organisms necessitating such high
potency for efficacy.46
The first drugs to be developed and licensed from marine natural products were the
anti-leukaemic compound cytarabine and the antiviral vidarabine in 1969 and 1976,
respectively. These drugs were developed from the nucleosides spongouridine and
spongothymidine isolated from the demosponge Techtitethya crypta found in the
Caribbean sea.47,48
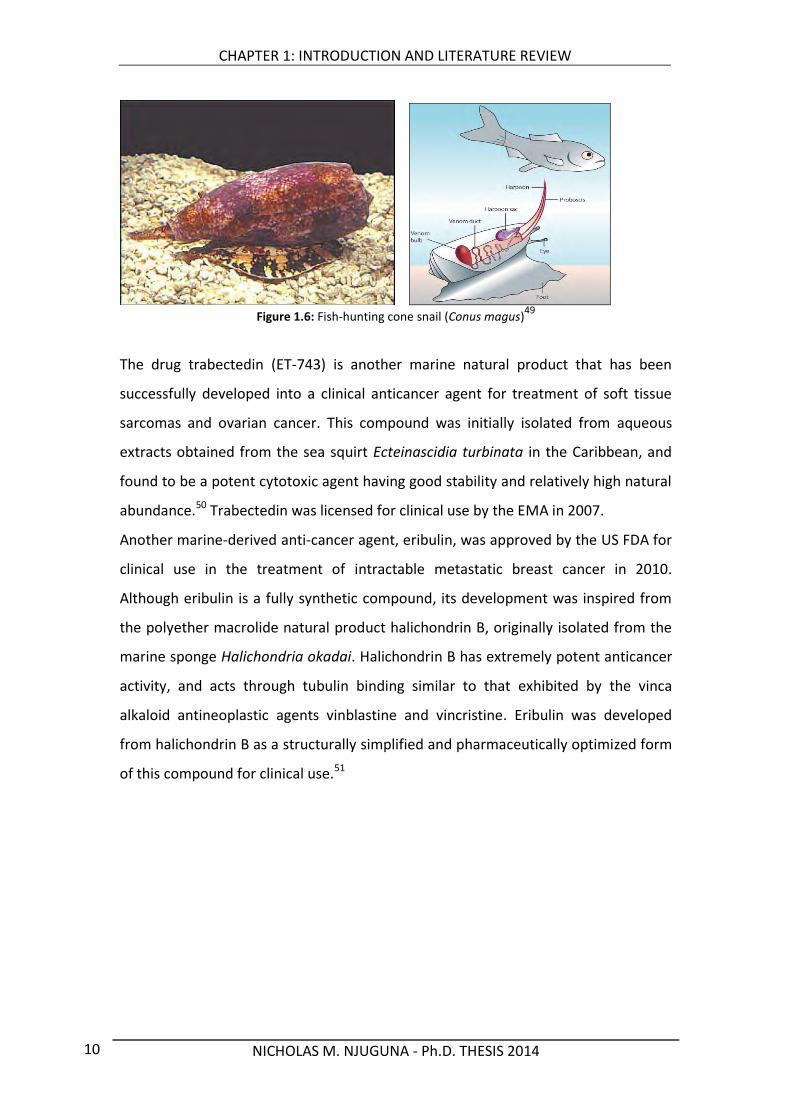
Thereafter, the next marine-derived compound to receive marketing approval in the
USA was the potent non-opioid analgesic ziconotide isolated from a cone snail
species and which was only licensed as recently as 2004. Ziconotide is used for the
management of severe chronic pain and was developed as a synthetic form of the
hydrophilic conopeptide ω-MVIIA obtained from the venom of the Pacific fish-
hunting snail, Conus magus. This drug is the prototype in a new class of selective N-
type voltage sensitive calcium channel blockers.49
CHAPTER 1: INTRODUCTION AND LITERATURE REVIEW
NICHOLAS M. NJUGUNA - Ph.D. THESIS 2014
10
Figure 1.6: Fish-hunting cone snail (Conus magus)
49
The drug trabectedin (ET-743) is another marine natural product that has been
successfully developed into a clinical anticancer agent for treatment of soft tissue
sarcomas and ovarian cancer. This compound was initially isolated from aqueous
extracts obtained from the sea squirt Ecteinascidia turbinata in the Caribbean, and
found to be a potent cytotoxic agent having good stability and relatively high natural
abundance.50 Trabectedin was licensed for clinical use by the EMA in 2007.
Another marine-derived anti-cancer agent, eribulin, was approved by the US FDA for
clinical use in the treatment of intractable metastatic breast cancer in 2010.
Although eribulin is a fully synthetic compound, its development was inspired from
the polyether macrolide natural product halichondrin B, originally isolated from the
marine sponge Halichondria okadai. Halichondrin B has extremely potent anticancer
activity, and acts through tubulin binding similar to that exhibited by the vinca
alkaloid antineoplastic agents vinblastine and vincristine. Eribulin was developed
from halichondrin B as a structurally simplified and pharmaceutically optimized form
of this compound for clinical use.51

CHAPTER 1: INTRODUCTION AND LITERATURE REVIEW
NICHOLAS M. NJUGUNA - Ph.D. THESIS 2014
11
OO
O
O
O
O
O
O
O OO
OOO
O
O
HO
HHO
HO
H
H
H
HO O
O
OOO
O
O
O
O
Halichondrin B
NHO
HO
O S
NO
O
AcO
N
OH
HOO
O
Trabectedin
Eribulin
N
NH2
ONO
HO
OH
HO
Cytarabine
N
NH2
N
OHO
OH
HO
Vidarabine
N
N
Figure 1.7: Examples of marine natural product derived drugs. The portion of Halichondrin B from which the drug eribulin was developed is circled for ease of reference.
Marine-derived natural products that have been advanced to various stages of
clinical trials for different applications in recent years are summarized in Table
1.3.52,53
Table 1.3: Examples of drugs obtained from marine-derived natural products currently in clinical trials
Clinical Phase
Compound Natural product lead
Marine source Therapeutic indication
III Tetrodotoxin Tetrodotoxin Tetraondontiformes Analgesic
II-III Plitidepsin Plitidepsin Aplidium albicans Anticancer
II XEN-2174 χ-conotoxin MrIA Conus marmoreus Analgesic
II Kahalalide F Kahalalide F Elysia rufescens Anticancer
II Plinabulin Halimide Aspergillus spp. Anticancer
II DMXBA Anabaseine Marine worms Schizophrenia
II PM1004 Jorumycin Joruna funebris Anticancer
I-II PM-10450 Jorumycin Joruna funebris Anticancer
I Leconotide ω-conotoxin CVID Conus catus Analgesic
I Marizomib® Salinosporamide A Salinispora tropica Anticancer

CHAPTER 1: INTRODUCTION AND LITERATURE REVIEW
NICHOLAS M. NJUGUNA - Ph.D. THESIS 2014
12
1.3.6 Other Potential Sources of Natural Product-Derived Drugs
It has been estimated that the chemical space occupied by organic compounds,
including natural products, having a molecular weight of less than 500 extends to
approximately 1060 compounds.54 It is therefore, perhaps not an understatement to
claim that despite a significant number of drugs in clinical use having been derived
from natural products, these represent only a small fraction of the vast drug
discovery opportunities yet to be exploited.
Based on the success of drugs from animal natural products, one area that has been
proposed for potential exploitation is the field of venomics, involving drug discovery
from building and screening venom libraries obtained from both terrestrial and
marine organisms.55
Natural products obtained from organisms that inhabit and thrive in extreme
environments have also attracted growing interest in recent years. Extremophilic
microbes such as acidophiles, alkaliphiles, halophiles, piezothermophiles,
hyperthermophiles or psychrophiles56 are increasingly being evaluated as sources of
novel secondary metabolites and possible drug leads.57 For example, the
extremolyte ectoine found in many halophilic microbes that survive in high salt
concentration environments has been investigated as a cytoprotectant and protein
stabiliser with potential application in treatment of conditions such as Alzheimer’s
disease.58,59
Organisms that inhabit the deep sea environment are highly adapted to survive in a
habitat characterized by intensely high pressures, low temperature, oxygen and light
concentrations as well as scarce nutrients. Under such conditions, these organisms
have evolved unique primary metabolic pathways resulting in the production of
entirely novel secondary metabolites. With advances in marine exploration
equipment enabling greater access to this largely unexplored habitat, deep sea
marine organisms continue to attract greater study and have yielded a growing
number of unique bioactive natural products.60 Deep-sea hydrothermal vents have
been identified as habitats occupied by invertebrates capable of surviving and
thriving under possibly the harshest conditions on earth. Though such organisms are
not known to produce natural products, most survive through symbiotic associations
with micro-organisms that do produce secondary metabolites. The first true new

CHAPTER 1: INTRODUCTION AND LITERATURE REVIEW
NICHOLAS M. NJUGUNA - Ph.D. THESIS 2014
13
natural products isolated from deep-sea hydrothermal vents were the ammonificins
and loichichelins reported in 2009. These may represent the first in a possibly rich
resource that provides compounds of medicinal interest in future.61
N
NH
O OH
H
CH3
Ectoine
O
OH
NH2
OH
OH
Br
OH
H
Ammonificin A
NH
HN
NH
HN
NH
HN
N
OH
OO
OHO
O
NHO
O
O
HOO
H2N O
HN
NH
O
HOO
HO
O
OHO
Loihichelin A Figure 1.8: Natural products isolated from organisms that inhabit extreme environments
1.4 Past Decline, Current Status and Future Prospects of Natural Product-Based
Drug Discovery
Despite the numerous successes in obtaining drugs from natural products, there has
been a gradual de-emphasis in natural product drug discovery by most of the major
pharmaceutical companies over the last 20 years. Several factors have led to this
shift, including a greater investment in newer drug discovery approaches based on
synthesis and high throughput screening of large libraries of synthetic compounds
created using combinatorial chemistry. Although the success-rate of drug discovery
using such methodology is lower than that based on natural products, it possesses
the key advantage of speed. Since the compounds screened are already known, the
time and effort needed to characterise and identify them is eliminated, whereas in
natural product-based drug discovery, such technical aspects take up considerable
time and effort. Furthermore, synthetic compounds are much more easily packaged

CHAPTER 1: INTRODUCTION AND LITERATURE REVIEW
NICHOLAS M. NJUGUNA - Ph.D. THESIS 2014
14
into physical libraries for large-scale high throughput screening for biological activity
compared to natural products.62
The reviews published by Newman and Cragg, however, provide compelling
evidence that natural products have been the single-most successful source of
approved drugs over the last 30 years.63–66 Thus, despite the challenges often
encountered in obtaining drugs from nature, the advantages they possess have been
successfully circumvented in those compounds advanced to clinical use. Factors that
might explain these successes include increased access to natural products through
(1) Exploration and research into new environments; (2) advances in compound
separation, isolation and characterization techniques often employing coupled
technologies such as liquid chromatography coupled to solid-phase extraction and
nuclear magnetic resonance67–69 (3) more sensitive and accurate analytical
equipment allowing ease of characterization using non-destructive techniques and
minute quantities of material, for example, multidimensional NMR spectroscopy
using cryoprobes and advances in high resolution mass spectroscopy
instrumentation.70
Additionally, in many cases, natural products possess certain advantages over
synthetic compounds that have distinguished them as more reliable sources of
drugs:71
1. Unmatched diversity and chemical complexity. Chemical scaffolds that would be
virtually impossible or extremely difficult to replicate in the laboratory even using
modern chemical synthetic techniques (e.g. due to presence of numerous chiral
centres, and unusual bond patterns are often commonly encountered in nature.
Even where such synthesis is possible, it may not be amenable to large scale
application necessary for commercial drug manufacture.
2. Natural products tend to occupy a complementary chemical space to that of
conventional drugs, and many quite often violate what are considered to be the
rules of ‘drug-likeness’ yet still possess desirable chemotherapeutic profiles.72
3. Most natural products are the result of thousands of years of evolutionary
development representing optimized output that has been perfected over
countless generations. Thus, unlike synthetic drugs that usually need to undergo
numerous iterative improvements to enhance their pharmacological profiles

CHAPTER 1: INTRODUCTION AND LITERATURE REVIEW
NICHOLAS M. NJUGUNA - Ph.D. THESIS 2014
15
prior to attaining the desired properties, many natural products, such as
antibiotics from microbes, are often produced in a form ready for direct
exploitation.
The paradigm shift of drug discovery driven through wholly synthetic combinatorial
chemistry has not had the anticipated returns in terms of yielding large numbers of
block-buster drugs despite enabling the screening of vast libraries of compounds in
short time-frames. Considering the successes of natural-product driven drug
discovery on the other hand, it appears that an approach that embraces a
combination of both aspects offers the best option for future drug-discovery
programs.73 For example, it has been proposed that natural products could be used
as a basis for creating combinatorial libraries of synthetic compounds, either as a
source of chemical scaffolds or as an inspiration towards natural-product-like
synthetics.74,75 Alternatively, generation of natural product analogues using
biosynthetic enzymes or genetically altered microorganisms may provide an avenue
for accessing unique derivatives of natural product hits, circumventing the
challenges associated with synthetic chemical modification.76 To counter the
problem of limited quantities of rare natural products, bioengineering easily cultured
heterologous microbial vectors to produce the desired compound or its synthetic
intermediate(s) could become commonplace. This approach has been successfully
demonstrated in the production of artemisinic acid, a precursor of the plant derived
sesquiterpene antimalarial artemisinin, using yeast cells.77 Related to this is the
application of metagenomic techniques involving the isolation and identification of
genes present in the environment directly without the need to identify their source
organisms beforehand and producing secondary metabolite natural products by
expressing such genes using heterologous vectors.78,79

CHAPTER 1: INTRODUCTION AND LITERATURE REVIEW
NICHOLAS M. NJUGUNA - Ph.D. THESIS 2014
16
1.5 Metabolism of Xenobiotics
To maintain chemical and functional homeostasis in all body tissues upon exposure
to chemical challenges, most organisms have evolved elaborate metabolic systems.
In man, metabolic transformation of xenobiotics is performed by a diverse array of
proteins, collectively referred to as drug metabolizing enzymes. These convert
chemicals present in food, the environment, pollutants, toxins, cosmetics and drugs
into compounds that can be more readily eliminated from the body. The enzymes
also often catalyse the transformation of endogenous substrates such as steroids,
hormones, and neurotransmitters into active or inactive forms for elimination.80
Metabolism of xenobiotics has traditionally been classified as occurring in phases.
Phase I metabolism involves functionalization reactions on substrates resulting in the
introduction or unmasking of chemical functional groups such as hydroxyls, amines,
carboxylic acids or thiols. Phase II metabolism involves synthetic conjugation
reactions in which the functionalized xenobiotic metabolite is chemically bound to a
polar endogenous substrate. Although phase II metabolism often involves the
product formed from phase I reactions, it can also take place directly on the parent
substrate.The overall goal of xenobiotic metabolism is to transform foreign
compounds into more polar, water soluble forms that can be more readily
eliminated from the body.
Phase I metabolic reactions introduce or unmask a functional group in the xenobiotic
substrate to provide a chemical site for subsequent conjugation reactions. Several
enzymes are involved in these reactions which chemically broadly encompass
aliphatic and aromatic hydroxylations usually through monooxygenation reactions,
reductions and hydrolysis of esters and amides. In most cases, phase I metabolism
results in only a slight increase in substrate hydrophilicity.
The cytochrome P450 (CYP450) superfamily of enzymes is a class of oxidoreductases
coded for by 57 genes and 58 pseudogenes in humans which are the most important
group of drug metabolising enzymes in man.81 These enzymes are monooxygenases
that catalyse the chemical addition of a single oxygen atom to a vast array of both
endogenous and xenobiotic substrates in a general reaction simplified thus:
O2 NADPH H+ NADP+ H2OR OHR H

CHAPTER 1: INTRODUCTION AND LITERATURE REVIEW
NICHOLAS M. NJUGUNA - Ph.D. THESIS 2014
17
Structurally, CYP450 enzymes are haemoproteins with an average molecular weight
of approximately 50,000 Da.82 At their active sites, they contain a prosthetic
ferroprotophyrin IX ring at the centre of which a reduced iron (Fe) atom is bound to
four nitrogen atoms and has two free coordination sites for bonding to a conserved
cysteine residue from the surrounding protein chain and to substrate atoms.83
N N
NN
FeII
O OH OHO
Figure 1.9: Structure of chain A of human CYP3A4 enzyme. (The prosthetic iron protoporphyrin IX ring system is clearly visible at the active site of the enzyme).
Intracellularly, CYP450s are bound to the membrane of the smooth endoplasmic
reticulum in close proximity to cytochrome P450 reductase and cytochrome b5 which
are both important components in the CYP450 oxidation cycle. CYP450s are also
found in mitochondrial membranes but in this case having their globular domain
oriented towards the lumen.84
Figure 1.10: Location of CYP450 and related proteins in the endoplasmic reticulum membrane
85

CHAPTER 1: INTRODUCTION AND LITERATURE REVIEW
NICHOLAS M. NJUGUNA - Ph.D. THESIS 2014
18
CYP450s are distributed in virtually all body tissues but occur at their highest
concentrations in the liver. Other organs in which the enzymes are present in
significant concentrations include the respiratory tract, kidneys, gastro-intestinal
tract, brain, heart and skin.86 Some isoforms are present in varying concentrations in
all these different sites, while others are known to be preferentially expressed only
in certain tissues or stages of embryonic development. For example, CYP3A7 is
expressed abundantly in the endometrium and fetal liver during pregnancy but its
concentration and activity rapidly decline after birth and the isoform is virtually
absent in adult tissue. On the other hand, all other CYP isoforms are only present at
extremely low concentrations in fetal liver but gradually increase after birth.87
Figure 1.11: Body map illustrating distribution of CYP isoforms in extra-hepatic tissues
88
A few CYP450 enzymes belonging to the families CYP1, CYP2 and CYP3 have been
identified as being involved in the metabolism of xenobiotics. Of these, five specific
isoforms (CYP1A2, 2C9, 2C19, 2D6 and 3A4) contribute to the metabolism of
approximately 95% of drugs that are metabolized by the CYP enzyme system,
representing approximately 75% of all clinically used drugs.89

CHAPTER 1: INTRODUCTION AND LITERATURE REVIEW
NICHOLAS M. NJUGUNA - Ph.D. THESIS 2014
19
CYP1A1/2 CYP1B1 CYP2A6CYP2B6
CYP2C8
CYP2C9CYP2C19
CYP2D6
CYP2E1
CYP3A4/5
Non-P450 Enzymes
Figure 1.12: Relative contribution of CYP450 isoforms to phase I drug metabolism
90
Oxidation of substrates by CYP450s is a complex multistep process involving the
enzyme, reduced nicotinamide adenine dinucleotide phosphate (NADPH) as the
electron donor and flavin adenine dinucleotide (FAD)-containing P450 reductase
serving as the electron transfer bridge as illustrated in Figure 1.13.85
Figure 1.13: Simplified catalytic cycle illustrating substrate oxygenation by CYP enzymes
85

CHAPTER 1: INTRODUCTION AND LITERATURE REVIEW
NICHOLAS M. NJUGUNA - Ph.D. THESIS 2014
20
In addition to catalyzing classical and relatively direct monooxygenation reactions,
CYP450s have been found to mediate more complex transformations such as
chlorine oxygenation, aromatic dehalogenation, ring expansion and ring formation,
as well as cleavage of amino oxazoles and the 1,2,4-oxadiazole ring.91,92
Genes encoding for CYP450s belonging to the families CYP1, CYP2 and CYP3 are
polymorphic. However, the phenotypic importance of the variant alleles in terms of
catalytic activity and protein expression differs. Of the major drug metabolising
isoforms, CYP2C9, CYP2C19 and CYP2D6 in particular are well known to exhibit
pronounced polymorphism, which often translates to significant inter-individual or
inter-population variations in how these enzymes metabolize xenobiotics.93 Such
variation can have a major impact on the therapeutic efficacy of drugs metabolised
predominantly by these isoforms as well as on their potential toxicity due to
phenotypic variability in metabolism-mediated detoxification and elimination.94
Table 1.4: Summary of other non-CYP450 enzymes involved in metabolism of xenobiotics
Enzyme class Characteristics
Phase I
Flavin-containing monoxygenases (FMOs)
Complementary redox system to CYP450s in drug metabolism but thermally labile, less prone to inhibition and/or induction
95–97
Aldehyde oxidase and xanthine oxidoreductases
Molybdenum hydroxylases involved in oxidation of aromatic azaheterocyclic xenobiotics and activation of prodrugs such as allopurinol and pyrazinamide
98
Monoamine oxidases Key in metabolism of endogenous catecholamine neurotransmitters; inhibitors used clinically as antidepressants and in Parkinson’s disease
99–102
Alcohol and aldehyde dehydrogenases Extensively diverse superfamilies of polymorphic enzymes critical in the oxidative metabolism of alcohols and aldehydes
103
Esterases Important for activation of ester, thioester and amide prodrugs
104
Aldo-keto reductases Involved in detoxification of reactive aldehydes and α,β-unsaturated carbonyl xenobiotics
105–107
Phase II
Uridine glucuronosyl transferases Principally conjugative enzymes that couple xenobiotics or their Phase I metabolites to an endogenous substrate donated by cofactors such as uridine 5’-diphosphoglucuronic acid (UDPGA), 3’-phosphoadenosine-5’-phosphosulfate (PAPS), acetyl-coenzyme A, glutathione and S-adenosyl methionine (SAM).
108–121
Sulfotransferases
N-acetyl transferases
Glutathione-S-transferases
Methyl transferases

CHAPTER 1: INTRODUCTION AND LITERATURE REVIEW
NICHOLAS M. NJUGUNA - Ph.D. THESIS 2014
21
1.6 Classification of Metabolites
Regardless of the route through which xenobiotic substrates are metabolized, the
net result is the formation of metabolic species that may be broadly classified based
upon chemical reactivity as stable or reactive.
1.6.1 Stable Metabolites
1.6.1.1 Biologically inactive stable metabolites
In many instances, the chemical modification of xenobiotics by metabolic enzymes
results in a total or significant loss of pharmacological activity due to changes in their
chemical properties and ability to interact with therapeutic targets in vivo. When
designing drugs, emphasis is often placed on developing compounds that possess
optimal metabolic stability to allow for convenient dosing. In some cases, however,
drugs may be intentionally designed to be readily metabolised to inactive species in
a predictable and controllable manner after exerting their therapeutic activity by
incorporating metabolic hotspots in the molecule. This ‘soft drug’ design is
particularly useful in developing medicines that have minimal adverse effects arising
from their interaction with off-target receptors or due to biotransformation to
multiple metabolic products.122
1.6.1.2 Biologically active metabolites
Conversely, metabolism of the xenobiotic substance may result in products that
possess pharmacological activity of equal, lesser or greater magnitude than the
parent. Active metabolites are thus be defined as metabolic products of
biotransformation that have pharmacological activity against the same
pharmacological target as the parent drug molecule.123 The phenomenon of active
metabolite formation is sometimes utilized in the formulation of medicines as
prodrugs which are inherently inactive but designed to undergo metabolic
biotransformation to yield therapeutically active metabolites. The prodrug approach
is useful in allowing for the design of compounds that possess optimized
physicochemical properties such as membrane permeability, aqueous solubility or
chemical stability and enhanced pharmacokinetic profiles.124,125
Most active drug metabolites arise from phase I metabolism, but some medicines
are known to yield both active and inactive phase II metabolites. For example,

CHAPTER 1: INTRODUCTION AND LITERATURE REVIEW
NICHOLAS M. NJUGUNA - Ph.D. THESIS 2014
22
morphine-6-glucuronide is known to possess even greater analgesic activity than its
parent morphine, whereas morphine-3-glucuronide has been shown to be a potent
opioid antagonist in animal models and somewhat paradoxically, also appears to
enhance pain through unknown mechanisms.126,127
Figure 1.14: Glucuronide metabolites of morphine having different pharmacological activities
1.6.2 Reactive Metabolites
Reactive metabolites were first recognized in work reported in the 1940s when
James and Elizabeth Miller investigated the metabolism in rats of the carcinogenic
dye 4-dimethylaminoazobenzene (DAB) formerly used as a food coloring agent.
They observed that liver proteins of animals treated with DAB became permanently
yellow colored. Upon treatment with alkali, these proteins released 3-methylthio-N-
methyl-4-aminoazobenzene, suggesting that covalent binding involved modification
of protein methionine residues by an “active form” of a mono-demethylated
metabolite of the dye.128 Reactive metabolites are unstable and chemically reactive
products of metabolism capable of reacting with endogenous macromolecules in
their immediate environment, including the enzymes responsible for their formation.
These metabolites may be classified into two broad categories: electrophiles - which
may be further classified as being either alkylating or acylating agents and free
radicals. Alternatively, electrophiles may also be classified as being soft or hard
species. The classic soft electrophiles include epoxides, α,β-unsaturated carbonyls,
quinones, quinone imines, quinone methides, imine methides, isocyanate,
isothiocyanates, aziridinium and episulfonium ions. Aldehydes and iminium ions are
regarded as being hard electrophiles.129 Electrophiles vary in their selectivity for
biological nucleophiles but in general, mainly target cysteine, methionine, lysine,

CHAPTER 1: INTRODUCTION AND LITERATURE REVIEW
NICHOLAS M. NJUGUNA - Ph.D. THESIS 2014
23
histidine and to a lesser extent glutamate and aspartate amino acid residues on
proteins.
Figure 1.15: Generalised classification of reactive metabolites
Reactive metabolites are difficult to isolate or characterize and their chemical
structures can only be inferred from trapped products. Even in the cases where they
can be synthesized, these compounds are stable only in aprotic solvents and cannot
be administered to animals to study their in vivo effects directly.130
1.7 Metabolism-Mediated Xenobiotic Toxicity
Metabolism of xenobiotics is usually a detoxification process. In some instances,
however, metabolism may lead to formation of the reactive metabolites alluded to
previously causing deleterious effects due to their interaction with endogenous
macromolecules. The mechanisms through which reactive metabolites cause toxicity
are complex but generally involve covalent binding of such metabolites to enzymes,
membrane proteins or nucleic acid bases in DNA or RNA.131–133 Covalent binding may
result in sufficient structural modification of the endogenous target causing it to lose
its primary biological function. In the case of enzymes, inhibition of catalytic activity
may occur, while for DNA and RNA, disruption of genetic material may result in
mutations and possibly carcinogenesis. In addition to binding directly to cellular

CHAPTER 1: INTRODUCTION AND LITERATURE REVIEW
NICHOLAS M. NJUGUNA - Ph.D. THESIS 2014
24
targets, reactive metabolites may undergo chemical transformation to yield highly
reactive oxygen species or radicals that trigger damaging oxidative stress in target
tissues.134
It is now almost universally accepted that idiosyncratic adverse reactions (IADRs) to
xenobiotics are mediated through reactive metabolites interacting with
macromolecular targets in vivo.135 Among the mechanisms proposed that lead to
such idiosyncratic reactions is an immune response triggered by covalent binding of
the reactive metabolite changing the 3-dimensional structure of the target
macromolecule.
Idiosyncratic adverse reactions are particularly difficult to predict during drug
development because they are unrelated to the known pharmacology of the
compound, are usually not dose-dependent and since they only occur only rarely,
might not be observed in the relatively small number of patients monitored during
clinical trials. Additionally, these reactions cannot easily be studied using animal
models during preclinical development since their occurrence in such models is often
idiosyncratic as well.137
1.7.1 Metabolism-Mediated Toxicity of Conventional Drugs
Numerous examples of drugs withdrawn from the market or whose clinical use is
restricted due to toxicity arising from metabolic biotransformation exist.
Paracetamol is one of the most widely used over-the-counter analgesic-antipyretic
Figure 1.16: Relationship between metabolism and toxicity 136

CHAPTER 1: INTRODUCTION AND LITERATURE REVIEW
NICHOLAS M. NJUGUNA - Ph.D. THESIS 2014
25
medications worldwide with a good safety profile when administered at therapeutic
doses. However, in overdose, paracetamol is a potent hepatotoxin due to its
metabolism to a reactive quinone-imine intermediate that covalently binds to
hepatocellular proteins resulting in necrosis and acute liver failure.138,139 At normal
doses, CYP450-mediated quinone-imine biotransformation is a minor metabolic
pathway with most of the drug undergoing glucuronidation and sulfonation as the
preferred routes of metabolism. At high drug concentrations, however, quinone-
imine formation may occur at a rate that exceeds the capacity of normal glutathione-
mediated detoxification leading to the toxic effects observed clinically.140
Figure 1.17: Metabolism and bioactivation of paracetamol
The antipsychotic drug clozapine is another example known to exhibit reactive
metabolite-mediated drug toxicity. Clinically, clozapine is associated with adverse
incidences of agranulocytosis in about 0.8% of patients characterised by depletion of
neutrophil counts triggered by the formation of a reactive nitrenium or iminium ion
metabolic intermediate.141 Clozapine toxicity appears to affect neutrophils most
because they express high levels of myeloperoxidases, which are the enzymes
thought to be responsible for the formation of the reactive metabolic intermediates.

CHAPTER 1: INTRODUCTION AND LITERATURE REVIEW
NICHOLAS M. NJUGUNA - Ph.D. THESIS 2014
26
Further evidence that clozapine toxicity is mediated via iminium intermediates is
provided by the fact that the structurally analogous drugs quetiapine and loxapine in
which the diazepine ring is replaced by thiazepine and oxazepine rings respectively,
are devoid of similar adverse effects.142 Absence of the bridging N atom required to
form an iminium ion in both cases supports the proposed bioactivation theory.
Figure 1.18: Bioactivation of clozapine. (The non-reactive intermediate forming analogues quetiapine and loxapine are illustrated for structural comparison).
As illustrated with paracetamol, for many compounds, toxicity due to reactive
metabolite formation is partly influenced by the dose of the drug administered. A
survey published in 2011 by Stepan et al. found that 84% of drugs withdrawn from
the market due to IADRs associated with reactive metabolites had daily doses
greater than 100 mg compared to none administered at doses less than 10 mg and
only 6% administered at 10 – 50 mg daily. Similar trends were observed for
marketed drugs whose use is restricted by so-called “black-box” warnings. In this
case, 81% have typical daily doses greater than 100 mg, 11% are administered at 50
– 100 mg while none administered at less than 10 mg fall under such restrictions.143
1.7.2 Metabolism-Mediated Toxicity of Natural Products
Natural products that cause toxic effects in humans mediated through metabolic
biotransformation have been widely reported. Aflatoxin B1 is a long established
thermo-labile hepatotoxin produced by the fungal species Aspergillus flavus and A.

CHAPTER 1: INTRODUCTION AND LITERATURE REVIEW
NICHOLAS M. NJUGUNA - Ph.D. THESIS 2014
27
parasiticus commonly found as contaminants in poorly stored mouldy grains such as
maize or wheat.144 The mechanism by which aflatoxin B1 causes toxicity involves
initial formation of a highly reactive exo-epoxide resulting from oxidative
metabolism of the parent. The epoxide intermediate reacts with DNA, specifically
binding to the N7 atom of guanine residues, thereby causing defects in the DNA
sequence. Although the epoxide can also bind directly to amino acid residues in
proteins, this process usually involves initial acid-catalysed hydrolysis of the epoxide
to aflatoxin B1 dihydrodiol followed by base-catalysed conversion to aflatoxin B1
dialdehyde. The dialdehyde form then attacks lysine residues present in hepatocyte
proteins, disrupting their 3D structure and functionality and resulting in toxicity.145
Figure 1.19: Metabolic bioactivation of aflatoxin B1 and formation of DNA and protein adducts
Aristolochic acids are nitrophenanthrene carboxylic acid natural products present in
plants of the genus Aristolochia. In incidences first reported in 1993, when
components of these plant species were inadvertently included in herbal
preparations used as weight loss agents in Belgium, cases of terminal renal failure
resulted in patients.146 It has since been established that aristolochic acids are
metabolized to reactive intermediates implicated in causing nephropathies
characterised by renal fibrosis and development of urothelial cancer.147,148 Metabolic
bioactivation of aristolochic acids involves the initial reduction of the nitro group
catalysed by CYP1A1, CYP1A2 or COX-I followed by condensation resulting in
formation of a lactam ring. Oxidation of the lactam at the N atom forms the N-
hydroxide which is transformed to a reactive cyclic nitrenium ion in a reaction

CHAPTER 1: INTRODUCTION AND LITERATURE REVIEW
NICHOLAS M. NJUGUNA - Ph.D. THESIS 2014
28
possibly mediated by sulphotransferases.149–151 The nitrenium ion intermediate
covalently binds with adenosine and guanine residues in DNA leading to mutations
that trigger carcinogenesis in renal tissue where the enzymes responsible for
reactive intermediate formation appear to have high activity.152
Figure 1.20: Bioactivation of aristolochic acids and binding to DNA residues The botanical dietary supplement kava derived from Piper methysticum contains the
natural products kawain and methysticin as the main active ingredients thought to
be responsible for its sedative, anxiolytic, muscle relaxant, anaesthetic and
anticonvulsant properties.153 Reports of hepatotoxicity associated with kava use
have been linked to the bioactivation of methysticin in vivo. The proposed
mechanism for bioactivation involves initial CYP450-catalysed conversion of the
benzodioxole ring in methysticin to a catechol metabolite that undergoes further
oxidation to form the electrophilic ortho-quinone which may react with glutathione
or covalently bind and modify hepatic proteins.154

CHAPTER 1: INTRODUCTION AND LITERATURE REVIEW
NICHOLAS M. NJUGUNA - Ph.D. THESIS 2014
29
Figure 1.21: Proposed bioactivation of methysticin in kava preparations
Other natural product metabolites exert their toxic effects indirectly through drug
interactions with conventional medicines. A well documented example of this is the
interaction of grapefruit juice and numerous drugs, first reported with the
antihypertensive calcium channel blocker felodipine.155 Components in grapefruit
juice have been shown to be potent inhibitors of enterocyte CYP3A4, which is
responsible for presystemic metabolism of many orally administered drugs in the
GIT.156 The enzyme inhibition is mechanism-based and for drugs such as felodipine,
may result in a clinically significant increase in the amount of drug absorbed from the
GIT and its subsequent plasma concentrations. Enzyme inhibition and reactive
metabolite studies have shown that the main component in grapefruit juice
responsible for CYP3A4 inhibition is the furanocoumarin bergamottin acting via
bioactivation to a reactive epoxide intermediate.157,158
Figure 1.22: Proposed bioactivation of bergamottin by intestinal CYPs and resultant CYP3A4 inhibition

CHAPTER 1: INTRODUCTION AND LITERATURE REVIEW
NICHOLAS M. NJUGUNA - Ph.D. THESIS 2014
30
1.8 Profiling ADME Properties in Early Drug Discovery
Prior to 2000, the majority of drug candidates progressing through to clinical trials
but which failed to receive marketing approval were mainly unsuccessful due to poor
absorption, distribution, metabolism, excretion (ADME) and toxicology properties or
drug metabolism and pharmacokinetic (DMPK) profiles.159,160 To avert such high
attrition rates, pharmaceutical companies began to increasingly conduct ADME
studies much earlier in the drug discovery process as part of rational drug design.161–
163 This shift has had a dramatic effect in reducing the percentage of drug candidates
that fail to meet regulatory requirements due to ADMET/DMPK liabilities over the
last decade. Despite these changes in emphasis, however, drug toxicity and lack of
efficacy are still the leading causes of attrition during late stage drug development or
withdrawal of marketing approval for already licensed drugs.164
Figure 1.23: Main causes of compound attrition during drug development (1991 vs 2000)
159
1.8.1 Computational Tools in ADMET Profiling
Computational tools are an integral part of modern drug discovery and are employed
in virtually all aspects of development from initial hit identification to marketing
authorisation.165 They are used to help predict ADMET properties of drug candidates
early in the development cycle to minimise the costs and time taken to determine
such profiles experimentally. In silico tools are used to calculate or predict structure-
based physicochemical parameters such as acid dissociation constants (pKa),
lipophilicity, aqueous solubility, H-bonding, polar surface area and other so-called

CHAPTER 1: INTRODUCTION AND LITERATURE REVIEW
NICHOLAS M. NJUGUNA - Ph.D. THESIS 2014
31
“Lipinski Rule of Five” descriptors for drug-likeness on which ADMET properties
largely depend.166,167 Additionally, actual ADMET properties may be predicted based
on combinations of the physicochemical data generated and simulated models using
mathematical algorithms based on experimental data from real drugs. Predicting
ADMET properties such as absorption, which are dependent on both known
characteristics such as compound solubility, lipophilicity, and polar surface area but
also on unknown parameters such as active transport is challenging even using
computational tools. Consequently, many software applications differ in the
algorithms and statistical approaches they use to predict these properties, usually
incorporating numerous property descriptors and assigning different weights to
them in overall property calculations.168–170 Despite this, however, predictive
computational tools for ADMET profiling are never 100% accurate with models and
simulations being highly dependent upon the quality of the real-world experimental
data used to build them.171,172
Prediction of compound metabolism using in silico tools uses several approaches,
usually combinations of rule-based and structure-based QSAR models often relying
on known 3D structures or protein homology models of enzymes to calculate the
probability and magnitude of interactions between compounds and enzymes using
ligand docking simulations.173,174 These tools are typically designed to predict the
most likely site(s) of metabolism on test molecules and the chemical species likely to
arise from transformation at the identified sites by specific xenobiotic metabolizing
enzymes.175–177
Apart from the prediction of metabolism and toxicity, computational tools are also
used to profile other ADMET properties such as compound absorption, oral
bioavailability and distribution in vivo, particularly for drugs intended to exert their
effects in specific target organs such as the CNS.178,179 At present, however, success
in accurate prediction of metabolism using current in silico tools remains still
somewhat limited.
1.8.2 Metabolic Stability and Enzyme Phenotyping
A key determinant of the rate at which drugs are cleared from the body and
therefore their therapeutic effectiveness is the ability to resist metabolic

CHAPTER 1: INTRODUCTION AND LITERATURE REVIEW
NICHOLAS M. NJUGUNA - Ph.D. THESIS 2014
32
transformation. For compounds that are metabolised to toxic species, ease of
biotransformation may be an important factor in determining the magnitude or risk
of toxicity in vivo. In vitro metabolic stability assays are therefore conducted in early
ADME profiling to provide data for use in predicting or extrapolating in vivo intrinsic
clearance rates and possibly to identify the relative contribution of different organs
or tissues to compound clearance.180
Experimental in vitro metabolic stability data is obtained by incubating compounds in
a variety of metabolism systems most commonly, microsomal fractions from liver,
kidney, lung or intestines, fresh or cryopreserved hepatocytes, liver slices, as well as
plasma and S9 fractions.181,182 In addition to using human tissue, metabolic systems
from animal models such as mice, rats, dogs and primates are also used to conduct
these assays. Data from in vitro metabolic stability experiments is used to
extrapolate the in vivo metabolic disposition of compounds in both humans and
animals and provides information for prioritising compounds to be advanced to
more capital intensive and technically involving preclinical in vivo pharmacokinetic
assays. Identification of the metabolites formed from such stability assays also
provides information on the metabolic hotspots in the substrates and insights on
how such can be modified through medicinal chemistry efforts if necessary.183
Enzyme phenotyping assays are performed to identify the specific enzymes involved
in any transformation observed from metabolic stability assays and the individual
contribution of these enzymes to overall compound disposition. Phenotyping assays
provide an early indication of compounds whose disposition in different patient
populations may vary significantly because their main route of metabolism is
mediated by genetically polymorphic enzyme isoforms. Since CYP450s are the
enzymes known to metabolize the vast majority of drugs in clinical use, in vitro
CYP450 phenotyping assays are by far the most commonly performed in early
ADMET profiling. Enzyme phenotyping may be carried out by incubating test
substrates in different individual isolated purified recombinant enzymes and
subsequently determining the relative contribution of each to metabolism.
Alternatively, compounds may be incubated in microsomes which typically contain a
mixture of enzyme isoforms and the individual contribution of each to metabolism
determined by adding specific inhibitors of the different isoforms then calculating

CHAPTER 1: INTRODUCTION AND LITERATURE REVIEW
NICHOLAS M. NJUGUNA - Ph.D. THESIS 2014
33
the difference in metabolism observed in either case.184 Enzyme inhibitors used in
the latter approach are usually specific chemicals and drug compounds, or
alternatively, poly- or monoclonal antibodies that bind and inhibit specific enzyme
isoforms.185
These techniques have inherent shortcomings that often lead to poor correlation
between enzyme phenotyping data generated using the two methods for the same
compound. For instance, CYP450 phenotyping using liver microsomes and specific
chemical inhibitors is often confounded by the fact that the inhibitors used exhibit
some degree of cross-reactivity with different isoforms. Use of specific antibodies in
place of chemical inhibitors may minimize unwanted cross-reactivity effects but
introduces higher costs and experimental complexity. On the other hand, CYP450
phenotyping using recombinant enzymes expressed from heterologous systems such
as E. coli or yeast is often affected by the fact that activity of the enzymes may vary
widely owing to differences in CYP450 protein:NADPH reductase: cytochrome b5 co-
expression ratios.186
1.8.3 Predicting Formation of Reactive Metabolites from Structural Alerts
Structural alerts are chemical functional groups in xenobiotics that may undergo
metabolic bioactivation to reactive intermediates that result in toxicity. These groups
are sometimes referred to as toxicophores. The presence of structural alerts is,
however, not always definitive proof of bioactivation to form reactive metabolites.
Many drugs that possess structural alerts are devoid of reactive metabolite
formation liabilities and exhibit good safety profiles. Nevertheless, in early drug
discovery ADME profiling, structural alerts are often flagged and used as a basis for
‘go-no go’ decisions (Figure 1.24) based on the existing body of evidence supporting
their involvement in formation of toxic reactive metabolites and covalent protein
binding.187

CHAPTER 1: INTRODUCTION AND LITERATURE REVIEW
NICHOLAS M. NJUGUNA - Ph.D. THESIS 2014
34
Figure 1.24: Example of possible decision scheme for handling bioactivation data at different stages of drug development. Scheme (a): Reactive metabolite data from early drug design and optimization; Scheme (b): Covalent binding data in late preclinical or early clinical research (CRM: Chemically reactive metabolites; CB: Covalent binding)
187
Established toxicophores whose presence in drug design is avoided as much as
possible include anilines, quinones, quinone methides, monosubstituted furan and
thiophene rings, benzodioxoles, α,β-unsaturated carbonyls, terminal alkenes,
terminal and ω-1 alkynes, cyclic tertiary amines, aldehydes and epoxides, among
others.188
Figure 1.25: Examples of some common structural alerts associated with CYP inhibition
189
Detection of structural alerts when conducting early ADME profiling on potential
drug compounds may involve simple unaided visual inspection of molecular
structures when working with small compound libraries or, more commonly, the use
of software to screen large compound sets.190 Apart from allowing faster screening
of compounds, computational tools have the advantage of being programmable for

CHAPTER 1: INTRODUCTION AND LITERATURE REVIEW
NICHOLAS M. NJUGUNA - Ph.D. THESIS 2014
35
detection of structural alerts that might be ‘masked’ within complex chemical
structures and thus not immediately obvious to the inexperienced eye.
1.9 In vitro Determination of Reactive Metabolite Formation
1.9.1 Enzyme Inhibition Assays
Enzyme inhibition assays using substrates that generate metabolites which can be
monitored through relatively simple detection techniques such as
fluorospectrometry are routinely used for high throughput compound screening for
assessing potential drug-drug interaction. In these screens, the test compounds are
incubated in purified recombinant enzymes or microsomal proteins in the presence
of probe substrates of the drug metabolizing enzyme(s) to be monitored for
inhibition.191 Comparison of the rate or extent of probe substrate metabolism in
incubations containing the test compound against those without the test compound
provides an indication of how strongly enzyme activity is inhibited. Detection
techniques such as fluorimetry may be used to quantify enzyme inhibition if the
metabolites generated are fluorescent compounds.192
A modification of the enzyme inhibition assay that determines if inhibition of enzyme
activity is time-dependent involves first incubating the test compound with the
enzyme in the presence and absence of co-factors before adding the probe
substrate. If enzyme inhibition is observed to be significantly higher following pre-
incubation with the test compound compared to no pre-incubation, this is strongly
indicative that the formation of reactive metabolites may be responsible for the
observed inhibition.193,194
Enzyme inhibition assays in early drug discovery are typically aimed at screening a
large number of compounds in a short time and are usually carried out in 96-well
microplates to increase throughput. At this stage, emphasis is placed more on
approximating the relative enzyme inhibition potential of different compounds for
purposes of ranking. Detailed inhibition assays are only being carried out later to
determine parameters such as the mode of inhibition and enzyme inhibition
constants.

CHAPTER 1: INTRODUCTION AND LITERATURE REVIEW
NICHOLAS M. NJUGUNA - Ph.D. THESIS 2014
36
1.9.2 Reactive Metabolite Trapping Assays
In vitro reactive metabolite trapping experiments are perhaps the most common
technique for detecting electrophilic reactive metabolic intermediates in early drug
discovery. While time dependent enzyme inhibition assays are typically used to
screen large volumes of compounds in a short time, in most cases they do not
provide data related to the actual intermediate or species responsible for any
observed inhibition, thus the need to carry out trapping experiments.
The general procedure in these assays involves the incubation of test substrates in a
suitable metabolic system, most commonly human hepatic microsomes with the
necessary cofactors included and in the presence of a nucleophilic trapping agent
capable of forming stable covalent adducts with any reactive metabolites formed. In
the case of reactive metabolites arising from oxidative bioactivation reactions, in
vitro assay systems that make use of electrochemical oxidation cells in place of
biological systems such as microsomes have been reported.195,196 The ideal choice of
trapping agent used to capture reactive metabolites depends on the reactivity of the
metabolites formed. Soft electrophilic reactive metabolites are most commonly
trapped using reduced glutathione (GSH) or glutathione analogues such as
glutathione ethyl ester. Hard electrophiles such as iminium ions may be too reactive
to be effectively trapped using GSH but ideal for trapping using cyanide ions.
Reactive aldehyde metabolites are similarly best trapped using amines such as
methoxylamine and semicarbazide.197 Stable isotope radiolabelled analogues and
fluorescent dansylated derivatives of glutathione have also been reported to
improve sensitivity in detecting trapped reactive metabolites.198–200
Highly sensitive analytical techniques are required to detect trapped intermediates
from these in vitro assays due to the typically low concentrations of the metabolites
formed and also the need to have structural data that can be used in adduct
identification. At present, liquid chromatography coupled to tandem mass
spectrometry (LC-MS/MS) offers the best analytical option by allowing for the
separation of analytes from the often complex biological sample incubation matrix
and subsequent identification of trapped metabolites based on their mass/charge
(m/z) ratios and fragmentation patterns.201,202

CHAPTER 1: INTRODUCTION AND LITERATURE REVIEW
NICHOLAS M. NJUGUNA - Ph.D. THESIS 2014
37
1.9.3 Covalent Binding Studies
Covalent binding studies are usually only conducted in the later stages of reactive
metabolite profiling of drug leads because they require the use of radiolabelled test
compounds. Due to the relatively high costs, hazards and technical expertise
involved in synthesizing radiolabelled substrates, these studies are only performed
on compounds already in fairly advanced phases of preclinical drug development.203
In these assays, the general procedure involves incubation of the radiolabelled drug
in a metabolising system, usually microsomal proteins, in the presence of the
necessary cofactors. At the end of the incubation, microsomal proteins are
precipitated, centrifuged and washed to remove any unbound drug or metabolites.
The washed proteins are then digested and residual radioactivity measured as an
indicator of the radiolabelled drug or metabolite covalently bound to the proteins.
Nucleophilic trapping agents such as reduced glutathione may also be incorporated
in the incubation to determine their influence on the extent of any covalent binding
observed.204

CHAPTER 1: INTRODUCTION AND LITERATURE REVIEW
NICHOLAS M. NJUGUNA - Ph.D. THESIS 2014
38
1.10 Research Program
1.10.1 Study Justification
Toxicity of drug candidates is a major cause of attrition of promising compounds in
drug discovery. Only about 11% of compounds entering clinical development ever
reach the market - more than a third are withdrawn due to reasons related to
toxicology and clinical safety.205 Although overt toxicity studies are often conducted
in vitro alongside assays to determine pharmacological activity on drug candidates
from synthetic or natural product origin, these studies are often not equipped to
predict toxicity arising from in vivo metabolism of the test compounds. Numerous
drugs have been developed, licensed and marketed but subsequently discovered to
cause IADRs mediated through metabolic intermediates that have significant toxicity
profiles leading to their withdrawal from the market. Even in situations where the
drug is not withdrawn, severe limitations in its therapeutic application may have to
be implemented in the form of “black box” warning labels that restrict its use.
From a drug development perspective, such scenarios greatly undermine the time,
effort and cost involved in developing a compound for therapeutic use in patients.
To minimize these situations, ADME profiling studies are increasingly being
incorporated early in the drug discovery process.
Drugs from natural sources are often considered to be safer and less likely to cause
toxicity compared to synthetic compounds. While this assumption may be true for
many natural products, it does not apply universally. In many third world countries,
access to medicine and healthcare services is an unmet need to the majority of the
population. Consequently, natural product-based alternative and traditional herbal
medicines play an important role in providing remedies to ailments and are often
used by patients alongside conventional medicines.206 The WHO estimates that in
Africa alone, 80% of the population relies on traditional medicines for their
healthcare needs, while in China, these remedies account for about 40% of all
healthcare delivered.207
As observed with some synthetic drugs, components of natural product remedies
may interact unfavourably with conventional medicines or other natural products if
co-administered. Additionally, like conventional medicines, some natural products

CHAPTER 1: INTRODUCTION AND LITERATURE REVIEW
NICHOLAS M. NJUGUNA - Ph.D. THESIS 2014
39
may undergo metabolic transformation to form reactive metabolites that trigger
toxic outcomes or IADRs.
Because traditional natural product medicines are not subjected to the same
rigorous studies and safety profiling assessments typically accorded to conventional
drugs, they may pose a potentially greater risk of causing adverse reactions.
Therefore, investigating the potential of natural products used as remedies for
treatment of disease to undergo undesirable metabolic bioactivation would allow
early discovery of toxic liabilities prior to the exploitation of these compounds as
possible leads in drug discovery programs.
1.10.2 Aims and Objectives
The main objective of this study was to determine the physico-chemical and
metabolic properties of natural products with respect to druggability, potential to
form reactive metabolites and inhibit major drug metabolising CYP450 enzymes.
A secondary objective was to identify the cross-inhibitory effects of chemical
inhibitors routinely employed in early CYP450 pehnotyping assays using human liver
microsomes.
1.10.3 Specific Aims
The specific aims of this research project are:
1. To create a software database containing data on pure African natural products
isolated from multiple sources.
2. Use commercially available in silico tools to mine the database created and map
the chemical space of the natural products in comparison with that of clinically
used conventional medicines.
3. Conduct in vitro studies on selected natural products to determine the formation
of reactive metabolites through enzyme inhibition and reactive metabolite
trapping assays.
4. Determine the cross-reactivity of chemical inhibitors commonly used in
performing early CYP450 phenotyping assays in the pharmaceutical industry.

CHAPTER 1: INTRODUCTION AND LITERATURE REVIEW
NICHOLAS M. NJUGUNA - Ph.D. THESIS 2014
40
REFERENCES:
(1) Brahmachari, G. Natural Products in Drug Discovery: Impacts and
Opportunities - An Assessment. In Bioactive Natural Products; Brahmachari,
G., Ed.; World Scientific Publishing Company: Singapore, 2011; pp. 1–199.
(2) Sarker, S. D.; Latif, Z.; Gray, A. I. Natural Product Isolation - An Overview. In
Natural Product Isolation; Sarker, S. D.; Latif, Z.; Gray, A. I., Eds.; Humana
Press: Totowa, New Jersey, 2006; Vol. 20, pp. 1–25.
(3) Croteau, R.; Kutchan, T. M.; Lewis, N. G. Natural Products (Secondary
Metabolites). In Biochemistry & Molecular Biology of Plants; Sons, J. W. &, Ed.;
Somerset, New Jersey, 2000; pp. 1250–1318.
(4) Dixon, R. A. Natural Products and Plant Disease Resistance. Nature 2001, 411,
843–847.
(5) Czárán, T. L.; Hoekstra, R. F.; Pagie, L. Chemical Warfare between Microbes
Promotes Biodiversity. Proceedings of the National Academy of Sciences of the
United States of America 2002, 99, 786–790.
(6) Newman, D. J.; Cragg, G. M.; Snader, K. M. The Influence of Natural Products
upon Drug Discovery. Natural Product Reports 2000, 17, 215–234.
(7) Ji, H.-F.; Li, X.-J.; Zhang, H.-Y. Natural Products and Drug Discovery. Can
Thousands of Years of Ancient Medical Knowledge Lead Us to New and
Powerful Drug Combinations in the Fight against Cancer and Dementia? EMBO
Reports 2009, 10, 194–200.
(8) Schmitz, R. Friedrich Wilhelm Sertürner and the Discovery of Morphine.
Pharmacy in History 1985, 27, 61–74.
(9) Hamilton, G. R.; Baskett, T. F. In the Arms of Morpheus: The Development of
Morphine for Postoperative Pain Relief. Canadian Journal of Anesthesia 2000,
47, 367–374.
(10) Meshnik, S. R.; Dobson, M. J. The History of Antimalarial Drugs. In Antimalarial
Chemotherapy Mechanisms of Action, Resistance, and New Directions in Drug

CHAPTER 1: INTRODUCTION AND LITERATURE REVIEW
NICHOLAS M. NJUGUNA - Ph.D. THESIS 2014
41
Discovery; Rosenthal, P. J., Ed.; Humana Press: Totowa, New Jersey, 2001; pp.
15–25.
(11) Grabley, S.; Thiericke, R. The Impact of Natural Products on Drug Discovery. In
Drug Discovery from Nature; Grabley, S.; Thiericke, R., Eds.; Springer-Verlag:
Berlin, Heilderberg, 1999; pp. 3–37.
(12) Demain, A. L.; Sanchez, S. Microbial Drug Discovery: 80 Years of Progress. The
Journal of Antibiotics 2009, 62, 5–16.
(13) Kaufman, P. B.; Cseke, L. J.; Warber, S.; Duke, J. A.; Brielmann, H. L. Natural
Products From Plants; Kane, H.; Mogck, M., Eds.; CRC Press LLC: Boca Raton,
Florida, 1999; pp. 3–35.
(14) Fabricant, D. S.; Farnsworth, N. R. The Value of Plants Used in Traditional
Medicine for Drug Discovery. Environmental Health Perspectives 2001, 109,
69–75.
(15) Balunas, M. J.; Kinghorn, A. D. Drug Discovery from Medicinal Plants. Life
Sciences 2005, 78, 431–441.
(16) Cragg, G. M.; Newman, D. J. Plants as a Source of Anti-Cancer Agents. Journal
of Ethnopharmacology 2005, 100, 72–79.
(17) Cragg, G. M.; Newman, D. J. Nature: A Vital Source of Leads for Anticancer
Drug Development. Phytochemistry Reviews 2009, 8, 313–331.
(18) Beutler, J. A.; Cragg, G. M.; Newman, D. J. Drug Discovery in Africa. In Drug
Discovery in Africa - Impacts of Genomics, Natural Products, Traditional
Medicines, Insights into medicinal chemistry and technology platforms in
pursuit of new drugs; Chibale, K.; Davies-Coleman, M.; Masimirembwa, C.,
Eds.; Springer Berlin Heidelberg: Berlin, Heidelberg, Heidelberg, 2012; pp. 29–
52.
(19) World Health Organization. Guidelines For The Treatment of Malaria - Second
Edition; World Health Organization: Geneva, 2010.
(20) Bennett, J. W.; Chung, K.-T. Alexander Fleming and the Discovery of Penicillin.
Advances in Applied Microbiology 2001, 49, 163–184.

CHAPTER 1: INTRODUCTION AND LITERATURE REVIEW
NICHOLAS M. NJUGUNA - Ph.D. THESIS 2014
42
(21) Butler, M. S. The Role of Natural Product Chemistry in Drug Discovery. Journal
of Natural Products 2004, 67, 2141–2153.
(22) Drews, J. Drug Discovery: A Historical Perspective. Science 2000, 287, 1960–
1964.
(23) Waksman, S. A. Streptomycin: Background, Isolation, Properties, and
Utilization. Science 1953, 118, 259–266.
(24) Jukes, T. H. Some Historical Notes on Chlortetracycline. Reviews of Infectious
Diseases 1985, 7, 702–707.
(25) Gottlieb, D.; Bhattacharya, P. K.; Anderson, H. W.; Carter, H. E. Some
Properties of an Antibiotic Obtained from a Species of Streptomyces. Journal
of Bacteriology 1948, 55, 409–417.
(26) Garrod, L. P. The Erythromycin Group of Antibiotics. British Medical Journal
1957, 2, 57–63.
(27) Levine, D. P. Vancomycin: A History. Clinical Infectious Diseases 2006, 42, S5–
12.
(28) Endo, A. The Origin of the Statins. International Congress Series 2004, 1262, 3–
8.
(29) Stossel, T. P. The Discovery of Statins. Cell 2008, 134, 903–905.
(30) Gewirtz, D. A. A Critical Evaluation of the Mechanisms of Action Proposed for
the Antitumor Effects of the Anthracycline Antibiotics Adriamycin and
Daunorubicin. Biochemical Pharmacology 1999, 57, 727–741.
(31) Saunders, R. N.; Metcalfe, M. S.; Nicholson, M. L. Rapamycin in
Transplantation: A Review of the Evidence. Kidney International 2001, 59, 3–
16.
(32) Alves, R. R. N.; Rosa, I. L. Why Study the Use of Animal Products in Traditional
Medicines? Journal of Ethnobiology and Ethnomedicine 2005, 1.
(33) Cushman, D. W.; Ondetti, M. A. History of the Design of Captopril and Related
Inhibitors of Angiotensin Converting Enzyme. Hypertension 1991, 17, 589–592.

CHAPTER 1: INTRODUCTION AND LITERATURE REVIEW
NICHOLAS M. NJUGUNA - Ph.D. THESIS 2014
43
(34) Brown, N. J.; Vaughan, D. E. Angiotensin-Converting Enzyme Inhibitors.
Circulation 1998, 97, 1411–1420.
(35) Scarborough, R. M. Development of Eptifibatide. American Heart Journal
1999, 138, 1093–1104.
(36) Chin, Y.-W.; Balunas, M. J.; Chai, H. B.; Kinghorn, A. D. Drug Discovery from
Natural Sources. The AAPS Journal 2006, 8, E239–53.
(37) Gullo, V. P.; McAlpine, J.; Lam, K. S.; Baker, D.; Petersen, F. Drug Discovery
from Natural Products. Journal of Industrial Microbiology & Biotechnology
2006, 33, 523–531.
(38) Molinski, T. F.; Dalisay, D. S.; Lievens, S. L.; Saludes, J. P. Drug Development
from Marine Natural Products. Nature Reviews: Drug Discovery 2009, 8, 69–
85.
(39) Faulkner, D. J. Highlights of Marine Natural Products Chemistry (1972 – 1999).
Natural Product Reports 2000, 17, 1–6.
(40) Faulkner, D. J. Marine Natural Products. Natural Product Reports 2001, 18, 1–
49.
(41) Blunt, J. W.; Copp, B. R.; Hu, W.-P.; Munro, M. H. G.; Northcote, P. T.; Prinsep,
M. R. Marine Natural Products. Natural Product Reports 2009, 26, 170–244.
(42) Blunt, J. W.; Copp, B. R.; Munro, M. H. G.; Northcote, P. T.; Prinsep, M. R.
Marine Natural Products. Natural Product Reports 2010, 27, 165–237.
(43) Blunt, J. W.; Copp, B. R.; Munro, M. H. G.; Northcote, P. T.; Prinsep, M. R.
Marine Natural Products. Natural Product Reports 2011, 28, 196–268.
(44) Blunt, J. W.; Copp, B. R.; Keyzers, R. A.; Munro, M. H. G.; Prinsep, M. R. Marine
Natural Products. Natural Product Reports 2012, 29, 144–222.
(45) Blunt, J. W.; Copp, B. R.; Keyzers, R. A.; Munro, M. H. G.; Prinsep, M. R. Marine
Natural Products. Natural Product Reports 2013, 30, 237–323.
(46) Penesyan, A.; Kjelleberg, S.; Egan, S. Development of Novel Drugs from Marine
Surface Associated Microorganisms. Marine Drugs 2010, 8, 438–459.

CHAPTER 1: INTRODUCTION AND LITERATURE REVIEW
NICHOLAS M. NJUGUNA - Ph.D. THESIS 2014
44
(47) Proksch, P.; Edrada, R. A.; Ebel, R. Drugs from the Seas - Current Status and
Microbiological Implications. Applied Microbiology and Biotechnology 2002,
59, 125–134.
(48) Glaser, K. B.; Mayer, A. M. S. A Renaissance in Marine Pharmacology: From
Preclinical Curiosity to Clinical Reality. Biochemical Pharmacology 2009, 78,
440–448.
(49) Schmidtko, A.; Lötsch, J.; Freynhagen, R.; Geisslinger, G. Ziconotide for
Treatment of Severe Chronic Pain. The Lancet 2010, 375, 1569–1577.
(50) Simmons, T. L.; Andrianasolo, E.; McPhail, K. L.; Flatt, P.; Gerwick, W. H.
Marine Natural Products as Anticancer Drugs. Molecular Cancer Therapeutics
2005, 4, 333–342.
(51) Towle, M. J.; Salvato, K. A.; Budrow, J.; Wels, B. F.; Kuznetsov, G.; Aalfs, K. K.;
Welsh, S.; Zheng, W.; Seletsky, B. M.; Palme, M. H.; Habgood, G. J.; Singer, L.
A.; DiPietro, L. V; Wang, Y.; Chen, J. J.; Quincy, D. A.; Davis, A.; Yoshimatsu, K.;
Kishi, Y.; Yu, M. J.; Littlefield, B. A. In Vitro and In Vivo Anticancer Activities of
Synthetic Macrocyclic Ketone Analogues of Halichondrin B. Cancer Research
2001, 61, 1013–1021.
(52) Newman, D. J.; Cragg, G. M. Marine-Sourced Anti-Cancer and Cancer Pain
Control Agents in Clinical and Late Preclinical Development. Marine Drugs
2014, 12, 255–278.
(53) Mayer, A. M. S.; Glaser, K. B.; Cuevas, C.; Jacobs, R. S.; Kem, W.; Little, R. D.;
McIntosh, J. M.; Newman, D. J.; Potts, B. C.; Shuster, D. E. The Odyssey of
Marine Pharmaceuticals: A Current Pipeline Perspective. Trends in
Pharmacological Sciences 2010, 31, 255–265.
(54) Ganesan, A. The Impact of Natural Products upon Modern Drug Discovery.
Current Opinion in Chemical Biology 2008, 12, 306–317.
(55) Escoubas, P.; King, G. F. Venomics as a Drug Discovery Platform. Expert Review
of Proteomics 2009, 6, 221–224.

CHAPTER 1: INTRODUCTION AND LITERATURE REVIEW
NICHOLAS M. NJUGUNA - Ph.D. THESIS 2014
45
(56) Wilson, Z. E.; Brimble, M. A. Molecules Derived from the Extremes of Life.
Natural Product Reports 2009, 26, 44–71.
(57) Cragg, G. M.; Grothaus, P. G.; Newman, D. J. Impact of Natural Products on
Developing New Anti-Cancer Agents. Chemical Reviews 2009, 109, 3012–3043.
(58) Kanapathipillai, M.; Lentzen, G.; Sierks, M.; Park, C. B. Ectoine and
Hydroxyectoine Inhibit Aggregation and Neurotoxicity of Alzheimer’s Beta-
Amyloid. FEBS Letters 2005, 579, 4775–4780.
(59) Lentzen, G.; Schwarz, T. Extremolytes: Natural Compounds from
Extremophiles for Versatile Applications. Applied Microbiology and
Biotechnology 2006, 72, 623–634.
(60) Skropeta, D. Deep-Sea Natural Products. Natural Product Reports 2008, 25,
1131–1166.
(61) Thornburg, C. C.; Zabriskie, T. M.; McPhail, K. L. Deep-Sea Hydrothermal
Vents: Potential Hot Spots for Natural Products Discovery? Journal of Natural
Products 2010, 73, 489–499.
(62) Li, J. W.-H.; Vederas, J. C. Drug Discovery and Natural Products: End of an Era
or an Endless Frontier? Science 2009, 325, 161–165.
(63) Cragg, G. M.; Newman, D. J.; Snader, K. M. Natural Products in Drug Discovery
and Development. Journal of Natural Products 1997, 60, 52–60.
(64) Newman, D. J.; Cragg, G. M.; Snader, K. M. Natural Products as Sources of New
Drugs over the Period 1981-2002. Journal of Natural Products 2003, 66, 1022–
1037.
(65) Newman, D. J.; Cragg, G. M. Natural Products as Sources of New Drugs over
the Last 25 Years. Journal of Natural Products 2007, 70, 461–477.
(66) Newman, D. J.; Cragg, G. M. Natural Products as Sources of New Drugs over
the 30 Years from 1981 to 2010. Journal of Natural Products 2012, 75, 311–
335.
(67) Jaroszewski, J. W. Hyphenated NMR Methods in Natural Products Research,
Part 1: Direct Hyphenation. Planta Medica 2005, 71, 691–700.
CHAPTER 1: INTRODUCTION AND LITERATURE REVIEW
NICHOLAS M. NJUGUNA - Ph.D. THESIS 2014
46
(68) Jaroszewski, J. W. Hyphenated NMR Methods in Natural Products Research,
Part 2: HPLC-SPE-NMR and Other New Trends in NMR Hyphenation. Planta
Medica 2005, 71, 795–802.
(69) Seger, C.; Godejohann, M.; Tseng, L.-H.; Spraul, M.; Girtler, A.; Sturm, S.;
Stuppner, H. LC-DAD-MS/SPE-NMR Hyphenation. A Tool for the Analysis of
Pharmaceutically Used Plant Extracts: Identification of Isobaric Iridoid
Glycoside Regioisomers from Harpagophytum Procumbens. Analytical
Chemistry 2005, 77, 878–885.
(70) Molinski, T. F. NMR of Natural Products at the “Nanomole-Scale”. Natural
Product Reports 2010, 27, 321–329.
(71) Lam, K. S. New Aspects of Natural Products in Drug Discovery. TRENDS in
Microbiology 2007, 15, 279–289.
(72) Feher, M.; Schmidt, J. M. Property Distributions: Differences between Drugs ,
Natural Products, and Molecules from Combinatorial Chemistry. Journal of
Chemical Information and Computer Sciences 2003, 43, 218–227.
(73) Nielsen, J. Combinatorial Synthesis of Natural Products. Current Opinion in
Chemical Biology 2002, 6, 297–305.
(74) Ortholand, J.-Y.; Ganesan, A. Natural Products and Combinatorial Chemistry:
Back to the Future. Current Opinion in Chemical Biology 2004, 8, 271–280.
(75) Ganesan, A. Natural Products as a Hunting Ground for Combinatorial
Chemistry. Current Opinion in Biotechnology 2004, 15, 584–590.
(76) Zhang, M.-Q.; Wilkinson, B. Drug Discovery beyond the “Rule-of-Five”. Current
Opinion in Biotechnology 2007, 18, 478–488.
(77) Ro, D.-K.; Paradise, E. M.; Ouellet, M.; Fisher, K. J.; Newman, K. L.; Ndungu, J.
M.; Ho, K. A.; Eachus, R. A.; Ham, T. S.; Kirby, J.; Chang, M. C. Y.; Withers, S. T.;
Shiba, Y.; Sarpong, R.; Keasling, J. D. Production of the Antimalarial Drug
Precursor Artemisinic Acid in Engineered Yeast. Nature 2006, 440, 940–943.

CHAPTER 1: INTRODUCTION AND LITERATURE REVIEW
NICHOLAS M. NJUGUNA - Ph.D. THESIS 2014
47
(78) Lefevre, F.; Robe, P.; Jarrin, C.; Ginolhac, A.; Zago, C.; Auriol, D.; Vogel, T. M.;
Simonet, P.; Nalin, R. Drugs from Hidden Bugs: Their Discovery via Untapped
Resources. Research in Microbiology 2008, 159, 153–161.
(79) Harvey, A. Strategies for Discovering Drugs from Previously Unexplored
Natural Products. Drug Discovery Today 2000, 5, 294–300.
(80) Penner, N.; Woodward, C.; Prakash, C. Drug Metabolizing Enzymes and
Biotransformation Reactions. In ADME-Enabling Technologies in Drug Design
and Development; Zhang, D.; Surapaneni, S., Eds.; John Wiley & Sons, Inc.:
Hoboken, NJ, USA, 2012; pp. 545–565.
(81) Nebert, D. W.; Russell, D. W. Clinical Importance of the Cytochromes P450.
The Lancet 2002, 360, 1155–1162.
(82) Sligar, S. G. Nature’s Universal Oxygenases: The Cytochromes P450. Essays in
Biochemistry 1999, 34, 71–83.
(83) Hasler, J. A.; Estabrook, R.; Murray, M.; Pikuleva, I.; Waterman, M.; Capdevila,
J.; Holla, V.; Helvig, C.; Falck, J. R.; Farrell, G.; Kaminsky, L. S.; Spivack, S. D.;
Boitier, E.; Beaune, P. Human Cytochromes P450. Molecular Aspects of
Medicine 1999, 20, 1–137.
(84) Seliskar, M.; Rozman, D. Mammalian Cytochromes P450 - Importance of
Tissue Specificity. Biochimica et Biophysica Acta 2007, 1770, 458–466.
(85) Guengerich, F. P. Cytochrome P450 Enzymes. American Scientist 1993, 81,
440–447.
(86) Ding, X.; Kaminsky, L. S. Human Extrahepatic Cytochromes P450: Function in
Xenobiotic Metabolism and Tissue-Selective Chemical Toxicity in the
Respiratory and Gastrointestinal Tracts. Annual Review of Pharmacology and
Toxicology 2003, 43, 149–173.
(87) Lacroix, D.; Sonnier, M.; Moncion, A.; Cheron, G.; Cresteil, T. Expression of
CYP3A in the Human Liver-Evidence That the Shift between CYP3A7 and
CYP3A4 Occurs Immediately after Birth. European Journal of Biochemistry
1997, 247, 625–634.

CHAPTER 1: INTRODUCTION AND LITERATURE REVIEW
NICHOLAS M. NJUGUNA - Ph.D. THESIS 2014
48
(88) Preissner, S. C.; Hoffmann, M. F.; Preissner, R.; Dunkel, M.; Gewiess, A.;
Preissner, S. Polymorphic Cytochrome P450 Enzymes (CYPs) and Their Role in
Personalized Therapy. PLoS ONE 2013, 8, e82562.
(89) Lamb, D. C.; Waterman, M. R.; Kelly, S. L.; Guengerich, F. P. Cytochromes P450
and Drug Discovery. Current Opinion in Biotechnology 2007, 18, 504–512.
(90) Guengerich, F. P. Cytochromes P450, Drugs and Diseases. Molecular
Interventions 2003, 3, 194–204.
(91) Isin, E. M.; Guengerich, F. P. Complex Reactions Catalyzed by Cytochrome
P450 Enzymes. Biochimica et Biophysica Acta 2007, 1770, 314–329.
(92) Guengerich, F. P. Common and Uncommon Cytochrome P450 Reactions
Related to Metabolism and Chemical Toxicity. Chemical Research in Toxicology
2001, 14, 611–650.
(93) Ingelman-Sundberg, M.; Oscarson, M.; McLellan, R. A. Polymorphic Human
Cytochrome P450 Enzymes: An Opportunity for Individualized Drug
Treatment. Trends in Pharmacological Sciences 1999, 20, 342–349.
(94) Ingelman-Sundberg, M. Pharmacogenetics of Cytochrome P450 and Its
Applications in Drug Therapy: The Past, Present and Future. Trends in
Pharmacological Sciences 2004, 25, 193–200.
(95) Cashman, J. R. Some Distinctions between Flavin-Containing and Cytochrome
P450 Monooxygenases. Biochemical and Biophysical Research
Communications 2005, 338, 599–604.
(96) Cashman, J. R.; Zhang, J. Human Flavin-Containing Monooxygenases. Annual
Review of Pharmacology and Toxicology 2006, 46, 65–100.
(97) Cashman, J. R. Structural and Catalytic Properties of the Mammalian Flavin-
Containing Monooxygenase. Chemical Research in Toxicology 1995, 8, 165–
181.
(98) Kitamura, S.; Sugihara, K.; Ohta, S. Drug-Metabolizing Ability of Molybdenum
Hydroxylases. Drug Metabolism and Pharmacokinetics 2006, 21, 83–98.

CHAPTER 1: INTRODUCTION AND LITERATURE REVIEW
NICHOLAS M. NJUGUNA - Ph.D. THESIS 2014
49
(99) Strolin Benedetti, M.; Tipton, K. F.; Whomsley, R. Amine Oxidases and
Monooxygenases in the in Vivo Metabolism of Xenobiotic Amines in Humans:
Has the Involvement of Amine Oxidases Been Neglected? Fundamental &
Clinical Pharmacology 2007, 21, 467–480.
(100) Youdim, M. B. H.; Edmondson, D.; Tipton, K. F. The Therapeutic Potential of
Monoamine Oxidase Inhibitors. Nature Reviews: Neuroscience 2006, 7, 295–
309.
(101) Culpepper, L. The Use of Monoamine Oxidase Inhibitors in Primary Care. The
Journal of Clinical Psychiatry 2012, 73, 37–41.
(102) Jenner, P. Mitochondria, Monoamine Oxidase B and Parkinson’s Disease.
Basal Ganglia 2012, 2, S3–S7.
(103) Vasiliou, V.; Pappa, A.; Petersen, D. R. Role of Aldehyde Dehydrogenases in
Endogenous and Xenobiotic Metabolism. Chemico-Biological Interactions
2000, 129, 1–19.
(104) Fukami, T.; Yokoi, T. The Emerging Role of Human Esterases. Drug Metabolism
and Pharmacokinetics 2012, 27, 466–477.
(105) Jin, Y.; Penning, T. M. Aldo-Keto Reductases and Bioactivation/detoxication.
Annual Review of Pharmacology and Toxicology 2007, 47, 263–292.
(106) Oppermann, U. Carbonyl Reductases: The Complex Relationships of
Mammalian Carbonyl- and Quinone-Reducing Enzymes and Their Role in
Physiology. Annual Review of Pharmacology and Toxicology 2007, 47, 293–
322.
(107) Barski, O. A.; Tipparaju, S. M.; Bhatnagar, A. The Aldo-Keto Reductase
Superfamily and Its Role in Drug Metabolism and Detoxification. Drug
Metabolism Reviews 2008, 40, 553–624.
(108) Jancova, P.; Šiller, M. Phase II Drug Metabolism. In Topics on Drug
Metabolism; Paxton, J., Ed.; InTech: Rijeka, 2012; pp. 35–60.

CHAPTER 1: INTRODUCTION AND LITERATURE REVIEW
NICHOLAS M. NJUGUNA - Ph.D. THESIS 2014
50
(109) De Wildt, S. N.; Kearns, G. L.; Leeder, J. S.; van den Anker, J. N.
Glucuronidation in Humans. Pharmacogenetic and Developmental Aspects.
Clinical Pharmacokinetics 1999, 36, 439–452.
(110) Tukey, R. H.; Strassburg, C. P. Human UDP-Glucuronosyltransferases:
Metabolism, Expression, and Disease. Annual Review of Pharmacology and
Toxicology 2000, 40, 581–616.
(111) Bailey, M. J.; Dickinson, R. G. Acyl Glucuronide Reactivity in Perspective:
Biological Consequences. Chemico-Biological Interactions 2003, 145, 117–137.
(112) Coughtrie, M. W. H. Sulfation through the Looking Glass-Recent Advances in
Sulfotransferase Research for the Curious. The Pharmacogenomics Journal
2002, 2, 297–308.
(113) Gamage, N.; Barnett, A.; Hempel, N.; Duggleby, R. G.; Windmill, K. F.; Martin,
J. L.; McManus, M. E. Human Sulfotransferases and Their Role in Chemical
Metabolism. Toxicological Sciences 2006, 90, 5–22.
(114) Glatt, H. Sulfotransferases in the Bioactivation of Xenobiotics. Chemico-
Biological Interactions 2000, 129, 141–170.
(115) Hearse, D. J.; Weber, W. W. Multiple N-Acetyltransferases and Drug
Metabolism. Biochemistry Journal 1973, 132, 519–526.
(116) Sim, E.; Pinter, K.; Mushtaq, A.; Upton, A.; Sandy, J.; Bhakta, S.; Noble, M.
Arylamine N-Acetyltransferases: A Pharmacogenomic Approach to Drug
Metabolism and Endogenous Function. Biochemical Society Transactions
2003, 31, 615–619.
(117) Forman, H. J.; Zhang, H.; Rinna, A. Glutathione: Overview of Its Protective
Roles, Measurement, and Biosynthesis. Molecular Aspects of Medicine 2009,
30, 1–12.
(118) Hayes, J. D.; Flanagan, J. U.; Jowsey, I. R. Glutathione Transferases. Annual
Review of Pharmacology and Toxicology 2005, 45, 51–88.

CHAPTER 1: INTRODUCTION AND LITERATURE REVIEW
NICHOLAS M. NJUGUNA - Ph.D. THESIS 2014
51
(119) Männistö, P. T.; Kaakkola, S. Catechol-O-Methyltransferase (COMT):
Biochemistry, Molecular Biology, Pharmacology, and Clinical Efficacy of the
New Selective COMT Inhibitors. Pharmacological Reviews 1999, 51, 593–628.
(120) Fontecave, M.; Atta, M.; Mulliez, E. S-Adenosylmethionine: Nothing Goes to
Waste. TRENDS in Biochemical Sciences 2004, 29, 243–249.
(121) Creveling, C. R. Methyltransferases. In Enzyme Systems that Metabolise Drugs
and Other Xenobiotics; Ioannides, C., Ed.; John Wiley & Sons, Ltd: Chichester,
UK, 2001; Vol. 4, pp. 484–499.
(122) Bodor, N.; Buchwald, P. Soft Drug Design: General Principles and Recent
Applications. Medicinal Research Reviews 2000, 20, 58–101.
(123) Fura, A.; Shu, Y.-Z.; Zhu, M.; Hanson, R. L.; Roongta, V.; Humphreys, W. G.
Discovering Drugs through Biological Transformation: Role of
Pharmacologically Active Metabolites in Drug Discovery. Journal of Medicinal
Chemistry 2004, 47, 4339–4351.
(124) Rautio, J.; Kumpulainen, H.; Heimbach, T.; Oliyai, R.; Oh, D.; Järvinen, T.;
Savolainen, J. Prodrugs: Design and Clinical Applications. Nature Reviews: Drug
Discovery 2008, 7, 255–270.
(125) Huttunen, K. M.; Raunio, H.; Rautio, J. Prodrugs - from Serendipity to Rational
Design. Pharmacological Reviews 2011, 63, 750–771.
(126) Osborne, R.; Thompson, P.; Joel, S.; Trew, D.; Patel, N.; Slevin, M. The
Analgesic Activity of Morphine-6-Glucuronide. British Journal of Clinical
Pharmacology 1992, 34, 130–138.
(127) Lewis, S. S.; Hutchinson, M. R.; Rezvani, N.; Loram, L. C.; Zhang, Y.; Maier, S. F.;
Rice, K. C.; Watkins, L. R. Evidence That Intrathecal Morphine-3-Glucuronide
May Cause Pain Enhancement via Toll-like Receptor 4/MD-2 and Interleukin-
1beta. Neuroscience 2010, 165, 569–583.
(128) Miller, E. C.; Miller, J. A. The Presence and Significance of Bound Aminoazo
Dyes in the Livers of Rats Fed P-Dimethylaminoazobenzene. Cancer Research
1947, 7, 468–480.
CHAPTER 1: INTRODUCTION AND LITERATURE REVIEW
NICHOLAS M. NJUGUNA - Ph.D. THESIS 2014
52
(129) Li, F.; Lu, J.; Ma, X. Profiling the Reactive Metabolites of Xenobiotics Using
Metabolomic Technologies. Chemical Research in Toxicology 2011, 24, 744–
751.
(130) Guengerich, F. P. Cytochrome P450s and Other Enzymes in Drug Metabolism
and Toxicity. The AAPS Journal 2006, 8, E101–11.
(131) Ju, C.; Uetrecht, J. Mechanism of Idiosyncratic Drug Reactions: Reactive
Metabolites Formation, Protein Binding and the Regulation of the Immune
System. Current Drug Metabolism 2002, 3, 367–377.
(132) Nelson, S. D. Molecular Mechanisms of Adverse Drug Reactions. Current
Therapeutic Research 2001, 62, 885–899.
(133) Guengerich, F. P. Principles of Covalent Binding of Reactive Metabolites and
Examples of Activation of Bis-Electrophiles by Conjugation. Archives of
Biochemistry and Biophysics 2005, 433, 369–378.
(134) Attia, S. M. Deleterious Effects of Reactive Metabolites. Oxidative Medicine
and Cellular Longevity 2010, 3, 238–253.
(135) Uetrecht, J. Idiosyncratic Drug Reactions: Current Understanding. Annual
Review of Pharmacology and Toxicology 2007, 47, 513–539.
(136) Park, B. K.; Naisbitt, D. J.; Gordon, S. F.; Kitteringham, N. R.; Pirmohamed, M.
Metabolic Activation in Drug Allergies. Toxicology 2001, 158, 11–23.
(137) Shenton, J. M.; Chen, J.; Uetrecht, J. P. Animal Models of Idiosyncratic Drug
Reactions. Chemico-Biological Interactions 2004, 150, 53–70.
(138) Dahlin, D. C.; Miwa, G. T.; Lu, A. Y.; Nelson, S. D. N-Acetyl-P-Benzoquinone
Imine: A Cytochrome P-450-Mediated Oxidation Product of Acetaminophen.
Proceedings of the National Academy of Sciences of the United States of
America 1984, 81, 1327–1331.
(139) Williams, D. P. Toxicophores: Investigations in Drug Safety. Toxicology 2006,
226, 1–11.
(140) James, L. P.; Mayeux, P. R.; Hinson, J. A. Acetaminophen-Induced
Hepatotoxicity. Drug Metabolism and Disposition 2003, 31, 1499–1506.

CHAPTER 1: INTRODUCTION AND LITERATURE REVIEW
NICHOLAS M. NJUGUNA - Ph.D. THESIS 2014
53
(141) Pirmohamed, M.; Park, B. K. Mechanism of Clozapine-Induced
Agranulocytosis: Current Status of Research and Implications for Drug
Development. CNS Drugs 1997, 7, 139–158.
(142) Uetrecht, J.; Zahid, N.; Tehim, A.; Fu, J. M.; Rakhit, S. Structural Features
Associated with Reactive Metabolite Formation in Clozapine Analogues.
Chemico-Biological Interactions 1997, 104, 117–129.
(143) Stepan, A. F.; Walker, D. P.; Bauman, J. N.; Price, D. A.; Baillie, T. A.; Kalgutkar,
A. S.; Aleo, M. D. Structural Alert/reactive Metabolite Concept as Applied in
Medicinal Chemistry to Mitigate the Risk of Idiosyncratic Drug Toxicity: A
Perspective Based on the Critical Examination of Trends in the Top 200 Drugs
Marketed in the United States. Chemical Research in Toxicology 2011, 24,
1345–1410.
(144) Peraica, M.; Radić, B.; Lucić, A.; Pavlović, M. Toxic Effects of Mycotoxins in
Humans. Bulletin of the World Health Organization 1999, 77, 754–766.
(145) Guengerich, F. P. Cytochrome P450 and Chemical Toxicology. Chemical
Research in Toxicology 2008, 21, 70–83.
(146) Vanherweghem, J.-L. Misuse of Herbal Remedies: The Case of an Outbreak of
Terminal Renal Failure in Belgium (Chinese Herbs Nephropathy). The Journal
of Alternative and Complementary Medicine 1998, 4, 9–13.
(147) Zhou, S.; Koh, H.-L.; Gao, Y.; Gong, Z.-Y.; Lee, E. J. D. Herbal Bioactivation: The
Good, the Bad and the Ugly. Life Sciences 2004, 74, 935–968.
(148) Dietz, B. M.; Bolton, J. L. Biological Reactive Intermediates (BRIs) Formed from
Botanical Dietary Supplements. Chemico-Biological Interactions 2011, 192,
72–80.
(149) Chen, X.-W.; Serag, E. S.; Sneed, K. B.; Zhou, S.-F. Herbal Bioactivation,
Molecular Targets and the Toxicity Relevance. Chemico-Biological Interactions
2011, 192, 161–176.

CHAPTER 1: INTRODUCTION AND LITERATURE REVIEW
NICHOLAS M. NJUGUNA - Ph.D. THESIS 2014
54
(150) Stiborová, M.; Frei, E.; Arlt, V. M.; Schmeiser, H. H. Metabolic Activation of
Carcinogenic Aristolochic Acid, a Risk Factor for Balkan Endemic Nephropathy.
Mutation Research 2008, 658, 55–67.
(151) Meinl, W.; Pabel, U.; Osterloh-Quiroz, M.; Hengstler, J. G.; Glatt, H. Human
Sulphotransferases Are Involved in the Activation of Aristolochic Acids and Are
Expressed in Renal Target Tissue. International Journal of Cancer 2006, 118,
1090–1097.
(152) Stiborová, M.; Frei, E.; Hodek, P.; Wiessler, M.; Schmeiser, H. H. Human
Hepatic and Renal Microsomes, Cytochromes P450 1A1/2,
NADPH:cytochrome P450 Reductase and Prostaglandin H Synthase Mediate
the Formation of Aristolochic Acid-DNA Adducts Found in Patients with
Urothelial Cancer. International Journal of Cancer 2005, 113, 189–197.
(153) Singh, Y. N.; Singh, N. N. Therapeutic Potential of Kava in the Treatment of
Anxiety Disorders. CNS Drugs 2002, 16, 731–743.
(154) Dietz, B.; Bolton, J. L. Botanical Dietary Supplements Gone Bad. Chemical
Research in Toxicology 2007, 20, 586–590.
(155) Bailey, D. G.; Malcolm, J.; Arnold, O.; Spence, J. D. Grapefruit Juice-Drug
Interactions. British Journal of Clinical Pharmacology 1998, 46, 101–110.
(156) Bailey, D. G.; Dresser, G.; Arnold, J. M. O. Grapefruit-Medication Interactions:
Forbidden Fruit or Avoidable Consequences? Canadian Medical Association
Journal 2013, 185, 309–316.
(157) He, K.; Iyer, K. R.; Hayes, R. N.; Sinz, M. W.; Woolf, T. F.; Hollenberg, P. F.
Inactivation of Cytochrome P450 3A4 by Bergamottin, a Component of
Grapefruit Juice. Chemical Research in Toxicology 1998, 11, 252–259.
(158) Kent, U. M.; Lin, H.; Noon, K. R.; Harris, D. L.; Hollenberg, P. F. Metabolism of
Bergamottin by Cytochromes P450 2B6 and 3A5. The Journal of Pharmacology
and Experimental Therapeutics 2006, 318, 992–1005.
(159) Kola, I.; Landis, J. Can the Pharmaceutical Industry Reduce Attrition Rates?
Nature Reviews: Drug Discovery 2004, 3, 711–715.

CHAPTER 1: INTRODUCTION AND LITERATURE REVIEW
NICHOLAS M. NJUGUNA - Ph.D. THESIS 2014
55
(160) Kola, I. The State of Innovation in Drug Development. Clinical Pharmacology
and Therapeutics 2008, 83, 227–230.
(161) Summerfield, S.; Jeffrey, P. Discovery DMPK: Changing Paradigms in the
Eighties, Nineties and Noughties. Expert Opinion on Drug Discovery 2009, 4,
207–218.
(162) Eddershaw, P. J.; Beresford, A. P.; Bayliss, M. K. ADME/PK as Part of a Rational
Approach to Drug Discovery. Drug Discovery Today 2000, 5, 409–414.
(163) Lin, J.; Sahakian, D. C.; de Morais, S. M. F.; Xu, J. J.; Polzer, R. J.; Winter, S. M.
The Role of Absorption, Distribution, Metabolism, Excretion and Toxicity in
Drug Discovery. Current Topics in Medicinal Chemistry 2003, 3, 1125–1154.
(164) Schuster, D.; Laggner, C.; Langer, T. Why Drugs Fail - A Study on Side Effects in
New Chemical Entities. Current Pharmaceutical Design 2005, 11, 3545–3559.
(165) Jorgensen, W. L. The Many Roles of Computation in Drug Discovery. Science
2004, 303, 1813–1818.
(166) Van de Waterbeemd, H.; Gifford, E. ADMET in Silico Modelling: Towards
Prediction Paradise? Nature Reviews: Drug Discovery 2003, 2, 192–204.
(167) Lipinski, C. A.; Lombardo, F.; Dominy, B. W.; Feeney, P. J. Experimental and
Computational Approaches to Estimate Solubility and Permeability in Drug
Discovery and Development Settings. Advanced Drug Delivery Reviews 2001,
46, 3–26.
(168) Ekins, S. In Silico Approaches to Predicting Drug Metabolism, Toxicology and
Beyond. Biochemical Society Transactions 2003, 31, 611–614.
(169) Yu, H.; Adedoyin, A. ADME–Tox in Drug Discovery: Integration of Experimental
and Computational Technologies. Drug Discovery Today 2003, 8, 852–861.
(170) Norinder, U.; Bergström, C. A. S. Prediction of ADMET Properties.
ChemMedChem 2006, 1, 920–937.
(171) Stouch, T. R.; Kenyon, J. R.; Johnson, S. R.; Chen, X.-Q.; Doweyko, A.; Li, Y. In
Silico ADME/Tox: Why Models Fail. Journal of Computer-aided Molecular
Design 2003, 17, 83–92.

CHAPTER 1: INTRODUCTION AND LITERATURE REVIEW
NICHOLAS M. NJUGUNA - Ph.D. THESIS 2014
56
(172) Roncaglioni, A.; Toropov, A. A.; Toropova, A. P.; Benfenati, E. In Silico Methods
to Predict Drug Toxicity. Current Opinion in Pharmacology 2013, 13, 802–806.
(173) Bugrim, A.; Nikolskaya, T.; Nikolsky, Y. Early Prediction of Drug Metabolism
and Toxicity: Systems Biology Approach and Modeling. Drug Discovery Today
2004, 9, 127–135.
(174) Crivori, P.; Poggesi, I. Computational Approaches for Predicting CYP-Related
Metabolism Properties in the Screening of New Drugs. European Journal of
Medicinal Chemistry 2006, 41, 795–808.
(175) Cruciani, G.; Carosati, E.; De Boeck, B.; Ethirajulu, K.; Mackie, C.; Howe, T.;
Vianello, R. MetaSite: Understanding Metabolism in Human Cytochromes
from the Perspective of the Chemist. Journal of Medicinal Chemistry 2005, 48,
6970–6979.
(176) Rydberg, P.; Gloriam, D. E.; Zaretzki, J.; Breneman, C.; Olsen, L. SMARTCyp: A
2D Method for Prediction of Cytochrome P450-Mediated Drug Metabolism.
ACS Medicinal Chemistry Letters 2010, 1, 96–100.
(177) Kirchmair, J.; Williamson, M. J.; Tyzack, J. D.; Tan, L.; Bond, P. J.; Bender, A.;
Glen, R. C. Computational Prediction of Metabolism: Sites, Products, SAR,
P450 Enzyme Dynamics, and Mechanisms. Journal of Chemical Information
and Modeling 2012, 52, 617–648.
(178) Clark, D. E. In Silico Prediction of Blood-Brain Barrier Permeation. Drug
Discovery Today 2003, 8, 927–933.
(179) Hou, T.; Wang, J.; Zhang, W.; Wang, W.; Xu, X. Recent Advances in
Computational Prediction of Drug Absorption and Permeability in Drug
Discovery. Current Medicinal Chemistry 2006, 13, 2653–2667.
(180) Masimirembwa, C. M.; Bredberg, U.; Andersson, T. B. Metabolic Stability for
Drug Discovery and Development: Pharmacokinetic and Biochemical
Challenges. Clinical Pharmacokinetics 2003, 42, 515–528.
(181) Baranczewski, P.; Stańczak, A.; Sundberg, K.; Svensson, R.; Wallin, A.; Jansson,
J.; Garberg, P.; Postlind, H. Introduction to in Vitro Estimation of Metabolic

CHAPTER 1: INTRODUCTION AND LITERATURE REVIEW
NICHOLAS M. NJUGUNA - Ph.D. THESIS 2014
57
Stability and Drug Interactions of New Chemical Entities in Drug Discovery and
Development. Pharmacological Reports 2006, 58, 453–472.
(182) Li, A. P. Screening for Human ADME/Tox Drug Properties in Drug Discovery.
Drug Discovery Today 2001, 6, 357–366.
(183) Nassar, A.-E. F.; Kamel, A. M.; Clarimont, C. Improving the Decision-Making
Process in Structural Modification of Drug Candidates: Reducing Toxicity. Drug
Discovery Today 2004, 9, 1055–1064.
(184) Yan, Z.; Caldwell, G. W. In Vitro Identification of Cytochrome P450 Enzymes
Responsible for Drug Metabolism. In Pharmacogenomics: Methods and
Protocols; Innocenti, F.; Schaik, R. H. N., Eds.; Methods in Molecular Biology;
Humana Press: Totowa, NJ, 2013; Vol. 1015, pp. 251–261.
(185) Harper, T. W.; Brassil, P. J. Reaction Phenotyping: Current Industry Efforts to
Identify Enzymes Responsible for Metabolizing Drug Candidates. The AAPS
Journal 2008, 10, 200–207.
(186) Zhang, H.; Davis, C. D.; Sinz, M. W.; Rodrigues, A. D. Cytochrome P450
Reaction-Phenotyping: An Industrial Perspective. Expert Opinion on Drug
Metabolism & Toxicology 2007, 3, 667–687.
(187) Park, B. K.; Boobis, A.; Clarke, S.; Goldring, C. E. P.; Jones, D.; Kenna, J. G.;
Lambert, C.; Laverty, H. G.; Naisbitt, D. J.; Nelson, S.; Nicoll-Griffith, D. A.;
Obach, R. S.; Routledge, P.; Smith, D. A.; Tweedie, D. J.; Vermeulen, N.;
Williams, D. P.; Wilson, I. D.; Baillie, T. A. Managing the Challenge of
Chemically Reactive Metabolites in Drug Development. Nature Reviews: Drug
Discovery 2011, 10, 292–306.
(188) Kalgutkar, A. S.; Gardner, I.; Obach, R. S.; Shaffer, C. L.; Callegari, E.; Henne, K.
R.; Mutlib, A. E.; Dalvie, D. K.; Lee, J. S.; Nakai, Y.; O’Donnell, J. P.; Boer, J.;
Harriman, S. P. A Comprehensive Listing of Bioactivation Pathways of Organic
Functional Groups. Current Drug Metabolism 2005, 6, 161–225.

CHAPTER 1: INTRODUCTION AND LITERATURE REVIEW
NICHOLAS M. NJUGUNA - Ph.D. THESIS 2014
58
(189) Fontana, E.; Dansette, P. M.; Poli, S. M. Cytochrome P450 Enzymes
Mechanism Based Inhibitors: Common Sub-Structures and Reactivity. Current
Drug Metabolism 2005, 6, 413–454.
(190) Valerio, L. G. In Silico Toxicology for the Pharmaceutical Sciences. Toxicology
and Applied Pharmacology 2009, 241, 356–370.
(191) Zlokarnik, G.; Grootenhuis, P. D. J.; Watson, J. B. High Throughput P450
Inhibition Screens in Early Drug Discovery. Drug Discovery Today 2005, 10,
1443–1450.
(192) Riley, R. J.; Grime, K. Metabolic Screening in Vitro: Metabolic Stability, CYP
Inhibition and Induction. Drug Discovery Today: Technologies 2004, 1, 365–
372.
(193) Polasek, T. M.; Miners, J. O. In Vitro Approaches to Investigate Mechanism-
Based Inactivation of CYP Enzymes. Expert Opinion on Drug Metabolism &
Toxicology 2007, 3, 321–329.
(194) Grime, K. H.; Bird, J.; Ferguson, D.; Riley, R. J. Mechanism-Based Inhibition of
Cytochrome P450 Enzymes: An Evaluation of Early Decision Making in Vitro
Approaches and Drug-Drug Interaction Prediction Methods. European Journal
of Pharmaceutical Sciences 2009, 36, 175–191.
(195) Lohmann, W.; Karst, U. Generation and Identification of Reactive Metabolites
by Electrochemistry and Immobilized Enzymes Coupled on-Line to Liquid
Chromatography/mass Spectrometry. Analytical Chemistry 2007, 79, 6831–
6839.
(196) Madsen, K. G.; Olsen, J.; Skonberg, C.; Hansen, S. H.; Jurva, U. Development
and Evaluation of an Electrochemical Method for Studying Reactive Phase-I
Metabolites: Correlation to in Vitro Drug Metabolism. Chemical Research in
Toxicology 2007, 20, 821–831.
(197) Ma, S.; Subramanian, R. Detecting and Characterizing Reactive Metabolites by
Liquid Chromatography/tandem Mass Spectrometry. Journal of Mass
Spectrometry 2006, 41, 1121–1139.

CHAPTER 1: INTRODUCTION AND LITERATURE REVIEW
NICHOLAS M. NJUGUNA - Ph.D. THESIS 2014
59
(198) Yan, Z.; Caldwell, G. W. Stable-Isotope Trapping and High-Throughput
Screenings of Reactive Metabolites Using the Isotope MS Signature. Analytical
Chemistry 2004, 76, 6835–6847.
(199) Mutlib, A.; Lam, W.; Atherton, J.; Chen, H.; Galatsis, P.; Stolle, W. Application
of Stable Isotope Labeled Glutathione and Rapid Scanning Mass
Spectrometers in Detecting and Characterizing Reactive Metabolites. Rapid
Communications in Mass Spectrometry 2005, 19, 3482–3492.
(200) Gan, J.; Harper, T. W.; Hsueh, M.-M.; Qu, Q.; Humphreys, W. G. Dansyl
Glutathione as a Trapping Agent for the Quantitative Estimation and
Identification of Reactive Metabolites. Chemical Research in Toxicology 2005,
18, 896–903.
(201) Chen, Y.; Monshouwer, M.; Fitch, W. L. Analytical Tools and Approaches for
Metabolite Identification in Early Drug Discovery. Pharmaceutical Research
2007, 24, 248–257.
(202) Ma, S.; Zhu, M. Recent Advances in Applications of Liquid Chromatography-
Tandem Mass Spectrometry to the Analysis of Reactive Drug Metabolites.
Chemico-Biological Interactions 2009, 179, 25–37.
(203) Evans, D. C.; Watt, A. P.; Nicoll-Griffith, D. A.; Baillie, T. A. Drug-Protein
Adducts: An Industry Perspective on Minimizing the Potential for Drug
Bioactivation in Drug Discovery and Development. Chemical Research in
Toxicology 2004, 17, 3–16.
(204) Masubuchi, N.; Makino, C.; Murayama, N. Prediction of in Vivo Potential for
Metabolic Activation of Drugs into Chemically Reactive Intermediate:
Correlation of in Vitro and in Vivo Generation of Reactive Intermediates and in
Vitro Glutathione Conjugate Formation in Rats and Humans. Chemical
Research in Toxicology 2007, 20, 455–464.
(205) Leeson, P. D.; Davis, A. M. Time-Related Differences in the Physical Property
Profiles of Oral Drugs. Journal of Medicinal Chemistry 2004, 47, 6338–6348.

CHAPTER 1: INTRODUCTION AND LITERATURE REVIEW
NICHOLAS M. NJUGUNA - Ph.D. THESIS 2014
60
(206) World Health Organization. Legal Status of Traditional Medicine and
Complementary/Alternative Medicine: A Worldwide Review; Geneva, 2001.
(207) World Health Organization. WHO Traditional Medicine Strategy 2002-2005;
Geneva, 2002.

CHAPTER 2: IN SILICO PROFILING OF NATURAL PRODUCTS
NICHOLAS M. NJUGUNA - Ph.D. THESIS 2014
61
CHAPTER TWO:
IN SILICO PROFILING OF NATURAL PRODUCT CHEMICAL SPACE
2.1 Summary
In this Chapter, the use of computational tools to design, create and populate a
database of natural products is described. The chemical space occupied by the
natural products with specific regard to their predicted physico-chemical properties
for ‘drug-likeness’ is determined using software. Statistical analysis of the chemical
space data of the natural products compared to that of conventional drugs is
performed to determine the significance of any similarities or differences in the
properties of both data sets. An analysis of structural alerts present in the natural
products compared to those present in conventional drugs is carried out to predict
the relative predilection of these compounds to undergo metabolic bioactivation.
2.2 General Introduction
Computational tools are now considered virtually indispensible integral components
of the drug discovery process. They are used for virtual screening of large compound
libraries to identify potential drug hits either through structure-based or ligand-
based screens typically at the very onset of drug discovery programs.1–3 Their use has
become more common-place following the realization that traditional high-
throughput screening (HTS) assays on combinatorial chemistry compound libraries
often yielded large proportions of false positive ‘non-drug-like’ hits that could be
easily identified and excluded computationally by applying property filters.4
Computational tools are used to predict the ‘drug-likeness’ of compounds in
chemical libraries based on calculation of both simple 1D, 2D and more complex 3D
property descriptors.
Virtual compound libraries in the form of in silico databases containing large volumes
of information on thousands and sometimes millions of both real and hypothesized
combinatorial compounds are now freely or commercially available for high-
throughput drug discovery screening. At present, many of these depositories can be
accessed through the world-wide-web as online databases in which data is
continuously updated and new compounds uploaded. An example of such online

CHAPTER 2: IN SILICO PROFILING OF NATURAL PRODUCTS
NICHOLAS M. NJUGUNA - Ph.D. THESIS 2014
62
databases is ZINC,5–7 which at present contains freely accessible records of more
than 35 million compounds. Although ZINC is mainly populated with synthetic
compounds, it also contains a sizeable collection of natural products and provides
links to other online databases which specifically contain only natural product
collections. For example, a library of more than 1000 natural products from African
Medicinal Plants christened AfroDb is entirely housed within the ZINC database.8 In
general, however, discovery of bioactive natural products using computational tools
has been hampered by a relative dearth in the availability of good quality publicly
accessible natural product databases.9
2.3 Natural Product Database
2.3.1 Database Design
A compound database containing data on natural products was designed and
created using commercially available off-the-shelf software (Microsoft® Office
Access 2003 Service Pack 3, Microsoft Corporation, WA, USA). The database was
created on a HP Pavilion® dv9925nr stand-alone notebook PC running on a dual-core
2.0 GHz AMD Turion® T60 microprocessor, equipped with 4.0 GB RAM and a 250 GB
(5400 rpm) primary storage hard-disk. The operating system platform was a 64-bit
version of Windows Vista® Home Premium.
The relational database comprised the following tables:
1. African Herbal Pharmacopoeia: Containing data on herbal products from
monographs published in the African Herbal Pharmacopoeia (AHP)10 including:
the herbal product name, natural botanical source, reported ethno-botanical
uses, experimentally determined pharmacological activities and chemical
constituents isolated from the product.
2. AHP Chemical Constituents: This table contained data on the chemical
compounds from the AHP monographs, specifically: their common chemical
name, chemical structure appended both as OLE (Object Linking and Embedding)
objects created using a different software application as well as conventional
molecular text notation.

CHAPTER 2: IN SILICO PROFILING OF NATURAL PRODUCTS
NICHOLAS M. NJUGUNA - Ph.D. THESIS 2014
63
3. ICIPE Compounds: Containing similar information as the AHP Chemical
Constituents table but only for natural products available from the International
Centre of Insect Physiology and Ecology (ICIPE) based in Nairobi, Kenya.
4. Conventional BP 2009 Drugs: This table contained the international non-
proprietary names (INN) and chemical structures of conventional drugs in current
clinical use published in the British Pharmacopoeia 200911 for comparison against
the natural product sets. This dataset contained only small molecule drug
compounds and not components of biological formulations such as
immunoglobulins, anti-toxins, plasma proteins or vaccines whose monographs
were also present in BP 2009.
The design structure of the Natural Product database is summarised in Table 2.1.
Different text notations for compound structures were included to provide an option
for importing and/or exporting chemical structures to other software platforms
easily without having to redraw them. In this case, the notations used were SMILES
(Simplified Molecular Input Line Entry System),12 SLN (SYBYL Line Notation)13 and the
IUPAC InChI (International Chemical Identifier)14. These three were selected because
they are currently the most widely used molecular text notation systems capable of
interpretation by the vast majority of molecule manipulation software. Text notation
of the molecular structures of the chemical constituents also reduced the amount of
physical digital storage space taken up by such data for purposes of transfer when
copying or moving between different software applications. Another advantage of
incorporating the text notations was that they provided the possibility for indexing
of the database, thereby allowing compound searches to be performed faster while
at the same time avoiding redundancy through inadvertent capture of the same
compound details more than once especially in cases of compounds having more
than one common name.
Table 2.1: Natural Product Database Structure
Data Table Data Fields Data Field Type (Size)
African Herbal Pharmacopoeia
Monograph number Numeric Integer
Herbal Product Text (50 characters)
Natural source Text (50 characters)

CHAPTER 2: IN SILICO PROFILING OF NATURAL PRODUCTS
NICHOLAS M. NJUGUNA - Ph.D. THESIS 2014
64
Data Table Data Fields Data Field Type (Size)
Ethnobotanical use (x3) Text (50 characters)
Pharmacological properties (x3) Text (50 characters)
Chemical constituents (x10) Text (50 characters)
African Herbal Pharmacopoeia Chemical Constituents
Common chemical name Text (50 characters)
Chemical structure OLE Embedded Object
SMILES notation Text (255 characters)
SLN notation Text (255 characters)
InCHI notation Text (255 characters)
ICIPE Compounds
Common chemical name Text (50 characters)
Chemical structure OLE Embedded Object
SMILES notation Text (255 characters)
SLN notation Text (255 characters)
InCHI notation Text (255 characters)
British Pharmacopoeia 2009 Drugs
Common drug name Text (50 characters)
SMILES notation Text (255 characters)
The possibility of data redundancies through accidental entry of the same chemical
compound more than once into any of the three compound tables was avoided by
indexing the SMILES notation field and forbidding entry of replicate data.
2.3.2 Data Entry
To ease capture of data into the tables described above and ensure consistency by
minimizing errors, computerized data entry forms were designed. For entering data
into the AHP Chemical Constituents and ICIPE Compounds tables, an identical form
was created as illustrated in Figure 2.1.

CHAPTER 2: IN SILICO PROFILING OF NATURAL PRODUCTS
NICHOLAS M. NJUGUNA - Ph.D. THESIS 2014
65
Figure 2.1: Screenshot of AHP Chemical Constituents and ICIPE Compounds Data Entry Form
To capture molecular structures of each new compound into the database, the form
was designed to link with ChemDraw Ultra software ver. 11.0 (ChembridgeSoft, MA,
USA). This link also allowed for the editing of already captured chemical structures
using the ChemDraw molecule editor. ChemDraw was also used to generate the
SMILES, SLN and InChI notations for each compound for entry into their
corresponding data fields.
The information entered into the African Herbal Pharmacopoiea Table was a
composite of data already captured in the Chemical Constituents Table (i.e. chemical
constitutents’ common names) and other data to be extracted from each product
monograph (e.g. ethnobotanical use and pharmacological activity). To input this
information, a separate data entry form (Figure 2.2) incorporating drop-down lists
that allowed for entry of the chemical constituents from the pre-existing table was
designed. This helped to minimize errors and avoid repetition through entry of data
that had already been captured previously.
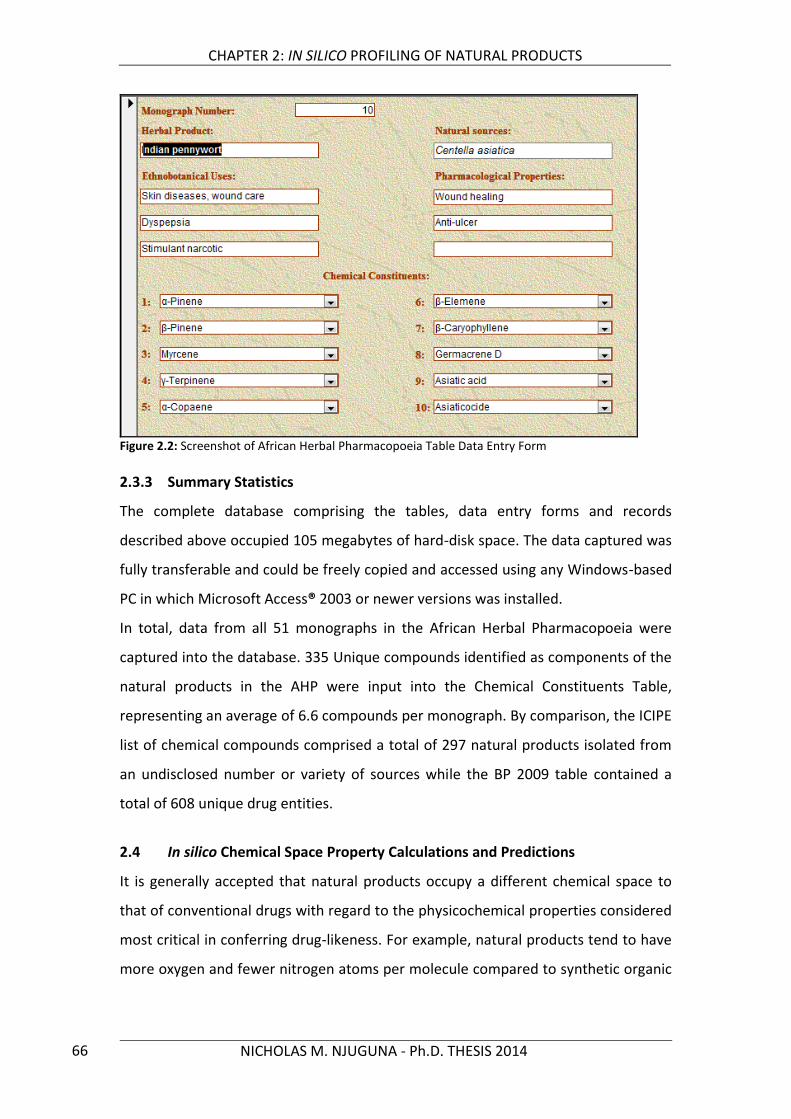
CHAPTER 2: IN SILICO PROFILING OF NATURAL PRODUCTS
NICHOLAS M. NJUGUNA - Ph.D. THESIS 2014
66
Figure 2.2: Screenshot of African Herbal Pharmacopoeia Table Data Entry Form
2.3.3 Summary Statistics
The complete database comprising the tables, data entry forms and records
described above occupied 105 megabytes of hard-disk space. The data captured was
fully transferable and could be freely copied and accessed using any Windows-based
PC in which Microsoft Access® 2003 or newer versions was installed.
In total, data from all 51 monographs in the African Herbal Pharmacopoeia were
captured into the database. 335 Unique compounds identified as components of the
natural products in the AHP were input into the Chemical Constituents Table,
representing an average of 6.6 compounds per monograph. By comparison, the ICIPE
list of chemical compounds comprised a total of 297 natural products isolated from
an undisclosed number or variety of sources while the BP 2009 table contained a
total of 608 unique drug entities.
2.4 In silico Chemical Space Property Calculations and Predictions
It is generally accepted that natural products occupy a different chemical space to
that of conventional drugs with regard to the physicochemical properties considered
most critical in conferring drug-likeness. For example, natural products tend to have
more oxygen and fewer nitrogen atoms per molecule compared to synthetic organic

CHAPTER 2: IN SILICO PROFILING OF NATURAL PRODUCTS
NICHOLAS M. NJUGUNA - Ph.D. THESIS 2014
67
compounds and drugs. They also tend to possess a greater number of stereogenic
centres.15
The chemical constituents captured from the African Herbal Pharmacopoeia were
evaluated using MarvinSketch software ver. 5.5.1.1 (ChemAxon Kft, Budapest,
Hungary) to predict values for the four ‘Rule-of-Five’ parameters described by
Lipinski as significantly influencing the absorption and permeability properties of
orally administered drugs. According to the ‘Rule-of-Five’, the majority of orally
active drugs tend to have molecular weights less than 500, LogP values not greater
than 5.0 in addition to having no more than 5 H-bond donors or 10 H-bond
acceptors.16 In addition to these, the number of rotatable bonds in the molecules
was also calculated as another critical determinant for oral bioavailability in drug-like
compounds as proposed by Veber et al.17 Most oral drugs have less than 10
rotatable bonds and besides contributing to bioavailability, their presence also
influences ligand affinity to drug targets.18
Frequency distribution histograms and pie charts of the values predicted or
calculated for these five parameters are illustrated in Figures 2.3 – 2.7. For
comparison of the natural product values against conventional medicines in current
clinical use, the same parameters were determined for the drug molecules captured
from the British Pharmacopoeia 2009.
2.4.1 Molecular Weight
79.1% of the AHP compounds had molecular weight (mwt) < 500 with most (60.3%)
ranging from 200 to 450. Only slightly more than 1% had mwt greater than 750 and
none had a value below 100. The mean molecular weight for all 335 compounds was
376.6 (sd 162.3) with a median of 338.3.
In contrast, 95.4% of the B.P. compounds had molecular weights below 500 (78.5%
ranging from 200 to 450). No compound had molecular weight less than 100 and
only 0.8% had molecular weights in excess of 700. The mean value for B.P. drugs was
316.9 (sd 106.5) with a median of 307.4.
For the ICIPE compounds, 94.3% had mwt less than 500, with those ranging from 51
to 250 accounting for the majority (67.3%). This relatively high proportion of low
molecular weight compounds was due to the fact that many of the ICIPE compounds

CHAPTER 2: IN SILICO PROFILING OF NATURAL PRODUCTS
NICHOLAS M. NJUGUNA - Ph.D. THESIS 2014
68
were small mono- and sesquiterpene components of essential oils extracted from
plants. This fact was further reflected in the average molecular weight for the data
set which was significantly lower than that for the AHP and BP drugs at 245.0 (sd
129.1) with a median value of 204.0. Five compounds (1.7%) had mwt less than 100
and three (1%) exceeded 650.
2.4.2 Predicted cLogP
Estimated octanol/water partition coefficient values for the AHP compounds ranged
from -5.02 to +10.0 with a mean of 2.70 and median value of 2.60. BP drugs had
cLogP values ranging from -3.5 to +11.2 with a mean of 2.33 and median of 2.41. In
both cases, compounds mostly clustered within the -1.0 to 5.0 cLog P range with
approximately 60% having values lying between 0 and 5.0.
By contrast, the ICIPE compounds exhibited a bi-modal distribution with cLogP
values clustering around the 2.01-3.00 and 5.01-6.00 ranges. The mean cLogP was
101 - 150
3.6%151 - 200
8.2%
201 - 250
14.1%
251 - 300
21.1%301 - 350
19.6%
351 - 400
14.8%
401 - 450
8.9%
451 - 500
5.1%
501 - 550
2.0%
551 - 600
1.0% 601 - 650
0.8%
651 - 1000
0.8%
B.P. Drugs Molecular Weight Distribution
101 - 150
2.7%151 - 200
8.1%
201 - 250
14.0%
251 - 300
16.4%
301 - 350
10.7%351 - 400
8.4%
401 - 450
10.7%451 - 500
8.1%
501 - 550
5.1%
551 - 600
3.6%
601 - 650
3.0%
651 - 700
4.8%701 - 750
3.3%
751 - 10001.2%
Percentage Distribution of AHP Constituent
Molecular Weights
51 - 100
1.7%
101 - 150
19.9%
151 - 200
24.2%
201 - 250
21.5%
251 - 300
7.4%
301 - 350
6.1%
351 - 400
5.1%
401 - 450
7.4%
451 - 500
1.0%
501 - 550
2.7%
551 - 600
1.3%
601 - 650
0.7%751 - 1000
0.7%
Percentage Distribution of ICIPE Compounds
Molecular Weights
Figure 2.3: Pie charts of molecular weight distributions for the three compound datasets

CHAPTER 2: IN SILICO PROFILING OF NATURAL PRODUCTS
NICHOLAS M. NJUGUNA - Ph.D. THESIS 2014
69
notably higher than that for the AHP and BP compounds at 3.49 indicating a higher
proportion of more lipophilic compounds in this collection. This could be attributed
to the fact that the terpenes mentioned previously as comprising a significant
portion of this dataset are largely simple hydrocarbons devoid of heteroatoms or
functional groups that might confer reduced lipophilicity.
Predicted LogP Distribution
0%
5%
10%
15%
20%
25%
-5.9
9 to -5
.00
-4.9
9 to -4
.00
-3.9
9 to -3
.00
-2.9
9 to -2
.00
-1.9
9 to -1
.00
-0.9
9 to 0
.00
0.01
to 1
.00
1.01
to 2
.00
2.01
to 3
.00
3.01
to 4
.00
4.01
to 5
.00
5.01
to 6
.00
6.01
to 7
.00
7.01
to 8
.00
8.01
to 9
.00
9.01
to 1
0.00
10.01
to 1
1.00
11.01
to 1
2.00
LogP Range
%ag
e C
om
po
un
ds
AHP
BP
ICIPE
Figure 2.4: Frequency distribution histograms of predicted cLogP values for compounds in the three datasets
2.4.3 Rotatable Bonds
Veber et al proposed that in addition to the four physicochemical parameters
highlighted in Lipinski’s ‘Rule-of-Five’ for good bioavailability, most orally-active drug
compounds appear to possess 10 or fewer rotatable bonds. The natural products
from the AHP and B.P. 2009 drug molecules both exhibited similar distributions in
this property with 94.9% and 93.6% of AHP and BP compounds respectively having
10 or less rotatable bonds. Notably, more than 11% of the AHP compounds but only
about 4% of the BP drugs were totally devoid of rotatable bonds.
The ICIPE compounds presented a similar profile with 93.3% falling within the 10-
bond limit. Two thirds of these compounds had 3 or fewer rotatable bonds with
12.1% lacking any at all.

CHAPTER 2: IN SILICO PROFILING OF NATURAL PRODUCTS
NICHOLAS M. NJUGUNA - Ph.D. THESIS 2014
70
Number of Rotatable Bonds
0%
5%
10%
15%
20%
25%
0 1 2 3 4 5 6 7 8 9 10 11 12 13 14 15 >15
Rotatable Bonds
%a
ge
Co
mp
ou
nd
s
AHP
BP
ICIPE
Figure 2.5: Frequency distribution histograms for number of rotatable bonds in the database compounds
2.4.4 Hydrogen Bond Donors and Acceptors
The ability to form hydrogen bonds is a key requirement for drug-like compounds to
be orally active, since such bonds enhance aqueous solubility and also partly because
they facilitate substrate-target interactions at the sub-cellular active sites of most
drugs. However, the ideal H-bond number in a drug-like molecule must strike an
optimal balance since too high a value might inadvertently limit compound
permeability. The ‘Rule-of-Five’ specifies that the ideal number of H-bond donors in
a drug-like molecule should be less than or equal to 5, while H-bond acceptors must
not ideally exceed 10. In general, the majority of AHP, ICIPE and BP chemical
constituents complied with this rule (82.4%, 97.0% and 97.9% respectively). The
ICIPE compounds were particularly unique in having a very high proportion of
molecules lacking H-bond donors (49.2%) which indicated a high incidence of
molecules devoid of hydroxyl, amine or carboxylic acid functional groups in this data
set. The average number of H-bond donors for the AHP, ICIPE and BP compounds
was 2.69, 1.04 and 1.73 and corresponding median values of 2, 1 and 1 respectively.

CHAPTER 2: IN SILICO PROFILING OF NATURAL PRODUCTS
NICHOLAS M. NJUGUNA - Ph.D. THESIS 2014
71
Hydrogen Bond Donors Distribution
0%
10%
20%
30%
40%
50%
0 1 2 3 4 5 6 7 8 9 10 11 12 >12
Hydrogen Bond Donors
No
. o
f C
om
po
un
ds
AHP
BP
ICIPE
Figure 2.6: Frequency distribution histograms of H-bond donors in the database compounds
The average number of H-bond acceptors was 5.25, 2.38 and 4.86 for AHP, ICIPE and
BP compounds respectively. While only 75.2% of the AHP compounds had 10 or
fewer H-bond acceptors, the ICIPE and BP compounds had 98.3% and 96.9%
respectively. All three compound groups presented a distribution skewed to the right
(Figure 2.7) indicating higher incidence of fewer H-bond acceptors in general, with
this characteristic being markedly pronounced with the ICIPE molecules in which
more than 75% had three or less acceptors.
Hydrogen Bond Acceptors Distribution
0%
5%
10%
15%
20%
25%
30%
0 1 2 3 4 5 6 7 8 9 10 11 12 13 14 15 >15
Hydrogen Bond Acceptors
No
. o
f C
om
po
un
ds
AHP
BP
ICIPE
Figure 2.7: Frequency distribution histograms of H-bond acceptors in the database compounds

CHAPTER 2: IN SILICO PROFILING OF NATURAL PRODUCTS
NICHOLAS M. NJUGUNA - Ph.D. THESIS 2014
72
Table 2.2: Mean values of ‘Rule-of-Five’ properties
Mean calculated values
AHP Natural Products (n = 335)
ICIPE Compounds (n = 297)
BP 2009 Drugs (n = 608)
Molecular weight 376.6 245.0 316.9
cLogP 2.7 3.5 2.3
Rotatable bonds 3.7 3.5 5.1
H-bond donors 2.7 1.0 1.7
H-bond acceptors 5.2 2.4 4.9
2.5 Statistical Evaluation and Comparison of Compound Datasets
Using SPSS19 statistics software, the Kolmogorov-Smirnov and Shapiro-Wilk tests
were applied across the three compound datasets to determine if the predicted and
calculated values for the ‘Rule-of-Five’ and rotatable bond parameters exhibited
normal frequency distributions. In all cases, the calculated p-values (0.000) were less
than 0.05 at the 95% confidence level (Table 2.3), indicating that the data did not
exhibit a normal distribution and could not therefore be reliably compared using
standard parametric tests such as the Student’s t-test.
Table 2.3: Results for statistical tests for normal distribution of data
Kolmogorov-Smirnov Test Shapiro-Wilk
Statistic df p-value Statistic df p-value
Mwt .080 1240 .000 .934 1240 .000
cLogP .049 1240 .000 .988 1240 .000
Rotatable Bonds .163 1240 .000 .884 1240 .000
H_Donors .224 1240 .000 .793 1240 .000
H_Acceptors .150 1240 .000 .910 1240 .000
The Mann-Whitney-Wilcoxon non-parametric statistical comparison test was
therefore used to determine if there were significant differences in the respective
chemical space profiles of the AHP, BP and ICIPE compounds. In this case, the
variance in median values of the parameter distributions (Table 2.4) were used as a
more robust variable for comparison of the different compound sets.

CHAPTER 2: IN SILICO PROFILING OF NATURAL PRODUCTS
NICHOLAS M. NJUGUNA - Ph.D. THESIS 2014
73
Table 2.4: Median values of ‘Rule-of-Five’ properties
Median values
AHP Natural Products (n = 335)
ICIPE Compounds (n = 297)
BP 2009 Drugs (n = 608)
Molecular weight 338.3 204.0 307.4
cLogP 2.60 3.21 2.41
Rotatable bonds 3 3 4
H-bond donors 2 1 1
H-bond acceptors 4 2 4
The null hypothesis (Ho) for the Mann-Whitney-Wilcoxon statistical comparison of
the similarity in the values of the datasets was that no significant difference exists in
the chemical space parameters of the AHP, ICIPE and BP compounds. The test was
carried out by comparing two of the datasets against each other in turns as
independent sample sets for each of the 5 parameters and determining the p-value
at the 95% confidence level (Table 2.5). The significance value of the calculated
statistic was 0.05, therefore, for all comparisons in which the determined p-value
was less than this cut-off, the null hypothesis was rejected. Conversely, p-values
greater than 0.05 meant that the null hypothesis could not be rejected and that
consequently, the differences between the datasets were not statistically significant.
Table 2.5: Mann-Whitney-Wilcoxon independent samples comparison test results
Mwt cLogP Rot. Bonds HBD HBA
p Ho p Ho p Ho p Ho p Ho
AHP vs BP 0.000 0.114 0.000 0.000 0.709
ICIPE vs BP 0.000 0.000 0.000 0.000 0.000
AHP vs ICIPE 0.000 0.000 0.389 0.000 0.000
Note: indicates failure to reject the null hypothesis; indicates rejection of the null hypothesis
AHP compounds were found to share strong similarities with conventional BP 2009
drugs in the distribution of cLogP and H-bond acceptors. On the other hand,
molecular weights, number of rotatable bonds and H-bond donors were significantly
different between the two datasets.

CHAPTER 2: IN SILICO PROFILING OF NATURAL PRODUCTS
NICHOLAS M. NJUGUNA - Ph.D. THESIS 2014
74
In contrast, the ICIPE compounds were found to be significantly different from the
BP 2009 drugs in each of the 5 parameters evaluated, strongly suggesting that this
dataset appeared to consist largely of compounds devoid of drug-like characteristics.
Comparison between the ICIPE and AHP compound sets also revealed that these two
groups were largely dissimilar, with only the number of rotatable bonds in the
molecules of either set not being significantly different from each other.
2.6 C-Lab Chemical Space Prediction and Principal Component Data Analysis
In addition to predicting the five chemical space parameters described above using
MarvinSketch, the 3 data-sets were analyzed using the AstraZeneca in-house C-Lab
ADMET property prediction service designed to calculate, using models, a much
larger array of physicochemical and ADMET properties.20 Using this package, it was
possible to compute values for 196 related compound parameters broadly falling
into the six categories summarized in Table 2.6 below.
Table 2.6: Categorization of physico-chemical descriptors predicted using C-Lab Platform
Category Parameters predicted
Lipophilicity 6
Hydrogen Bonding 29
Molecular Size and Shape 22
Molecular Charge/Polarity 75
Atom Counts 37
Molecular Topology 27
TOTAL 196
This multiplicity in prediction was due to the fact that many physicochemical
properties are typically estimated in silico using mathematical formulas or models of
which there might be several variations. For example, to estimate cLogP for each
compound, the C-Lab platform calculated values using 3 different and widely
recognized approaches, each yielding, in most cases, a different albeit closely
approximating result. In this case, cLogP values were variously predicted based on
calculations using Ghose/Crippen atom types;21 a neural network approach on
Ghose/Crippen atom types and prediction using the Daylight/Biobyte approach.

CHAPTER 2: IN SILICO PROFILING OF NATURAL PRODUCTS
NICHOLAS M. NJUGUNA - Ph.D. THESIS 2014
75
Using C-Lab, the 196 descriptors generated for each compound in all three datasets
rendered simple analysis of the data to determine chemical space trends extremely
challenging. To simplify this task, a different statistical application software was used
to carry out multivariate component analysis aimed at reducing the complex data
into a format that could be more easily interpreted. For this, SIMCA-P+ ver. 12.0.1
(Umetrics AB, Umeå, Sweden) was used. Data analysis using SIMCA again involved
comparing the descriptors predicted for the conventional BP 2009 drugs as the
reference against those for compounds from the AHP and ICIPE datasets. The results
were plotted on 2-D principal component analysis (PCA) scatter plots (Figure 2.8)
and from the pattern of resultant data points observed, trends inferred.
-20
-15
-10
-5
0
5
10
15
20
25
-45 -40 -35 -30 -25 -20 -15 -10 -5 0 5 10 15 20
tPS[
2]
tPS[1]
DivDataset_AZdescriptors080812+comps110825.M1 (PCA-X), all AZdescriptors, PS-Conv_Drugs_AZdescr_Oct11tPS[Comp. 1]/tPS[Comp. 2]
R2X[1] = 0.304779 R2X[2] = 0.271129
Ellipse: Hotelling T2 (0.95) SIMCA-P+ 12.0.1 - 2011-10-04 13:12:21 (UTC+1)
Figure 2.8: 2-D PCA scatter plot of predicted chemical space parameters of BP 2009 drugs (black triangles) and AHP chemical constituents (red diamonds, outliers highlighted in blue and red boxes).
PCA plots of the physicochemical descriptors of AHP compounds against BP 2009
drugs revealed a significant degree of overlap in compound properties but with two
distinct groups of non-overlapping compounds as illustrated. The first and larger
group comprising 79 compounds was clustered to the left of the main BP 2009 drugs
body of plots (2nd and 3rd quadrants of the 2-D scatter plot) while the second smaller

CHAPTER 2: IN SILICO PROFILING OF NATURAL PRODUCTS
NICHOLAS M. NJUGUNA - Ph.D. THESIS 2014
76
cluster to the lower right (4th quadrant) of the BP 2009 drugs plots and comprised 12
compounds. Based on the predictions from MarvinSketch for these 91 outlying
compounds, 75 (82.4%) were later found to violate one or more of the Lipinski rules
while the remaining 16 were fully compliant. Of note, however, was the fact that
these latter 16 compounds consisted almost entirely of the molecules in the 4th
quadrant outlier zone for which the data collated indicated they were the lowest
molecular weight compounds of the entire data set with values less than 250.
A similar comparison of the ICIPE compounds C-Lab predicted properties against
those of BP 2009 drugs using SIMCA-P+ yielded the results illustrated in Figure 2.9. In
this case, a much larger proportion of compounds did not overlap with the BP drugs
with the most prominent cluster located to the lower right hand side of the
reference plots (4th quadrant).
-20
-15
-10
-5
0
5
10
15
20
-45 -40 -35 -30 -25 -20 -15 -10 -5 0 5 10 15 20
tPS[
2]
tPS[1]
DivDataset_AZdescriptors080812+comps110825.M1 (PCA-X), all AZdescriptors, PS-Conv_Drugs_AZdescr_Oct11tPS[Comp. 1]/tPS[Comp. 2]
R2X[1] = 0.304779 R2X[2] = 0.271129
Ellipse: Hotelling T2 (0.95) SIMCA-P+ 12.0.1 - 2011-10-04 13:03:03 (UTC+1)
Figure 2.9: 2-D PCA scatter plot of predicted chemical space parameters of BP drugs (black triangles)
and ICIPE compounds (red diamonds). Outliers are highlighted in red boxes.
A total of 145 compounds could be distinctly identified in the outlier group with a
few other compounds noted in different non-overlapping areas of the scatter plot. A
review of the predicted physico-chemical properties of the main group of outliers
revealed that these compounds when compared to the original entire ICIPE dataset:

CHAPTER 2: IN SILICO PROFILING OF NATURAL PRODUCTS
NICHOLAS M. NJUGUNA - Ph.D. THESIS 2014
77
a) Had a markedly lower mean molecular weight (175.8 vs 245.0);
b) Had slightly higher mean cLogP values (3.95 vs 3.49);
c) On average, had significantly fewer rotatable bonds, H-bond donors and
acceptors (i.e. 2.59 vs 3.55, 0.23 vs 1.04 and 0.78 vs 2.38 respectively).
Unlike the case with the AHP compounds where there appeared to be a good
correlation between outliers and deviation from the ‘Rule-of-Five’, with the ICIPE
dataset, only 44 of the 145 outliers (i.e. 30.3%) were found to deviate from the rules.
From these observations, it appeared that principal component analysis using
SIMCA-P+ could be used as an easy and fairly accurate method for screening large
datasets of compounds likely to vary significantly in physico-chemical properties
from those of conventional drugs. On the basis of the SIMCA-P+ projections, the
ICIPE compounds could be considered to be not particularly promising as potential
drugs - a conclusion that was supported by the fact that the vast majority of these
compounds were simple hydrocarbon components of essential oils and other
secondary metabolites of plant origin.
2.7 Overall Compliance with ‘Rule-of-Five’
Compliance of compounds in the three datasets with the ‘Rule-of-Five’ is
summarized in Table 2.7. A total of 104 out of the 608 BP 2009 drugs (17.1%) failed
to comply with at least one of the ‘Rule-of-Five’ parameters. 76 of these (i.e. 73.1%
of non-compliant compounds) did not comply with 1 rule while 15 (14.4%), 10 (9.6%)
and 3 (2.9%) failed to adhere to 2, 3 and 4 rules respectively. The most frequently
violated rule was that for cLogP where 49 (47.1%) of the 104 drugs exceeded the
+5.0 limit followed by rotatable bonds where 39 (37.5%) drugs fell outside the
prescribed limit.
For the AHP constituents, 135 of the 335 compounds in the dataset (40.3%) violated
one or more of the Lipinski rules. Among these, the proportion of multiple deviations
was as follows: 1 rule - 72 compounds (53.3%), 2 rules - 33 compounds (24.4%), 3
rules - 21 compounds (15.5%) and 4 rules - 9 compounds (6.7%). Most frequent
deviation occurred in the limit for molecular weight where 70 compounds (51.8%)
exceeded 500. H-bond donors and cLogP were violated by an almost identical

CHAPTER 2: IN SILICO PROFILING OF NATURAL PRODUCTS
NICHOLAS M. NJUGUNA - Ph.D. THESIS 2014
78
proportion of the compounds (43.7% and 40.7% respectively) while only 17
compounds (12.6%) flouted the rule on number of rotatable bonds.
In contrast, only 85 of the 297 ICIPE compounds (28.6%) violated any of the rules
with cLogP being the most prone to deviation (89.4% of the failures). 23.5% and
20.0% of the deviating compounds exceeded the limits for rotatable bonds and
molecular weight while 10.6% and 5.9% of the deviants exceeded the requirements
for H-bond donors and H-bond acceptors respectively. 60 of the 85 compounds
failed in only one parameter while 11 deviated in both two and three of the rules.
Only three compounds failed to adhere to four of the rules. In none of the three data
sets was any compound found to flout all five of the Lipinski rules.
Table 2.7: Summary of compound deviations from ‘Rule-of-Five’
Compound Dataset
AHP (%) n = 335
ICIPE (%) n = 297
BP Drugs (%) n = 608
1 Parameter 72 (21.5) 60 (20.2) 76 (12.5)
2 Parameters 33 (9.8) 11 (3.7) 15 (2.5)
3 Parameters 21 (6.3) 11 (3.7) 10 (1.6)
4 Parameters 9 (2.7) 3 (1.0) 3 (0.5)
TOTAL 135 (40.3) 85 (28.6) 104 (17.1)
2.8 In silico Screening for Time Dependent Enzyme Inhibition Structural Alerts
A software script designed to detect functional groups associated with Time
Dependent Inhibition (TDI) of CYP450 enzymes was used to screen the compounds in
the data set. The script worked by identifying text fragments within the SMILES
notations for each compound indicating the presence of structural alert groups and
was designed to pick out any of 25 possible alerts, including, but not limited to:
1. 5 membered heterocyclic aromatic rings;
2. Conjugated unsaturated alkyl chains and carbonyl groups;
3. Terminal (ω) and penultimate carbon (ω-1) acetylenes;
4. Exocyclic and multi-halogenated alkenes, epoxides and thioethers;
5. Isothiocyanates, thioamides and dithiocarbamates;
6. Phenols, acetates and peroxides.

CHAPTER 2: IN SILICO PROFILING OF NATURAL PRODUCTS
NICHOLAS M. NJUGUNA - Ph.D. THESIS 2014
79
Table 2.8: Summary of number of TDI structural alerts detected per dataset
Compound Dataset
AHP ICIPE Cmpds BP Drugs
None Detected 88 135 183
1 Detected 127 121 279
2 Detected 92 37 123
3 Detected 28 3 19
4 Detected 0 1 3
5 Detected 0 0 1
Average structural alerts per compound 1.18 0.70 0.99
The AHP natural products were noted to possess the greatest number of potential
toxicophores per compound (1.18) compared to the ICIPE and BP drugs. The ICIPE
compounds had the fewest number of potential time dependent enzyme inhibitors
while the BP drugs averaged almost 1 structural alert per compound. In the three
data sets, only one compound was found to contain as many as five (5) different
structural alerts (Figure 2.10 - Cefixime from BP 2009 drugs). Ironically, however, this
highlighted the fact that presence of structural alerts alone is not necessarily always
definitive indication of compound toxicity since cefixime, an orally active third
generation cephalosporin, belongs to a class of antibiotic compounds with a
generally low toxicity index in humans. The major side effect associated with
cephalosporins in general is the possibility of hypersensitivity reactions in individuals
allergic to this class of β-lactam antibiotics. Inhibition of CYP450 enzymes by
cephalosporins has rarely been reported in the literature with cefixime in particular
reported as being non-inhibitory against the major drug metabolizing hepatic
CYP450 isoforms in vitro.22
Figure 2.10: Cefixime - Five structural alerts but low toxicity in vivo

CHAPTER 2: IN SILICO PROFILING OF NATURAL PRODUCTS
NICHOLAS M. NJUGUNA - Ph.D. THESIS 2014
80
2.9 Conclusions
A virtual database of natural products and conventional clinically used drugs was
successfully designed, populated and mined for data that allowed statistical
comparison across different data sets. Evaluation of the in silico predicted physico-
chemical properties in particular with regard to the Lipinski ‘Rule-of-Five’ parameters
highlighted broad differences between natural products and the mainly synthetic
conventional BP 2009 drug compounds.
As expected, a greater proportion of the natural products in the database did not
comply with one or more of the Lipinski parameters compared to the BP2009
dataset. In the case of the latter group, the non-compliance rate of approximately
17.1% was thought to have been largely due to the fact that this dataset had not
been filtered beforehand to remove drugs administered through non-oral routes, or
whose oral absorption was largely dependent on active transporters in vivo.
Although the database created as described in this Chapter is relatively modest in
terms of the number of compounds contained, particularly when compared to
commercially available or online databases, it possesses the advantage of containing
a large proportion of natural products from medicinal plants unique to the African
continent. As such, it may conceivably be populated with compounds possessing
unique chemical scaffolds that may lend themselves to useful ligand-based or target
structure-based in silico virtual screening.

CHAPTER 2: IN SILICO PROFILING OF NATURAL PRODUCTS
NICHOLAS M. NJUGUNA - Ph.D. THESIS 2014
81
REFERENCES:
(1) Shoichet, B. K. Virtual Screening of Chemical Libraries. Nature 2004, 432, 862–
865.
(2) Cavasotto, C. N.; Orry, A. J. W. Ligand Docking and Structure-Based Virtual
Screening in Drug Discovery. Current Topics in Medicinal Chemistry 2007, 7,
1006–1014.
(3) Ghosh, S.; Nie, A.; An, J.; Huang, Z. Structure-Based Virtual Screening of
Chemical Libraries for Drug Discovery. Current Opinion in Chemical Biology
2006, 10, 194–202.
(4) Clark, D. E.; Pickett, S. D. Computational Methods for the Prediction of “drug-
likeness.”Drug Discovery Today 2000, 5, 49–58.
(5) Irwin, J. J.; Shoichet, B. K. ZINC - A Free Database of Commercially Available
Compounds for Virtual Screening. Journal of Chemical Information and
Modeling 2005, 45, 177–182.
(6) Irwin, J. J.; Sterling, T.; Mysinger, M. M.; Bolstad, E. S.; Coleman, R. G. ZINC: A
Free Tool to Discover Chemistry for Biology. Journal of Chemical Information
and Modeling 2012, 52, 1757–1768.
(7) ZINC Database http://zinc.docking.org/ (accessed May 8, 2014).
(8) Ntie-Kang, F.; Zofou, D.; Babiaka, S. B.; Meudom, R.; Scharfe, M.; Lifongo, L. L.;
Mbah, J. A.; Mbaze, L. M.; Sippl, W.; Efange, S. M. N. AfroDb: A Select Highly
Potent and Diverse Natural Product Library from African Medicinal Plants.
PLoS ONE 2013, 8, e78085.
(9) Rollinger, J. M.; Stuppner, H.; Langer, T. Virtual Screening for the Discovery of
Bioactive Natural Products. In Progress in Drug Research: Natural Compounds
as Drugs, Volume 1; Petersen, F.; Arnstutz, R., Eds.; Birkhauser Verlag: Basel,
Switzerland, 2008; pp. 211–249.
(10) African Herbal Pharmacopoeia; Brendler, T.; Eloff, K.; Gurib-Fakim, A.; Phillips,
D., Eds.; Graphic Press Ltd: Baie du Tombeau, Mauritius, 2010.
CHAPTER 2: IN SILICO PROFILING OF NATURAL PRODUCTS
NICHOLAS M. NJUGUNA - Ph.D. THESIS 2014
82
(11) British Pharmacopoeia 2009; Her Majesty’s Stationery Office: London, UK,
2009.
(12) Weininger, D. SMILES, a Chemical Language and Information System. 1.
Introduction to Methodology and Encoding Rules. Journal of Chemical
Information and Modeling 1988, 28, 31–36.
(13) Ash, S.; Cline, M. A.; Homer, R. W.; Hurst, T.; Smith, G. B. SYBYL Line Notation
(SLN): A Versatile Language for Chemical Structure Representation. Journal of
Chemical Information and Modeling 1997, 37, 71–79.
(14) Heller, S.; McNaught, A.; Stein, S.; Tchekhovskoi, D.; Pletnev, I. InChI - the
Worldwide Chemical Structure Identifier Standard. Journal of Cheminformatics
2013, 5, 7.
(15) Lachance, H.; Wetzel, S.; Kumar, K.; Waldmann, H. Charting, Navigating, and
Populating Natural Product Chemical Space for Drug Discovery. Journal of
Medicinal Chemistry 2012, 55, 5989–6001.
(16) Lipinski, C. A.; Lombardo, F.; Dominy, B. W.; Feeney, P. J. Experimental and
Computational Approaches to Estimate Solubility and Permeability in Drug
Discovery and Development Settings. Advanced Drug Delivery Reviews 2001,
46, 3–26.
(17) Veber, D. F.; Johnson, S. R.; Cheng, H.-Y.; Smith, B. R.; Ward, K. W.; Kopple, K.
D. Molecular Properties That Influence the Oral Bioavailability of Drug
Candidates. Journal of Medicinal Chemistry 2002, 45, 2615–2623.
(18) Lipinski, C. A. Lead- and Drug-like Compounds: The Rule-of-Five Revolution.
Drug Discovery Today: Technologies 2004, 1, 337–341.
(19) IBM Corp. IBM SPSS Statistics for Windows, Version 22.0, 2013.
(20) Cumming, J. G.; Winter, J.; Poirrette, A. Better Compounds Faster: The
Development and Exploitation of a Desktop Predictive Chemistry Toolkit. Drug
Discovery Today 2012, 17, 923–927.
(21) Ghose, A. K.; Pritchett, A.; Crippen, G. M. Atomic Physicochemical Parameters
for Three Dimensional Structure Directed Quantitative Structure-Activity

CHAPTER 2: IN SILICO PROFILING OF NATURAL PRODUCTS
NICHOLAS M. NJUGUNA - Ph.D. THESIS 2014
83
Relationships III: Modeling Hydrophobic Interactions. Journal of
Computational Chemistry 1988, 9, 80–90.
(22) Niwa, T.; Shiraga, T.; Hashimoto, T.; Kagayama, A. Effect of Cefixime and
Cefdinir, Oral Cephalosporins, on Cytochrome P450 Activities in Human
Hepatic Microsomes. Biological & Pharmaceutical Bulletin 2004, 27, 97–99.

CHAPTER 3: IN VITRO EVALUATION OF NATURAL PRODUCT BIOACTIVATION
NICHOLAS M. NJUGUNA - Ph.D. THESIS 2014
84
CHAPTER THREE:
IN VITRO EVALUATION OF NATURAL PRODUCT BIOACTIVATION
3.1 Summary
In this Chapter, a panel of in vitro experimental techniques employed to investigate the
possible bioactivation of a selection of natural products is described in detail. The natural
products selected for in vitro studies are described with particular emphasis on their
potential or reported biological or medicinal properties. The evaluation strategy employed
to systematically investigate the potential bioactivation of these selected natural products is
highlighted. Results from both the preliminary screening as well as details of how in vitro
trapping experiments were conducted on the selected natural products possessing different
structural alerts using different trapping agents are presented. An overview of the rationale
for using different LC-MS detection modes to aid in data analysis as well as interpretation of
data collected from analysis of the test samples to determine which compounds appeared
to form reactive metabolic intermediates is included.
3.2 General Introduction
As previously highlighted in Chapter 1, toxicity of drugs and natural products may arise from
their inadvertent metabolic bioactivation into reactive metabolites, which are suspected to
disrupt normal biochemical processes through irreversible covalent binding to sub-cellular
components.1
The ability to predict which compounds have the potential to undergo undesirable
bioactivation during early drug discovery is hampered by many factors, including the fact
that animal studies cannot be used to determine this and that idiosyncratic adverse
reactions only occur in a small percentage of the population. In some cases, however, the
potential for reactive metabolite formation may be highlighted by the presence of
functional groups, or structural alerts, known to undergo metabolic bioactivation to reactive
electrophilic intermediates.2,3 However, the presence of structural alerts is rarely conclusive
evidence that a drug candidate will have a definite liability through formation of reactive
metabolites. Many drugs in clinical use that have excellent safety profiles are known to

CHAPTER 3: IN VITRO EVALUATION OF NATURAL PRODUCT BIOACTIVATION
NICHOLAS M. NJUGUNA - Ph.D. THESIS 2014
85
possess structural alerts that do not appear to result in the formation of toxic reactive
metabolites.4
At present, the most reliable in vitro experimental technique for detecting the formation of
reactive metabolites involves determination of covalent binding of test compounds to
microsomal or hepatocellular proteins after co-incubation. This requires the use of radio-
labelled test compounds and is based on determination of the residual radioactivity after
incubation of compounds with microsomes and subsequent ‘wash-out’ of the test
substrates. Radiation readings from the components left behind after removal of the
substrate are considered evidence of covalent binding of the radiolabelled drug or its
metabolites to proteins in the incubation matrix. The extent of covalent binding can be
quantified from the magnitude of radiation detected in the sample. Thus, this technique
allows for comparison of the relative risk of covalent binding by different compounds or
their metabolites and may be used to rank them for purposes of lead optimization. The
main drawback to this methodology is the need to incorporate radioisotopes into the test
compounds, which may not be practically feasible in the early stages of drug discovery
particularly when dealing with natural products. Consequently, such assays are only
performed on a routine basis at later stages of the drug discovery cycle.5
An alternative, cheaper, and more universally applicable in vitro method to investigate
covalent binding of compounds resulting from their metabolic bioactivation involves
trapping of reactive metabolic intermediates using nucleophilic trapping agents. Successful
application of such methods is, however, dependent on the availability of highly sensitive
analytical and detection techniques since due to their reactive nature, the reactive
intermediates are very short-lived and typically only generated in minute quantities. LC-MS
detection is the most widely applied technique for analysing in vitro metabolite trapping
incubation samples, providing high sensitivity and the ability to yield information that is
useful in elucidating the structures of the reactive intermediate.6–8
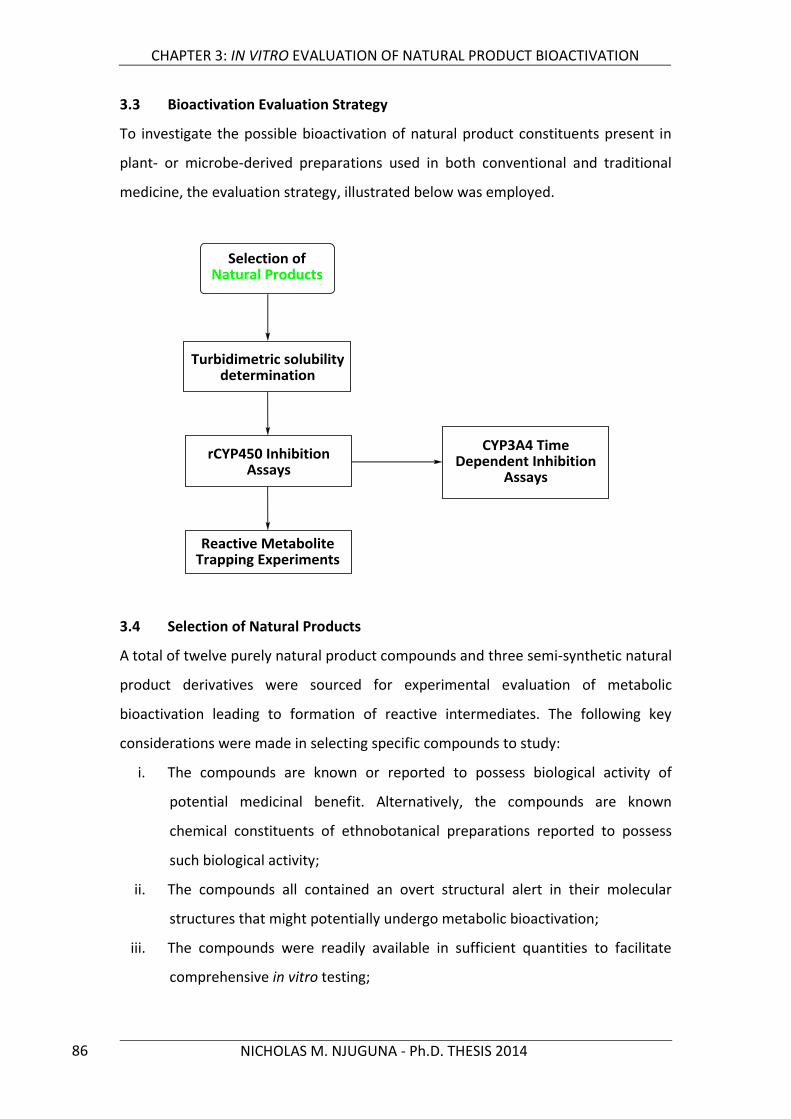
CHAPTER 3: IN VITRO EVALUATION OF NATURAL PRODUCT BIOACTIVATION
NICHOLAS M. NJUGUNA - Ph.D. THESIS 2014
86
3.3 Bioactivation Evaluation Strategy
To investigate the possible bioactivation of natural product constituents present in
plant- or microbe-derived preparations used in both conventional and traditional
medicine, the evaluation strategy, illustrated below was employed.
3.4 Selection of Natural Products
A total of twelve purely natural product compounds and three semi-synthetic natural
product derivatives were sourced for experimental evaluation of metabolic
bioactivation leading to formation of reactive intermediates. The following key
considerations were made in selecting specific compounds to study:
i. The compounds are known or reported to possess biological activity of
potential medicinal benefit. Alternatively, the compounds are known
chemical constituents of ethnobotanical preparations reported to possess
such biological activity;
ii. The compounds all contained an overt structural alert in their molecular
structures that might potentially undergo metabolic bioactivation;
iii. The compounds were readily available in sufficient quantities to facilitate
comprehensive in vitro testing;

CHAPTER 3: IN VITRO EVALUATION OF NATURAL PRODUCT BIOACTIVATION
NICHOLAS M. NJUGUNA - Ph.D. THESIS 2014
87
iv. Chemical structural diversity i.e. efforts were made to ensure that the
compounds chosen belonged to different chemical scaffolds. In some cases,
however, semi-synthetic analogues were also selected for testing to
investigate the effect of minor changes in parent natural chemical structure
on possible bioactivation.
3.4.1 Gedunin
Gedunin (GEDN) is a triterpenoid limonoid isolated from
plants of the family Meliaceae.9 It is present in extracts
prepared from the leaves and seeds of the Neem tree
(Azadirachta indica), a well-known and widely used
medicinal plant native to India and Burma but also
common in tropical parts of West and East Africa. The
medicinal properties of the Neem tree have been exploited for many years along the
East African coast, where the plant is considered to be a virtual cure-all for treating
diverse medical conditions – hence its Swahili name “Mwarubaini” (meaning reliever
of forty disorders). GEDN has also been reported to be a constituent in preparations
from other plant species including Melia azedarach, Xylocarpus granatum, X.
obovatus, Cedrela odorata, C. sinensis, Entandrophragna angolense, E. delevoyi,
Khaya grandifolia and Carapa guainensis.
GEDN is the most potent naturally occuring antiplasmodial limonoid identified to-
date. MacKinnon et al. reported its in vitro antiplasmodial IC50 values as 39 ng/mL
and 20 ng/mL against the chloroquine sensitive (CQ-S) P. falciparum D6 and resistant
(CQ-R) W2 clones, respectively, comparable to those of quinine (14.8 ng/mL and 34.9
ng/mL).10 Similar results had earlier been reported by Khalid et al but in this case, the
strain of P. falciparum used in the study was not indicated.11 An even more recent
study by Chianese et al. reported the antiplasmodial activity of GEDN and other
limonoids isolated from fruits of the neem tree, in which the potency of the
compound against the CQ-R P. falciparum W2 strain was again noted to be greater
than against the CQ-S D10 strain.12
Apart from its antiplasmodial activity, GEDN has also been reported to possess
antitumor activity in vitro. For example, it was found to be a moderately potent

CHAPTER 3: IN VITRO EVALUATION OF NATURAL PRODUCT BIOACTIVATION
NICHOLAS M. NJUGUNA - Ph.D. THESIS 2014
88
growth inhibitor of CaCo-2 colon cancer cells at IC50 16.83 µM.13 GEDN and some of
its semi-synthetic derivatives have also been reported to exhibit antiproliferative
activity against MCF-7 and SkBr3 breast cancer cell lines in vitro, acting via inhibition
of 90kDa heat shock protein (Hsp90), a validated target for new anticancer drugs.14
In addition to its antiplasmodial and cytotoxic activities, GEDN has also been
reported to possess inhibitory activity against H+ K+ - ATPase (gastric proton pump) in
rats and guinea pig models comparable to the anti-ulcer drug omeprazole.15
The sample of GEDN used for all in vitro experiments in this work was purchased
from Tocris Biosciences (Ellisville, MO, USA).
3.4.2 Justicidin A
Justicidin A (JSTN) is an aryl naphtholignan first isolated
from the plant Justicia procumbens. In Traditional Chinese
Medicine, J. procumbens is used as a folk remedy in the
treatment of fever, pain due to pharyngolaryngeal swelling
and cancer.16 JSTN is also present in other plant species,
and has been isolated from members of the Geraniaceae
family, in particular, Monsonia angustifolia.
JSTN has been reported to possess in vitro antiviral, antiplatelet and particularly
cytotoxic activity against different human cancer cell lines.16–19 For instance, the
compound has been found to cause apoptosis in HT-29 and HCT116 human
colorectal cancer cells and markedly suppressed the growth of HT-29 cells
transplanted into an immunodeficient (NOD-SCID) mouse model upon oral
administration.20 JSTN has similarly been reported to inhibit the growth of
hepatocellular carcinoma cells in vitro and also in mice via a mechanism thought to
involve activation of caspase-8 leading to apoptosis in addition to disruption of
mitochondrial function in the cancer cells.21 Very recently, JSTN and other aryl
naphtholignans from M. angustifolia have been patented for potential application in
the treatment of erectile dysfunction and libido enhancement.22
The sample of JSTN used for all in vitro experiments in this work was obtained from
the Council for Scientific and Industrial Research (CSIR), Pretoria, South Africa.

CHAPTER 3: IN VITRO EVALUATION OF NATURAL PRODUCT BIOACTIVATION
NICHOLAS M. NJUGUNA - Ph.D. THESIS 2014
89
3.4.3 Dehydrobrachylaenolide
Dehydrobracylaenolide is a eudesmane-type sesquiterpene
lactone (SQTL) originally isolated from the plant Brachylaena
transvaalensis from which its name is derived.23 The structure
of SQTL was elucidated from NMR data reported by Bohlmann
& Zdero and the absolute stereochemistry confirmed by chemical synthesis of the
natural product by Higuchi et al.24 More recently, the X-ray crystal structure of this
compound has been reported by Rademeyer et al.25
SQTL has also been isolated from roots of the plant Dicoma anomala, a grassland
herb species that is widely distributed in sub-Saharan Africa. This plant is reported to
have numerous ethnomedicinal applications including the treatment of coughs and
colds, fevers, ulcers, diarrhoea, intestinal parasites, in wound healing and also as an
analgesic anti-inflammatory agent.26–28
The in vitro antiplasmodial activity of SQTL reported by Becker et al indicated IC50
values of approximately 1.9 µM and 4.1 µM against CQ-S D10 and CQ-R K1 P.
falciparum strains, respectively (CQ IC50 0.038 and 0.2 µM, respectively). Gene
expression studies on the SQTL-treated parasites revealed that the compound
appeared to alter the expression of 572 unique genes, many of which were different
from those affected by the antimalarial drug artesunate, suggesting that SQTL may
have a novel mechanism of antiplasmodial activity.29
The sample of SQTL used for all in vitro experiments in this work was obtained from
the Council for Scientific and Industrial Research (CSIR), Pretoria, South Africa.
3.4.4 Metergoline
Metergoline (MTGN) is a semi-synthetic drug structurally
related to the naturally occurring ergotamine, an ergot alkaloid
first isolated from the fungus Claviseps purpurea.30 The
synthesis and subsequent discovery of the serotonin antagonist
effects of MTGN was first reported by Bernardi et al and
Beretta et al in the 1960s.31 In addition, MTGN also acts as a
dopamine agonist and is used clinically for the management of

CHAPTER 3: IN VITRO EVALUATION OF NATURAL PRODUCT BIOACTIVATION
NICHOLAS M. NJUGUNA - Ph.D. THESIS 2014
90
migraine headaches and to suppress lactation via its bromocriptine-like
pharmacological effects. MTGN has been reported to exhibit anti-fungal activity in
vitro, inhibiting the growth of Candida krusei by triggering intracellular increase in
reactive oxygen species and disrupting mitochondrial homeostasis.32 Very recently,
MTGN has been identified as a moderately potent chemosensitizer with potential
use in treatment of malaria by its enhancement of the sensitivity of resistant P.
falciparum strains to chloroquine.33
The sample of MTGN used for the in vitro assays in this work was purchased from
Sigma Aldrich.
3.4.5 Fusidic acid
Fusidic acid (FSDA) is a naturally occurring steroidal
antibiotic originally isolated from the fungus
Fucidium coccineum and which has been in clinical
use since the 1960s.34 FSDA is used for the
treatment of infections caused by gram-positive
bacteria and is formulated as tablets, oral
suspensions, intravenous infusions and topical
preparations. FSDA has been reported to exhibit high oral biovailability (91%) and
long plasma half-life.35 As an antibiotic, FSDA has a relatively narrow spectrum of
activity and is mainly active against staphylococci strains resistant to other classes of
antibiotics such as the penicillins. However, the drug is reported to be generally well
tolerated with a good safety profile and can be administered in large doses for
prolonged periods of time.36,37
The sample of FSDA used for in vitro assays in this work was purchased from Sigma
Aldrich.
3.4.6 Muzigadial
Muzigadial (MZG), also known as canellal, is a sesquiterpene
drimane dialdehyde present in plants of the genus Warburgia
(family Canellaceae) that was first isolated from the bark of the

CHAPTER 3: IN VITRO EVALUATION OF NATURAL PRODUCT BIOACTIVATION
NICHOLAS M. NJUGUNA - Ph.D. THESIS 2014
91
plant Warburgia ugandensis.38 MZG is also present in W. salutaris, the only species
of the genus that extends into Southern Africa.39 Traditionally, W. salutaris has been
used extensively for the ethnobotanical treatment of ailments such as headaches,
gum inflammation, venereal diseases, abdominal pains, malarial fevers, skin
complaints and stomach ulcers.40,41
MZG and related drimane sesquiterpenoids have been reported to possess potent
molluscidal, antifungal and broad spectrum antibacterial activity in addition to
having anti-feedant effects against African army worms.42,43 MZG and other drimane
sesquiterpenes isolated from Canella winterana have also been reported to possess
phytotoxic activity.44 MZG has also been reported to have potent in vitro
antiplasmodial activity against the chloroquine sensitive D10 P. falciparum strain.
However, its utility as an anti-malarial agent appeared to be limited by the fact that
it showed poor selectivity when tested for cytotoxicity against Chinese Hamster
Ovarian cells.45
The sample of MZG used for in vitro experiments in this work was obtained from the
Plants for Human Health Institute, North Carolina State University, USA.
3.4.7 Muzi-04
Muzi-04 is a semi-synthetic semicarbazone
derivative of muzigadial prepared from the reaction
of the parent compound with semicarbazide
(Scheme 3.1) to investigate the effect of substituting
one of the aldehyde groups on the biological activity of the parent natural product.
Scheme 3.1: Synthesis of Muzi-04 from muzigadial
The sample of MUZI-04 used in this work was synthesized by Dr. Tzu-Shean Feng at
the Department of Chemistry, University of Cape Town.

CHAPTER 3: IN VITRO EVALUATION OF NATURAL PRODUCT BIOACTIVATION
NICHOLAS M. NJUGUNA - Ph.D. THESIS 2014
92
3.4.8 Cucurbitacin A, B and C
The cucurbitacins are a group of highly oxygenated, tetracyclic triterpene
phytosterols characterized by the presence of the cucurbitane skeleton, 19-(109β)
abeo-10α-lanost-5-ene, and which were first identified in plants of the family
Cucurbitaceae. To date, no fewer than twenty distinct cucurbitacins have been
reported in the literature, each being assigned a different letter of the alphabet to
distinguish between these structurally closely related compounds (i.e. Cucurbitacin
A, B, C…etc.)46 Cucurbitacins have been reported to possess a wide range of
pharmacological activities in vitro, with cucurbitacin B, D, E, I and Q being particularly
notable for their cytotoxic activity against a variety of solid cancer cell types. The
anticancer activity of this class of compounds is largely due to their potent inhibition
of multiple cell signalling pathways crucial for cell proliferation and growth, resulting
in fatal morphological and physiological changes in cancer cells.47 For example,
cucurbitacin B (CUC-B) has been reported to inhibit the growth of Hep-2 human
laryngeal cancer cells and K562 leukaemia cells through inhibition of STAT3
activation leading to apoptosis and cell cycle arrest.48,49 CUC-B has also been
reported to inhibit the proliferation of BEL-7402 hepatocellular carcinoma cells both
in vitro and when administered orally to BEL-7402 xenografted nude mice. In this
case, the mechanism of action appears to involve inhibition of a different signalling
pathway, the activation of c-Raf and not STAT3.50 Against different leukaemia and
lymphoma cell lines, CUC-B has been reported to exhibit dose-dependent growth
inhibition arising from cell cycle arrest, increased cellular multi-nucleation and
abnormal enlargement of cancer cells but not apoptosis.51 In yet another study, CUC-
B has been found to inhibit growth of glioma cancer cells in culture, again by causing
cell-cycle arrest, apoptosis, disruption of F-actin and the microtubule cytoskeleton,

CHAPTER 3: IN VITRO EVALUATION OF NATURAL PRODUCT BIOACTIVATION
NICHOLAS M. NJUGUNA - Ph.D. THESIS 2014
93
thereby disabling the ability of cells to migrate. In these cells, CUC-B appeared to act,
at least partly, through the activation of JNK signalling pathways.52
The samples of cucurbitacin A, B and C used in this work were generously provided
by Emeritus Prof. James Bull (Department of Chemistry, University of Cape Town).
3.4.9 DC3
The furanoterpernoid labdane compound designated DC3 is a semi-
synthetic tetraol derived from the natural product dubiin, first
reported by Eagle and Rivett in the 1970s and originally isolated
from the acetone extracts of the leaves of the southern African plant
Leonotis dubia.53 DC3 was prepared through the synthetic reduction
of the parent compound using lithium aluminium hydride (Scheme
3.2).
Scheme 3.2: Synthesis of DC3 from dubiin
3.4.10 Leoleorin A
Plants of the genus Leonorus from which dubiin and leoleorin A
(DC14) are obtained are indigenous to tropical parts of the world
and particularly common in southern parts of Africa where they
have been used as components of traditional herbal remedies. L.
leonurus commonly known as Lion’s Tail or Wild Dagga, is used as a
herbal remedy for the treatment of fevers, headaches, dysentery, epilepsy,
hypertension and snake bites. The plant is known to have mild psychoactive
properties and its dried leaves and flowers have a calming effect when smoked. The

CHAPTER 3: IN VITRO EVALUATION OF NATURAL PRODUCT BIOACTIVATION
NICHOLAS M. NJUGUNA - Ph.D. THESIS 2014
94
plant has subsequently been shown to be of potential benefit as an anxiolytic or
antidepressant, possibly through modulation of the dopaminergic system.54
The samples of DC3 and Leoleorin A (designated DC14) used for the in vitro assays
reported in this work were a generous donation from Prof. Mike-Davies Coleman
(formerly of Rhodes University, Grahamstown, South Africa and currently at the
University of the Western Cape, South Africa).
3.4.11 Jamaicin and Calopogonium isoflavone A
Jamaicin (JMCN) is an isoflavone that was first isolated from root bark extracts of the
plant Piscidia erythrina, commonly known as Jamaica Dogwood and from which the
compound’s name is derived.55 Calopogonium isoflavone A (CLPG) is a closely related
compound isolated from plants of the genus Millettia.
In general, isoflavanoids have very limited distribution in the plant kingdom and are
mostly found only in plants of the family Leguminoseae. JMCN, CLPG and other
isoflavones are known constituents of herbal preparations that possess medicinal
properties. Both compounds have, for example, been reported to exhibit moderate
antiplasmodial activity in vitro against CQ-R Indochina 1 (W2) and CQ-S Sierra Leone
1 (D6) strains of Plasmodium falciparum.56
The samples of JMCN and CLPG used in this work were a generous donation from
Prof. Abiy Yenesew (Department of Chemistry, University of Nairobi, Kenya).

CHAPTER 3: IN VITRO EVALUATION OF NATURAL PRODUCT BIOACTIVATION
NICHOLAS M. NJUGUNA - Ph.D. THESIS 2014
95
3.4.12 Formononetin
Formononetin (FMTN) is an isoflavone also isolated
from plants of the family Leguminosae used as
herbal medications. In Traditional Chinese Medicine
preparations of the remedy Danggui Buxue Tang
which comprises a mixture of Radix astragali and Radix angelicae, the content of
FMTN and other isoflavanoids has been found to correlate with the biological
activity of the preparation. FMTN content is therefore used as a quality control
marker for Radix astragali preparations.57 FMTN from other plant species has
similarly been reported to possess varying biological activities. For example, this
compound from the bark of Dalbergia frutescens was found to exhibit significant in
vitro antigiardial activity against the protozoan parasite Giardia intestinalis with IC50
values superior to those of metronidazole, the current drug of choice (0.03 µg/mL vs.
0.1 µg/mL). However, although FMTN was also found to be active against a murine
model of giardiasis in vivo, only high doses were effective, suggesting possible ADME
liabilities when the compound is administered orally.58 Isoflavones in general are
well documented to possess phytoestrogenic biological properties, arising from their
structural similarity to the hormone estrogen. FMTN has therefore been extensively
studied to determine its effect on biological processes mediated in part by estrogens
in vivo. For example it has been found to promote early healing of fractures in rats
by activating angiogenesis and also been reported to promote endothelial repair and
accelerate wound healing ex vivo and in a mouse model.59,60 In a study carried out in
rats, FMTN was reported to cause aortic vascular relaxation via both nitric oxide
dependent and endothelium-independent mechanisms involving activation of BKCa
and KATP channels.61 Very recently, it has also been reported that FMTN may play a
neuroprotective role in rats subjected to traumatic brain injury through inhibition of
intracephalic inflammatory response and oxidative stress.62
The sample of FMTN used in this work was purchased from Sigma Aldrich.
Prior to carrying out in vitro experiments, the identity and purity of the test
compounds was confirmed using a combination of NMR spectroscopy, LC coupled

CHAPTER 3: IN VITRO EVALUATION OF NATURAL PRODUCT BIOACTIVATION
NICHOLAS M. NJUGUNA - Ph.D. THESIS 2014
96
mass spectrometry (LC-MS) and melting point determination. Spectral data was
compared to values reported in the literature. Semi-quantitative determination of
the solubility of the test compounds in aqueous buffer was measured using
turbidimetric analysis as a means of identifying potential challenges in conducting
subsequent in vitro assays in aqueous buffer solutions. The experimental procedures
used for these characterizations are described in detail in Chapter 6 and the results
for each compound summarized in Appendix 1.

CHAPTER 3: IN VITRO EVALUATION OF NATURAL PRODUCT BIOACTIVATION
NICHOLAS M. NJUGUNA - Ph.D. THESIS 2014
97
3.5 CYP450 Enzyme Inhibition Assays
Inhibition of the enzymes involved in drug metabolism often presents as one of the
mechanisms by which xenobiotics lead to toxicity either directly or more commonly,
through adverse drug-drug interactions. As previously highlighted in Chapter 1,
natural products present in foods or non-conventional herbal remedies can similarly
inhibit the same drug metabolizing enzymes, resulting in clinically significant adverse
food-drug or herb-drug interactions. Enzyme inhibition assays are therefore
routinely conducted early in the drug discovery process to identify lead compounds
that might interfere with the catalytic activity of the main drug metabolizing
enzymes, particularly the CYP450 isoforms.
For rapid high-throughput screening of large compound sets for CYP450 inhibition,
assays based on the use of fluorogenic substrates and purified recombinant enzymes
in microtitre 96-well plates are routinely used. These assays are based on the
metabolism of the probe substrates to fluorescent metabolites when incubated in
the presence of the drug metabolizing enzymes. Enzyme activity is proportional to
the intensity of the measured fluorescence. If a compound that inhibits the activity
of the enzyme is co-incubated with the probe substrate, there is a resultant decline
in formation of the fluorescent metabolite, which can be determined through a
measurable decrease in the fluorescence determined spectrophotometrically.
Advantages of this assay set-up include its high speed, ease of application and low
set-up cost without the need for elaborate compound separation or capital-intensive
equipment since it is based on the measurement of fluorescence of known
metabolites whose spectral properties are well established with regard to excitation
and emission wavelengths. Furthermore, fluorescence readings are taken directly
from the test preparation without the need for sample work-up or separation to
isolate the fluorescent metabolites. Because of the very simple setup of this type of
assay, testing of compounds can be readily automated to facilitate high throughput
screening.
Although ideal for rapid early screening of potential enzyme inhibitors, this method
suffers from the drawback of not being suitable for testing inhibition caused by
compounds that fluoresce at the same wavelengths as the probe substrate
metabolites detected or which quench the fluorescence of these metabolites.

CHAPTER 3: IN VITRO EVALUATION OF NATURAL PRODUCT BIOACTIVATION
NICHOLAS M. NJUGUNA - Ph.D. THESIS 2014
98
3.5.1 CYP450 Inhibition Assay Procedure and Results
In vitro CYP450 inhibition assays were carried out in 96-well microtitre plates based
on the methods described by Crespi whereby test compounds were co-incubated in
duplicate with purified recombinant enzymes in aqueous buffer to which the
fluorogenic probe substrates was also included.63,64 The test compounds were
incubated at both 3 µM and 20 µM for 15 minutes at 37 °C at the end of which
incubations were terminated by addition of an ice-cold solution of 20% 5 mM Tris in
80% acetonitrile. Inhibition of enzyme activity in incubations containing test
compounds was subsequently determined based on calculations of the fluorescence
intensity measurements compared to control incubations in which no compound
was present. Positive control incubations in which known specific inhibitors of the
individual rCYP450 enzymes screened were also included in every assay. The general
set-up conditions for the enzyme inhibition assays are summarized in Table 3.1 and
described in detail in the Experimental Chapter.
Table 3.1: CYP450 isoforms, probe substrates, fluorescent metabolites and spectrofluorometric conditions used for CYP inhibition assays
rCYP450 Isoform
Fluorogenic Substrate
Fluorescent Metabolite
Excitation λ (nm)
Emission λ (nm)
CYP1A2
405 460
CYP2C9 and CYP2C19
405 535
CYP2D6
390 460
CYP3A4
405 535

CHAPTER 3: IN VITRO EVALUATION OF NATURAL PRODUCT BIOACTIVATION
NICHOLAS M. NJUGUNA - Ph.D. THESIS 2014
99
The fluorogenic probe substrates illustrated in Table 3.1 used to evaluate CYP450
enzyme inhibition by the different compounds were synthesized, purified and
characterised in-house as part of this work. However, evaluation of CYP2D6
inhibition using MAMC as probe substrate was hampered by the unusually high
flourimeter readings obtained from the inhibition assay samples. Although successful
use of this probe substrate and structurally related analogues has been reported in
the literature, 65 the readings observed in our case were thought to be due to
spectral interference by other components present in the incubation matrix. The
interference was most likely largely due to NADPH, which has almost identical
maximum emission wavelength (λemm 460 nm) as that of the monitored metabolite
(7-hydroxy-4-methylamino coumarin, λemm 470 nm).66 Consequently, determination
of CYP2D6 inhibition by the test compounds using the methods successfully
employed for other isoforms as described in this Chapter was not possible, despite
minimizing NADPH concentration.

CHAPTER 3: IN VITRO EVALUATION OF NATURAL PRODUCT BIOACTIVATION
NICHOLAS M. NJUGUNA - Ph.D. THESIS 2014
100
3.5.1.1 Inhibition of CYP1A2
Figure 3.1: rCYP1A2 inhibition assay results (Substrate: CEC 3 µM)
rCYP1A2 appeared to be inhibited most significantly by the isoflavanoids CLPG and
JMCN, both of which reduced enzyme activity to far less than 40% even at the lower
assay concentration (3 µM). All other test compounds seemed to have little, if any,
inhibitory effect on the activity of this isoform, with only metergoline and gedunin
being noted to reduce activity to slightly less than 80% at 3 µM. This inhibition, was
not, however, considered to be significant.
The isoflavone formononetin (FMTN), though closely structurally related to both
CLPG and JMCN did not appear to inhibit enzyme activity even at the higher assay
concentration (20 µM), suggesting that inhibition of the enzyme might be, in some
way, dependent on the presence of the unique dimethyl pyran ring substitution on
the chromone nucleus in JMCN and CLPG.
The three cucurbitacin compounds appeared to have no inhibitory effect on the
enzyme.

CHAPTER 3: IN VITRO EVALUATION OF NATURAL PRODUCT BIOACTIVATION
NICHOLAS M. NJUGUNA - Ph.D. THESIS 2014
101
3.5.1.2 Inhibition of CYP2C9
Figure 3.2: rCYP2C9 inhibition assay results (Substrate: MFC 85 µM)
rCYP2C9 appeared to be substantially more prone to inhibition by the test
compounds compared to rCYP1A2 with 7 of the test substances (FMTN, JSTN, MZG,
MTGN, FSDA, CLPG and JMCN) being found to reduce enzyme activity by more than
20% at 3 µM. The most potent inhibitors of this isoform were JSTN and MZG
although neither seemed to reduce enzyme activity to as great an extent as
observed with the most potent inhibitors of rCYP1A2 (i.e. JMCN and CLPG). Again, as
also noted with rCYP1A2, none of the three cucurbitacins seemed to have any
significant inhibition of rCYP2C9 enzyme at both assay concentrations, with only
CUC-C exhibiting moderate inhibition at 20 µM.

CHAPTER 3: IN VITRO EVALUATION OF NATURAL PRODUCT BIOACTIVATION
NICHOLAS M. NJUGUNA - Ph.D. THESIS 2014
102
3.5.1.3 Inhibition of CYP2C19
Figure 3.3: rCYP2C19 inhibition assay results (Substrate: MFC 35 µM)
GEDN and JMCN were the only compounds observed to inhibit rCYP2C19 to a
significant degree at the lower assay concentration. Both reduced enzyme activity to
less than 50% at 3 µM with GEDN being the more potent inhibitor. None of the
remaining compounds reduced enzyme activity to below 50% although all fifteen
appeared to exert greater inhibition at 20 µM in a manner largely proportional to
activity at the lower concentration. The most notable exception to this behaviour
was MZG - which at 3 µM only appeared to cause less than 25% inhibition of
enzymatic activity, but was the most potent inhibitor at the higher assay
concentration, reducing activity to less than 20%. As observed with rCYP2C19, such
inhibitory activity was markedly absent in the semi-synthetic derivative Muzi-04.
The cucurbitacin compounds were, as seen with rCYP1A2 and rCYP2C9, noted to
possess very little, if any, inhibitory activity against this isoform, even when assayed
at 20 µM.

CHAPTER 3: IN VITRO EVALUATION OF NATURAL PRODUCT BIOACTIVATION
NICHOLAS M. NJUGUNA - Ph.D. THESIS 2014
103
3.5.1.4 Inhibition of CYP3A4
Figure 3.4: rCYP3A4 Inhibition Assay Results (Substrate: BFC 400 µM)
Of the CYP450 isoforms tested, rCYP3A4 appeared to be the most susceptible to
inhibition by the test compounds. All fifteen compounds exhibited concentration
dependent inhibition of this isoform, with greater inhibition of the enzyme at 20 µM
compared to 3 µM. Seven (7) of the compounds reduced enzyme activity by more
than 50% even at the lower assay concentration of 3 µM while only in the presence
of FSDA at 20 µM was rCYP3A4 activity above 50% retained. GEDN, JSTN, MTGN,
CLPG and JMCN were the most potent inhibitors, each being noted to inhibit enzyme
activity by more than 60% at 3 µM.
Although the cucurbitacins were very closely related structurally, and appeared to be
uniformly devoid of inhibition against the other CYP450 isoforms tested, they were
noted to possess different inhibitory profiles against rCYP3A4. Against this enzyme,
CUC-B and CUC-C were appreciably more potent inhibitors compared to CUC-A,
which was the only cucurbitacin that did not cause more than 50% enzyme inhibition
at 3 µM. MZG was a moderate inhibitor of rCYP3A4 compared to its semi-synthetic
derivative Muzi-04 which was only weakly inhibitory at 3 µM. Overall, GEDN, JMCN
and JSTN, in that order, appeared to be the most potent enzyme inhibitors.

CHAPTER 3: IN VITRO EVALUATION OF NATURAL PRODUCT BIOACTIVATION
NICHOLAS M. NJUGUNA - Ph.D. THESIS 2014
104
3.5.2 Time Dependent CYP3A4 Inhibition
Time dependent inhibition (TDI) assays were performed to determine whether
inhibition of rCYP3A4 was due to reactive metabolic intermediates of the test
compounds resulting in mechanism based inhibition of this isoform. This enzyme
was selected for TDI assays because it is the single most abundant and important
CYP450 isoform involved in drug metabolism in vivo and also due to the fact that it
appeared to be the most susceptible to inhibition by the test compounds.
The TDI assay was performed by incubating test compounds in recombinant enzyme,
in both the absence and presence of co-factor (NADPH) for a defined duration before
re-incubating the test preparation in the presence of the fluorogenic substrate of the
enzyme to determine the latter’s subsequent metabolism. If the test compound is a
TDI, the pre-incubation is necessary to provide the enzyme adequate time to
metabolize the compound. Presence of NADPH is a mandatory prerequisite for
enzymatic metabolism. If the test compound is metabolized into chemically reactive
species that in turn inactivate the metabolizing enzyme, this is detectable as a
measurable decline in the fluorescence from metabolism of the fluorogenic marker
substrate in the second incubation. If the test compound is not a TDI, the difference
in the metabolism of the marker substrate in the test and control incubations is
negligible and can be quantified by calculating normalized inhibition ratios.
In running the TDI assays, 2 known inhibitors of CYP3A4 were used as controls.
Ketoconazole (KTZ) is a non-TDI compound (i.e. inhibits the activity of CYP3A4 but
not irreversibly) and was therefore used as the negative control. Troleandomycin
(TAO) is an irreversible inhibitor of the enzyme and acted as the positive control.
Test compounds were incubated in duplicate at concentrations of 1 µM and 5 µM.
From the measured fluorescence values, the normalized enzyme inhibition ratios of
the test compounds were calculated using the equation shown below and results
interpreted according to the criteria outlined by Thelingwani et al. 67
Normalized Ratio =
where R + I+NADPH
is the rate of reaction in the presence of both inhibitor and NADPH, R - I
+NADPH is the rate of reaction in the presence of NADPH but in the absence of inhibitor,
R+ I-NADPH
is the rate of reaction in the presence of inhibitor but in the absence of NADPH, R - I
-NADPH is the rate of reaction in the absence of both inhibitor and NADPH
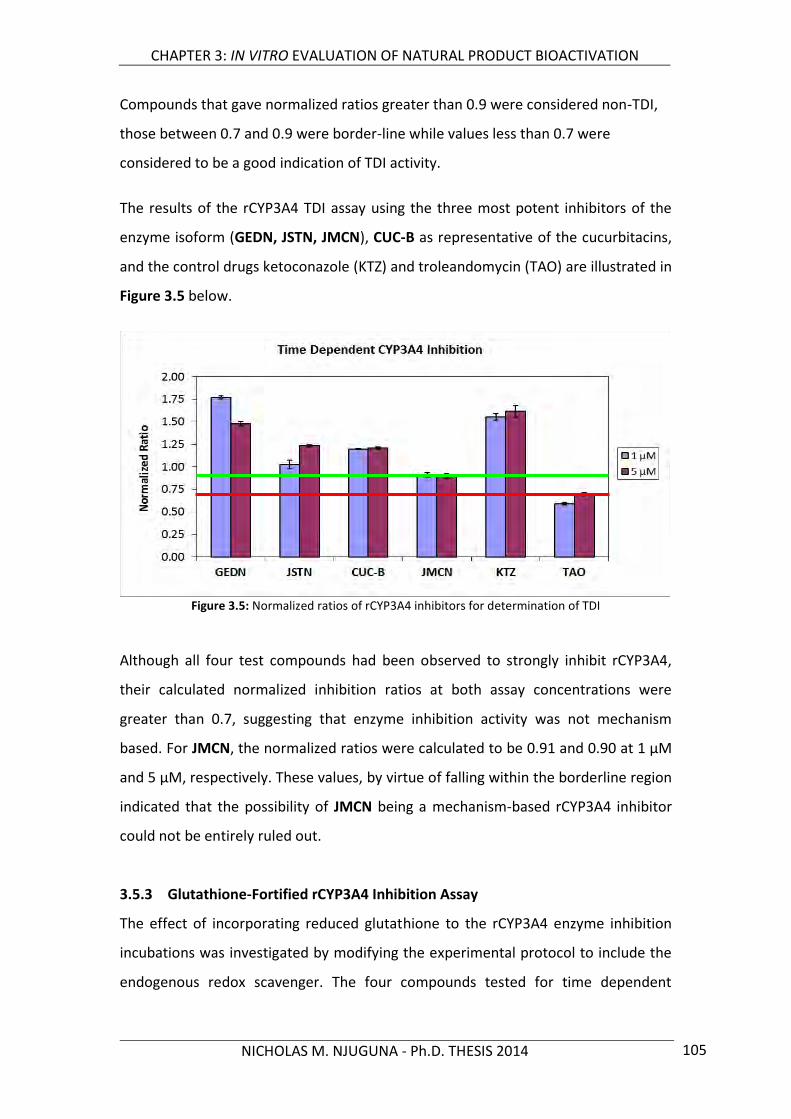
CHAPTER 3: IN VITRO EVALUATION OF NATURAL PRODUCT BIOACTIVATION
NICHOLAS M. NJUGUNA - Ph.D. THESIS 2014
105
Compounds that gave normalized ratios greater than 0.9 were considered non-TDI,
those between 0.7 and 0.9 were border-line while values less than 0.7 were
considered to be a good indication of TDI activity.
The results of the rCYP3A4 TDI assay using the three most potent inhibitors of the
enzyme isoform (GEDN, JSTN, JMCN), CUC-B as representative of the cucurbitacins,
and the control drugs ketoconazole (KTZ) and troleandomycin (TAO) are illustrated in
Figure 3.5 below.
Figure 3.5: Normalized ratios of rCYP3A4 inhibitors for determination of TDI
Although all four test compounds had been observed to strongly inhibit rCYP3A4,
their calculated normalized inhibition ratios at both assay concentrations were
greater than 0.7, suggesting that enzyme inhibition activity was not mechanism
based. For JMCN, the normalized ratios were calculated to be 0.91 and 0.90 at 1 µM
and 5 µM, respectively. These values, by virtue of falling within the borderline region
indicated that the possibility of JMCN being a mechanism-based rCYP3A4 inhibitor
could not be entirely ruled out.
3.5.3 Glutathione-Fortified rCYP3A4 Inhibition Assay
The effect of incorporating reduced glutathione to the rCYP3A4 enzyme inhibition
incubations was investigated by modifying the experimental protocol to include the
endogenous redox scavenger. The four compounds tested for time dependent

CHAPTER 3: IN VITRO EVALUATION OF NATURAL PRODUCT BIOACTIVATION
NICHOLAS M. NJUGUNA - Ph.D. THESIS 2014
106
inhibition of the enzyme were evaluated once more using this strategy in the
presence of 1 mM reduced L-glutathione (Figure 3.6).
Figure 3.6: Effect of glutathione on inhibition of rCYP3A4 by selected natural products
Glutathione appeared to have little influence on the inhibition of rCYP3A4 by GEDN,
JSTN and JMCN in which incubations the remaining enzyme activity only increased
by less than 2%, which was not considered to be significantly higher than the
experimental error. In the case of CUC-B, however, the presence of glutathione
appeared to have a more noticeable effect in reducing enzyme inhibition, increasing
residual enzyme activity by approximately 8% and 6% at 3 µM and 20 µM inhibitor
concentrations respectively.
CHAPTER 3: IN VITRO EVALUATION OF NATURAL PRODUCT BIOACTIVATION
NICHOLAS M. NJUGUNA - Ph.D. THESIS 2014
107
This observation seemed to contradict the conclusion based on TDI data that showed
CUC-B not to be an irreversible, time dependent inhibitor of rCYP3A4. On the other
hand, the data from this assay for the other compounds supported the observations
made from the TDI experiment that neither GEDN, JSTN nor JMCN seemed to form
reactive metabolites that inhibited rCYP3A4.
In order to establish more conclusively which of the test compounds screened for
enzyme inhibition might act via formation of reactive metabolic intermediates, more
comprehensive reactive metabolite trapping experiments were performed next.

CHAPTER 3: IN VITRO EVALUATION OF NATURAL PRODUCT BIOACTIVATION
NICHOLAS M. NJUGUNA - Ph.D. THESIS 2014
108
3.6 Reactive Metabolite Trapping Experiments
In vitro reactive metabolite trapping experiments were conducted based on adopted
assay protocols reported in the literature.68,69 The general procedure involved
incubating test compounds at concentrations of 10 µM in aqueous phosphate buffer
(pH 7.4) in the presence of hepatic microsomes and nucleophilic trapping agents.
Metabolic reactions were initiated by the addition of NADPH and maintained at 37°C
for 60 minutes then terminated by adding ice-cold acetonitrile. Sample preparation
involved centrifugation of the quenched reaction mixture to separate precipitated
microsomal proteins, followed by filtration of the resultant supernatant solution and
analysis by LC-MS. For every trapping experiment, various controls in which either
the test compound, trapping agent, NADPH or microsomes was excluded from the
reaction were also incubated to aid in data interpretation.
Prepared samples were analysed using reversed-phase HPLC coupled to mass
spectrometry. Mass spectrometer ionisation and detection parameters for each test
compound were manually optimised following direct infusion of the compounds
using a syringe pump. Compound detection was carried out following ionisation
using either electro-spray ionisation (ESI) as the preferred mode or, in a few
instances, atmospheric pressure chemical ionisation (APCI).
The following MS detection modes were used to analyse the incubation samples for
trapped reactive metabolite adducts:
i. Enhanced mass spectrum (EMS) scans in either or both positive and negative
ionisation mode were the primary detection modes employed. The range of
m/z values scanned was typically 150 – 900 and facilitated the scanning of
full mass spectra on LC eluent samples using the increased sensitivity on the
incorporated linear ion trap present in the mass spectrometer used.
ii. Information dependent acquisition enhanced product ion scans (IDA EPI)
were used to automatically detect and obtain mass fragmentation data of
the most intense peaks observed from the initial EMS scans. By directly
coupling this detection mode to the EMS scans, the need to rerun samples to
obtain mass spectral fragmentation data was eliminated.

CHAPTER 3: IN VITRO EVALUATION OF NATURAL PRODUCT BIOACTIVATION
NICHOLAS M. NJUGUNA - Ph.D. THESIS 2014
109
iii. Constant neutral loss (CNL) scans were used to detect reactive metabolite
adducts of trapping reagents known to undergo characteristic fragmentation
by losing neutral fragments having specific m/z values.
iv. Precursor ion scans were used as an optional confirmatory detection mode to
determine the presence of glutathione trapped reactive metabolites which
are often observed to undergo collision-induced dissociation to yield
fragment ions having m/z 272.09 in negative ion mode.
3.6.1 Trapping Reactive Metabolites Using Cyanide
Cyclic tertiary amines are principally metabolized by CYP450 or monoamine oxidase
(MAO) enzymes via α-carbon oxidation that generates the corresponding endocyclic
iminium ion. Alternatively, these compounds may also undergo oxidative N-
dealkylation via oxidation to the exocyclic iminium ion intermediate that is
subsequently hydrolysed to form the corresponding secondary amine and an
aldehyde. Unlike the exocyclic iminium ion intermediate, hydrolysis of the endocyclic
iminium ion to the corresponding aminoaldehyde is reversible, allowing possible
further metabolic processing of the former. Whereas the iminium ion intermediates
of aliphatic tertiary amines are in equilibrium with carbinolamines that dissociate to
aldehyde and secondary amine (i.e. via the N-dealkylation metabolic pathway),
carbinolamine dissociation remains reversible for cyclic tertiary amines, increasing
the effective lifetime of the iminium ion species. Endocyclic iminium ion
intermediates are often oxidized by hepatic aldehyde oxidase to the biologically less
active lactams. If special structural features are present in the substrate molecule or
if the cyclic iminium ion intermediate is generated in extrahepatic tissue lacking
aldehyde oxidase, these reactive intermediates may undergo alternative chemical
transformations that can produce toxic products (Figure 3.7).70
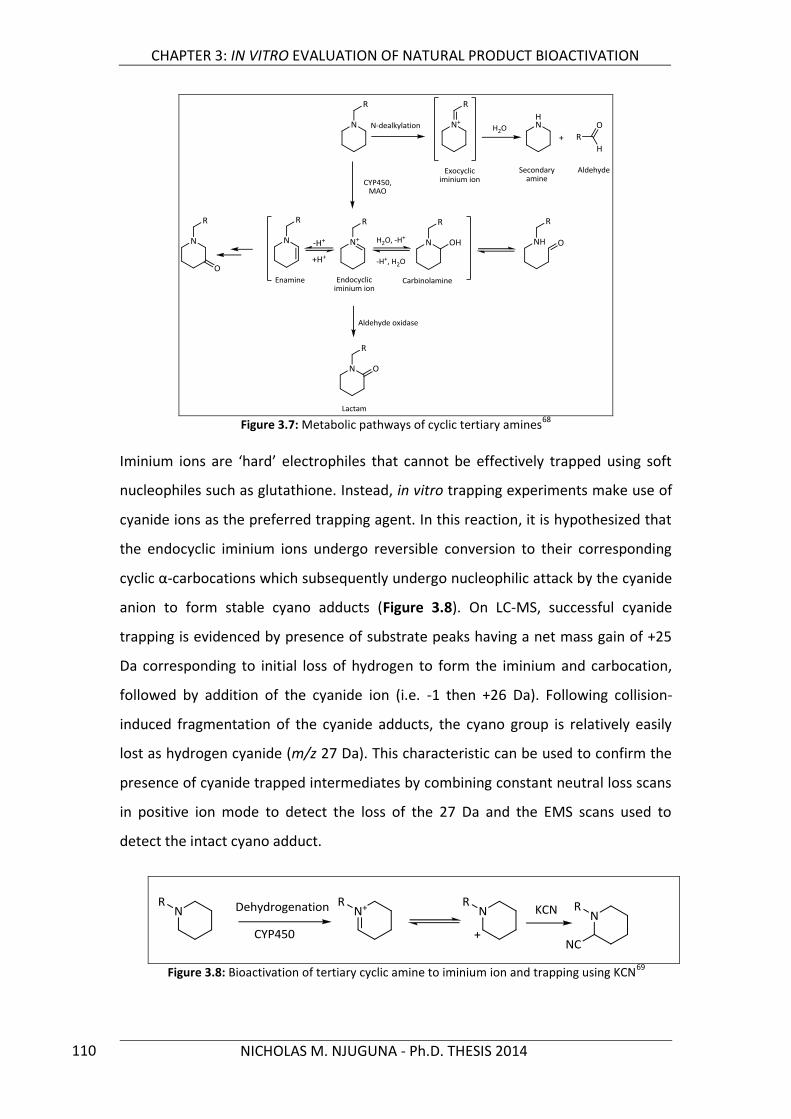
CHAPTER 3: IN VITRO EVALUATION OF NATURAL PRODUCT BIOACTIVATION
NICHOLAS M. NJUGUNA - Ph.D. THESIS 2014
110
Figure 3.7: Metabolic pathways of cyclic tertiary amines
68
Iminium ions are ‘hard’ electrophiles that cannot be effectively trapped using soft
nucleophiles such as glutathione. Instead, in vitro trapping experiments make use of
cyanide ions as the preferred trapping agent. In this reaction, it is hypothesized that
the endocyclic iminium ions undergo reversible conversion to their corresponding
cyclic α-carbocations which subsequently undergo nucleophilic attack by the cyanide
anion to form stable cyano adducts (Figure 3.8). On LC-MS, successful cyanide
trapping is evidenced by presence of substrate peaks having a net mass gain of +25
Da corresponding to initial loss of hydrogen to form the iminium and carbocation,
followed by addition of the cyanide ion (i.e. -1 then +26 Da). Following collision-
induced fragmentation of the cyanide adducts, the cyano group is relatively easily
lost as hydrogen cyanide (m/z 27 Da). This characteristic can be used to confirm the
presence of cyanide trapped intermediates by combining constant neutral loss scans
in positive ion mode to detect the loss of the 27 Da and the EMS scans used to
detect the intact cyano adduct.
Figure 3.8: Bioactivation of tertiary cyclic amine to iminium ion and trapping using KCN69

CHAPTER 3: IN VITRO EVALUATION OF NATURAL PRODUCT BIOACTIVATION
NICHOLAS M. NJUGUNA - Ph.D. THESIS 2014
111
The drug rimonabant was used as a positive control to confirm that reactive iminium
intermediates could be trapped and detected using LC-MS as reported in the
literature.68 Rimonabant was incubated in both human (HLM) and rat liver
microsomes (RLM) fortified with KCN to capture the iminium ion arising from
suspected bioactivation of the tertiary N-atom in the piperidine ring (Figure 3.9).
Figure 3.9: Hypothesized bioactivation of rimonabant and subsequent trapping of reactive intermediate using KCN
In the RLM test incubation (Figure 3.10 and 3.11), extracted ion chromatograms
(XIC) from the LC-MS EMS data generated clearly showed the presence of two
distinct adduct peaks corresponding to mass shifts of +25 and +41 greater than the
m/z value of the parent rimonabant (MH+ 463.1) and both eluting before the parent
compound.
Figure 3.10: XIC of T0 rimonabant incubation in presence of RLM fortified with KCN. As expected, no obvious degradation or metabolite peaks are observed in this incubation which illustrates compounds present at the start of the trapping experiment.

CHAPTER 3: IN VITRO EVALUATION OF NATURAL PRODUCT BIOACTIVATION
NICHOLAS M. NJUGUNA - Ph.D. THESIS 2014
112
Figure 3.11: XIC of rimonabant incubation in presence of RLM fortified with KCN after 60 min (T60) indicating presence of two suspected cyanide adduct peaks
The peak having m/z 488.2 was suspected to be the direct cyanide adduct of the
parent, especially since its fragmentation pattern was identical to that of rimonabant
with the sole exception of a mass spectral signal corresponding to the protonated
molecular ion at 488.2 not present in the parent. The peak with m/z 504.1 was
suspected to be the cyanide adduct of the oxidized rimonabant resulting in the net
mass gain of +41 (i.e. +16 then +25).
In the HLM incubations, only the adduct peak corresponding to m/z 488.2 was
detected, with no sign of the (suspected) oxidized rimonabant cyanide peak (Figure
3.12). This variance was attributed to differences in the CYP450 composition of the
HLM and RLM enzyme systems and suggested that perhaps rimonabant is preferably
metabolized to reactive intermediates by an isoform of the CYPs that is more
abundant/active in RLMs compared to HLMs.
Figure 3.12: XIC of rimonabant incubation in HLM fortified with KCN after 60 min indicating presence of single suspected cyanide adduct peak (MH
+m/z 488.1)
Further proof that the peak with m/z 488.2 was a cyanide adduct was provided by
the fact that fragmentation of the compound afforded a distinct loss of 27 Da as

CHAPTER 3: IN VITRO EVALUATION OF NATURAL PRODUCT BIOACTIVATION
NICHOLAS M. NJUGUNA - Ph.D. THESIS 2014
113
revealed from its enhanced product ion (EPI) spectrum, consistent with collision
induced loss of neutral hydrogen cyanide (Figure 3.13).
Figure 3.13: EPI spectrum of suspected cyanide-trapped reactive rimonabant metabolite showing fragmentation involving loss of 27 Da hydrogen cyanide molecule.
Metergoline was the only one of the test compounds that possessed a tertiary cyclic
amine that could potentially undergo bioactivation to form a reactive iminium
intermediate (Figure 3.14). The compound also contained a second structural alert in
the form of a masked 3-methylindole moiety commonly implicated in the formation
of reactive epoxide, iminium or quinone imine intermediates.2 To trap potential
reactive iminium metabolites, KCN fortified trapping incubations were carried out on
metergoline as performed on rimonabant in both RLM and HLM.
Figure 3.14: Metergoline with structural alerts circled
Contrary to the findings with rimonabant, incubation of metergoline in KCN fortified
microsomes did not appear to result in the formation of cyanide trapped reactive
metabolic intermediates. The 60 minute (T60) test incubation of metergoline in
HLM+KCN revealed only the presence of the same compound/metabolite peaks as
observed in the control incubation devoid of KCN (Figure 3.15).

CHAPTER 3: IN VITRO EVALUATION OF NATURAL PRODUCT BIOACTIVATION
NICHOLAS M. NJUGUNA - Ph.D. THESIS 2014
114
Figure 3.15: XIC of T60 incubation of metergoline in KCN fortified HLMs indicating presence of metabolite peaks but no obvious cyanide adducts.
The main peak observed at retention time 5.82 min had m/z 420.2 corresponding to
a direct mono-oxidation of the parent (MH+ 404.2) which eluted at 6.54 min. Two
other peaks were observed and suspected to represent minor metabolites of
metergoline at m/z 418.2 (Rt 6.11 min) corresponding to a direct mono-oxidation
possibly resulting in formation of a keto-group, and m/z 390.2 (Rt 6.47 min) thought
to represent an N-demethylated metabolite. No peak appeared to result from the
parent metergoline or any of the observed metabolites gaining 25 Da.
3.6.2 Trapping Reactive Metabolites Using Glutathione
Reduced L-glutathione (GSH) is the most commonly used in vitro reactive metabolite
trapping agent. Its utility is based on the fact that in vivo this endogenous tripeptide
(-L-glutamyl-cysteinyl-glycine) serves as a potent scavenger of reactive electrophilic
species and toxic free radicals and acts as a crucial substrate for detoxification
reactions. In the body, glutathione exists in both its reduced and oxidized forms
(Figure 3.16) with the former being predominant and present in virtually all tissues
at fairly high concentrations especially in the liver (5 - 10 mM).71

CHAPTER 3: IN VITRO EVALUATION OF NATURAL PRODUCT BIOACTIVATION
NICHOLAS M. NJUGUNA - Ph.D. THESIS 2014
115
Figure 3.16: Reduced and oxidized forms of glutathione
Glutathione serves as a substrate for Phase II metabolic conjugations catalyzed by
the enzyme glutathione-S-transferase. In addition, however, GSH readily forms
conjugates with soft electrophilic species spontaneously even in the absence of the
conjugating enzyme. In the body, such conjugates may be directly excreted into
urine or bile, or undergo further biotransformation to recycle the amino acid
residues glutamic acid and glycine before forming mercapturic acid metabolites of
the original substrates which are then excreted (Figure 3.17).
Figure 3.17: Role of GSH in detoxification of reactive metabolites in vivo and the biochemical fate of
resultant GSH conjugates
GSH-fortified microsome in vitro trapping experiments were conducted on test
compounds to determine if they might undergo bioactivation to ‘soft’ electrophilic
reactive metabolites. As a positive control, the antimalarial drug amodiaquine was

CHAPTER 3: IN VITRO EVALUATION OF NATURAL PRODUCT BIOACTIVATION
NICHOLAS M. NJUGUNA - Ph.D. THESIS 2014
116
used due to its reported bioactivation to a reactive quinone imine metabolite (Figure
3.18).72
Figure 3.18: Major metabolites of amodiaquine and GSH trapping of reactive quinone imine intermediate
For LC-MS detection of GSH adducts, full survey EMS scans in either positive or
negative modes were conducted as the primary detection mode and where
necessary, followed by precursor ion scans for the parents of the m/z 272 Da
fragment in –ve ion mode, for confirmation. In the EMS scans, direct GSH conjugates
would be observed as substrate or metabolite peaks with a net mass gain of +305 Da
(+/- H+ depending on polarity). Loss of the 272 Da fragment - a characteristic of GSH
adducts, would provide further confirmation of the presence of the conjugates.73
Constant neutral loss scans for peaks that showed a loss of 129 Da in positive ion
mode also provided alternative proof of the presence of glutathione adducts. The
origin of these characteristic glutathione fragments is illustrated in Figure 3.19.

CHAPTER 3: IN VITRO EVALUATION OF NATURAL PRODUCT BIOACTIVATION
NICHOLAS M. NJUGUNA - Ph.D. THESIS 2014
117
Figure 3.19: Detection of GSH adducts and characteristic fragments using different MS scanning modes
On the full survey EMS scans in both +ve and –ve ion mode, residual parent
amodiaquine and its two main metabolites could be clearly observed as distinct
peaks in the T60 incubation (Figure 3.20).
Figure 3.20: XIC +ve ion mode EMS of T60 aliquot of amodiaquine incubated with GSH fortified RLM
Whereas the expected amodiaquine-GSH conjugate was not observed in the +ve
mode, it was distinctly visible in –ve ion mode at Rt 5.52 min albeit appearing to co-
elute with the desethylamodiaquine peak (Figure 3.21).

CHAPTER 3: IN VITRO EVALUATION OF NATURAL PRODUCT BIOACTIVATION
NICHOLAS M. NJUGUNA - Ph.D. THESIS 2014
118
Figure 3.21: XIC of -ve mode EMS of T60 amodiaquine incubation in GSH fortified RLMs indicating presence of GSH-conjugate co-eluting with desethylamodiaquine
Further proof that the peak at Rt 5.52 min was most likely that of a GSH-trapped
conjugate was provided by re-analyzing the sample and detecting using a precursor
ion scan of the 272 Da fragment in –ve ion mode (Figure 3.22).
Figure 3.22: TIC of -ve ion mode precursor ion scan of m/z 272 Da fragment of T60 amodiaquine incubation in GSH fortified RLMs
Constant neutral loss scans to detect the loss of a neutral 129 Da pyroglutamic acid
fragment characteristic of glutathione-conjugated substrates did not yield conclusive
data. The LC-MS peaks generated in this scan mode had very low intensity and could
not be well distinguished from the baseline. By contrast, the PI scans in -ve ion mode
were noted to have less noisy baseline signals owing to the fact that few compounds
would be expected to form negatively charged ions under the analysis conditions
used. Based on the observations from amodiaquine incubations, LC-MS detection for
the subsequent test compounds for reactive metabolite trapping using GSH was
conducted using +ve and/or –ve mode EMS scans followed by –ve mode PI scans for
the m/z 272 fragment or +ve mode CNL scans of m/z 129.

CHAPTER 3: IN VITRO EVALUATION OF NATURAL PRODUCT BIOACTIVATION
NICHOLAS M. NJUGUNA - Ph.D. THESIS 2014
119
Eleven compounds were incubated in human liver microsomes (mixed gender,
pooled from 50 individuals) to determine their bioactivation to reactive metabolites
and subsequent trapping with glutathione. The general incubation and LC-MS
detection strategy employed with amodiaquine was used to analyze the incubation
samples. A summary of the main diagnostic peaks detected for each sample with
their corresponding m/z values and the conclusion drawn from LC-MS data is
outlined in Table 3.2.
Table 3.2: Main diagnostic LC-MS peaks observed to determine presence of GSH trapped reactive metabolites
Monoisotopic
mass Detection mode: Main Peaks (m/z)
Comment
Gedunin 482.23 ESI+: 483.2 No GSH-adduct observed
Metergoline 403.23 ESI+: 404.2; 420.2; 418.2; 390.2 No GSH-adduct observed
DC3 352.22 ESI+: 353.3 No GSH-adduct observed
DC14 316.20 ESI+: 317.1 No GSH-adduct observed
Justicidin A 394.11 ESI+: 394.8 No GSH-adduct observed
Jamaicin 378.11 ESI+: 379.6 No GSH-adduct observed
SQTL 244.11 ESI+: 245.2 (See below)
CLPG 334.12 ESI+: 335.8 No GSH-adduct observed
Formononetin 268.07 ESI-: 266.8 No GSH-adduct observed
Fusidic acid 516.35 ESI-: 515.3; 513.1 No GSH-adduct observed
Cuc-B 558.32 ESI+: 499.4; 866.3 (See below)
Muzigadial 248.14 - (See below)
Muzi-04 305.17 - (See below)
Although the tested compounds all possessed structural alerts that were anticipated
to undergo bioactivation to reactive species, none appeared to form intermediates
that could be detected as GSH conjugates using the LC-MS detection modes
established using amodiaquine which was used as the positive control in all assays.
The results from incubations of SQTL and CUC-B were particularly interesting,
however. Analysis of SQTL samples at the beginning of the incubation (Figure 3.23)
clearly indicated the presence of the unmetabolized parent before addition of

CHAPTER 3: IN VITRO EVALUATION OF NATURAL PRODUCT BIOACTIVATION
NICHOLAS M. NJUGUNA - Ph.D. THESIS 2014
120
NADPH to initiate the metabolic reaction as a peak eluting at Rt 6.88 min (ESI + MH+
m/z 245.2).
Figure 3.23: XIC of SQTL peak only observed in incubation preparations devoid of GSH but absent in all incubations in which GSH was present
The SQTL peak was, however, completely absent in all subsequent incubations to
which GSH was present regardless of whether microsomes, NADPH or even
acetonitrile had been added to quench the incubation beforehand. This
phenomenon pointed towards the likelihood that SQTL was reactive enough even in
its unmetabolized form to react with the trapping agent (GSH). The possibility that
the SQTL peak disappeared owing to the compound being an unstable lactone that
rapidly undergoes hydrolysis in aqueous medium was ruled out by the fact that scans
to detect the hypothesized hydrolysis product were unsuccessful. Furthermore,
when SQTL was incubated on its own in aqueous buffer devoid of microsomal
proteins, NADPH or GSH for 90 minutes at 37 °C, the compound was easily
detectable at virtually the same intensity as fresh solutions. However, although all
the evidence pointed to a metabolism-independent reaction taking place between
SQTL and GSH, the resultant product could not be detected on LC-MS.
In the case of CUC-B, all incubation preparations in which GSH was present appeared
to form adducts corresponding to a direct reaction between the substrate and GSH.
The reaction appeared to be independent of enzymatic involvement and took place
even in the absence of microsomal proteins. Unlike the case with SQTL, the
suspected GSH adduct peaks were easily detected on LC-MS EMS scans and
fragmentation data from EPI scans confirmed the presence of fragments commonly
associated with glutathione adducts.
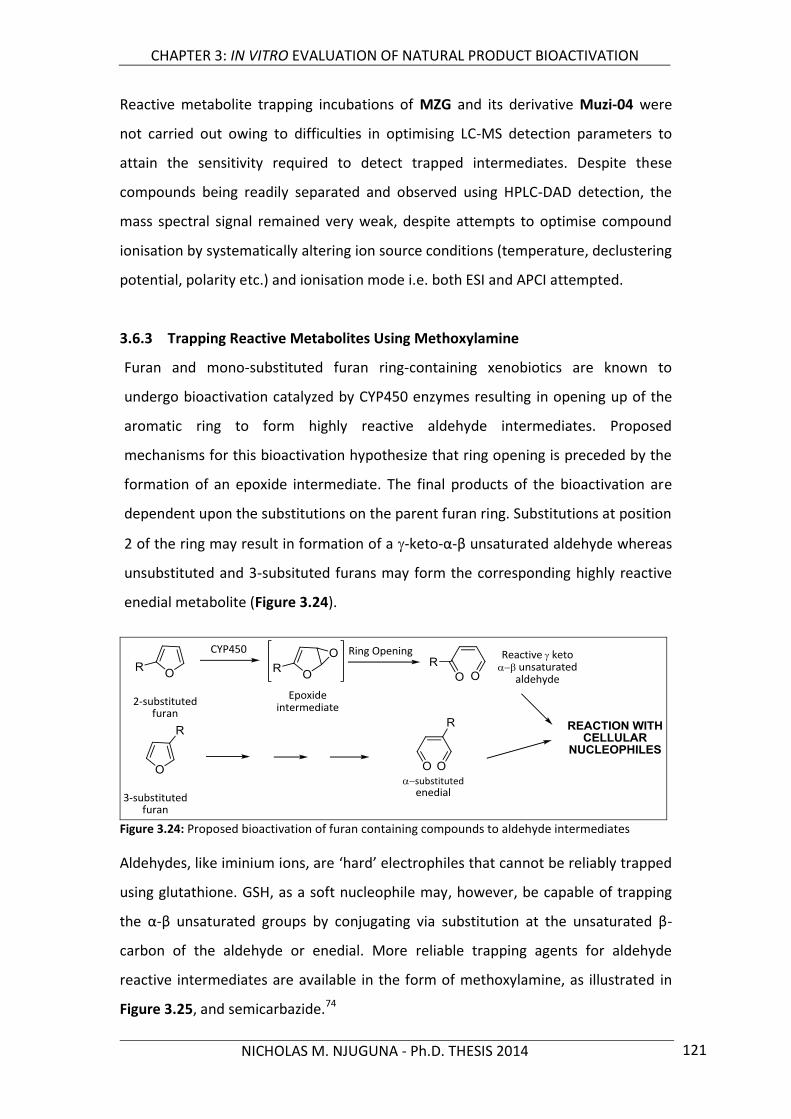
CHAPTER 3: IN VITRO EVALUATION OF NATURAL PRODUCT BIOACTIVATION
NICHOLAS M. NJUGUNA - Ph.D. THESIS 2014
121
Reactive metabolite trapping incubations of MZG and its derivative Muzi-04 were
not carried out owing to difficulties in optimising LC-MS detection parameters to
attain the sensitivity required to detect trapped intermediates. Despite these
compounds being readily separated and observed using HPLC-DAD detection, the
mass spectral signal remained very weak, despite attempts to optimise compound
ionisation by systematically altering ion source conditions (temperature, declustering
potential, polarity etc.) and ionisation mode i.e. both ESI and APCI attempted.
3.6.3 Trapping Reactive Metabolites Using Methoxylamine
Furan and mono-substituted furan ring-containing xenobiotics are known to
undergo bioactivation catalyzed by CYP450 enzymes resulting in opening up of the
aromatic ring to form highly reactive aldehyde intermediates. Proposed
mechanisms for this bioactivation hypothesize that ring opening is preceded by the
formation of an epoxide intermediate. The final products of the bioactivation are
dependent upon the substitutions on the parent furan ring. Substitutions at position
2 of the ring may result in formation of a -keto-α-β unsaturated aldehyde whereas
unsubstituted and 3-subsituted furans may form the corresponding highly reactive
enedial metabolite (Figure 3.24).
Figure 3.24: Proposed bioactivation of furan containing compounds to aldehyde intermediates
Aldehydes, like iminium ions, are ‘hard’ electrophiles that cannot be reliably trapped
using glutathione. GSH, as a soft nucleophile may, however, be capable of trapping
the α-β unsaturated groups by conjugating via substitution at the unsaturated β-
carbon of the aldehyde or enedial. More reliable trapping agents for aldehyde
reactive intermediates are available in the form of methoxylamine, as illustrated in
Figure 3.25, and semicarbazide.74

CHAPTER 3: IN VITRO EVALUATION OF NATURAL PRODUCT BIOACTIVATION
NICHOLAS M. NJUGUNA - Ph.D. THESIS 2014
122
Figure 3.25: Trapping furan-derived aldehyde reactive intermediates using methoxylamine
Prazosin was used as the positive control to demonstrate bioactivation and
detectable trapping of aldehyde intermediate thus formed using methoxylamine.
The reported bioactivation of the furan ring in prazosin and its subsequent trapping
is illustrated in Figure 3.26.
Figure 3.26: Bioactivation of furan ring in prazosin and trapping of aldehyde intermediate using methoxylamine
On LC-MS analysis of the incubation samples, successful trapping of the reactive
aldehyde intermediates would be suspected from the presence of peaks
corresponding to test substrates with a net mass gain of +45 or +74 on the EMS
scans. These shifts in mass values were due to the initial oxidation of the furan ring
to first form the short-lived epoxide and subsequently the ring opened aldehyde
susceptible to methoxylamine addition that formed the O-methyl oxime species
detected.
The test incubations of prazosin containing pooled, mixed gender human or male rat
liver microsomes, cofactor and trapping agent (methoxylamine) indicated the
presence of a peak with the +45 mass gain not present in any of the control
incubations in which one of these components was absent. Additionally, +ve mode
EMS XICs revealed the presence of known metabolites of prazosin as reported in
literature in the test incubation as well as in control incubation in which only
trapping agent was absent (Figure 3.27 and 3.28).75

CHAPTER 3: IN VITRO EVALUATION OF NATURAL PRODUCT BIOACTIVATION
NICHOLAS M. NJUGUNA - Ph.D. THESIS 2014
123
Figure 3.27: Prazosin and some of its known metabolites detected from trapping incubations
Figure 3.28: XIC of +ve ion mode EMS of T60 incubation of prazosin in methoxylamine fortified RLM. The peak labeled ‘unknown component’ was unrelated to prazosin and present in all the incubation preparations
Only the three compounds previously incubated with GSH containing furan rings in
their structures (i.e. GEDN, DC3 and DC14) were further tested for reactive aldehyde
metabolic intermediate trapping using methoxylamine. Evidence of successful
trapping of the aldehyde from furan ring bioactivation was provided by +ve mode
EMS scans which showed peaks having the expected mass shifts of +45 or +74.
Fragmentation of such components, if present, on subsequent EPI scans to lose 32
Da from the loss of neutral methanol molecule from the O-methyl oxime portion of
the trapped adduct was considered further proof of successful trapping.
Chromatograms of T60 test incubations of GEDN indicated two peaks (Rt 7.36 min
and 8.46 min) with a mass gain of +45 and one with a shift of +74 (Rt 9.00 min)from
the parent (Rt 8.57 min) but absent in the control incubations. Of the two m/z +45
peaks, only the later eluting component at 8.46 min was intense enough to allow for
controlled fragmentation and indicated the loss of a 32 Da fragment, strongly
suggesting that it might represent a methoxylamine trapped aldehyde (Figure 3.29
and Figure 3.30).

CHAPTER 3: IN VITRO EVALUATION OF NATURAL PRODUCT BIOACTIVATION
NICHOLAS M. NJUGUNA - Ph.D. THESIS 2014
124
The peak suspected to represent a di-methoxylamine substituted adduct could not
be confirmed to be such due to its low intensity and the fact that it appeared to co-
elute with a much more intense component (m/z 577) present as an artefact in all
the incubated samples.
Figure 3.29: XICs of T60 GEDN incubation in methoxylamine fortified microsomes showing suspected trapped metabolites
Figure 3.30: Enhanced mass spectrum of peak in T60 GEDN incubation eluting at 8.46 min showing loss of 32 Da fragment from suspected methoxylamine trapped metabolite (MH
+ m/z 528.0)
Compound DC14 did not appear to form any reactive intermediates trapped using
methoxylamine since no conjugate peaks on the EMS scans showed a m/z net gain of
+45 or +74.
Compound DC3 on the other hand appeared to be metabolized to a reactive
intermediate trapped by methoxylamine and exhibited a very distinct m/z +45
adduct peak at Rt 5.34 min from the T60 incubation sample (Figure 3.31). Proof that
this peak represented a distinct compound was the fact that apart from forming the
H+ adduct, it also formed both the Na+ (m/z 420.2) and K+ (m/z 436.2) adducts and
was well resolved from the parent peak which eluted at Rt 6.74 min.
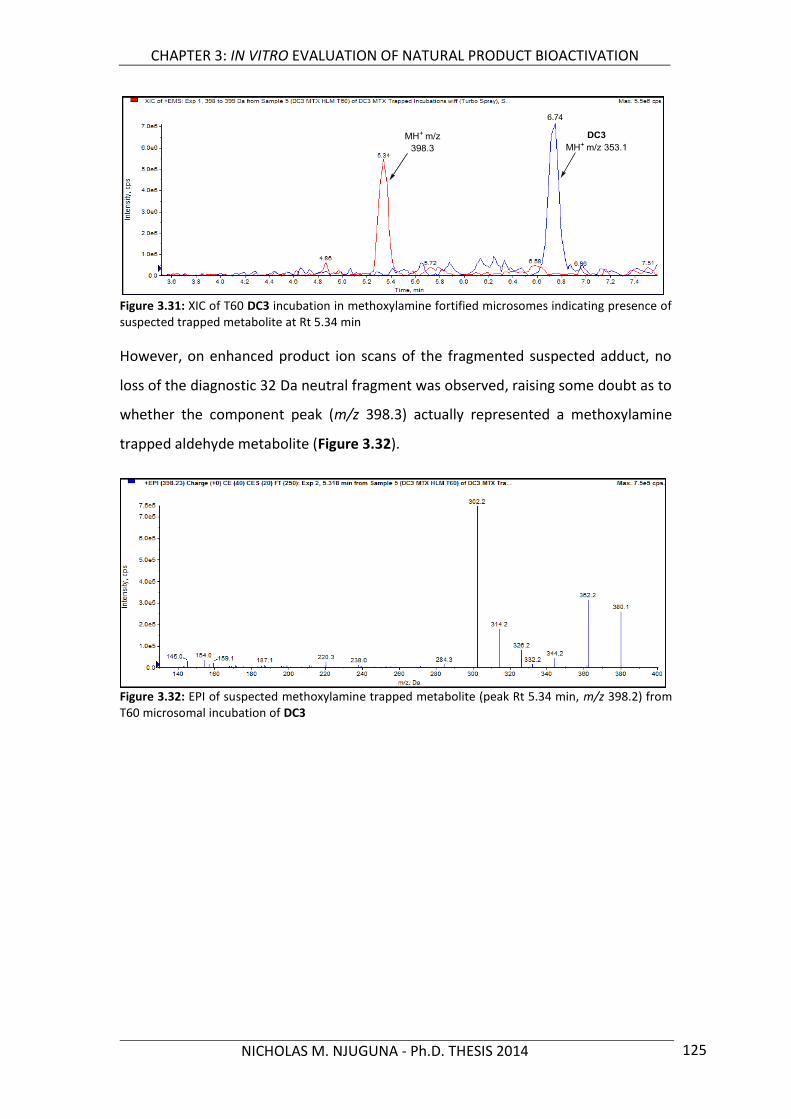
CHAPTER 3: IN VITRO EVALUATION OF NATURAL PRODUCT BIOACTIVATION
NICHOLAS M. NJUGUNA - Ph.D. THESIS 2014
125
Figure 3.31: XIC of T60 DC3 incubation in methoxylamine fortified microsomes indicating presence of suspected trapped metabolite at Rt 5.34 min
However, on enhanced product ion scans of the fragmented suspected adduct, no
loss of the diagnostic 32 Da neutral fragment was observed, raising some doubt as to
whether the component peak (m/z 398.3) actually represented a methoxylamine
trapped aldehyde metabolite (Figure 3.32).
Figure 3.32: EPI of suspected methoxylamine trapped metabolite (peak Rt 5.34 min, m/z 398.2) from T60 microsomal incubation of DC3

CHAPTER 3: IN VITRO EVALUATION OF NATURAL PRODUCT BIOACTIVATION
NICHOLAS M. NJUGUNA - Ph.D. THESIS 2014
126
3.7 Conclusion
A set of natural products and selected semi-synthetic compounds were evaluated for
clinical drug-drug interaction risk and in vitro metabolic bioactivation using both
CYP450 inhibition assays and reactive metabolite trapping experiments. Of the 4
main drug metabolizing enzymes tested, CYP3A4 was found to be the most
susceptible to inhibition by a majority of the compounds. Time-dependent inhibition
assays on the most potent inhibitor compounds of this isoform, however, suggested
that none appeared to be a mechanism-based enzyme inhibitor.
Data from the reactive metabolite trapping experiments revealed that two of the
eleven compounds tested (i.e. DC3 and to a lesser extent GEDN) seemed to form
detectable trapped metabolic intermediates using methoxylamine. On the other
hand, no detectable enzymatically-mediated trapped intermediates from any of the
compounds were observed when either reduced glutathione or potassium cyanide
was employed as the trapping agent. CUC-B was observed to form detectable GSH
adducts even in the absence of microsomal protein or co-factors, suggesting direct
reactivity of this compound with GSH. It was postulated that the adduct might arise
from a direct Michael-addition reaction involving the thiol group of GSH and the α,β-
unsaturated ketone on the side chain of CUC-B in a reaction that did not require
enzymatic catalysis.

CHAPTER 3: IN VITRO EVALUATION OF NATURAL PRODUCT BIOACTIVATION
NICHOLAS M. NJUGUNA - Ph.D. THESIS 2014
127
REFERENCES:
(1) Park, K.; Williams, D. P.; Naisbitt, D. J.; Kitteringham, N. R.; Pirmohamed, M.
Investigation of Toxic Metabolites during Drug Development. Toxicology and
Applied Pharmacology 2005, 207, 425–434.
(2) Edwards, P. J.; Sturino, C. Managing the Liabilities Arising from Structural
Alerts: A Safe Philosophy for Medicinal Chemists. Current Medicinal Chemistry
2011, 18, 3116–3135.
(3) Kalgutkar, A. S. Handling Reactive Metabolite Positives in Drug Discovery:
What Has Retrospective Structure-Toxicity Analyses Taught Us? Chemico-
Biological Interactions 2011, 192, 46–55.
(4) Stepan, A. F.; Walker, D. P.; Bauman, J. N.; Price, D. A.; Baillie, T. A.; Kalgutkar,
A. S.; Aleo, M. D. Structural Alert/reactive Metabolite Concept as Applied in
Medicinal Chemistry to Mitigate the Risk of Idiosyncratic Drug Toxicity: A
Perspective Based on the Critical Examination of Trends in the Top 200 Drugs
Marketed in the United States. Chemical Research in Toxicology 2011, 24,
1345–1410.
(5) Shu, Y.-Z.; Johnson, B. M.; Yang, T. J. Role of Biotransformation Studies in
Minimizing Metabolism-Related Liabilities in Drug Discovery. The AAPS Journal
2008, 10, 178–192.
(6) Yan, Z.; Maher, N.; Torres, R.; Caldwell, G. W.; Huebert, N. Rapid Detection
and Characterization of Minor Reactive Metabolites Using Stable-Isotope
Trapping in Combination with Tandem Mass Spectrometry. Rapid
Communications in Mass Spectrometry 2005, 19, 3322–3330.
(7) Ma, S.; Zhu, M. Recent Advances in Applications of Liquid Chromatography-
Tandem Mass Spectrometry to the Analysis of Reactive Drug Metabolites.
Chemico-Biological Interactions 2009, 179, 25–37.
(8) Tolonen, A.; Turpeinen, M.; Pelkonen, O. Liquid Chromatography-Mass
Spectrometry in in Vitro Drug Metabolite Screening. Drug Discovery Today
2009, 14, 120–133.

CHAPTER 3: IN VITRO EVALUATION OF NATURAL PRODUCT BIOACTIVATION
NICHOLAS M. NJUGUNA - Ph.D. THESIS 2014
128
(9) Tan, Q.; Luo, X. Meliaceous Limonoids: Chemistry and Biological Activities.
Chemical Reviews 2011, 111, 7437–7522.
(10) MacKinnon, S.; Durst, T.; Arnason, J. T.; Angerhofer, C.; Pezzuto, J.; Sanchez-
Vindas, P. E.; Poveda, L. J.; Gbeassor, M. Antimalarial Activity of Tropical
Meliaceae Extracts and Gedunin Derivatives. Journal of Natural Products
1997, 60, 336–341.
(11) Khalid, S. A.; Duddeck, H.; Gonzalez-Sierra, M. Isolation and Characterization
of an Antimalarial Agent of the Neem Tree Azadirachta Indica. Journal of
Natural Products 1989, 52, 922–927.
(12) Chianese, G.; Yerbanga, S. R.; Lucantoni, L.; Habluetzel, A.; Basilico, N.;
Taramelli, D.; Fattorusso, E.; Taglialatela-Scafati, O. Antiplasmodial
Triterpenoids from the Fruits of Neem, Azadirachta Indica. Journal of Natural
Products 2010, 73, 1448–1452.
(13) Uddin, S. J.; Nahar, L.; Shilpi, J. A.; Shoeb, M.; Borkowski, T.; Gibbons, S.;
Middleton, M.; Byres, M.; Sarker, S. D. Gedunin, a Limonoid from Xylocarpus
Granatum, Inhibits the Growth of CaCo-2 Colon Cancer Cell Line in Vitro.
Phytotherapy Research 2007, 21, 757–761.
(14) Brandt, G. E. L.; Schmidt, M. D.; Prisinzano, T. E.; Blagg, B. S. J. Gedunin, a
Novel hsp90 Inhibitor: Semisynthesis of Derivatives and Preliminary Structure-
Activity Relationships. Journal of Medicinal Chemistry 2008, 51, 6495–6502.
(15) Lakshmi, V.; Singh, N.; Shrivastva, S.; Mishra, S. K.; Dharmani, P.; Mishra, V.;
Palit, G. Gedunin and Photogedunin of Xylocarpus Granatum Show Significant
Anti-Secretory Effects and Protect the Gastric Mucosa of Peptic Ulcer in Rats.
Phytomedicine 2010, 17, 569–574.
(16) Fukamiya, N.; Lee, K.-H. Antitumor Agents, 81. Justicidin-A and Diphyllin, Two
Cytotoxic Principles from Justicia Procumbens. Journal of Natural Products
1986, 49, 348–350.

CHAPTER 3: IN VITRO EVALUATION OF NATURAL PRODUCT BIOACTIVATION
NICHOLAS M. NJUGUNA - Ph.D. THESIS 2014
129
(17) Chen, C.-C.; Hsin, W.-C.; Ko, F.-N.; Huang, Y.-L.; Ou, J.-C.; Teng, C.-M.
Antiplatelet Arylnaphthalide Lignans from Justicia Procumbens. Journal of
Natural Products 1996, 59, 1149–1150.
(18) Asano, J.; Chiba, K.; Tada, M.; Yoshii, T. Antiviral Activity of Lignans and Their
Glycosides from Justicia Procumbens. Phytochemistry 1996, 42, 713–717.
(19) Day, S.-H.; Lin, Y.-C.; Tsai, M.-L.; Tsao, L.-T.; Ko, H.-H.; Chung, M.-I.; Lee, J.-C.;
Wang, J.-P.; Won, S.-J.; Lin, C.-N. Potent Cytotoxic Lignans from Justicia P
Rocumbens and Their Effects on Nitric Oxide and Tumor Necrosis Factor-Α
Production in Mouse Macrophages. Journal of Natural Products 2002, 65,
379–381.
(20) Lee, J.-C.; Lee, C.-H.; Su, C.-L.; Huang, C.-W.; Liu, H.-S.; Lin, C.-N.; Won, S.-J.
Justicidin A Decreases the Level of Cytosolic Ku70 Leading to Apoptosis in
Human Colorectal Cancer Cells. Carcinogenesis 2005, 26, 1716–1730.
(21) Su, C.-L.; Huang, L. L. H.; Huang, L.-M.; Lee, J.-C.; Lin, C.-N.; Won, S.-J. Caspase-
8 Acts as a Key Upstream Executor of Mitochondria during Justicidin A-
Induced Apoptosis in Human Hepatoma Cells. FEBS Letters 2006, 580, 3185–
3191.
(22) Fouche, G.; Khorombi, E.; Maharaj, V. J. Treatment of Erectile Dysfunction and
Libido Enhancement. US 8,609,151 B2, 2013.
(23) Bohlmann, F.; Zdero, C. Sesquiterpene Lactones from Brachylaena Species.
Phytochemistry 1982, 21, 647–651.
(24) Higuchi, Y.; Shimoma, F.; Koyanagi, R.; Suda, K.; Mitsui, T.; Kataoka, T.; Nagai,
K.; Ando, M. Synthetic Approach to Exo-Endo Cross-Conjugated
Cyclohexadienones and Its Application to the Syntheses of
Dehydrobrachylaenolide, Isodehydrochamaecynone, and Trans-
Isodehydrochamaecynone. Journal of Natural Products 2003, 66, 588–594.
(25) Rademeyer, M.; van Heerden, F. R.; van der Merwe, M. M. Dehydro-
Brachylaenolide: An Eudesmane-Type Sesquiterpene Lactone. Acta
Crystallographica 2008, 65, o196.

CHAPTER 3: IN VITRO EVALUATION OF NATURAL PRODUCT BIOACTIVATION
NICHOLAS M. NJUGUNA - Ph.D. THESIS 2014
130
(26) Shale, T. L.; Stirk, W. A.; Staden, J. Van. Screening of Medicinal Plants Used in
Lesotho for Anti-Bacterial and Anti-Inflammatory Activity. Journal of
Ethnopharmacology 1999, 67, 347–354.
(27) Steenkamp, V.; Mathivha, E.; Gouws, M. C.; van Rensburg, C. E. J. Studies on
Antibacterial, Antioxidant and Fibroblast Growth Stimulation of Wound
Healing Remedies from South Africa. Journal of Ethnopharmacology 2004, 95,
353–357.
(28) Semenya, S. S.; Maroyi, A. Medicinal Plants Used by the Bapedi Traditional
Healers to Treat Diarrhoea in the Limpopo Province, South Africa. Journal of
Ethnopharmacology 2012, 144, 395–401.
(29) Becker, J. V. W.; van der Merwe, M. M.; van Brummelen, A. C.; Pillay, P.;
Crampton, B. G.; Mmutlane, E. M.; Parkinson, C.; van Heerden, F. R.; Crouch,
N. R.; Smith, P. J.; Mancama, D. T.; Maharaj, V. J. In Vitro Anti-Plasmodial
Activity of Dicoma Anomala Subsp. Gerrardii (Asteraceae): Identification of Its
Main Active Constituent, Structure-Activity Relationship Studies and Gene
Expression Profiling. Malaria Journal 2011, 10, 295.
(30) Lee, M. R. The History of Ergot of Rye (Claviceps Purpurea) II: 1900–1940. The
Journal of the Royal College of Physicians of Edinburgh 2009, 39, 365–369.
(31) Beretta, C.; Ferrini, R.; Glasser, A. H. 1-Methyl-8 Β-Carbobenzyloxy-
Aminomethyl-10 Α-Ergoline, a Potent and Long-Lasting 5-Hydroxytryptamine
Antagonist. Nature 1965, 207, 421–422.
(32) Kang, K.; Wong, K.-S.; Fong, W.-P.; Tsang, P. W.-K. Metergoline-Induced Cell
Death in Candida Krusei. Fungal Biology 2011, 115, 302–309.
(33) Ch’ng, J.-H.; Mok, S.; Bozdech, Z.; Lear, M. J.; Boudhar, A.; Russell, B.; Nosten,
F.; Tan, K. S.-W. A Whole Cell Pathway Screen Reveals Seven Novel
Chemosensitizers to Combat Chloroquine Resistant Malaria. Scientific Reports
2013, 3, 1734.
(34) Godtfredsen, W. O.; Roholt, K.; Tybring, L. FUCIDIN: A New Orally Active
Antibiotic. The Lancet 1962, 279, 928–931.

CHAPTER 3: IN VITRO EVALUATION OF NATURAL PRODUCT BIOACTIVATION
NICHOLAS M. NJUGUNA - Ph.D. THESIS 2014
131
(35) Turnidge, J. Fusidic Acid Pharmacology, Pharmacokinetics and
Pharmacodynamics. International Journal of Antimicrobial Agents 1999, 12,
S23–S34.
(36) Christiansen, K. Fusidic Acid Adverse Drug Reactions. International Journal of
Antimicrobial Agents 1999, 12 Suppl 2, S3–9.
(37) Fernandes, P.; Pereira, D. Efforts to Support the Development of Fusidic Acid
in the United States. Clinical Infectious Diseases 2011, 52, S542–6.
(38) Kubo, I.; Miura, I.; Pettei, M. J.; Lee, Y.-W.; Pilkiewicz, F.; Nakanishi, K.
Muzigadial and Warburganal, Potent Antifungal Antiyeast, and African Army
Worm Antifeedant Agents. Tetrahedron Letters 1977, 18, 4553–4556.
(39) Rabe, T.; van Staden, J. Isolation of an Antibacterial Sesquiterpenoid from
Warburgia Salutaris. Journal of Ethnopharmacology 2000, 73, 171–174.
(40) Drewes, S. E.; Crouch, N. R.; Mashimbye, M. J.; de Leeuw, B. M.; Horn, M. M.
A Phytochemical Basis for the Potential Use of Warburgia Salutaris (pepper-
Bark Tree) Leaves in Place of Bark. South African Journal of Science 2001, 97,
383–386.
(41) Maroyi, A. Warburgia Salutaris (Bertol. F.) Chiov.: A Multi-Use Ethnomedicinal
Plant Species. Journal of Medicinal Plants Research 2013, 7, 53–60.
(42) Jansen, B. J. M.; de Groot, A. The Occurrence and Biological Activity of
Drimane Sesquiterpenoids. Natural Product Reports 1991, 8, 309–318.
(43) Jansen, B. J. M.; de Groot, A. Occurrence, Biological Activity and Synthesis of
Drimane Sesquiterpenoids. Natural Product Reports 2004, 21, 449–477.
(44) Ying, B.-P.; Peiser, G.; Ji, Y.-Y.; Mathias, K.; Tutko, D.; Hwang, Y. Phytotoxic
Sesquiterpenoids from Canella Winterana. Phytochemistry 1995, 38, 909–915.
(45) Grace, M. H.; Lategan, C.; Mbeunkui, F.; Graziose, R.; Smith, P. J.; Raskin, I.;
Lila, M. A. Antiplasmodial and Cytotoxic Activities of Drimane Sesquiterpenes
from Canella Winterana. Natural Product Communications 2010, 5, 1869–
1872.

CHAPTER 3: IN VITRO EVALUATION OF NATURAL PRODUCT BIOACTIVATION
NICHOLAS M. NJUGUNA - Ph.D. THESIS 2014
132
(46) Chen, J. C.; Chiu, M. H.; Nie, R. L.; Cordell, G. A.; Qiu, S. X. Cucurbitacins and
Cucurbitane Glycosides: Structures and Biological Activities. Natural Product
Reports 2005, 22, 386–399.
(47) Lee, D. H.; Iwanski, G. B.; Thoennissen, N. H. Cucurbitacin: Ancient Compound
Shedding New Light on Cancer Treatment. The Scientific World Journal 2010,
10, 413–418.
(48) Liu, T.; Zhang, M.; Zhang, H.; Sun, C.; Deng, Y. Inhibitory Effects of
Cucurbitacin B on Laryngeal Squamous Cell Carcinoma. European Archives of
Otorhinolaryngology 2008, 265, 1225–1232.
(49) Chan, K. T.; Li, K.; Liu, S. L.; Chu, K. H.; Toh, M.; Xie, W. D. Cucurbitacin B
Inhibits STAT3 and the Raf/MEK/ERK Pathway in Leukemia Cell Line K562.
Cancer Letters 2010, 289, 46–52.
(50) Chan, K. T.; Meng, F. Y.; Li, Q.; Ho, C. Y.; Lam, T. S.; To, Y.; Lee, W. H.; Li, M.;
Chu, K. H.; Toh, M. Cucurbitacin B Induces Apoptosis and S Phase Cell Cycle
Arrest in BEL-7402 Human Hepatocellular Carcinoma Cells and Is Effective via
Oral Administration. Cancer Letters 2010, 294, 118–124.
(51) Haritunians, T.; Gueller, S.; Zhang, L.; Badr, R.; Yin, D.; Xing, H.; Fung, M. C.;
Koeffler, H. P. Cucurbitacin B Induces Differentiation, Cell Cycle Arrest, and
Actin Cytoskeletal Alterations in Myeloid Leukemia Cells. Leukemia Research
2008, 32, 1366–1373.
(52) Yin, D.; Wakimoto, N.; Xing, H.; Lu, D.; Huynh, T.; Wang, X.; Black, K. L.;
Koeffler, H. P. Cucurbitacin B Markedly Inhibits Growth and Rapidly Affects
the Cytoskeleton in Glioblastoma Multiforme. International Journal of Cancer
2008, 123, 1364–1375.
(53) Eagle, G. A.; Rivett, D. E. A. Diterpenoids of Leonotis Species. Part IV. Dubiin, a
Furanoid Labdane Derivative of L. Dubia E. Mey. Journal of the Chemical
Society, Perkin Transactions 1 1973, 16, 1701–1704.

CHAPTER 3: IN VITRO EVALUATION OF NATURAL PRODUCT BIOACTIVATION
NICHOLAS M. NJUGUNA - Ph.D. THESIS 2014
133
(54) Wu, H.; Li, J.; Fronczek, F. R.; Ferreira, D.; Burandt, C. L.; Setola, V.; Roth, B. L.;
Zjawiony, J. K. Phytochemistry Labdane Diterpenoids from Leonotis Leonurus.
Phytochemistry 2013, 91, 229–235.
(55) Moore, J. A.; Eng, S. Some New Constituents of Piscidia Erythrina L. Journal of
the American Chemical Society 1956, 78, 395–398.
(56) Derese, S.; Barasa, L.; Akala, H. M.; Yusuf, A. O.; Kamau, E.; Heydenreich, M.;
Yenesew, A. 4′-Prenyloxyderrone from the Stem Bark of Millettia Oblata Ssp.
Teitensis and the Antiplasmodial Activities of Isoflavones from Some Millettia
Species. Phytochemistry Letters 2014, 8, 69–72.
(57) Dong, T. T. X.; Zhao, K. J.; Gao, Q. T.; Ji, Z. N.; Zhu, T. T.; Li, J.; Duan, R.; Cheung,
A. W. H.; Tsim, K. W. K. Chemical and Biological Assessment of a Chinese
Herbal Decoction Containing Radix Astragali and Radix Angelicae Sinensis:
Determination of Drug Ratio in Having Optimized Properties. Journal of
Agricultural and Food Chemistry 2006, 54, 2767–2774.
(58) Khan, I. A.; Avery, M. A.; Burandt, C. L.; Goins, D. K.; Mikell, J. R.; Nash, T. E.;
Azadegan, A.; Walker, L. A. Antigiardial Activity of Isoflavones from Dalbergia
Frutescens Bark. Journal of Natural Products 2000, 63, 1414–1416.
(59) Huh, J.-E.; Kwon, N.-H.; Baek, Y.-H.; Lee, J.-D.; Choi, D.-Y.; Jingushi, S.; Kim, K.;
Park, D.-S. Formononetin Promotes Early Fracture Healing through
Stimulating Angiogenesis by up-Regulating VEGFR-2/Flk-1 in a Rat Fracture
Model. International Immunopharmacology 2009, 9, 1357–1365.
(60) Huh, J.-E.; Nam, D.-W.; Baek, Y.-H.; Kang, J. W.; Park, D.-S.; Choi, D.-Y.; Lee, J.-
D. Formononetin Accelerates Wound Repair by the Regulation of Early
Growth Response Factor-1 Transcription Factor through the Phosphorylation
of the ERK and p38 MAPK Pathways. International Immunopharmacology
2011, 11, 46–54.
(61) Wu, J.-H.; Li, Q.; Wu, M.-Y.; Guo, D.-J.; Chen, H.-L.; Chen, S.-L.; Seto, S.-W.; Au,
A. L. S.; Poon, C. C. W.; Leung, G. P. H.; Lee, S. M. Y.; Kwan, Y.-W.; Chan, S.-W.
Formononetin, an Isoflavone, Relaxes Rat Isolated Aorta through

CHAPTER 3: IN VITRO EVALUATION OF NATURAL PRODUCT BIOACTIVATION
NICHOLAS M. NJUGUNA - Ph.D. THESIS 2014
134
Endothelium-Dependent and Endothelium-Independent Pathways. The
Journal of Nutritional Biochemistry 2010, 21, 613–620.
(62) Li, Z.; Dong, X.; Zhang, J.; Zeng, G.; Zhao, H.; Liu, Y.; Qiu, R.; Mo, L.; Ye, Y.
Formononetin Protects TBI Rats against Neurological Lesions and the
Underlying Mechanism. Journal of the Neurological Sciences 2014, 338, 112–
117.
(63) Crespi, C. L.; Miller, V. P.; Penman, B. W. Microtiter Plate Assays for Inhibition
of Human, Drug-Metabolizing Cytochromes P450. Analytical Biochemistry
1997, 248, 188–190.
(64) Crespi, C. L.; Stresser, D. M. Fluorometric Screening for Metabolism-Based
Drug-Drug Interactions. Journal of Pharmacological and Toxicological
Methods 2001, 44, 325–331.
(65) Nakamura, K.; Hanna, I. H.; Cai, H.; Nishimura, Y.; Williams, K. M.; Guengerich,
F. P. Coumarin Substrates for Cytochrome P450 2D6 Fluorescence Assays.
Analytical Biochemistry 2001, 292, 280–286.
(66) Onderwater, R. C. A.; Venhorst, J.; Commandeur, J. N. M.; Vermeulen, N. P.
Design, Synthesis, and Characterization of 7-Methoxy-4-
(aminomethyl)coumarin as a Novel and Selective Cytochrome P450 2D6
Substrate Suitable for High-Throughput Screening. Chemical Research in
Toxicology 1999, 12, 555–559.
(67) Thelingwani, R. S.; Zvada, S. P.; Dolgos, H.; Ungell, A.-L. B.; Masimirembwa, C.
M. In Vitro and in Silico Identification and Characterization of Thiabendazole
as a Mechanism-Based Inhibitor of CYP1A2 and Simulation of Possible
Pharmacokinetic Drug-Drug Interactions. Drug Metabolism and Disposition
2009, 37, 1286–1294.
(68) Bergström, M. A.; Isin, E. M.; Castagnoli, N.; Milne, C. E. Bioactivation
Pathways of the Cannabinoid Receptor 1 Antagonist Rimonabant. Drug
Metabolism and Disposition 2011, 39, 1823–1832.

CHAPTER 3: IN VITRO EVALUATION OF NATURAL PRODUCT BIOACTIVATION
NICHOLAS M. NJUGUNA - Ph.D. THESIS 2014
135
(69) Argoti, D.; Liang, L.; Conteh, A.; Chen, L.; Bershas, D.; Yu, C.-P.; Vouros, P.;
Yang, E. Cyanide Trapping of Iminium Ion Reactive Intermediates Followed by
Detection and Structure Identification Using Liquid Chromatography-Tandem
Mass Spectrometry (LC-MS/MS). Chemical Research in Toxicology 2005, 18,
1537–1544.
(70) Mašič, L. P. Role of Cyclic Tertiary Amine Bioactivation to Reactive Iminium
Species: Structure Toxicity Relationship. Current Drug Metabolism 2011, 12,
35–50.
(71) Lu, S. C. Regulation of Glutathione Synthesis. Molecular Aspects of Medicine
2009, 30, 42–59.
(72) Johansson, T.; Jurva, U.; Grönberg, G.; Weidolf, L.; Masimirembwa, C. Novel
Metabolites of Amodiaquine Formed by CYP1A1 and CYP1B1: Structure
Elucidation Using Electrochemistry, Mass Spectrometry, and NMR. Drug
Metabolism and Disposition 2009, 37, 571–579.
(73) Ma, S.; Subramanian, R. Detecting and Characterizing Reactive Metabolites by
Liquid Chromatography/tandem Mass Spectrometry. Journal of Mass
Spectrometry 2006, 41, 1121–1139.
(74) Kalgutkar, A. S.; Gardner, I.; Obach, R. S.; Shaffer, C. L.; Callegari, E.; Henne, K.
R.; Mutlib, A. E.; Dalvie, D. K.; Lee, J. S.; Nakai, Y.; O’Donnell, J. P.; Boer, J.;
Harriman, S. P. A Comprehensive Listing of Bioactivation Pathways of Organic
Functional Groups. Current Drug Metabolism 2005, 6, 161–225.
(75) Erve, J. C. L.; Vashishtha, S. C.; DeMaio, W.; Talaat, R. E. Metabolism of
Prazosin in Rat, Dog, and Human Liver Microsomes and Cryopreserved Rat
and Human Hepatocytes and Characterization of Metabolites by Liquid
Chromatography/tandem Mass Spectrometry. Drug Metabolism and
Disposition 2007, 35, 908–916.

CHAPTER 4: CHEMICAL INHIBITOR CROSS-REACTIVITY IN CYP450 PHENOTYPING
NICHOLAS M. NJUGUNA - Ph.D. THESIS 2014
136
CHAPTER FOUR:
INVESTIGATING THE CROSS-REACTIVITY OF CHEMICAL INHIBITORS
USED IN HEPATIC MICROSOMAL CYP450 ENZYME PHENOTYPING
4.1 Summary
In this Chapter, an overview of the different approaches employed by the
pharmaceutical industry in enzyme phenotyping is presented as a primer to highlight
certain drawbacks intended to be addressed by the work presented here. Detailed in
vitro assays carried out to determine the extent to which chemical inhibitors
routinely used in hepatic microsomal CYP450 phenotyping assays in early drug
discovery exhibit cross-inhibition are described. Quantitative analysis of the data
obtained from these assays and their application in improving calculations for
determining the contribution of different CYP450 enzymes in drug metabolism is
presented.
The work described in this Chapter was carried out in the Drug Metabolism and
Pharmacokinetics (DMPK) Department at the Novartis Institute of Biomedical
Research (NIBR) in Basel, Switzerland.
4.2 General Introduction
In early DMPK studies, identification of the enzymes principally responsible for the
biotransformation of lead compounds is crucial in understanding the metabolic fate
and anticipating potential liabilities in the disposition of such potential drugs in vivo.
The principle phase I oxidative enzymes involved in biotransformation of xenobiotics
include the various CYP450 isoforms and the flavin-containing monoxygenases
(FMOs) previously described in Chapter 1. The CYP450 enzymes are responsible for
the biotransformation of more than 75% of drugs used clinically. Thus, investigating
which of these enzymes are involved in biotransformation of potential new drugs, as
would be expected, is often carried out early in the development process. ‘CYP450
Reaction Phenotyping’ refers to the process of identifying the specific CYP450
enzyme isoforms responsible for metabolism of xenobiotics and quantifying their
individual contribution to overall metabolism.

CHAPTER 4: CHEMICAL INHIBITOR CROSS-REACTIVITY IN CYP450 PHENOTYPING
NICHOLAS M. NJUGUNA - Ph.D. THESIS 2014
137
CYP450 reaction phenotyping is important for several reasons:
1. It allows for early detection of potential metabolic liabilities, including:
Identifying whether a compound is predominantly a metabolic substrate of
major CYP450 isoforms such as CYP2C9, CYP2C19 or CYP2D6, which are
known to exhibit phenotypic polymorphism in different human populations.1
Such a scenario may necessitate consideration of different dosing strategies
of such a compound in different patient populations.
Prediction of the major site (organ or tissue) of metabolism e.g. hepatic/
extra-hepatic. This is possible if the main metabolizing enzyme(s) are
predominantly localized in specific tissues or organs and may aid in
anticipating potential targets for toxicity related to compound metabolism,
for example, via reactive metabolite formation.
Identification of whether a compound is metabolized by multiple isoforms
and hence subject to metabolic switching in the event of inhibition of any of
its metabolic pathways. Drugs significantly metabolized by more than one
isoform might be more prone to drug-drug interactions when co-
administered with other xenobiotics. Additionally, depending on the
individual isoform affinities for the substrate, this may also contribute to low
metabolic stability for such compounds.
2. By establishing the contribution of individual CYP450 enzymes to metabolism of
a compound, one can more readily estimate the potential or risk and magnitude
of undesirable drug-drug interactions in patients under concomitant medication
with several drugs that are metabolised by the same enzymes.
4.3 In vitro CYP450 Phenotyping Techniques
There are several common in vitro techniques used in conducting early CYP450
phenotyping studies: (1) phenotyping using pooled hepatic microsomes and specific
chemical inhibitors or monoclonal antibodies; (2) CYP450 isoform mapping using
purified recombinant human CYP450 enzymes (rhCYP450);2 (3) a third, less common
in vitro technique, involves correlation analysis based on statistical comparison of
the rate of metabolism of test compounds to that of marker substrates in unpooled
microsomes obtained from individual donors.3

CHAPTER 4: CHEMICAL INHIBITOR CROSS-REACTIVITY IN CYP450 PHENOTYPING
NICHOLAS M. NJUGUNA - Ph.D. THESIS 2014
138
4.3.1 Chemical Inhibition CYP450 Phenotyping
This phenotyping method involves incubating the test compound in microsomal
proteins to which inhibitors of specific CYP450 isoforms are also included. As a
reference, incubations with no inhibitor serve as controls for standardizing
metabolism. The incubation(s) in which compound metabolism is found to be
significantly reduced by the presence of the included inhibitor point to the fact that
the CYP450 isoform(s) responsible for compound metabolism is/are the same one(s)
inhibited by the chemical inhibitor (Figure 4.1). Thus, for example, if the compound’s
metabolism is impaired in the presence of ketoconazole, it can be concluded that
CYP3A4/5 is responsible for metabolism since ketoconazole is a known inhibitor of
the CYP3A enzymes. The percentage decline in metabolism in the presence of
inhibitor is considered to represent the fraction of the drug metabolised by the
isoform in question (i.e. fm,CYP). A variation of this in vitro technique involves the
use of monoclonal antibodies in place of chemical inhibitors to effectively inhibit the
activity of specific CYP450 isoforms.4 Although this modified technique might give
more accurate results, it is more expensive particularly for use in routine early
phenotyping assays and therefore often only reserved for advanced phenotyping
during later stages of compound development.
Figure 4.1: Schematic illustration of CYP450 phenotyping using chemical inhibitors or monoclonal antibodies. Decrease in metabolism with increasing inhibitor concentration reveals the relative contribution of the inhibited enzyme isoforms to compound metabolism.

CHAPTER 4: CHEMICAL INHIBITOR CROSS-REACTIVITY IN CYP450 PHENOTYPING
NICHOLAS M. NJUGUNA - Ph.D. THESIS 2014
139
4.3.2 CYP450 Isoform Mapping
This technique involves incubating the test compound individually in a panel of
specific purified recombinant human CYP450 isoforms and monitoring metabolic
turn-over in each case (Figure 4.2). From the incubations, it is possible to directly
determine which enzyme is involved in the metabolism of the substrate by
calculating the percentage of drug remaining at the end of the assay or alternatively,
quantifying the metabolites formed - if known or possible.5
Figure 4.2: Schematic representation of CYP450 phenotyping data using recombinant enzymes. Only isoforms that show metabolism greater than control (i.e. red line in chart) are considered significant.
In these assays, a control incubation of the test compound in the system used to
express the recombinant enzyme isoforms (e.g. yeast cells or E. coli) must be
included to determine and eliminate any inherent contribution of the expression
system to metabolism of the test compound in phenotyping calculations.6
CYP450 isoform mapping has the advantage of being simpler to perform and
interpret data, since the incubation matrix is ‘cleaner’ and often has fewer
confounding elements, such as reduced non-specific protein binding. It also allows
for the contribution of CYP450 isoforms such as 1A1, 1B1, 2A3, 2B1, 2D4 and 4F that
may not be present in hepatic microsomal fractions to be investigated unlike the
case when using only liver microsomes or microsomes from other organs by
including such in the panel of CYP450s to screen compounds with.7
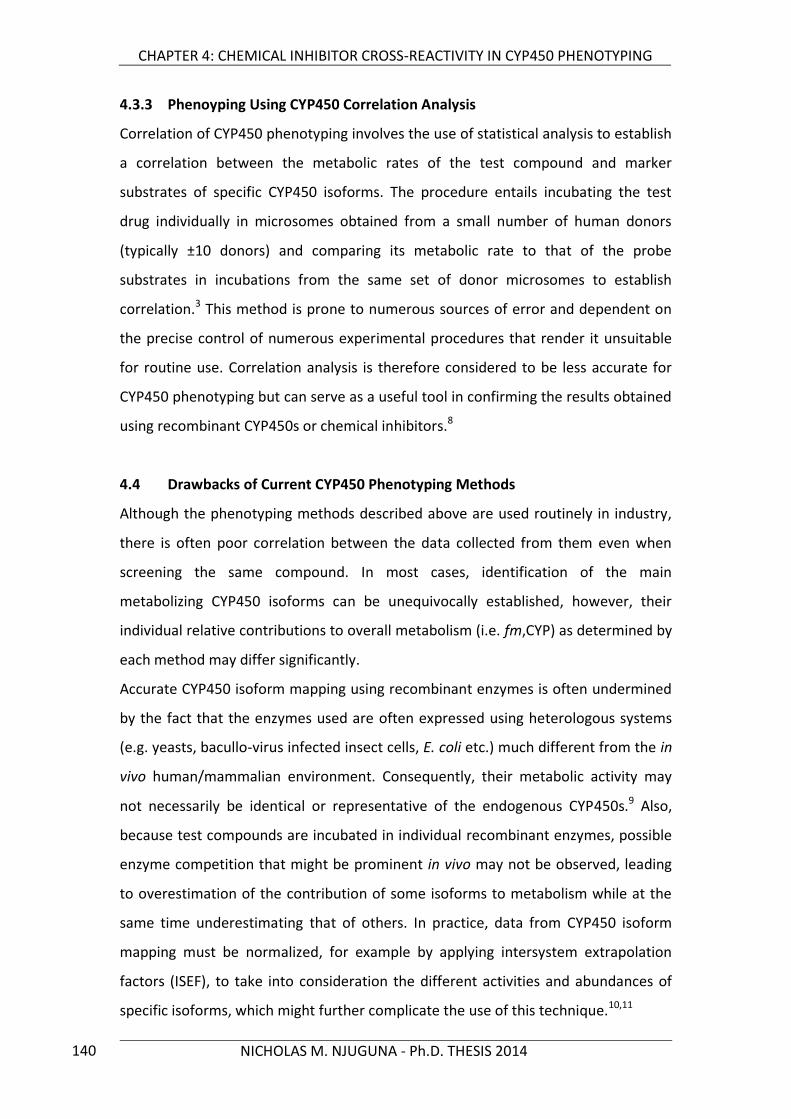
CHAPTER 4: CHEMICAL INHIBITOR CROSS-REACTIVITY IN CYP450 PHENOTYPING
NICHOLAS M. NJUGUNA - Ph.D. THESIS 2014
140
4.3.3 Phenoyping Using CYP450 Correlation Analysis
Correlation of CYP450 phenotyping involves the use of statistical analysis to establish
a correlation between the metabolic rates of the test compound and marker
substrates of specific CYP450 isoforms. The procedure entails incubating the test
drug individually in microsomes obtained from a small number of human donors
(typically ±10 donors) and comparing its metabolic rate to that of the probe
substrates in incubations from the same set of donor microsomes to establish
correlation.3 This method is prone to numerous sources of error and dependent on
the precise control of numerous experimental procedures that render it unsuitable
for routine use. Correlation analysis is therefore considered to be less accurate for
CYP450 phenotyping but can serve as a useful tool in confirming the results obtained
using recombinant CYP450s or chemical inhibitors.8
4.4 Drawbacks of Current CYP450 Phenotyping Methods
Although the phenotyping methods described above are used routinely in industry,
there is often poor correlation between the data collected from them even when
screening the same compound. In most cases, identification of the main
metabolizing CYP450 isoforms can be unequivocally established, however, their
individual relative contributions to overall metabolism (i.e. fm,CYP) as determined by
each method may differ significantly.
Accurate CYP450 isoform mapping using recombinant enzymes is often undermined
by the fact that the enzymes used are often expressed using heterologous systems
(e.g. yeasts, bacullo-virus infected insect cells, E. coli etc.) much different from the in
vivo human/mammalian environment. Consequently, their metabolic activity may
not necessarily be identical or representative of the endogenous CYP450s.9 Also,
because test compounds are incubated in individual recombinant enzymes, possible
enzyme competition that might be prominent in vivo may not be observed, leading
to overestimation of the contribution of some isoforms to metabolism while at the
same time underestimating that of others. In practice, data from CYP450 isoform
mapping must be normalized, for example by applying intersystem extrapolation
factors (ISEF), to take into consideration the different activities and abundances of
specific isoforms, which might further complicate the use of this technique.10,11

CHAPTER 4: CHEMICAL INHIBITOR CROSS-REACTIVITY IN CYP450 PHENOTYPING
NICHOLAS M. NJUGUNA - Ph.D. THESIS 2014
141
On the other hand, the major shortcoming of CYP450 phenotyping using chemical
inhibitors lies in the relative selectivity of the compounds used routinely as reference
inhibitors for the different CYP450 isoforms.12 In practice, though the compounds
used are known to inhibit specific enzymes to a high degree, they often demonstrate
some extent of cross-inhibition resulting in the under- or over-estimation of the
metabolic contribution of the affected CYP450 isoforms. Due to this cross-reactivity,
it is not uncommon for phenotyping data to yield cumulative fm,CYP values that
total more than 100%. Substituting chemical inhibitors with the use of monoclonal
antibodies that inactivate specific CYP450 isoforms more selectively can significantly
improve accuracy, but requires greater capital outlay and experimental complexity.
Alternatively, more selective synthetic inhibitors than those used routinely could be
identified and used. This is, however, complicated by the fact that existing
compounds possess the advantage of having been studied over a long period of time
under different settings and by different researchers, and are mostly compounds
used clinically as drugs or which were originally designed as such. Furthermore, most
chemical inhibitors in current use can also be used for in vivo studies. Replacement
inhibitors would need to have undergone a similarly thorough evaluation prior to
their acceptance and adoption for routine application.
A more feasible approach in improving CYP450 phenotyping using chemical
inhibitors lies in experimentally quantifying the actual extent to which such
compounds exhibit cross-reactivity under particular assay settings. From such data,
correction factors can be applied in CYP450 phenotyping calculations to more
accurately determine fm,CYP.
Such an approach has previously been reported by Lu et al. in a study aimed at
predicting in vivo drug-drug interaction based on in vitro CYP450-phenotyping data
determined using chemical inhibitors corrected for cross-reactivity.13
The aim of the present study was to use a similar approach but in which the
experimental protocols differed from the work carried out by Lu et al. by evaluating
the cross-inhibitory effects of a greater number of chemical inhibitors in addition to
maintaining in vitro incubation conditions aimed at ensuring linearity of enzymatic
activity throughout.

CHAPTER 4: CHEMICAL INHIBITOR CROSS-REACTIVITY IN CYP450 PHENOTYPING
NICHOLAS M. NJUGUNA - Ph.D. THESIS 2014
142
4.5 Probe CYP450 Isoform Reactions and Chemical Inhibitors
Ideally, CYP450 reaction phenotyping using human liver microsomes and chemical
inhibitors would make use of probe substrates that are entirely metabolised by a
single enzyme isoform through a metabolic transformation that can be monitored
using an inhibitor that is wholly specific to that isoform. In practice, this scenario
does not exist, instead, the compounds used routinely in CYP450 phenotyping are a
collection of marker substrates predominantly metabolised by a particular isoform
and chemical inhibitors considered to be highly, but not entirely, selective to the
main drug metabolising CYP450 isoforms.14
The eight (8) chemical inhibitors investigated for cross-reactivity in this work, specific
CYP450 isoforms and the probe metabolic reactions monitored to quantify the
extent of cross-inhibition are summarized in Table 4.1 and Figure 4.3 - Figure 4.5.
Table 4.1: CYP450 isoforms, their respective probe substrates, metabolites and chemical inhibitors evaluated in this work
CYP450 isoform Inhibitor Probe substrate Marker metabolite
CYP1A2 Furafylline Phenacetin Acetaminophen
CYP2B6
Ticlopidine
Bupropion Hydroxybupropion
CYP2C19 (S)-mephenytoin 4’-Hydroxymephenytoin
CYP2C9 Sulfaphenazole Diclofenac 4’-Hydroxydiclofenac
CYP2C8 Montelukast Paclitaxel 6α-Hydroxypaclitaxel
CYP2D6 Quinidine Bufuralol 1’-Hydroxybufuralol
CYP2E1 Diethylthiocarbamate (DETC)
Chlorzoxazone 6-Hydroxychlorzoxazone
CYP3A
Azamulin
Midazolam 1’-Hydroxymidazolam
Ketoconazole

CHAPTER 4: CHEMICAL INHIBITOR CROSS-REACTIVITY IN CYP450 PHENOTYPING
NICHOLAS M. NJUGUNA - Ph.D. THESIS 2014
143
Figure 4.3: Probe metabolic reactions of CYP1A2, CYP2B6, CYP2C9 and CYP2C19 and their respective chemical inhibitors evaluated for cross-reactivity
Figure 4.4: Probe metabolic reactions of CYP2D6 and CYP2E1 and their respective chemical inhibitors evaluated for cross-reactivity

CHAPTER 4: CHEMICAL INHIBITOR CROSS-REACTIVITY IN CYP450 PHENOTYPING
NICHOLAS M. NJUGUNA - Ph.D. THESIS 2014
144
Figure 4.5: Probe metabolic reactions of CYP2C8 and CYP3A and their respective chemical inhibitors evaluated for cross-reactivity

CHAPTER 4: CHEMICAL INHIBITOR CROSS-REACTIVITY IN CYP450 PHENOTYPING
NICHOLAS M. NJUGUNA - Ph.D. THESIS 2014
145
4.6 Methodology
4.6.1 Incubation Conditions
Cross-inhibition of individual CYP450 isoforms was determined by incubating the
specific marker substrates of each of the test CYP450s present in pooled, mixed
gender human liver microsomes to which each of the inhibitors under test was
included. The in vitro CYP450 inhibition assays were carried out in duplicate at 37 °C
under optimized conditions with regard to microsomal protein concentration, probe
substrate concentration and incubation duration (Table 4.2). Each inhibitor was
incubated at a concentration 5 times greater than its reported Ki value to ensure
maximal enzyme inhibition while probe substrate concentrations were at least 5
times less than their reported Km values. Under these conditions, enzyme activity
was expected to be linear and more reproducible. Incubation durations for each
metabolic probe reaction were selected to ensure that not more than 20% of the
probe substrate was metabolised, as recommended by Bjornsson et al.9 The
optimized incubation conditions used are summarized below and the experimental
procedure described in greater detail in the Experimental Chapter.
Table 4.2: Summary of experimental probe substrate, chemical inhibitor and protein concentrations and experimental incubation duration
CYP450 Probe Substrate (µM) Inhibitor (µM) HLM Protein
(mg/mL)
Incubation Duration
(min)
CYP1A2 Phenacetin (2.0) Furafylline (10.0) 0.20 20
CYP2B6 Bupropion (25.0) Ticlopidine (10.0) 0.10 20
CYP2C8 Paclitaxel (1.0) Montelukast (2.0) 0.20 20
CYP2C9 Diclofenac (1.0) Sulfaphenazole (5.0) 0.05 8
CYP2C19 S-mephenytoin (10.0) Ticlopidine (10.0) 0.50 20
CYP2D6 Bufuralol (5.0) Quinidine (2.0) 0.20 20
CYP2E1 Chlorzoxazone (5.0) Diethylthiocarbamate - DETC (100.0)
0.50 20
CYP3A Midazolam (0.5) Azamulin (5.0)
0.05 8
Ketoconazole (1.0)

CHAPTER 4: CHEMICAL INHIBITOR CROSS-REACTIVITY IN CYP450 PHENOTYPING
NICHOLAS M. NJUGUNA - Ph.D. THESIS 2014
146
4.6.2 Quantification of Probe Metabolites and Inhibition of Isoform Activity
Metabolic activity of each enzyme was determined in both the presence and
absence of inhibitor by quantifying the amount of probe substrate metabolite
formed at the end of each incubation. Detection and quantification of metabolites
was achieved by LC-MS analysis of the incubation samples each spiked with a known
concentration of the respective 13C or 2H radiolabelled metabolite to serve as
internal standard. Metabolite concentrations were calculated from chromatographic
peak areas determined using the MRM transitions of characteristic fragments of the
analyte metabolite being intrapolated from peak area ratio vs concentration
calibration curves from standard solutions of each metabolite. Each 7-concentration
point metabolite standard solution (Table 4.3) was prepared fresh on the day of
analysis and analysed before testing incubation samples on the same LC-MS system
to ensure linearity of response. For all the probe metabolite calibration curves, a
minimum concentration vs analyte/IS peak area ratio Pearson correlation coefficient
(r2) of 0.98 was deemed acceptable for quantitative analysis (Figure 4.6).
Metabolite concentration in the incubations devoid of any inhibitor was calculated
to represent 100% enzyme activity. From this, the inhibition of enzyme activity was
computed as a percentage fraction based on the metabolite content in the probe
substrate incubations performed in the presence of the various inhibitors.
Table 4.3: Metabolites analysed and concentrations used for plotting calibration curves
CYP450 Isoform Analyte Metabolite Calibration Standard
Concentrations [ng/mL]
CYP1A2 Acetaminophen 0; 1.0; 2.5; 5.0; 10; 25; 50; 100
CYP2B6 Hydroxybupropion 0; 10; 25; 50; 100; 250; 500; 1000
CYP2C19 4’-Hydroxymephenytoin 0; 0.4; 1.0; 2.0; 4.0; 10; 20; 40
CYP2C9 4’-Hydroxydiclofenac 0; 10; 25; 50; 100; 250; 500; 1000
CYP2C8 6α-Hydroxypaclitaxel 0; 1.0; 2.5; 5.0; 10; 25; 50; 100
CYP2D6 1’-Hydroxybufuralol 0; 2.0; 5.0; 10; 25; 50; 100; 200
CYP2E1 6-Hydroxychlorzoxazone 0; 0.4; 1.0; 2.0; 4.0; 10; 20; 40
CYP3A 1’-Hydroxymidazolam 0; 4.0; 10; 20; 40; 100; 200; 400

CHAPTER 4: CHEMICAL INHIBITOR CROSS-REACTIVITY IN CYP450 PHENOTYPING
NICHOLAS M. NJUGUNA - Ph.D. THESIS 2014
147
Figure 4.6: Representative concentration vs response calibration curves of metabolite standard solutions used for LC-MS quantification of enzyme inhibition

CHAPTER 4: CHEMICAL INHIBITOR CROSS-REACTIVITY IN CYP450 PHENOTYPING
NICHOLAS M. NJUGUNA - Ph.D. THESIS 2014
148
4.7 Cross-Inhibition Assays Results
4.7.1 Furafylline
Figure 4.7: Inhibitory effect of furafylline on 8 different CYP450 isoform metabolic probe reactions
The inhibitory effects of furafylline, a methylxanthine developed in the 1980s as a
long acting antiasthmatic agent, on CYP1A2-mediated phenacetin O-deethylation is
the basis for routine use of this compound in phenotyping metabolism mediated by
CYP1A2.15 The inhibition is non-competitive and thought to involve mechanism-
based inactivation of the enzyme.16
Cross-reactivity results from the assay using furafylline indicated that this compound
exhibited very high inhibition of CYP1A2 as expected (89.0%), but also some
significant suppression of CYP2E1-mediated chlorzoxazone 6-hydroxylation
(approximately 50%). The remaining CYP450 isoforms appeared to be much less
affected by furafylline with all six exhibiting less than 20% inhibition and in the case
of CYP3A (0.5% inhibition), being virtually unaffected even by the relatively high
concentration of inhibitor used.
The relatively high selectivity observed with furafylline is perhaps not unusual
considering that even its inhibition of CYP1A2 activity has been shown to vary
significantly between reactions metabolised by the human enzyme compared to the
same isoform in rat liver microsomes.17 Cross-inhibition of CYP2E1 by furafylline has
been reported previously, albeit to a lesser degree than observed here.18

CHAPTER 4: CHEMICAL INHIBITOR CROSS-REACTIVITY IN CYP450 PHENOTYPING
NICHOLAS M. NJUGUNA - Ph.D. THESIS 2014
149
4.7.2 Ticlopidine
Figure 4.8: Inhibitory effect of ticlopidine on 8 different CYP450 isoform metabolic probe reactions
Ticlopidine is a thienopyridine anti-platelet aggregation drug that acts as an
antagonist at adenosine diphosphate receptors and which is used clinically in the
management of conditions such as thromboembolic strokes and to prevent
thrombus formation secondary to cardiovascular surgical procedures.19
Ticlopidine has been reported to be a suicide inhibitor of CYP2C19, acting as a
substrate of the enzyme,which undergoes biotransformation into a metabolite that
then subsequently causes mechanism-based inhibition.20 Ticlopidine and related
thienopyridines such as clopidogrel have similarly been reported to inhibit the
metabolism of fluorogenic probe subtrates by CYP2C19.21 Ticlopidine is also a potent
inhibitor of CYP2B6-mediated bupropion hydroxylation in vivo.22 In addition to its
potent inhibitory activity against these two isoforms, in vitro studies have also
revealed low selectivity and potential inhibition of other CYP450s.23 However,
Walsky and Obach reported that ticlopidine was found to be markedly more
selective to CYP2B6 when pre-incubated with hepatic microsomes prior to addition
of probe substrates for other CYP450 isoforms.24
In our cross-inhibition assays, ticlopidine was unsurprisingly found to markedly
inhibit the probe metabolic reactions of both CYP2B6 (97.2% inhibition) and CYP2C19
(86.8%) as anticipated. Ticlopidine was also found to inhibit both CYP1A2 and
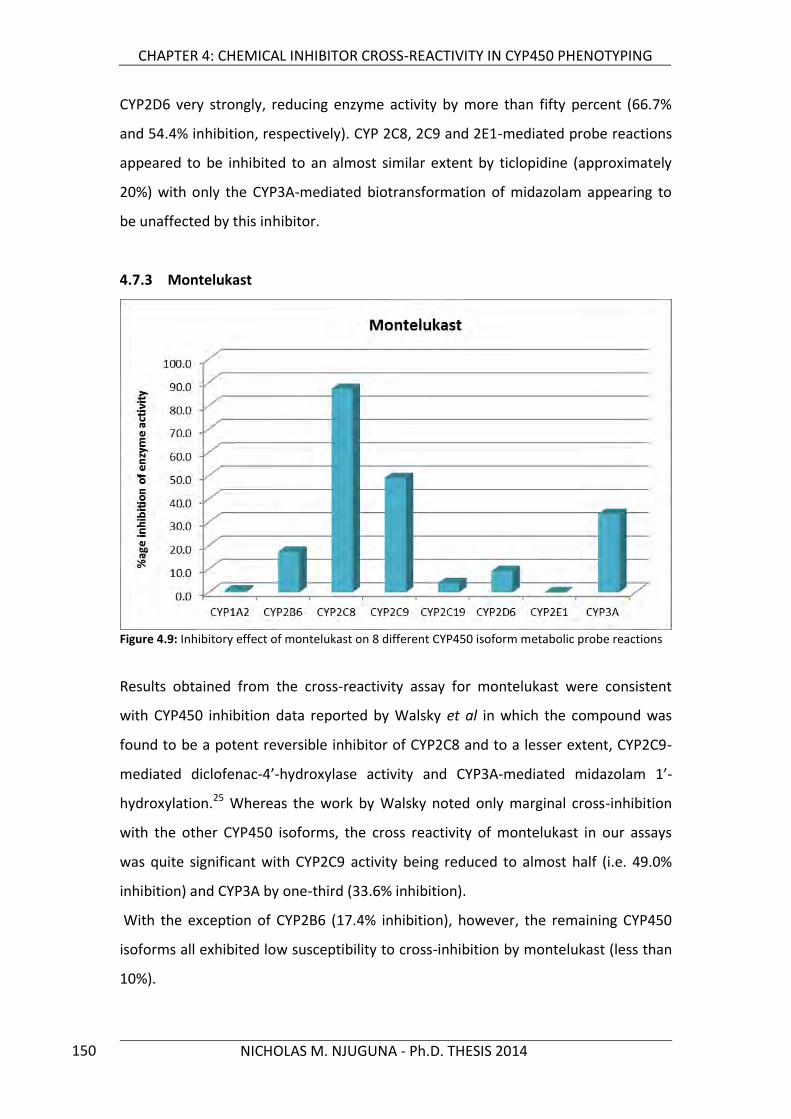
CHAPTER 4: CHEMICAL INHIBITOR CROSS-REACTIVITY IN CYP450 PHENOTYPING
NICHOLAS M. NJUGUNA - Ph.D. THESIS 2014
150
CYP2D6 very strongly, reducing enzyme activity by more than fifty percent (66.7%
and 54.4% inhibition, respectively). CYP 2C8, 2C9 and 2E1-mediated probe reactions
appeared to be inhibited to an almost similar extent by ticlopidine (approximately
20%) with only the CYP3A-mediated biotransformation of midazolam appearing to
be unaffected by this inhibitor.
4.7.3 Montelukast
Figure 4.9: Inhibitory effect of montelukast on 8 different CYP450 isoform metabolic probe reactions
Results obtained from the cross-reactivity assay for montelukast were consistent
with CYP450 inhibition data reported by Walsky et al in which the compound was
found to be a potent reversible inhibitor of CYP2C8 and to a lesser extent, CYP2C9-
mediated diclofenac-4’-hydroxylase activity and CYP3A-mediated midazolam 1’-
hydroxylation.25 Whereas the work by Walsky noted only marginal cross-inhibition
with the other CYP450 isoforms, the cross reactivity of montelukast in our assays
was quite significant with CYP2C9 activity being reduced to almost half (i.e. 49.0%
inhibition) and CYP3A by one-third (33.6% inhibition).
With the exception of CYP2B6 (17.4% inhibition), however, the remaining CYP450
isoforms all exhibited low susceptibility to cross-inhibition by montelukast (less than
10%).

CHAPTER 4: CHEMICAL INHIBITOR CROSS-REACTIVITY IN CYP450 PHENOTYPING
NICHOLAS M. NJUGUNA - Ph.D. THESIS 2014
151
4.7.4 Quinidine
Figure 4.10: Inhibitory effect of quinidine on 8 different CYP450 isoform metabolic probe reactions
Quinidine is an isomer of the anti-malaria drug quinine used clinically as an anti-
arrhythmic agent and is a well established inhibitor of CYP2D6 first reported to
suppress the oxidative metabolism of another anti-arrhythmic agent, sparteine, in
the 1980s by Otton et al.26 Inhibition of recombinant CYP2D6 expressed from yeasts
by quinidine and its related cinchona alkaloid dihydroquinidine has similarly been
reported.27 Based on these and other reports of its well studied metabolic enzyme
inhibition profile, quinidine is commonly used in chemical inhibition CYP450
phenotyping to identify candidate substrates of CYP2D6.
Cross-reactivity results of the effect of quinidine on the metabolism of probe
substrates of the other CYP450 enzymes revealed consistently low cross-inhibition,
with values of less than 10% against CYP1A2, CYP2B6, CYP2C8, CYP2C9 and CYP3A.
Even though the cross-inhibition of CYP2C19 by quinidine was higher than for these
five isoforms, it was still not considered to be significant at only 16.2%.
On the other hand, in addition to its expected effect on CYP2D6-mediated
metabolism (89.3% inhibition), quinidine was observed to strongly inhibit CYP2E1-
mediated chlorzoxazone hydroxylation (30.4%).

CHAPTER 4: CHEMICAL INHIBITOR CROSS-REACTIVITY IN CYP450 PHENOTYPING
NICHOLAS M. NJUGUNA - Ph.D. THESIS 2014
152
4.7.5 Sulfaphenazole
Figure 4.11: Inhibitory effect of sulfaphenazole on 8 different CYP450 isoform metabolic probe reactions
Sulfaphenazole is a long acting synthetic sulphonamide originally developed in the
1950s for the treatment of bacterial infections then subsequently discovered to be a
potent inhibitor of CYP450 enzyme and now routinely used as a competitive and
selective in vitro inhibitor of CYP2C9.28,29
Cross-reactivity assays using sulfaphenazole confirmed its potent inhibition of
CYP2C9 activity (89.1% inhibition) as reported in the literature. Inhibition of other
CYP450 isoforms was low and ranged over 1.5% - 12.5% for CYPs 1A2, 2B6, 2C8,
2C19, 2D6 and 3A. The only exception to this trend was CYP2E1 in which case
sulfaphenazole reduced activity by 26.8%, which was considered low but
nevertheless significant.

CHAPTER 4: CHEMICAL INHIBITOR CROSS-REACTIVITY IN CYP450 PHENOTYPING
NICHOLAS M. NJUGUNA - Ph.D. THESIS 2014
153
4.7.6 Diethylthiocarbamate
Figure 4.12: Inhibitory effect of diethylthiocarbamate on 8 different CYP450 isoform metabolic probe reactions
Diethyldithiocarbamate was evaluated as the routine inhibitor used to establish the
metabolic contribution of CYP2E1 and found to be the least potent of the
compounds tested and by far the least selective.
Despite significant loss of CYP2E1 activity (31.8% inhibition) in the presence of DETC,
this value was considerably lower than inhibitions achieved with the other inhibitors
on their respective probe reactions, all of which were typically in excess of 85%.
Furthermore, DETC actually appeared to inhibit the activity of other isoforms to a
slightly greater degree than observed with CYP2E1 i.e. CYP1A2 (33.7% inhibition),
CYP2B6 (39.8%) and CYP2D6 (36.7% inhibition). The activities of both CYP2C8 and
CYP2C9 were also significantly reduced by approximately 20% in either case and only
CYP2C19 and CYP3A showed less than 10% inhibition.
These somewhat idiosyncratic results for DETC inhibition potency and cross-
reactivity have previously been reported using recombinant cDNA-expressed human
CYP450 enzymes by Chang et al., but contrasted with previous work by Guengerich
et al. on the selectivity of DETC for CYP2E1 in microsomal preparations.30,31

CHAPTER 4: CHEMICAL INHIBITOR CROSS-REACTIVITY IN CYP450 PHENOTYPING
NICHOLAS M. NJUGUNA - Ph.D. THESIS 2014
154
4.7.7 Ketoconazole
Figure 4.13: Inhibitory effect of ketoconazole on 8 different CYP450 isoform metabolic probe reactions
Ketoconazole was found to exhibit significant cross-inhibition of CYP2B6, CYP2C8,
CYP2C9 and CYP2E1 in addition to its established mixed competitive and non-
competitive inhibition of CYP3A-mediated 1’-hydroxylation of midazolam.32
The activities of CYP1A2 and CYP2D6 were both only reduced by about 10% while
CYP2C19 activity appeared to be entirely unaffected following co-incubation with
ketoconazole. In the case of both CYP2B6 and CYP2C8, ketoconazole accounted for
approximately 40% loss in enzymatic activity, while CYP2E1 was comparatively only
slightly less affected (35.8% inhibition) with CYP2C9 activity being reduced by 26.5%.
The cross-inhibition findings with ketoconazole were not unexpected, particularly
based on the large volume of information published regarding this and other azole
antifungal drugs’ clinically significant drug-drug interactions with numerous other
medications.33 It was, however, observed that the absolute rank order of in vitro
cross-inhibition by ketoconazole (CYP3A > CYP2C8 ≈ CYP2B6 > CYP2E1> CYP2C9)
differed from that reported by Obach et al (CYP3A > CYP2C9 ≈ CYP2C19 > CYP1A2 ≈
CYP2D6) particularly regarding CYP2C19, which was observed to be virtually
uninhibited in our study.34 A possible explanation for these differences might be
variance in experimental conditions e.g. protein and substrate concentrations.

CHAPTER 4: CHEMICAL INHIBITOR CROSS-REACTIVITY IN CYP450 PHENOTYPING
NICHOLAS M. NJUGUNA - Ph.D. THESIS 2014
155
4.7.8 Azamulin
Figure 4.14: Inhibitory effect of azamulin on 8 different CYP450 isoform metabolic probe reactions
Azamulin is a synthetic azole derivative of pleuromutilin, a diterpene antibiotic first
isolated from the fungus Pleurotusmutilis. This compound has been reported to be
as potent an inhibitor of CYP3A isoforms as ketoconazole but more selective than
the latter.35
Results from the cross inhibition assay for azamulin were consistent with data from
the literature. Compared to ketoconazole, azamulin was observed to be a
significantly more selective inhibitor, reducing CYP3A-mediated metabolism of
midazolam by more than 95% while generally reducing the activity of the other
CYP450 isoforms by less than 20%. A notable exception to the selectivity of azamulin
appeared to be its relatively high cross-inhibition of CYP2C9 (22.9% inhibition) which
was comparable to the effect observed with ketoconazole (26.5% inhibition).
Considering that the concentration of all inhibitors used in these experiments were
deliberately higher than their Ki values, the data obtained for azamulin cross-
inhibition might suggest that in routine CYP450phenotyping assays, this compound
might not significantly distort phenotyping data.

CHAPTER 4: CHEMICAL INHIBITOR CROSS-REACTIVITY IN CYP450 PHENOTYPING
NICHOLAS M. NJUGUNA - Ph.D. THESIS 2014
156
4.8 Compensating for Inhibitor Cross-Reactivity in CYP450 Phenotyping Data
The same mathematical approach reported by Lu et al. was applied to recalculate
CYP450 phenotyping data by taking into consideration the determined maximal
cross-inhibition effects of the 8 inhibitors tested.13
For this, a summary cross-inhibition matrix was generated as shown in Table 4.4:
Table 4.4: Percentage inhibition of CYP450 isoform activity by different chemical inhibitors
Inhibitor CYP1A2 CYP2B6 CYP2C8 CYP2C9 CYP2C19 CYP2D6 CYP2E1 CYP3A
Furafylline 89.01 7.24 13.50 6.33 7.57 16.28 50.01 0.55
Montelukast 0.82 17.37 87.17 49.00 3.93 9.09 -1.02 33.56
Sulfaphenazole 12.57 1.56 10.04 89.14 11.10 7.42 26.84 8.02
Ticlopidine 66.76 97.23 21.37 18.89 86.81 54.38 21.04 -13.55
Quinidine -0.21 11.06 8.99 4.14 16.19 89.33 30.43 2.87
DETC 33.74 39.81 21.33 20.02 8.05 36.72 31.81 6.62
Ketoconazole 11.68 41.90 44.74 26.52 -2.64 9.16 35.79 94.64
Azamulin -2.64 18.40 8.17 22.90 11.52 10.06 17.77 96.52
Using the percentage cross-inhibition values determined for each inhibitor against
the different CYP450 isoforms, it was possible to formulate simultaneous equations
from data previously generated using conventional CYP450 phenotyping to more
accurately represent the corrected contribution of different isoforms to compound
metabolism.
An example of how this was done is illustrated. In this case, assuming a test
compound determined to undergo metabolism mediated by more than one CYP450
isoform as follows:
Table 4.5: Hypothetical CYP450 phenotyping data uncorrected for inhibitor cross-reactivity
CYP1A2 CYP2C8 CYP2C9 CYP2C19 CYP3A
Test Drug 17% 13% 19% 35% 70%

CHAPTER 4: CHEMICAL INHIBITOR CROSS-REACTIVITY IN CYP450 PHENOTYPING
NICHOLAS M. NJUGUNA - Ph.D. THESIS 2014
157
Incorporation of the corresponding cross-inhibition matrix data for the CYP450
isoforms involved in metabolism of such a compound would generate the following
table and could be expressed in the form of an algebraic simultaneous equation as
shown:
% inhibition by chemical Inhibitor
CYP1A2 CYP2C8 CYP2C9 CYP2C19 CYP3A fm,CYP(%)
Furafylline 1A2 89.01 13.50 6.33 7.57 0.55 17
Montelukast 2C8 0.82 87.17 49.00 3.93 33.56 13
Sulfaphenazole 2C9 12.57 10.04 89.14 11.10 8.02 19
Ticlopidine 2C19 66.76 21.37 18.89 86.81 -13.55 35
Ketoconazole 3A 11.68 44.74 26.52 -2.64 94.64 70
Solving the equation can then be achieved using matrix calculations involving initial
computation of an inverse matrix of all coefficients, as shown:
And then multiplying the inverse inhibition matrix with the original fm,CYP values
thus:
0.8901q + 0.135r + 0.0633x + 0.0757y + 0.0055z = 0.17 0.0082q + 0.8717r + 0.490x + 0.0393y + 0.3356z = 0.13 0.1257q + 0.1004r + 0.8914x + 0.111y + 0.0802z = 0.19 0.6676q + 0.2137r + 0.1889x + 0.8681y + 0.000z = 0.35 0.1168q + 0.4474r + 0.2652x + 0.000y + 0.9464z = 0.70
Where the variables q, r, x, y, andz represent the corrected fm,CYP values for CYP1A2,
CYP2C8, CYP2C9, CYP2C19 and CYP3A, respectively.

CHAPTER 4: CHEMICAL INHIBITOR CROSS-REACTIVITY IN CYP450 PHENOTYPING
NICHOLAS M. NJUGUNA - Ph.D. THESIS 2014
158
The final step in calculating corrected fm,CYP is the determination of metabolic
contributions of each isoform as a percentage of the sum total of all the solved
variables whose magnitude is greater than 0. Solved variables with negative values
are interpreted to represent nil metabolic contribution by the isoform in question.
Thus, based on the foregoing correction calculation strategy, the corrected fm,CYP
data for the hypothetical test drug is as tabulated below.
Table 4.6: Unmodified and corrected fm,CYP data based on consideration of inhibitor cross-reactivity for a hypothetical drug
CYP1A2 CYP2C8 CYP2C9 CYP2C19 CYP3A
Unmodified fm,CYP 17% 13% 19% 35% 70%
Corrected fm,CYP 13.7% 0 7.6% 21.1% 57.6%

CHAPTER 4: CHEMICAL INHIBITOR CROSS-REACTIVITY IN CYP450 PHENOTYPING
NICHOLAS M. NJUGUNA - Ph.D. THESIS 2014
159
4.9 Application of Cross-Reactivity Correction to fm,CYP450 Data
The calculation strategy described in the previous section was applied in determining
the corrected fm,CYP values for 15 Novartis in-house development compounds
(Table 4.7) previously phenotyped using both conventional recombinant CYP450
mapping (Table 4.8) and pooled human liver microsomes with chemical inhibition.
The uncorrected and modified chemical inhibition CYP450 phenotyping data for
these compounds are summarised in Table 4.9.
Table 4.7: Physico-chemical properties of 15 test compounds phenotyped for CYP450 metabolism using conventional in vitro methods
Compound Physico-Chemical Properties
Mwt pKa Log P Solubility (g/L)
1 288.73 4.1/5.7 4.8 0.23
2 560.49 8.2/3.5 4.6 0.02
3 446.90 5.4/7.2 4.85 0.08
4 403.40 7.1/10.6 1.6 0.02
5 306.40 3.89/10.9 2.81 300
6 453.54 5.2 3.2 0.2
7 659.28 3.6/5.7 4.8 0.02
8 453.60 3.4 2.0 0.20
9 441.48 3.6/9.5 3.1 0.02
10 443.54 8.52/5.63 1.954 9.5
11 377.42 6.7/10.6 1.6 0.2
12 444.00 7.9 5.1 0.34
13 313.40 - 4.7 0.025
14 516.60 3.3/8.6 1.8 0.868
15 609.80 9.18 1.01 3.50

CHAPTER 4: CHEMICAL INHIBITOR CROSS-REACTIVITY IN CYP450 PHENOTYPING
NICHOLAS M. NJUGUNA - Ph.D. THESIS 2014
160
CYP450 isoform mapping using recombinant enzymes was performed by incubating
the radiolabelled test compounds in a panel of 14 different recombinant human
CYP450 (rhCYP450) enzymes expressed using bacullo-virus infected insect cells and
quantifying the formation of metabolites by means of post-column radio-
fluorescence detection following HPLC analysis of incubation samples.
Table 4.8: CYP450 phenotyping data from incubation of 15 Novartis test compounds in recombinant CYP450 isoforms
Compound fm, CYP (%) using rhCYP450
CYP1A2 CYP2C8 CYP2C9 CYP2C19 CYP2D6 CYP3A
1 35.0 0 0 2.5 0.8 59.9
2 0 0 0 0 0.1 97.5
3 0.3 0 0 0 0.1 99.6
4 0 0 0 8.2 0 91.6
5 4.2 1.4 18.5 0.6 0.1 75.1
6 0.7 0 0 0 0.4 98.9
7 0 0 0 0 0 94.8
8 0.6 0 1.7 0.1 0.1 96.3
9 0.7 2.6 0 0.2 0 92.0
10 1.1 0 0 0 0 98.2
11 0 ND 0 ND 0 100
12 0 0.4 0 0.6 88.6 10.5
13 0 0.8 6.6 3.7 0.2 88.8
14 0 1.7 79.2 0.1 0 18.5
15 0 ND 0 0 0.4 99.6
Note: “ND” indicates that values were Not Determined for this compound. Only the contribution of the main hepatic CYP450 enzymes is tabulated.
All 15 test compounds were found to be substrates of rhCYP3A, which was the main
enzyme contributing to the majority of metabolism in all except two cases (i.e.
fm,CYP3A > 50%).
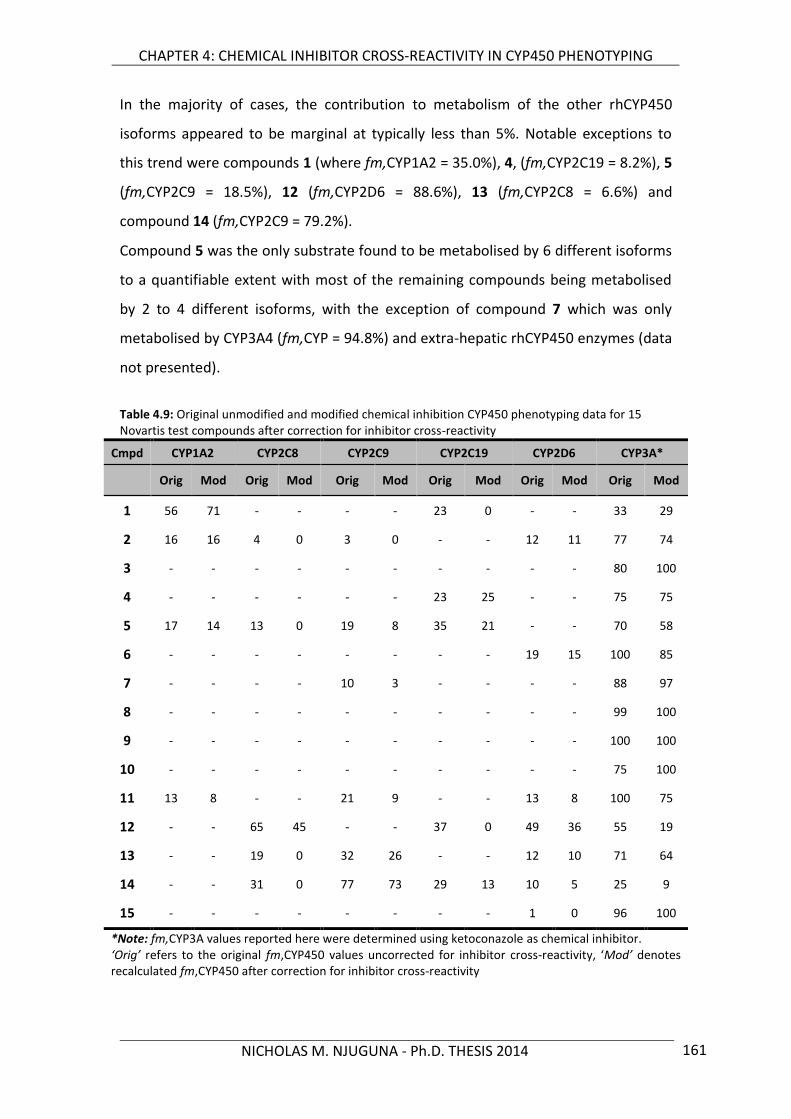
CHAPTER 4: CHEMICAL INHIBITOR CROSS-REACTIVITY IN CYP450 PHENOTYPING
NICHOLAS M. NJUGUNA - Ph.D. THESIS 2014
161
In the majority of cases, the contribution to metabolism of the other rhCYP450
isoforms appeared to be marginal at typically less than 5%. Notable exceptions to
this trend were compounds 1 (where fm,CYP1A2 = 35.0%), 4, (fm,CYP2C19 = 8.2%), 5
(fm,CYP2C9 = 18.5%), 12 (fm,CYP2D6 = 88.6%), 13 (fm,CYP2C8 = 6.6%) and
compound 14 (fm,CYP2C9 = 79.2%).
Compound 5 was the only substrate found to be metabolised by 6 different isoforms
to a quantifiable extent with most of the remaining compounds being metabolised
by 2 to 4 different isoforms, with the exception of compound 7 which was only
metabolised by CYP3A4 (fm,CYP = 94.8%) and extra-hepatic rhCYP450 enzymes (data
not presented).
Table 4.9: Original unmodified and modified chemical inhibition CYP450 phenotyping data for 15 Novartis test compounds after correction for inhibitor cross-reactivity
Cmpd CYP1A2 CYP2C8 CYP2C9 CYP2C19 CYP2D6 CYP3A*
Orig Mod Orig Mod Orig Mod Orig Mod Orig Mod Orig Mod
1 56 71 - - - - 23 0 - - 33 29
2 16 16 4 0 3 0 - - 12 11 77 74
3 - - - - - - - - - - 80 100
4 - - - - - - 23 25 - - 75 75
5 17 14 13 0 19 8 35 21 - - 70 58
6 - - - - - - - - 19 15 100 85
7 - - - - 10 3 - - - - 88 97
8 - - - - - - - - - - 99 100
9 - - - - - - - - - - 100 100
10 - - - - - - - - - - 75 100
11 13 8 - - 21 9 - - 13 8 100 75
12 - - 65 45 - - 37 0 49 36 55 19
13 - - 19 0 32 26 - - 12 10 71 64
14 - - 31 0 77 73 29 13 10 5 25 9
15 - - - - - - - - 1 0 96 100
*Note: fm,CYP3A values reported here were determined using ketoconazole as chemical inhibitor. ‘Orig’ refers to the original fm,CYP450 values uncorrected for inhibitor cross-reactivity, ‘Mod’ denotes recalculated fm,CYP450 after correction for inhibitor cross-reactivity

CHAPTER 4: CHEMICAL INHIBITOR CROSS-REACTIVITY IN CYP450 PHENOTYPING
NICHOLAS M. NJUGUNA - Ph.D. THESIS 2014
162
Since metabolism by CYP3A4 appeared to be universally significant for all 15 test
compounds regardless of which phenotyping method was used, data from this
enzyme was plotted to determine if correlation between CYP450 isoform mapping
and chemical inhibition phenotyping was improved by correcting for inhibitor cross-
reactivity (Figure 4.15 and Figure 4.16).
Figure 4.15: Correlation plot of fm,CYP3A using rhCYP3A4 and HLM + ketoconazole
before correction for inhibitor cross-reactivity
Figure 4.16: Correlation plot of fm,CYP3A data using rhCYP3A4 and HLM + ketoconazole
after correction for inhibitor cross-reactivity

CHAPTER 4: CHEMICAL INHIBITOR CROSS-REACTIVITY IN CYP450 PHENOTYPING
NICHOLAS M. NJUGUNA - Ph.D. THESIS 2014
163
The square of the Pearson correlation coefficient (r2) for fm,CYP3A data for the 15
test compounds from phenotyping using recombinant enzymes and chemical
inhibition with ketoconazole increased from 0.6305 to 0.8164 when corrected for
cross-inhibition.
Similar evaluation of the impact of cross-reactivity correction was carried out using
data obtained when azamulin had been used as the chemical inhibitor to determine
CYP3A contribution to metabolism. In this case, however, only 11 of the 15 test
compounds had been phenotyped using azamulin, and therefore fewer data points
were available for comparison against rCYP3A data.
Figure 4.17: Correlation plot of fm,CYP3A using rCYP3A4 and HLM + azamulin
before correction for inhibitor cross-reactivity
As observed with ketoconazole, cross-reactivity correction with azamulin also
appeared to improve the correlation between rCYP3A and chemical inhibition
phenotyping data, with the r2 value increasing from 0.2522 (Figure 4.17) to 0.6100
(Figure 4.18).

CHAPTER 4: CHEMICAL INHIBITOR CROSS-REACTIVITY IN CYP450 PHENOTYPING
NICHOLAS M. NJUGUNA - Ph.D. THESIS 2014
164
Figure 4.18: Correlation plot of fm,CYP3A using rCYP3A4 and HLM + azamulin after
correction for inhibitor cross-reactivity
A final comparison of the effect of correcting for inhibitor cross-reactivity involved
testing the improvement in correlation of fm,CYP3A among the same compounds
from the test set for which metabolic contribution of CYP3A isoform had been
determined using both azamulin and ketoconazole.
Table 4.10: Uncorrected fm,CYP3A values for compounds phenotyped using both azamulin and ketoconazole
fm,CYP3A (%)
Compound 1 2 3 4 6 7 8 9 10 12 13
Azamulin 24 72 92 78 99 94 100 100 54 62 80
Ketoconazole 33 77 80 75 100 88 99 100 75 55 71
r2 = 0.8509
Table 4.11: Modified fm,CYP3A values for compounds phenotyped using both azamulin and ketoconazole after correction for inhibitor cross-reactivity
Corrected fm,CYP3A (%)
Compound 1 2 3 4 6 7 8 9 10 12 13
Azamulin 29.9 70.1 100 74.5 84.8 97.5 100 100 100 36.2 63.9
Ketoconazole 29.3 73.6 100 74.9 85.3 96.9 100 100 100 18.8 64.4
r2 = 0.9734

CHAPTER 4: CHEMICAL INHIBITOR CROSS-REACTIVITY IN CYP450 PHENOTYPING
NICHOLAS M. NJUGUNA - Ph.D. THESIS 2014
165
The uncorrected CYP3A chemical inhibition values for the 11 compounds showed a
high degree of similarity even before the effects of inhibitor cross-reactivity were
taken into consideration. The two sets of data had a correlation coefficient (r2) of
0.8509 for fm,CYP3A. However, correction of the phenotyping data by factoring in
the cross-reactivity of both ketoconazole and azamulin markedly improved the
observed correlation to r2 = 0.9734, further illustrating the ability of the correction
calculation to minimise differences in the data sets.
4.10 Conclusions
The cross-reactivity experiments described in this Chapter confirmed the CYP450
enzyme inhibition activity of 7 out of the 8 chemical inhibitors routinely used in early
CYP450 metabolic phenotyping assays. All the compounds tested exhibited varying
degrees of cross-reactivity against different CYP450-mediated metabolic reactions
both in terms of the absolute number of reactions (or enzyme isoforms) affected, as
well as the degree to which the individual reactions were inhibited. Of the inhibitors
evaluated, only diethyldithiocarbamate exhibited poor potency against its
established marker metabolic probe reaction (i.e. conversion of chlorzoxazone to 6-
hydroxychlorzoxazone by CYP2E1). In contrast, all the other chemical inhibitors were
found to reduce the activity of each of their respective marker probe reactions by
between 86.8% and 97.2%. In addition, DETC was found to exhibit the highest
relative cross-inhibitory effect against the other CYP450 isoforms, inhibiting CYP1A2,
CYP2B6 and CYP2D6 to an even greater extent than its observed inhibition of
CYP2E1.
On the basis of absolute magnitude and number of cross-inhibitions observed from
the compounds evaluated, furafylline and sulfaphenazole appeared to be the most
selective of the CYP450 inhibitors tested. These two compounds were each found to
inhibit only one other metabolic reaction by more than 20%, in addition to inhibiting
their respective probe substrate biotransformations by almost 90%.
Evaluation of the effect of correcting for inhibitor cross-reactivity on CYP450 reaction
phenotyping data determined using different in vitro techniques for a set of 15 in-
house compounds was performed by calculating statistical correlation. Correction of
ketoconazole and azamulin cross-reactivity appeared to improve the correlation in

CHAPTER 4: CHEMICAL INHIBITOR CROSS-REACTIVITY IN CYP450 PHENOTYPING
NICHOLAS M. NJUGUNA - Ph.D. THESIS 2014
166
CYP3A phenotyping data separately determined using rCYP450 and HLM with
chemical inhibition. Additionally, it was also observed to improve the correlation of
fm,CYP3A data from microsomal chemical inhibition individually determined using
both ketoconazole or azamulin on the same set of test compounds.

CHAPTER 4: CHEMICAL INHIBITOR CROSS-REACTIVITY IN CYP450 PHENOTYPING
NICHOLAS M. NJUGUNA - Ph.D. THESIS 2014
167
REFERENCES:
(1) Wijnen, P. A. H. M.; Op den Buijsch, R. A. M.; Drent, M.; Kuijpers, P. M. J. C.;
Neef, C.; Bast, A.; Bekers, O.; Koek, G. H. The Prevalence and Clinical
Relevance of Cytochrome P450 Polymorphisms. Alimentary Pharmacology &
Therapeutics 2007, 26 Suppl 2, 211–219.
(2) Zhang, H.; Davis, C. D.; Sinz, M. W.; Rodrigues, A. D. Cytochrome P450
Reaction-Phenotyping: An Industrial Perspective. Expert Opinion on Drug
Metabolism & Toxicology 2007, 3, 667–687.
(3) Lu, A. Y. H.; Wang, R. W.; Lin, J. H. Cytochrome P450 In Vitro Reaction
Phenotyping: A Re-Evaluation of Approaches Used for P450 Isoform
Identification. Drug Metabolism and Disposition 2003, 31, 345–350.
(4) Krausz, K. W.; Goldfarb, I.; Buters, J. T. M.; Yang, T. J.; Gonzalez, F. J.; Gelboin,
H. V. Monoclonal Antibodies Specific and Inhibitory to Human Cytochromes
P450 2C8, 2C9, and 2C19. Drug Metabolism and Disposition 2001, 29, 1410–
1423.
(5) Harper, T. W.; Brassil, P. J. Reaction Phenotyping: Current Industry Efforts to
Identify Enzymes Responsible for Metabolizing Drug Candidates. The AAPS
Journal 2008, 10, 200–207.
(6) Crespi, C. L.; Miller, V. P. The Use of Heterologously Expressed Drug
Metabolizing Enzymes-State of the Art and Prospects for the Future.
Pharmacology & Therapeutics 1999, 84, 121–131.
(7) Madan, A.; Usuki, E.; Burton, L. A.; Ogilvie, B. W.; Parkinson, A. In Vitro
Approaches for Studying the Inhibition of Drug-Metabolizing Enzymes and
Identifying the Drug-Metabolizing Enzymes Responsible for the Metabolism of
Drugs. In Drug-Drug Interactions; Rodrigues, A. D., Ed.; Marcel Dekker, Inc:
New York, NY, 2002; pp. 217–294.
(8) Tucker, G. T.; Houston, J. B.; Huang, S. M. Optimizing Drug Development:
Strategies to Assess Drug Metabolism/transporter Interaction Potential-
CHAPTER 4: CHEMICAL INHIBITOR CROSS-REACTIVITY IN CYP450 PHENOTYPING
NICHOLAS M. NJUGUNA - Ph.D. THESIS 2014
168
toward a Consensus. Clinical Pharmacology and Therapeutics 2001, 70, 103–
114.
(9) Bjornsson, T. D.; Callaghan, J. T.; Einolf, H. J.; Fischer, V.; Gan, L.; Grimm, S.;
Kao, J.; King, S. P.; Miwa, G. T.; Ni, L.; Kumar, G.; McLeod, J.; Obach, R. S.;
Roberts, S.; Roe, A.; Shah, A.; Snikeris, F.; Sullivan, J. T.; Tweedie, D.; Vega, J.
M.; Walsh, J.; Wrighton, S. A. The Conduct of in Vitro and in Vivo Drug-Drug
Interaction Studies: A Pharmaceutical Research and Manufacturers of America
(PhRMA) Perspective. Drug Metabolism and Disposition 2003, 31, 815–832.
(10) Rodrigues, A. D. Integrated Cytochrome P450 Reaction Phenotyping.
Biochemical Pharmacology 1999, 57, 465–480.
(11) Proctor, N. J.; Tucker, G. T.; Rostami-Hodjegan, A. Predicting Drug Clearance
from Recombinantly Expressed CYPs: Intersystem Extrapolation Factors.
Xenobiotica 2004, 34, 151–178.
(12) Khojasteh, S. C.; Prabhu, S.; Kenny, J. R.; Halladay, J. S.; Lu, A. Y. H. Chemical
Inhibitors of Cytochrome P450 Isoforms in Human Liver Microsomes: A Re-
Evaluation of P450 Isoform Selectivity. European Journal of Drug Metabolism
and Pharmacokinetics 2011, 36, 1–16.
(13) Lu, C.; Miwa, G. T.; Prakash, S. R.; Gan, L.; Balani, S. K. A Novel Model for the
Prediction of Drug-Drug Interactions in Humans Based on in Vitro Cytochrome
p450 Phenotypic Data. Drug Metabolism and Disposition 2007, 35, 79–85.
(14) Yuan, R.; Madani, S.; Wei, X.-X.; Reynolds, K.; Huang, S.-M. Evaluation of
Cytochrome P450 Probe Substrates Commonly Used by the Pharmaceutical
Industry to Study in Vitro Drug Interactions. Drug Metabolism and Disposition
2002, 30, 1311–1319.
(15) Sesardic, D.; Boobis, A. R.; Murray, B. P.; Murray, S.; Segura, J.; de la Torre, R.;
Davies, D. S. Furafylline Is a Potent and Selective Inhibitor of Cytochrome
P450IA2 in Man. British Journal of Clinical Pharmacology 1990, 29, 651–663.

CHAPTER 4: CHEMICAL INHIBITOR CROSS-REACTIVITY IN CYP450 PHENOTYPING
NICHOLAS M. NJUGUNA - Ph.D. THESIS 2014
169
(16) Kunze, K. L.; Trager, W. F. Isoform-Selective Mechanism-Based Inhibition of
Human Cytochrome P450 1A2 by Furafylline. Chemical Research in Toxicology
1993, 6, 649–656.
(17) Eagling, V. A.; Tjia, J. F.; Back, D. J. Differential Selectivity of Cytochrome P450
Inhibitors against Probe Substrates in Human and Rat Liver Microsomes.
British Journal of Clinical Pharmacology 1998, 45, 107–114.
(18) Newton, D. J.; Wang, R. W.; Lu, A. Y. H. Evaluation of Specificities in the the in
Vitro Metabolism of Therapeutic Agents by Human Liver Microsomes. Drug
Metabolism and Disposition 1995, 23, 154–158.
(19) Maffrand, J.-P. The Story of Clopidogrel and Its Predecessor, Ticlopidine: Could
These Major Antiplatelet and Antithrombotic Drugs Be Discovered and
Developed Today? Comptes Rendus Chimie 2012, 15, 737–743.
(20) Ha-Duong, N.-T.; Dijols, S.; Macherey, A.-C.; Goldstein, J. A.; Dansette, P. M.;
Mansuy, D. Ticlopidine as a Selective Mechanism-Based Inhibitor of Human
Cytochrome P450 2C19 †. Biochemistry 2001, 40, 12112–12122.
(21) Hagihara, K.; Nishiya, Y.; Kurihara, A.; Kazui, M.; Farid, N. A.; Ikeda, T.
Comparison of Human Cytochrome P450 Inhibition by the Thienopyridines
Prasugrel, Clopidogrel, and Ticlopidine. Drug Metabolism and
Pharmacokinetics 2008, 23, 412–420.
(22) Turpeinen, M.; Tolonen, A.; Uusitalo, J.; Jalonen, J.; Pelkonen, O.; Laine, K.
Effect of Clopidogrel and Ticlopidine on Cytochrome P450 2B6 Activity as
Measured by Bupropion Hydroxylation. Clinical Pharmacology and
Therapeutics 2005, 77, 553–559.
(23) Turpeinen, M.; Nieminen, R.; Juntunen, T.; Taavitsainen, P.; Raunio, H.;
Pelkonen, O. Selective Inhibition of CYP2B6-Catalyzed Bupropion
Hydroxylation in Human Liver Microsomes in Vitro. Drug Metabolism and
Disposition 2004, 32, 626–631.
(24) Walsky, R. L.; Obach, R. S. A Comparison of 2-Phenyl-2-(1-Piperidinyl)propane
(ppp), 1,1’,1''-Phosphinothioylidynetrisaziridine (thioTEPA), Clopidogrel, and

CHAPTER 4: CHEMICAL INHIBITOR CROSS-REACTIVITY IN CYP450 PHENOTYPING
NICHOLAS M. NJUGUNA - Ph.D. THESIS 2014
170
Ticlopidine as Selective Inactivators of Human Cytochrome P450 2B6. Drug
Metabolism and Disposition 2007, 35, 2053–2059.
(25) Walsky, R. L.; Obach, R. S.; Gaman, E. A.; Gleeson, J.-P. R.; Proctor, W. R.
Selective Inhibition of Human Cytochrome P4502C8 by Montelukast. Drug
Metabolism and Disposition 2005, 33, 413–418.
(26) Otton, S. V.; Inaba, T.; Kalow, W. Competitive Inhibition of Sparteine Oxidation
in Human Liver by Β-Adrenoceptor Antagonists and Other Cardiovascular
Drugs. Life Sciences 1984, 34, 73–80.
(27) Ching, M. S.; Blake, C. L.; Ghabrial, H.; Ellis, S. W.; Lennard, M. S.; Tucker, G. T.;
Smallwood, R. A. Potent Inhibition of Yeast-Expressed CYP2D6 by
Dihydroquinidine, Quinidine, and Its Metabolites. Biochemical Pharmacology
1995, 50, 833–837.
(28) Pelkonen, O.; Maenpaa, J.; Taavitsainen, P.; Rautio, A.; Raunio, H. Inhibition
and Induction of Human Cytochrome P450 (CYP) Enzymes. Xenobiotica 1998,
28, 1203–1253.
(29) Pelkonen, O.; Turpeinen, M.; Hakkola, J.; Honkakoski, P.; Hukkanen, J.; Raunio,
H. Inhibition and Induction of Human Cytochrome P450 Enzymes: Current
Status. Archives of Toxicology 2008, 82, 667–715.
(30) Chang, T. K. H.; Gonzalez, F. J.; Waxman, D. J. Evaluation of
Triacetyloleandomycin, Α-Nasymphthoflavone and Diethyldithiocarbamate as
Selective Chemical Probes for Inhibition of Human Cytochromes P450.
Archives of Biochemistry and Biophysics 1994, 311, 437–442.
(31) Guengerich, F. P.; Kim, D. H.; Iwasaki, M. Role of Human Cytochrome P-450
IIE1 in the Oxidation of Many Low Molecular Weight Cancer Suspects.
Chemical Research in Toxicology 1991, 4, 168–179.
(32) Greenblatt, D. J.; Zhao, Y.; Venkatakrishnan, K.; Duan, S. X.; Harmatz, J. S.;
Parent, S. J.; Court, M. H.; von Moltke, L. L. Mechanism of Cytochrome P450-
3A Inhibition by Ketoconazole. The Journal of Pharmacy and Pharmacology
2011, 63, 214–221.

CHAPTER 4: CHEMICAL INHIBITOR CROSS-REACTIVITY IN CYP450 PHENOTYPING
NICHOLAS M. NJUGUNA - Ph.D. THESIS 2014
171
(33) Venkatakrishnan, K.; von Moltke, L. L.; Greenblatt, D. J. Effects of the
Antifungal Agents on Oxidative Drug Metabolism: Clinical Relevance. Clinical
Pharmacokinetics 2000, 38, 111–180.
(34) Obach, R. S.; Walsky, R. L.; Venkatakrishnan, K.; Gaman, E. A.; Houston, J. B.;
Tremaine, L. M. The Utility of in Vitro Cytochrome P450 Inhibition Data in the
Prediction of Drug-Drug Interactions. The Journal of Pharmacology and
Experimental Therapeutics 2006, 316, 336–348.
(35) Stresser, D. M.; Broudy, M. I.; Ho, T.; Cargill, C. E.; Blanchard, A. P.; Sharma, R.;
Dandeneau, A. A.; Goodwin, J. J.; Turner, S. D.; Erve, J. C. L.; Patten, C. J.;
Dehal, S. S.; Crespi, C. L. Highly Selective Inhibition of Human CYP3A in Vitro by
Azamulin and Evidence That Inhibition Is Irreversible. Drug Metabolism and
Disposition 2004, 32, 105–112.

CHAPTER 5: SUMMARY, CONCLUSIONS AND RECOMMENDATIONS
NICHOLAS M. NJUGUNA - Ph.D. THESIS 2014
172
CHAPTER FIVE:
SUMMARY, CONCLUSIONS AND RECOMMENDATIONS FOR FUTURE
WORK
5.1 Summary and Conclusions
A virtual database of 335 natural products was designed, created and populated with
compounds isolated from medicinal plants reported in the African Herbal
Pharmacopoeia. The chemical space of these compounds was mapped by conducting
statistical comparisons of their ‘drug-like properties’ against those for 608
conventional drug molecules selected from the British Pharmacopoeia 2009. The in
silico profiling data showed that the chemical space of the natural products was
significantly different from that of synthetic drugs with regard to molecular weight,
rotatable bonds and H-bond donor distributions but not with regard to lipophilicity
(cLogP) and H-bond acceptor distributions. In general, the natural products were
found to exhibit a higher degree of deviation from Lipinski’s ‘Rule-of-Five’. The
observations based on evaluation of the five physico-chemical parameters outlined
above were further confirmed using 2D principle component analysis based on a
more comprehensive in silico prediction of 196 properties for the natural product
and BP 2009 compound datasets. Again using in silico tools to identify structural
alerts in the different compound sets, the natural products appeared to possess a
slightly greater number of structural alerts per molecule (1.18) compared to
conventional drugs (0.99), suggesting that they might be more prone to metabolic
bioactivation.
Although used principally as a repository for compound data from which predictions
of physico-chemical properties of natural products could be made, the natural
products database created in this work could conceivably serve as a starting point for
a larger collection of compounds not restricted to monographs from the African
Herbal Pharmacopoeia. Even in its current unexpanded format, the compounds in
the database could be used in ligand or structure based virtual screening to identify
potential hits against known pharmacological targets or in docking studies to predict
binding to known protein drug targets.

CHAPTER 5: SUMMARY, CONCLUSIONS AND RECOMMENDATIONS
NICHOLAS M. NJUGUNA - Ph.D. THESIS 2014
173
Evaluation of a set of 15 natural product and natural product-derived compounds for
in vitro bioactivation was conducted using a combination of CYP450 enzyme
inactivation assays and reactive metabolite trapping experiments. Of the major
recombinant CYP450 drug metabolizing isoforms screened, CYP3A4 was found to be
most prone to inhibition by the test compounds. This phenomenon was presumably
due to the fact that the active site of CYP3A4 is relatively large and capable of
accommodating a broad array of substrates possessing diverse chemical scaffolds.
Among the compounds screened for enzyme inhibition, GEDN, JSTN and JMCN were
the most potent CYP3A4 inhibitors with GEDN in particular also exhibiting potent
inhibition of CYP2C19. Although the observed inhibition of CYP3A4 by these three
compounds was significant, assays to determine their normalized inhibition ratios
indicated that the reactions were not time-dependent and therefore unlikely to be
due to reactive metabolite-mediated mechanism-based inactivation of the enzyme.
These results were further validated by the fact that inclusion of reduced glutathione
in the assays had no effect on the observed inhibition of the enzyme. Inhibition of
the other main drug metabolising CYP450 isoforms (i.e. CYP1A2, CYP2C9 and
CYP2C19) was markedly less pronounced, with only one or two compounds reducing
enzyme activity by up to 50% at the lower assay concentration in all cases.
Direct assessment of the formation of reactive metabolic intermediates was
conducted by incubating 11 of the 15 compounds in microsomal preparations
fortified with nucleophilic trapping agents. None of the test compounds appeared to
form detectable reactive intermediates that could be trapped using reduced
glutathione. On the other hand, however, using methoxylamine as the trapping
agent, metabolic incubations of the monosubstituted furan ring-containing
compounds GEDN and the tetraol DC3 were found to contain components strongly
suspected to be trapped reactive metabolites. Despite its structural similarity to DC3,
the α,β-unsaturated cyclic ketone DC14 did not appear to form reactive metabolic
intermediates that could be trapped using methoxylamine. This observation was
presumably partly due to the relatively lower ability of DC14 to interact with enzyme
amino acid residues via H-bonding owing to the presence of far fewer hydroxyl
groups compared to DC3. Only MTGN possessed the structural features necessary to

CHAPTER 5: SUMMARY, CONCLUSIONS AND RECOMMENDATIONS
NICHOLAS M. NJUGUNA - Ph.D. THESIS 2014
174
undergo bioactivation resulting in formation of reactive iminium ion intermediates.
However, absence of detectable trapped adducts in microsomal incubations fortified
with potassium cyanide as the trapping agent suggested that metabolic bioactivation
did not occur as hypothesized.
The results from in vitro bioactivation assays highlighted the difficulties of predicting
reactive metabolite formation based only on the presence of structural alerts in
substrate molecules. Despite most of the tested natural products bearing a potential
structural liability that could easily be detected using in silico tools, their metabolic
liability did not appear to be supported by in vitro results. In the case of DC14 and
DC3, for example, in vitro data seemed to contradict the expected greater risk of
bioactivation of DC14 compared to DC3 based on the greater number of structural
alerts present in the former (2) compared to the latter (1). The set of compounds
studied cannot realistically be used as a basis for drawing concrete conclusions
regarding the bioactivation potential of natural products in general, owing to its
limited size. However, the results obtained seemed to suggest that bioactivation
risks might be more accurately predicted on the basis of the type of structural alert
present on the test compound, rather than by the absolute number of structural
alerts present in the molecule.
Evaluation of the cross-reactivity of eight chemical inhibitors commonly used in early
CYP450 phenotyping assays confirmed the relatively high selectively of furafylline
and sulfaphenazole while conversely revealing the low selectivity of ticlopidine and
diethyldithiocarbamate. These experiments also highlighted the particularly low
potency of diethylthiocarbamate as the routinely preferred inhibitor for determining
the contribution of hepatic CYP2E1 to xenobiotic metabolism. The data obtained
provided good evidence for the need to identify and characterise a superior
replacement inhibitor for CYP2E1 phenotyping.
The compound data set used to test the hypothesis that factoring-in inhibitor cross-
reactivity in CYP450 phenotyping calculations could improve the correlation of data
obtained from different phenotyping approaches was of limited size. Consequently,
it was not possible to confirm the statistical significance of improvement in CYP450

CHAPTER 5: SUMMARY, CONCLUSIONS AND RECOMMENDATIONS
NICHOLAS M. NJUGUNA - Ph.D. THESIS 2014
175
phenotyping correlation for the majority of enzyme isoforms for which inhibitor
cross-reactivity was evaluated. In the case of CYP3A4, however, there were
sufficient, albeit few, data points to provide evidence that consideration of inhibitor
cross-reactivity in fm,CYP3A4 calculations appeared to improve phenotyping data
correlation. Improvement in the fm,CYP3A4 correlation was observed both between
data values obtained using different CYP3A4 chemical inhibitors (i.e. ketoconazole
and azamulin) as well as with hepatic microsome+chemical inhibitor-derived vs
recombinant enzyme-determined fm,CYP3A4 values.
From a pharmaceutical industry DMPK perspective, the potential to improve CYP450
phenotyping by correcting for inhibitor cross-reactvity offers an opportunity of
eliminating the need to use multiple phenotyping techniques as is currently the
norm, when conducting routine CYP450 phenotyping. Having a single method that is
validated to provide consistent and accurately correlated data would contribute in
reducing the time, cost and effort needed to assess the metabolic fate of drug leads
during development, without compromising on the accuracy of such assessments.
5.2 Recommendations for Future Work
Of the natural products tested for in vitro bioactivation in this work, GEDN, CLPG,
JMCN and JSTN were each found to be potent inhibitors of at least one of the four
CYP450 enzyme isoforms involved in drug metabolism (i.e. CYP1A2, CYP2C9,
CYP2C19 and CYP3A4). However, since the enzyme inhibition assays carried out in
this project were designed more for use in rapid screening of large compound sets to
identify potential bioactivation liabilities early, comprehensive determination of IC50
values was not carried out. It might therefore be of interest to conduct further work
aimed at determining the enzyme inhibition characteristics of these specific
compounds and establish the mode in which they curtail enzyme activity i.e. is the
observed inhibition competitive, non-competitive, uncompetitive or mixed.
Although the natural products mentioned above inhibited recombinant CYP450
enzymes in vitro, the actual impact of such inhibition in vivo is difficult to predict
although the potential for herb-drug interaction exists. Based on data obtained in

CHAPTER 5: SUMMARY, CONCLUSIONS AND RECOMMENDATIONS
NICHOLAS M. NJUGUNA - Ph.D. THESIS 2014
176
this work, it might be of particular interest to investigate, possibly in vivo using an
animal model, the effect of co-administration of these natural products on the
metabolism of conventional drug substrates of the CYP450 isoforms affected. For
example, the impact of inhibition of CYP2C19 and CYP3A4 by Gedunin in neem
extract in patients also taking the prophylactic antimalarial proguanil, which is
metabolised to its active form (cycloguanil) by these two isoforms, could be
investigated both in vitro and in vivo using the pure natural product or the
standardized crude plant extract.
The trapped reactive intermediates detected from microsomal incubations of GEDN
and DC3 with methoxylamine were hypothesized to arise from bioactivation of the
furan-ring, based on cited literature. Isolation and actual characterisation of these
intermediates using spectroscopic techniques such as NMR would provide structural
data that could more conclusively shed light on the actual bioactivation mechanism
involved and the molecular structure of the stable adducts detected using LC-MS. A
key consideration in successful implementation of such an enterprise would involve
the need to generate a sufficient amount of the trapped intermediate possibly
through scaling-up of metabolic incubations to facilitate comprehensive structure
elucidation.
Another area for possible exploration regarding the formation of reactive
metabolites from GEDN and DC3 would be to determine the specific enzyme
isoform(s) responsible for the suspected bioactivation by conducting enzyme
phenotyping assays modified to incorporate trapping agents.
The consideration of chemical inhibitor cross-reactivity in routine in vitro CYP450
phenotyping calculations offers potential advantages from a drug development
perspective, not least in significantly reducing the time and effort taken to obtain
reliable CYP450 phenotyping data without compromising accuracy and integrity.
Inasmuch as the data obtained from this work showed promise in application,
several other considerations require further investigation to develop this approach
as a robust cross-reactivity compensation strategy. For example, testing the cross-
reactivity of the different inhibitors evaluated under a range of concentrations below
and above their established Ki or IC50 values would provide greater insights on the
actual impact of cross-reactivity. Furthermore, in order to gauge the true impact of

CHAPTER 5: SUMMARY, CONCLUSIONS AND RECOMMENDATIONS
NICHOLAS M. NJUGUNA - Ph.D. THESIS 2014
177
compensating for chemical inhibitor cross-reactivity, the correlation of a much larger
data set of compounds tested using traditional CYP450 isoform mapping and
uncorrected chemical inhibition would need to be compiled and computed, and
preferably include as many of the main drug metabolising CYP450 isoforms as
possible.
The cross-reactivity data obtained in this work highlighted the particularly poor
potency and low selectivity of diethyldithiocarbamate (DETC), underscoring the need
to identify and characterise the enzyme inhibition properties of superior substitute
CYP2E1 chemical inhibitors. Based on the potent enzyme inhibition activities
observed from the few natural products studied in this work, it might be worthwhile
to consider the search for new selective inhibitors for CYP2E1 phenotyping from
among existing natural product libraries.
CHAPTER 6: EXPERIMENTAL
NICHOLAS M. NJUGUNA - Ph.D. THESIS 2014
178
CHAPTER SIX:
EXPERIMENTAL
6.1 Reagents and Solvents
All commercially available analytical grade chemicals and reagents were purchased
from Sigma Aldrich. HPLC grade acetonitrile and methanol for mobile phase
preparation were purchased from Romil Ltd (Cambridge, UK). Analytical grade
solvents including hexane, dichloromethane, ethyl acetate, acetone, methanol and
ethanol were purchased from Kimix Chemicals (Eppindust, South Africa) and used
without further purification. Ultra purified water for in vitro assays was prepared in-
house using a Millipore Direct-Q®3 laboratory water purification system (Millipore
SAS, Molsheim, France).
6.2 Turbidimetric Solubility1
Solubility of the test compounds was determined using the turbidimetric method
described by Bevan and Lloyd.2 Stock solutions of test and control compounds were
prepared by dissolving an accurately weighed amount of each in HPLC-grade DMSO
to a 10 mM concentration.
Predilutions of the stock solutions, also in DMSO, were then prepared in clear, v-
shaped bottom 96-well polystyrene microtitre plates. For this, each stock solution
was diluted serially in triplicate by first pipetting 20 µL DMSO into wells in row G on
the plate and 50 µL DMSO to the wells in the rows above (i.e. rows F, E, D…A). 80 µL
of the 10 mM stock solutions was then pipetted to the wells in row G and mixed to
give a starting concentration of 8 mM (100 µL). Serial dilution of this solution was
achieved by subsequently transferring 50 µL to the well in the row above (row F),
mixing and then repeating this sequence to wells from row F through to B. The final
predilution concentrations obtained ranged from 0.25 mM (Row B) to 8.0 mM (Row
G). All wells in row A contained only DMSO with no compound present, while those
in row H contained the undiluted 10 mM stock solution as illustrated in Figure 6.1.

CHAPTER 6: EXPERIMENTAL
NICHOLAS M. NJUGUNA - Ph.D. THESIS 2014
179
Compound 1 (in triplicate) Compound 2 (in triplicate)…
Conc (mM) 1 2 3 4 5 6
0.00 A 0.25 B 0.50 C 1.00 D 2.00 E 4.00 F 8.00 G 10.00 (stock) H
Figure 6.1: Turbidimetric solubility assay pre-dilution plate set-up
From each pre-dilution solution, secondary dilutions of the compounds in both
DMSO and 0.01M pH 7.4 phosphate buffered saline (PBS) were prepared in a second
96-well plate, also in triplicate (Figure 6.2). Wells in columns 1-6 contained the test
compound dissolved in DMSO while those in columns 7-12 contained samples in PBS
at similar nominal concentrations. Because compounds were tested in triplicate, only
two (2) could be accommodated on each plate.
Conc (µM)
DMSO 0.01M pH 7.4 PBS
Cmpd 1 (tripl) Cmpd 2 (tripl) Cmpd 1 (tripl) Cmpd 2 (tripl)
1 2 3 4 5 6 7 8 9 10 11 12
0.0 A 5.0 B
10.0 C 20.0 D
40.0 E 80.0 F
160.0 G 200.0 H
Figure 6.2: Turbidimetric assay plate lay-out
The final volume of solution in the assay plate wells was 200 µL, prepared by
pipetting 4 µL each of solution from the pre-dilution plate to the corresponding well
into both DMSO and PBS (both 196 µL). The final concentration of DMSO in the PBS
aqueous buffer preparations was therefore 2% v/v.
The concentrations of test compounds in DMSO served as controls for determining
potential false turbidimetric absorbance readings arising from the compounds in
solution absorbing radiation at the analysis wavelength.

CHAPTER 6: EXPERIMENTAL
NICHOLAS M. NJUGUNA - Ph.D. THESIS 2014
180
The plates were covered and left to equilibrate for 2 hours at ambient room
temperature. After incubation, UV-VIS absorbance readings were measured at 620
nm using a SpectraMax 340PC384 microplate reader (Molecular Devices, Sunnydale,
CA). Absorbance from the wells containing only DMSO and 2%v/v DMSO in PBS (i.e.
denoted as 0.0 µM in plate layout, Row A) served as controls and blanks.
Obstruction of incident radiation by particles of the test compounds that crashed out
of solution at concentrations in excess of the limit of solubility, denoted by an
increase in the apparent absorbance measurement, was used as the basis for
determining approximate compound solubility.
6.3 Physical and Spectroscopic Characterization
Melting points were determined using a Reichert-Jung Thermovar hot stage
microscope based on methods described by Kofler and Kofler and are reported as
uncorrected values.3,4
1H NMR spectral data was recorded on a Varian Mercury (300MHz), a Varian Unity
(400 MHz) or a Bruker Ultrashield-Plus (400MHz) spectrometer. All NMR samples
were dissolved in deuterated chloroform (CDCl3) or dimethylsulfoxide (DMSO-d6)
with tetramethylsilane (TMS) as the internal standard. 13C NMR spectral data were
recorded on the same instruments at 100 MHz. Chemical shifts (δ) are reported in
parts per million (ppm) downfield with reference to the internal standard
tetramethylsilane. Coupling constants (J) are reported in Hertz (Hz). The
abbreviations used in assigning 1H-NMR signals are: d (doublet), dd (doublet of
doublets), m (multiplet), q (quartet), s (singlet) or t (triplet).
6.4 Chromatography
6.4.1 Thin Layer Chromatography
Preliminary natural product compound purity checks and reactions in the synthesis
of CYP450 fluorogenic probe substrates were monitored on aluminium-backed, pre-
coated thin layer chromatography (TLC) plates and visualized under ultraviolet light
at 254 nm and 366 nm or by spraying with a detection solution of ninhydrin in
acidified ethanol.

CHAPTER 6: EXPERIMENTAL
NICHOLAS M. NJUGUNA - Ph.D. THESIS 2014
181
6.4.2 Flash Column Chromatography
Compound purification was achieved using automated low pressure flash column
chromatography carried out on a Biotage Isolera™ Prime Flash Chromatography
system (Biotage AB, Uppsala, Sweden). Compound separation and elution were
monitored on the in-built dual wavelength UV-detector. Separations were achieved
on 25 g Biotage SNAP™ cartridges packed with 40-65 µm diameter KP-Sil normal
silica particles as stationary phase.
6.4.3 High Performance Liquid Chromatography
6.4.3.1 System 1 and 2 - Compound purity and molecular mass checks
The purities of the synthesized fluorogenic enzyme probe substrates and natural
products were determined using HPLC using either of two chromatographic systems.
System 1 was a SpectraSERIES™ HPLC (Thermo Separations Products, Waltham, MA,
USA) consisting of a SpectraSERIES P200 mobile phase pump, SpectraSERIES AS100
autosampler equipped with a 20 µL sample loop and a SpectraSERIES UV100
variable wavelength UV detector. Data processing on this system was performed on
an interfaced desktop PC running Delta Chromatography Data System software
(version 5.0, DataworX Pty Ltd., Kangaroo Point, QLD, Australia).
HPLC system 2 was used for both purity checks and low resolution molecular weight
determination. This system consisted of an Agilent 1260 Infinity HPLC with a UV-
photodiode array detector and coupled to an Agilent 6120 single quadrupole multi-
mode ion source mass spectrometer (Agilent Technologies, Santa Clara, CA, USA).
Instrument control and data processing on this system was achieved using an
interfaced desktop PC running OpenLAB CDS Chemstation Edition software (rev.
c.01.05, Agilent Technologies, Santa Clara, CA, USA).
For purity determinations using either system, approximately 1 mg of test compound
was dissolved in 1 mL HPLC grade MeOH, filtered through a 0.22 µm nylon syringe
filter and the filtrate injected into the chromatograph for analysis.

CHAPTER 6: EXPERIMENTAL
NICHOLAS M. NJUGUNA - Ph.D. THESIS 2014
182
6.4.3.2 System 3 - Reactive metabolite trapping experiments
Analysis of reactive metabolite trapping experiment incubation samples was carried
out using LC-MS on system 3 comprising an Agilent 1200 Rapid Resolution HPLC
system coupled to an API4000Q Triple Quadrupole Linear Ion Trap mass
spectrometer equipped with a Turbo V® ion source with an installed electrospray
interface (AB Sciex, Framingham, MA, USA). The liquid chromatography system
consisted of a binary gradient pump equipped with a solvent degassing unit, an
autosampler with a chilled sample tray maintained at 4 °C, column compartment set
at 40 °C and UV-photodiode array detector programmed to scan UV wavelengths
over 200 - 400 nm. Instrument control and data processing was achieved by means
of an integrated desktop PC running AB Sciex Analyst™ software (ver. 1.5).
6.4.3.3 System 4 - CYP450 phenotyping chemical inhibitor cross-reactivity assays
Analysis of microsomal incubations to determine the cross-reactivity of CYP450
isoform inhibitors was carried out using LC-MS on system 4 composed of a Rheos
2200 microflow HPLC pump equipped with an online degasser (Flux Instruments
GmbH & Co KG, Basel, Switzerland) coupled to a Triple Quadrupole Micromass
Quattro Ultima Pt Mass Spectrometer detector (Waters Corporation, Milford, MA,
USA). Automated sample injection was achieved by means of a PAL HTS
autosampler equipped with a 20 µL sample loop (CTC Analytics AG, Swingen,
Switzerland) with the sample tray maintained at 14 °C. The chromatographic column
was maintained at 30 °C by means of a heated column oven (Jones Chromatography
Ltd, Mid Glamorgan, UK) Programmable control of the gradient pump was achieved
using an interfaced desktop computer running Janeiro II software while control of
the mass spectrometer was performed using MassLynx software (v.4.1, Waters
Corp., Milford, MA, USA).

CHAPTER 6: EXPERIMENTAL
NICHOLAS M. NJUGUNA - Ph.D. THESIS 2014
183
6.4.3.4 HPLC and LC-MS chromatographic conditions
The chromatographic conditions and methods used to analyse samples using each of
the systems described above are summarized in Table 6.1.
Table 6.1: Chromatographic method conditions used for HPLC and LC-MS sample analysis
System
Mobile Phase Gradient Flow Rate/ Column A B
Time (min)
% A %B
1 5% AcN: 95% H20
5% H20: 95% AcN
0.0 7.0 10.0 12.0 15.0
100 0 0 100 100
0 100 100 0 0
700 µL/min Luna® C18, 150 x 4.6 mm, 3 μm, 100Å (Phenomenex, Torrance, CA, USA)
2
10 mM NH4OAc pH 3.7 in H2O
10 mM NH4OAc pH 3.7 in 90% MeOH
0.0 0.5 2.5 6.0 6.1 8.0
90 90 10 10 90 90
10 10 90 90 10 10
1.0 mL/min Zorbax Poroshell 120, C18 2.7 µm 3.0 x 50 mm (Agilent Technologies, Santa Clara, CA, USA)
3
5 mM HCOONH4 pH 3.0 in 5% AcN
5 mM HCOONH4 pH 3.0 in 95% AcN
0.0 9.0 12.0 12.1 15.0
100 0 0 100 100
0 100 100 0 0
400 µL/min Kinetex C18, 150 x 2.1 mm, 2.6 µm, 100 Å (Phenomenex, Torrance, CA, USA)
4A
0.1% HCOOH in H20
0.1% HCOOH in AcN
Isocratic 70 30 100 µL/min Micro-bore Luna® Phenyl-Hexyl, 50 x 1.0 mm, 3 µm (Phenomenex, Torrance, CA, USA)
4B
0.0 0.5 2.0 4.0 4.2 8.0
85 85 5 5 85 85
15 15 95 95 15 15

CHAPTER 6: EXPERIMENTAL
NICHOLAS M. NJUGUNA - Ph.D. THESIS 2014
184
6.5 rCYP450 Enzyme Inhibition Assays
6.5.1 Direct CYP450 Inhibition Assay
CYP450 fluorometric inhibition assays were conducted according to the method of
Crespi et al.5 Purified isoforms of recombinant human CYP450 and CYP450-reductase
enzymes co-expressed in Escherichia coli were obtained from Cypex Limited
(Dundee, Scotland, UK). rCYP450 enzyme control inhibitors were purchased from
Sigma Aldrich (St. Louis, MO, USA). The fluorogenic probe substrates for monitoring
enzyme activity were synthesized as described in this work (see Appendices).
Fluorescence readings were measured either using a Wallac Victor2™ Multilabel
Counter (Wallac AB, Oxfordhuset, Upplands Vasby, Sweden) or Varian Cary Eclipse
Fluorescence Spectrophotometer (Varian GmbH, Darmstadt, Germany). Both
instruments were equipped with 96-well microplate readers. Test preparations were
incubated at 37 °C in a Memmert INE 500 natural convection incubator (Memmert
GmbH + Co. KG, Schwabach, Germany).
Incubations were carried out in black 96-well Corning® Costar® microtiter plates for
readings measured using the Wallac Victor2™ and in white 96-well Nunc™ microtitre
plates for readings using the Cary Eclipse spectrophotometer.
The following general procedure was used: An incubation master mix was prepared
by adding ice cold ultra-pure water, 0.2 M pH 7.4 mixed potassium phosphate buffer,
flourogenic probe substrate and recombinant enzyme, in that order, to a clean
mixing tube. Solutions of 1000 µM and 150 µM test compound were prepared by
appropriately diluting in 25% acetonitrile from 10 mM stock solutions of each
prepared in DMSO.
Aliquots of 186 µL master mix were transferred to all the 96 wells and 4 µL of either
diluted positive control inhibitor, test compound solution or 25% acetonitrile solvent
as blank was added to appropriate wells of the incubation plate. The plate was pre-
incubated for 15 min at 37 °C before adding 10 µL of 20 mM NADPH to all wells
except the blanks to initiate the metabolic reaction. The final incubation
concentrations for the test compounds were 3 µM and 20 µM in a volume of 200 µL
per well. The plate was incubated for a further 30 min at 37 °C after addition of
NADPH and the reaction terminated by adding 75 μL of an ice-cold solution of 1 mM

CHAPTER 6: EXPERIMENTAL
NICHOLAS M. NJUGUNA - Ph.D. THESIS 2014
185
Tris in 80% AcN. 10 µL of 20 mM NADPH was added to the wells containing blanks.
Fluorescence was measured at appropriate excitation and emission wavelengths.
The final incubation plate setup was as illustrated in Figure 6.3. Detailed incubation
preparations for the various CYP450 enzymes tested for inhibition are summarized in
Table 6.2 - Table 6.5.
Figure 6.3: Incubation plate set-up for rCYP450 inhibition assays
1 2 3 4 5 6
A Blank Control Inhibitor Low
Inhibitor High
Cmpd 1 3 µM
Cmpd 1 20 µM
B Blank Control Inhibitor Low
Inhibitor High
Cmpd 1 3 µM
Cmpd 1 20 µM
C
D
E
F
G
H Note: Incubations were performed in duplicate on adjacent rows. Only solvent containing no compound (25% AcN) was added to the master mix in wells marked blank and control. Different control inhibitors were used for different enzymes and incubated at a concentration greater than and lower than established IC50 value.
Results of enzyme inhibition by the positive control were used as the basis for
determining assay validity. The criteria used were as follows: at low positive control
concentration, enzyme inhibition must not be > 25%, while at high concentration,
inhibition was expected to be > 75%.
CYP3A4 inhibition assays in the presence of reduced glutathione were set-up exactly
as described above with the only difference being that 5 µL of 40 mM GSH was
substituted for the same volume of distilled water in each well.

CHAPTER 6: EXPERIMENTAL
NICHOLAS M. NJUGUNA - Ph.D. THESIS 2014
186
Table 6.2: Summary incubation setup for CYP1A2 inhibition assay
All volumes refer to µL/well
Distilled H2O
pH 7.4 -PO4
3- BUFFER
CEC (in 40% AcN) rCYP1A2
Control Inhibitor Lo
Control Inhibitor Hi
Test Cmpd Lo
Test Cmpd Hi NADPH
Prepared as Master Mix α-naphthaflavone
(in 25% AcN) Diluted in 25% AcN Stock Concentration - 0.2 M 120 µM 13.3 pmol/µL 0.05 µM 0.5 µM 150 µM 1000 µM 20 mM
Incubation Concentration - 0.1 M 3 µM 0.5 pmol/well 0.001 µM 0.01 µM 3 µM 20 µM 1 mM
Blank Incubation 80.96 100.00 5.00 0.04 - - 4 (25% AcN) 10.00
Control Incubation 80.96 100.00 5.00 0.04 - - 4 (25% AcN) 10.00
Inhibitor Low 80.96 100.00 5.00 0.04 4.00 - - - 10.00
Inhibitor High 80.96 100.00 5.00 0.04 - 4.00 - - 10.00
Test Compound Low 80.96 100.00 5.00 0.04 - - 4.00 - 10.00
Test Compound High 80.96 100.00 5.00 0.04 - - - 4.00 10.00
Fluorimeter Settings Excitation/Emission λ (nm) 405/460
Table 6.3: Summary incubation setup for rCYP2C9 inhibition assay
All volumes refer to µL/well
Distilled H2O
pH 7.4 -PO4
3- BUFFER
MFC (in 40% AcN) rCYP2C9
Control Inhibitor Lo
Control Inhibitor Hi
Test Cmpd Lo
Test Cmpd Hi NADPH
Prepared as Master Mix Sulphafenazole (25% AcN) Diluted in 25% AcN Stock Concentration - 0.2 M 3.4 mM 2.1 pmol/µL 5 µM 50 µM 150 µM 1000 µM 20 mM
Incubation Concentration - 0.1 M 0.085 mM 5 pmol/well 0.1 µM 1 µM 3 µM 20 µM 1 mM
Blank Incubation 80.96 100.00 5.00 2.38 - - 4 (25% AcN) 10.00
Control Incubation 80.96 100.00 5.00 2.38 - - 4 (25% AcN) 10.00
Inhibitor Low 80.96 100.00 5.00 2.38 4.00 - - - 10.00
Inhibitor High 80.96 100.00 5.00 2.38 - 4.00 - - 10.00
Test Compound Low 80.96 100.00 5.00 2.38 - - 4.00 - 10.00
Test Compound High 80.96 100.00 5.00 2.38 - - - 4.00 10.00
Fluorimeter Settings Excitation/Emission λ (nm) 405/535

CHAPTER 6: EXPERIMENTAL
NICHOLAS M. NJUGUNA – DRAFT Ph.D. THESIS 2014
187
Table 6.4: Summary incubation setup for rCYP2C19 inhibition assay
All volumes refer to µL/well
Distilled H2O
pH 7.4 -PO4
3- BUFFER
MFC (in 40% AcN) rCYP2C19
Control Inhibitor Lo
Control Inhibitor Hi
Test Cmpd Lo
Test Cmpd Hi NADPH
Prepared as Master Mix Ticlopidine (in 25% AcN) Diluted in 25% AcN Stock Concentration - 0.2 M 1400 µM 5.5 pmol/µL 50 µM 500 µM 150 µM 1000 µM 20 mM
Incubation Concentration - 0.1 M 35 µM 2 pmol/well 1 µM 10 µM 3 µM 20 µM 1 mM
Blank Incubation 80.96 100.00 5.00 0.36 - - 4 (25% AcN) 10.00
Control Incubation 80.96 100.00 5.00 0.36 - - 4 (25% AcN) 10.00
Inhibitor Low 80.96 100.00 5.00 0.36 4.00 - - - 10.00
Inhibitor High 80.96 100.00 5.00 0.36 - 4.00 - - 10.00
Test Compound Low 80.96 100.00 5.00 0.36 - - 4.00 - 10.00
Test Compound High 80.96 100.00 5.00 0.36 - - - 4.00 10.00
Fluorimeter Settings Excitation/Emission λ (nm) 405/535
Table 6.5: Summary incubation setup for rCYP3A4 inhibition assay
All volumes refer to µL/well
Distilled H2O
pH 7.4 -PO4
3- BUFFER
BFC (in 40% AcN) rCYP3A4
Control Inhibitor Lo
Control Inhibitor Hi
Test Cmpd Lo
Test Cmpd Hi NADPH
Prepared as Master Mix Ketoconazole (in 25% AcN) Diluted in 25% AcN Stock Concentration - 0.2 M 400 µM 3.9 pmol/ µL 0.5 µM 5.0 µM 150 µM 1000 µM 20 mM
Incubation Concentration - 0.1 M 10 µM 2 pmol/well 0.01 µM 0.1 µM 3 µM 20 µM 1 mM
Blank Incubation 80.96 100.00 5.00 0.51 - - 4 (25% AcN) 10.00
Control Incubation 80.96 100.00 5.00 0.51 - - 4 (25% AcN) 10.00
Inhibitor Low 80.96 100.00 5.00 0.51 4.00 - - - 10.00
Inhibitor High 80.96 100.00 5.00 0.51 - 4.00 - - 10.00
Test Compound Low 80.96 100.00 5.00 0.51 - - 4.00 - 10.00
Test Compound High 80.96 100.00 5.00 0.51 - - - 4.00 10.00
Fluorimeter Settings Excitation/Emission λ (nm) 405/535

CHAPTER 6: EXPERIMENTAL
NICHOLAS M. NJUGUNA - Ph.D. THESIS 2014
188
6.5.2 Time-Dependent CYP3A4 Inhibition Assay
The assay to determine time-dependent inhibition of rCYP3A4 involved two
incubations as described here.
6.5.2.1 Inactivation assay
A volume of 85 µL master mix comprising 0.1 M mixed phosphate buffer and rCYP3A4
was added to wells in a 96-well microtitre plate. A 5 µL solution of either test or
control compound was added to wells in columns 1 - 4 and 7 - 8 of the plate in
duplicate while plain solvent (25% AcN) was added to wells in columns 5, 6, 11 and 12.
The plate was pre-incubated at 37 °C for 10 minutes before adding 10 µL of distilled
water to all wells in columns 1 - 6 and 10 µL of 10 mM NADPH in wells in columns 7 -
12.The plate was then further incubated for 15 min at 37 °C. Test and control
compounds were incubated at final concentrations of 1 µM and 5 µM in wells
containing 5 pmol of enzyme each (Figure 6.4).
Figure 6.4: Inactivation assay plate lay-out for rCYP3A4 TDI assay
NO NADPH + NADPH
1 µM 5 µM - - 1 µM 5 µM - -
1 2 3 4 5 6 7 8 9 10 11 12
A Cpd 1 Cpd 1 Cpd 1 Cpd 1 Cntrl Blank Cpd 1 Cpd 1 Cpd 1 Cpd 1 Cntrl Blank
B Cpd 2 Cpd 2 Cpd 2 Cpd 2 Cntrl Blank Cpd 2 Cpd 2 Cpd 2 Cpd 2 Cntrl Blank
C …etc …etc …etc …etc …etc …etc …etc …etc …etc …etc …etc …etc
D
6.5.2.2 Activity assay
To a second 96-well microtitre plate, 170 µL of a master mix comprising 520 µM
fluorogenic enzyme substrate BFC in 0.1 M mixed phosphate buffer pH 7.4 was added
to all wells and warmed for 5 min at 37 °C. A 20 µL aliquot was transferred from each
well in the inactivation assay plate, described in Section 6.5.2.1 above, to the
corresponding well in the activity plate containing the fluorogenic substrate. A further
10 µL aliquot of 20 mM NADPH solution was added to all wells except those marked as
blanks and the plate incubated for 15 min at 37 °C. The incubation was terminated by
adding 75 µL ice-cold stop solution to all wells and adding 10 µL NADPH to the wells
containing blanks. Fluorescence measurements were taken at the specific wavelengths
highlighted before and the results analysed as described previously to calculate the
Normalized Inhibition Ratios.6

CHAPTER 6: EXPERIMENTAL
NICHOLAS M. NJUGUNA - Ph.D. THESIS 2014
189
6.6 Reactive Metabolite Trapping Experiments
Incubations to trap reactive metabolic intermediates were performed in 1.5 mL
microcentrifuge Eppendorf® tubes using a generic procedure adopted from methods
described previously in the literature.7–9 Human liver microsomes (20 mg protein/mL,
mixed gender, pooled from 50 individuals) and rat liver microsomes (20 mg
protein/mL, male, pooled from 400 individuals) were sourced from Xenotech LLC
(Kansas, USA). Positive control substrates rimonabant hydrochloride and prazosin
hydrochloride were obtained from Proactive Molecular Research (Alachua, FL) while
amodiaquine hydrochloride dihydrate, potassium cyanide, reduced glutathione and
methoxylamine hydrochloride were all purchased from Sigma-Aldrich Chemie GmBH
(Schnelldorf, Germany).
6.6.1 Microsomal Incubation Conditions
Test compounds were dissolved in DMSO to prepare 10 mM stock solutions and
incubated separately at a concentration of 10 µM in 0.1M mixed phosphate buffer pH
7.4 containing 5 mM MgCl2, 1 mM nucleophilic trapping agent (KCN, GSH or
methoxylamine) and 1 mg/mL human (or rat) liver microsomes. The metabolic
incubations were initiated, following 5 min pre-incubation at 37 °C, by addition of 20
mM NADPH to a final concentration of 1 mM. Total incubation volume per sample was
200 µL. Incubations in which individual components were omitted from the
preparation i.e. test compound, trapping agent, HLM or NADPH were included to serve
as controls. The incubation tubes were maintained at 37 °C in a shaking water bath set
at 50 rpm with the preparations exposed to atmospheric oxygen throughout.
Metabolic reactions were terminated after 60 min by addition of 200 µL ice-cold
acetonitrile to precipitate microsomal proteins. The incubation tubes were then placed
on ice for 10 min and subsequently centrifuged at 14,000 rpm in a chilled centrifuge at
4 °C for 15 min. The recovered supernatants was filtered through 0.22 um PTFE syringe
filters and analysed on LC-MS.
6.6.2 LC-MS Analysis of Trapped Reactive Metabolite Samples
Filtered supernatant solutions of the incubation preparations were analysed using LC-
MS using the system and chromatographic conditions described in Section 6.4.3.4
above. Detection of trapped reactive metabolites was carried out using different mass

CHAPTER 6: EXPERIMENTAL
NICHOLAS M. NJUGUNA - Ph.D. THESIS 2014
190
spectral scanning modes including enhanced mass spectral (EMS) scans over a range of
m/z values in either positive or negative ion mode, neutral loss and enhanced product
ion scans for detection of glutathione adducts in particular. The ionisation source
conditions were optimised by direct infusion of test compounds dissolved in 5 mM
ammonium formate pH 3.0 in 50% AcN to a concentration of 0.5 µg/mL at a flow rate
of 10 µL/min injected into the ion source using a HA11 syringe pump (Harvard
Apparatus, Holliston, MA, USA).
Optimised ion source conditions for the detection of test compounds are summarised
in Table 6.6.
Table 6.6: Optimized ion source conditions for LC-MS analysis of reactive metabolite trapping incubations
Ionisation Mode
Polarity Temp. (°C) Ion Spray Voltage (V)
Declustering Potential (V)
Gedunin APCI + 500 - 111
Metergoline ESI + 400 5500 111
DC3 ESI + 400 5000 66
DC14 ESI + 400 5000 86
Justicidin A ESI + 550 5200 91
Jamaicin ESI + 500 5000 116
SQTL ESI + 500 5000 71
CLPG ESI + 500 5000 91
Formononetin ESI + 300 4000 66
Fusidic acid ESI - 100 -3500 -105
CUC-B ESI + 500 5000 51

CHAPTER 6: EXPERIMENTAL
NICHOLAS M. NJUGUNA - Ph.D. THESIS 2014
191
6.7 CYP450 Phenotyping Chemical Inhibitor Cross-Reactivity Assays
Microsomal incubations to determine the cross-reactivity of CYP450 phenotyping
chemical inhibitors were performed in 1.5 mL polypropylene Eppendorf™
microcentrifuge tubes. Predilutions of probe substrates of each of the eight CYP450
reactions monitored were prepared from stock solutions of different concentrations
stored at -20 °C by diluting in water to working concentrations 40× higher than final
incubation concentrations. For each incubation, 0.5 M pH 7.4 mixed phosphate buffer
(BD Gentest, Oxford, UK) and 50 mM MgCl2 were both diluted to a working
concentration of 0.1 M and 5 mM respectively by adding an appropriate volume of
HPLC grade water. Human liver microsomes (mixed gender, pooled from 150
individuals) were added to the buffer mixture to varying protein concentrations
depending on the probe reaction and the pre-diluted (40×) probe substrate pipetted
into the master mix. For test incubations, the chemical inhibitor under evaluation for
cross reactivity was then added to the mixture while only the dilution solvent was
added to the control incubations. The mixtures were pre-incubated at 37 °C for 10 min
and the metabolic reactions initiated by addition of NADPH. All reactions were
performed in duplicate and the tubes maintained at 37 °C while exposed to
atmospheric oxygen by means of an Eppendorf ThermoMixer™ F1.5 benchtop
incubator shaking at 300 rpm. The durations of the microsomal incubations were
optimised for each probe substrate and selected to ensure that metabolism did not
exceed 20%.
Incubations were terminated by addition of 50% formic acid solution (10 µL per 100 µL
incubation volume). A precise amount of 13C or 2H radiolabelled metabolite was added
to the preparations to serve as internal standard and the samples subsequently
purified using solid phase extraction. The purified eluents from SPE were loaded into a
2 mL deep-well plate, evaporated to dryness under a stream of nitrogen at 40 °C and
then dissolved in a mixture of 10% AcN in HPLC-grade water containing 0.1% formic
acid. The resultant solutions were analyzed using LC-MS System 4 (Section 6.4.3.3) to
quantify the probe metabolites. The mass spectrometer was operated in multiple
reaction monitoring mode (MRM) at a source temperature of 120 °C and desolvation
temperature of 300 °C. Analysis parameters for the different analytes are summarized
in Table 6.7.

CHAPTER 6: EXPERIMENTAL
NICHOLAS M. NJUGUNA - Ph.D. THESIS 2014
192
Table 6.7: LC-MS Parameter settings for detection and quantification of chemical inhibitor cross reactivity
Probe substrate
metabolites Ionisation
Mode
MRM Transitions
Q1/Q3 (m/z) Internal Standards
IS MRM Transitions
Q1/Q3 (m/z)
Cone Voltage (V)
Collision Energy (eV)
LC Method Conditions
‡
CYP1A2 Acetaminophen ESI + 152.1/110.1 [2H4] Acetaminophen 156.0/114.0 34 16 4A
CYP2B6 Hydroxybupropion ESI + 256.0/139.0 [2H6] Hydroxybupropion 262.0/139.0 24 18 4B
CYP2C8 6α-Hydroxypaclitaxel ESI + 870.1/286.1 Warfarin 309.2/163.05 25 (20)* 16 (14)
† 4B
CYP2C9 4’-Hydroxydiclofenac ESI + 312.1/230.0 [13
C6] 4’-Hydroxydiclofenac 319.0/237.0 20 32 4B
CYP2C19 4’-Hydroxymephenytoin ESI - 233.05/190.05 [2H3] 4’-OH-mephenytoin 236.15/193.05 58 (56)
* 15 4A
CYP2D6 1’-Hydroxybufuralol ESI + 278.2/186.05 [2H9] 1’-Hydroxybufuralol 287.2/186.0 20 18 4B
CYP2E1 6-Hydroxychlorzoxazone ESI - 183.9/119.95 [2H3] 4’-OH-mephenytoin 236.15/193.05 58 (56)
* 20 (15)
† 4A
CYP3A 1’-Hydroxymidazolam ESI + 342.1/203.5 [2H4] 1’-Hydroxymidazolam 346.1/203.05 40 24 4A
Note: * and
† denote different cone voltage and collision energy values used to detect each metabolite and internal standard, respectively. Values in parentheses are
the settings used to detect the internal standard. In all other instances, the single values indicated were optimal for detection of both metabolites and internal standard. ‡ Denotes LC-MS chromatographic conditions as described in Table 6.1

CHAPTER 6: EXPERIMENTAL
NICHOLAS M. NJUGUNA - Ph.D. THESIS 2014
193
193
REFERENCES:
(1) Lipinski, C. A.; Lombardo, F.; Dominy, B. W.; Feeney, P. J. Experimental and
Computational Approaches to Estimate Solubility and Permeability in Drug
Discovery and Development Settings. Advanced Drug Delivery Reviews 2001,
46, 3–26.
(2) Bevan, C. D.; Lloyd, R. S. A High-Throughput Screening Method for the
Determination of Aqueous Drug Solubility Using Laser Nephelometry in
Microtiter Plates. Analytical Chemistry 2000, 72, 1781–1787.
(3) McCrone, W. C. Application of Fusion Methods in Chemical Microscopy.
Analytical Chemistry 1949, 21, 436–441.
(4) Vitez, I. M.; Newman, A. W.; Davidovich, M.; Kiesnowski, C. The Evolution of
Hot-Stage Microscopy to Aid Solid-State Characterizations of Pharmaceutical
Solids. Thermochimica Acta 1998, 324, 187–196.
(5) Crespi, C. L.; Miller, V. P.; Penman, B. W. Microtiter Plate Assays for Inhibition
of Human, Drug-Metabolizing Cytochromes P450. Analytical Biochemistry
1997, 248, 188–190.
(6) Thelingwani, R. S.; Zvada, S. P.; Dolgos, H.; Ungell, A.-L. B.; Masimirembwa, C.
M. In Vitro and in Silico Identification and Characterization of Thiabendazole
as a Mechanism-Based Inhibitor of CYP1A2 and Simulation of Possible
Pharmacokinetic Drug-Drug Interactions. Drug Metabolism and Disposition
2009, 37, 1286–1294.
(7) Argoti, D.; Liang, L.; Conteh, A.; Chen, L.; Bershas, D.; Yu, C.-P.; Vouros, P.;
Yang, E. Cyanide Trapping of Iminium Ion Reactive Intermediates Followed by
Detection and Structure Identification Using Liquid Chromatography-Tandem
Mass Spectrometry (LC-MS/MS). Chemical Research in Toxicology 2005, 18,
1537–1544.
(8) Bergström, M. A.; Isin, E. M.; Castagnoli, N.; Milne, C. E. Bioactivation
Pathways of the Cannabinoid Receptor 1 Antagonist Rimonabant. Drug
Metabolism and Disposition 2011, 39, 1823–1832.

CHAPTER 6: EXPERIMENTAL
NICHOLAS M. NJUGUNA - Ph.D. THESIS 2014
194
(9) Erve, J. C. L.; Vashishtha, S. C.; DeMaio, W.; Talaat, R. E. Metabolism of
Prazosin in Rat, Dog, and Human Liver Microsomes and Cryopreserved Rat and
Human Hepatocytes and Characterization of Metabolites by Liquid
Chromatography/tandem Mass Spectrometry. Drug Metabolism and
Disposition 2007, 35, 908–916.

APPENDICES
NICHOLAS M. NJUGUNA - Ph.D. THESIS 2014
A1
APPENDIX 1:
EXPERIMENTALLY DETERMINED PHYSICO-CHEMICAL PROPERTIES OF TEST COMPOUNDS
Mwt LC-MS-DAD †Melting
Point (°C) Solubility
(µM) (m/z)* Peak
Purity
Gedunin 482.57 483.2; 505.1 96.9% 192 - 196 20 - 40
Justicidin A 394.37 395.0; 417.0 99.5% 248 - 252 10 - 20
Dehydrobrachylaenolide 244.29 267.1; 245.0 98.6% 225 - 228 > 200
Metergoline 403.52 404.1; 426.1 97.9% 143 - 145 80 - 160
Fusidic acid 516.71 539.2 97.3% 178 - 180 > 200
Muzigadial 248.32 271.1 99.1% 125 - 128 > 200
Muzi-04 305.37 306.1; 328.1 99.5% 249 - 252 20 - 40
Cucurbitacin A 574.70 597.2; 613.1 96.5% 195 - 197 > 200
Cucurbitacin B 558.70 581.2; 597.2 98.4% 172 - 175 > 200
Cucurbitacin C 560.72 583.2 95.7% 198 - 201 > 200
DC3 352.47 353.1 98.4% 218 - 220 > 200
DC14 316.43 317.2; 339.1 97.9% 112 - 115 > 200
Jamaicin 378.37 379.0; 401.0 96.2% 156 - 158 ND‡
Calopogonium isoflavone 334.37 335.1; 357.0 96.3% 136 - 139 ND‡
Formononetin 268.26 269.0; 291.0 98.9% 250 - 254 20 - 40
Note: *Compound peak signals in low resolution LC-MS mass spectra were detected as adducts of
H+ and/or Na
+ (i.e. [MH]
+ = M+1 and [M+Na
+] = M+23) and in a few cases, as [M+K
+]
i.e. M+39;
†Melting point values are uncorrected and reported as determined;
‡Not determined. Quantities of jamaicin and calopogonium isoflavone were insufficient for
determination of solubility

APPENDICES
NICHOLAS M. NJUGUNA - Ph.D. THESIS 2014
A2
APPENDIX 2:
DESIGN AND SYNTHESIS OF FLUOROGENIC CYP450 PROBE SUBSTRATES
Four fluorogenic probe substrates were synthesized, purified and characterised for
use in testing inhibition of CYP450 enzymes by the natural products described in
Chapter 3.
7-Methoxy-4-(trifluoromethyl)coumarin (MFC) and 7-Benzyloxy-4-(trifluoromethyl)
coumarin (BFC)
The respective fluorogenic probe substrates for assessing inhibition of the
recombinant CYP2C9 and CYP2C19 (MFC), and CYP3A4 (BFC) were each synthesized
from commercially sourced 7-hydroxy-4-(trifluoromethyl)coumarin (HFC) via a single
step Williamson ether synthesis as summarized in Scheme A.1.
Scheme A.1: Reagents and conditions for the synthesis of MFC and BFC (i) Iodomethane, K2CO3, DMF,
25 °C, 8h (ii) Benzylbromide, K2CO3, THF, reflux, 12h
7-methoxy-4-(trifluoromethyl) coumarin (MFC)
Commercially sourced 7-hydroxy-4-(trifluoromethyl) coumarin (100 mg, 0.43 mmol)
was dissolved in 3 mL anhydrous N,N-dimethylformamide and K2CO3 (125 mg, 0.90
mmol) added. To the stirred mixture, iodomethane (55 µL, 127 mg, 0.89 mmol) was
introduced using a micropipette and the solution stirred at room temperature for 8
h. Progress of the reaction was monitored by TLC. The reaction was quenched by
adding 15 mL distilled water and extracted with 3 x 25 mL portions of ethyl acetate.
The combined extracts were dried over anhydrous MgSO4, concentrated in vacuo
and purified in a silica gel cartridge using automated flash chromatography to obtain
the target compound.
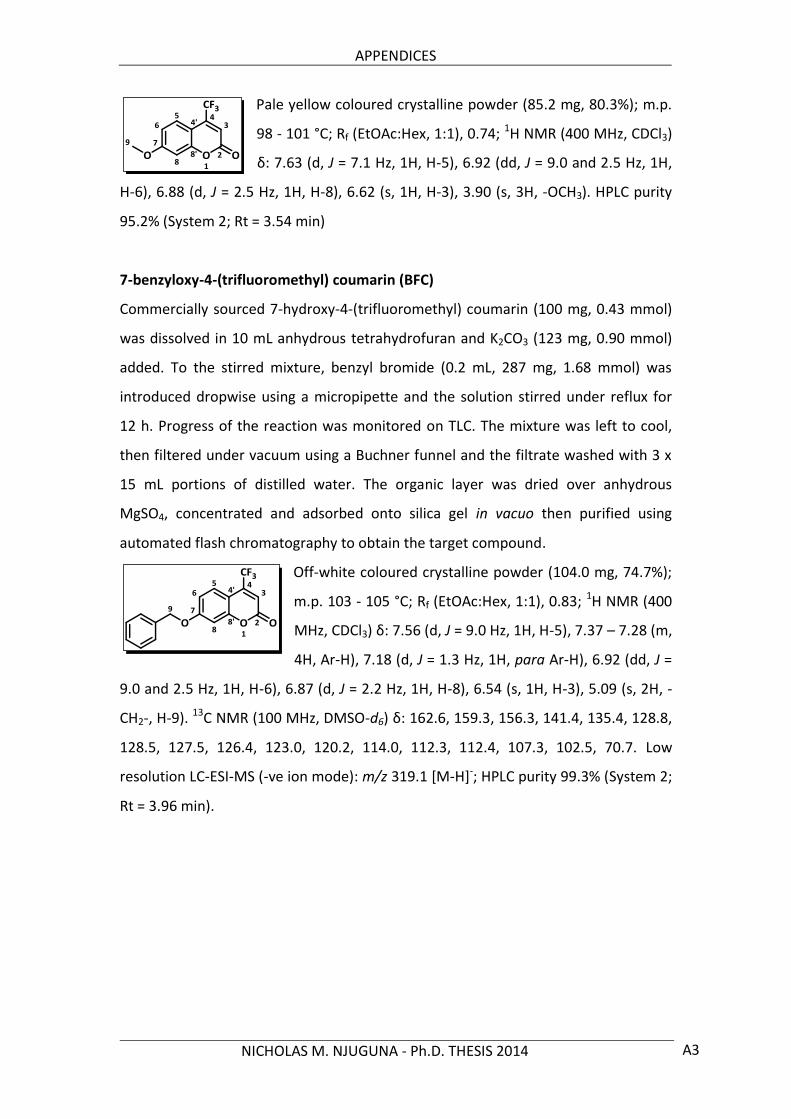
APPENDICES
NICHOLAS M. NJUGUNA - Ph.D. THESIS 2014
A3
Pale yellow coloured crystalline powder (85.2 mg, 80.3%); m.p.
98 - 101 °C; Rf (EtOAc:Hex, 1:1), 0.74; 1H NMR (400 MHz, CDCl3)
δ: 7.63 (d, J = 7.1 Hz, 1H, H-5), 6.92 (dd, J = 9.0 and 2.5 Hz, 1H,
H-6), 6.88 (d, J = 2.5 Hz, 1H, H-8), 6.62 (s, 1H, H-3), 3.90 (s, 3H, -OCH3). HPLC purity
95.2% (System 2; Rt = 3.54 min)
7-benzyloxy-4-(trifluoromethyl) coumarin (BFC)
Commercially sourced 7-hydroxy-4-(trifluoromethyl) coumarin (100 mg, 0.43 mmol)
was dissolved in 10 mL anhydrous tetrahydrofuran and K2CO3 (123 mg, 0.90 mmol)
added. To the stirred mixture, benzyl bromide (0.2 mL, 287 mg, 1.68 mmol) was
introduced dropwise using a micropipette and the solution stirred under reflux for
12 h. Progress of the reaction was monitored on TLC. The mixture was left to cool,
then filtered under vacuum using a Buchner funnel and the filtrate washed with 3 x
15 mL portions of distilled water. The organic layer was dried over anhydrous
MgSO4, concentrated and adsorbed onto silica gel in vacuo then purified using
automated flash chromatography to obtain the target compound.
Off-white coloured crystalline powder (104.0 mg, 74.7%);
m.p. 103 - 105 °C; Rf (EtOAc:Hex, 1:1), 0.83; 1H NMR (400
MHz, CDCl3) δ: 7.56 (d, J = 9.0 Hz, 1H, H-5), 7.37 – 7.28 (m,
4H, Ar-H), 7.18 (d, J = 1.3 Hz, 1H, para Ar-H), 6.92 (dd, J =
9.0 and 2.5 Hz, 1H, H-6), 6.87 (d, J = 2.2 Hz, 1H, H-8), 6.54 (s, 1H, H-3), 5.09 (s, 2H, -
CH2-, H-9). 13C NMR (100 MHz, DMSO-d6) δ: 162.6, 159.3, 156.3, 141.4, 135.4, 128.8,
128.5, 127.5, 126.4, 123.0, 120.2, 114.0, 112.3, 112.4, 107.3, 102.5, 70.7. Low
resolution LC-ESI-MS (-ve ion mode): m/z 319.1 [M-H]-; HPLC purity 99.3% (System 2;
Rt = 3.96 min).

APPENDICES
NICHOLAS M. NJUGUNA - Ph.D. THESIS 2014
A4
3-Cyano-7-ethoxycoumarin (CEC)
CEC was synthesized as the probe substrate for monitoring the inhibition of CYP1A2.
Preparation of this compound involved the initial synthesis, via a ‘green’
Knoevenagel condensation of malononitrile with 2,4-dihydroxybenzaldehyde in
aqueous medium followed by Williamson etherification of the resultant 3-cyano-7-
hydroxycoumarin intermediate. The steps in this reaction are illustrated in Scheme
A.2.
Scheme A.2: Reagents and conditions for the synthesis of CEC (i) 0.05M aq. NaHCO3, 25 °C, 1.5h
(ii) Conc. HCl, 90 °C, 1h (iii) Bromoethane, K2CO3, DMF, 25 °C, 12h
3-Cyano-7-hydroxycoumarin
To a 25 mL aqueous solution of 0.05M NaHCO3, 2,4-dihydroxybenzaldehyde (680 mg,
4.92 mmol) and malononitrile (400 mg, 6.05 mmol) were added and stirred
vigorously at room temperature for 1.5 h. 0.6 mL concentrated HCl was then added
to the reaction and the heterogenous mixture heated at 90 °C for 1 h. The mixture
was cooled and the desired compound recovered by filtration under vacuum using a
Buchner funnel before drying at 50 °C to afford the target compound.
Brown/red powder (842.4 mg, 91.4%); m.p. 269 - 272°C; Rf
(EtOAc:Hex, 1:1), 0.18; 1H NMR (400 MHz, DMSO-d6) δ 11.29 (s,
broad, 1H, -OH), 8.75 (s, 1H, H-4), 7.63 (d, J = 8.6 Hz, 1H, H-5),
6.88 (dd, 1H, J = 8.6 and 2.3 Hz, H-6), 6.77 (d, J = 2.2 Hz, 1H, H-8). 13C NMR (100 MHz,
DMSO-d6) δ: 165.3 (C-7), 158.0 (C-2), 157.1 (C-8’), 153.8 (C-4), 131.8 (C-5), 115.7 (-
CN), 115.1 (C-6), 110.8 (C-4’), 103.0 (C-8), 96.5 (C-3). Low resolution LC-ESI-MS (-ve
ion mode): m/z 186.1 [M-H]-; HPLC purity 98.3% (System 2; Rt = 2.55 min).

APPENDICES
NICHOLAS M. NJUGUNA - Ph.D. THESIS 2014
A5
3-cyano-7-ethoxycoumarin (CEC)
3-cyano-7-hydroxycoumarin (200 mg, 1.07 mmol) was dissolved in 3 mL anhydrous
N,N-dimethylformamide to which K2CO3 (300 mg, 2.17 mmol) was added. To the
stirred mixture, bromoethane (0.2 mL, 292 mg, 2.68 mmol) was introduced using a
syringe and the solution stirred at room temperature for 12 h. Progress of the
reaction was monitored by TLC. The mixture was quenched by adding 15 mL distilled
water and extracted with 3 x 25 mL portions of ethyl acetate. The combined extracts
were dried over anhydrous MgSO4, concentrated in vacuo and purified in a silica gel
cartridge using automated flash chromatography to obtain the target compound.
Pale yellow coloured crystalline powder (122 mg, 53.2%);
m.p. 201 - 204°C; Rf (EtOAc:Hex, 1:1), 0.41; 1H NMR (400
MHz, DMSO-d6) δ: 8.81 (s, 1H, H-4), 7.71 (d, J = 8.6 Hz, 1H, H-
5), 7.07 (d, J = 2.3 Hz, 1H, H-8), 7.03 (dd, J = 8.4 and 2.1 Hz, 1H, H-6), 4.19 (q, J = 7.0
Hz, 2H, -CH2-), 1.35 (t, J = 7.0 Hz, 3H, -CH3). 13C NMR (100 MHz, DMSO-d6) δ: 165.2 (C-
7), 157.9 (C-2), 157.1 (C-8’), 153.7 (C-4), 131.8 (C-5), 115.5 (-CN), 114.6 (C-6), 111.7
(C-4’), 101.9 (C-8), 97.8 (C-3), 65.2 (C-9), 14.7 (C-10). Low resolution LC-ESI-MS (+ve
ion mode): m/z 216.1 [M+H]+; 233.1 [M+NH4]+; 238.0 [M+Na]+ HPLC purity 97.4%
(System 2; Rt = 3.14 min).
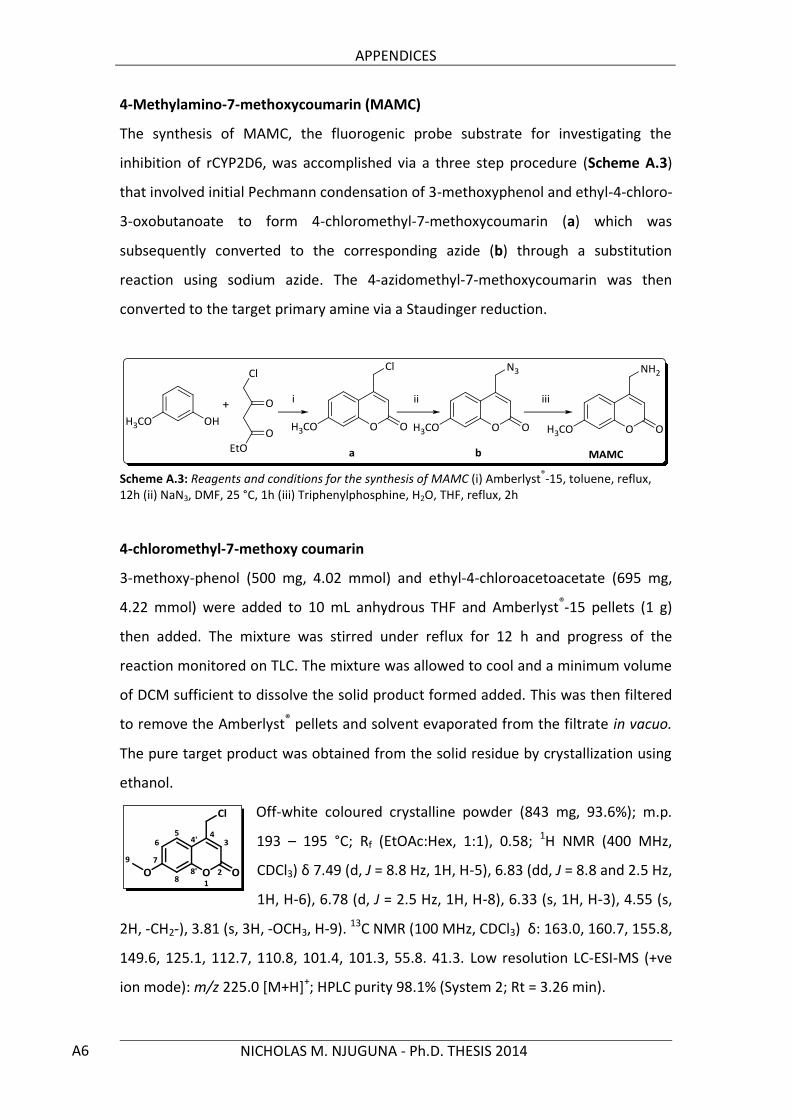
APPENDICES
NICHOLAS M. NJUGUNA - Ph.D. THESIS 2014
A6
4-Methylamino-7-methoxycoumarin (MAMC)
The synthesis of MAMC, the fluorogenic probe substrate for investigating the
inhibition of rCYP2D6, was accomplished via a three step procedure (Scheme A.3)
that involved initial Pechmann condensation of 3-methoxyphenol and ethyl-4-chloro-
3-oxobutanoate to form 4-chloromethyl-7-methoxycoumarin (a) which was
subsequently converted to the corresponding azide (b) through a substitution
reaction using sodium azide. The 4-azidomethyl-7-methoxycoumarin was then
converted to the target primary amine via a Staudinger reduction.
Scheme A.3: Reagents and conditions for the synthesis of MAMC (i) Amberlyst
®-15, toluene, reflux,
12h (ii) NaN3, DMF, 25 °C, 1h (iii) Triphenylphosphine, H2O, THF, reflux, 2h
4-chloromethyl-7-methoxy coumarin
3-methoxy-phenol (500 mg, 4.02 mmol) and ethyl-4-chloroacetoacetate (695 mg,
4.22 mmol) were added to 10 mL anhydrous THF and Amberlyst®-15 pellets (1 g)
then added. The mixture was stirred under reflux for 12 h and progress of the
reaction monitored on TLC. The mixture was allowed to cool and a minimum volume
of DCM sufficient to dissolve the solid product formed added. This was then filtered
to remove the Amberlyst® pellets and solvent evaporated from the filtrate in vacuo.
The pure target product was obtained from the solid residue by crystallization using
ethanol.
Off-white coloured crystalline powder (843 mg, 93.6%); m.p.
193 – 195 °C; Rf (EtOAc:Hex, 1:1), 0.58; 1H NMR (400 MHz,
CDCl3) δ 7.49 (d, J = 8.8 Hz, 1H, H-5), 6.83 (dd, J = 8.8 and 2.5 Hz,
1H, H-6), 6.78 (d, J = 2.5 Hz, 1H, H-8), 6.33 (s, 1H, H-3), 4.55 (s,
2H, -CH2-), 3.81 (s, 3H, -OCH3, H-9). 13C NMR (100 MHz, CDCl3) δ: 163.0, 160.7, 155.8,
149.6, 125.1, 112.7, 110.8, 101.4, 101.3, 55.8. 41.3. Low resolution LC-ESI-MS (+ve
ion mode): m/z 225.0 [M+H]+; HPLC purity 98.1% (System 2; Rt = 3.26 min).

APPENDICES
NICHOLAS M. NJUGUNA - Ph.D. THESIS 2014
A7
4-azidomethyl-7-methoxy coumarin
4-chloromethyl-7-methoxy coumarin (275 mg, 1.2 mmol) was dissolved in 2 mL
anhydrous DMF and sodium azide (90 mg, 1.4 mmol) added portion wise. The
mixture was stirred at room temperature for 1 h and monitored by TLC. The reaction
was quenched by adding 15 mL distilled water and the resultant solution extracted
using 3 x 15 mL portions of ethyl acetate. The combined organic extracts were dried
over anhydrous MgSO4 and the solvent evaporated under vacuum to afford the
target compound.
Reddish-brown powder (256 mg, 90.4%); m.p. 124 - 126 °C; Rf
(EtOAc:Hex, 1:1), 0.52; 1H NMR (400 MHz, CDCl3) δ: 7.36 (d, J =
8.7 Hz, 1H, H-5), 6.82 - 6.78 (m, 2H, H-6, H-8), 6.28 (t, J = 1.2 Hz,
1H, H-3), 4.43 (d, J = 1.2 Hz, 2H, -CH2-), 3.81 (s, 3H, -OCH3, H-9). 13C NMR (100 MHz,
CDCl3) δ: 163.0, 160.6, 155.8, 148.6, 124.8, 112.7, 111.6, 110.8, 101.3, 55.8, 50.9.
Low resolution LC-ESI-MS (+ve ion mode): m/z 232.0 [M+H]+; HPLC purity 96.4%
(System 2; Rt = 3.27 min).
4-methylamino-7-methoxycoumarin (MAMC)
4-azidomethyl-7-methoxy coumarin (200 mg, 0.86 mmol) was dissolved in 5 mL THF
to which triphenyl phosphine (450 mg, 1.72 mmol) and 0.5 mL H2O were added. The
mixture was stirred under reflux for 2 h and monitored by TLC using both UV and
ninhydrin detection. The solution was cooled then concentrated by evaporating the
solvent under vacuum and the product purified by flash silica column
chromatography to afford the target compound.
Pale yellow coloured crystalline solid. (76 mg, 42%); m.p. 121 -
124 °C; Rf (DCM:MeOH, 9:1), 0.51; 1H NMR (400 MHz, DMSO-d6)
δ: 7.67 (d, J = 8.8 Hz, 1H, H-5), 6.97 (d, J = 2.4 Hz, 1H, H-8), 6.92
(dd, J = 8.8 and 2.4 Hz, 1H, H-6), 6.38 (s, 1H, H-3), 3.91 (s, 2H, -CH2-), 3.84 (s, 3H, -
OCH3), 1.98 (broad, s, 2H, -NH2). 13C NMR (100 MHz, DMSO-d6) δ: 162.6, 161.2,
158.6, 155.2, 125.9, 112.5, 112.1, 108.7, 101.3, 56.3, 42.1. Low resolution LC-ESI-MS
(+ve ion mode): m/z 206.1 [M+H]+; HPLC purity 96.7% (System 2; Rt = 1.45 min)