co2/ch4 separation by means of matrimid hollow fibre membranes
TRANSCRIPT
ORIGINAL ARTICLE
CO2/CH4 separation by means of Matrimid hollow fibremembranes
Francesco Falbo1 • Adele Brunetti1 • Giuseppe Barbieri1 • Enrico Drioli1,2 •
Franco Tasselli1
Received: 24 November 2014 / Accepted: 15 June 2016 / Published online: 5 July 2016
� The Author(s) 2016. This article is published with open access at Springerlink.com
Abstract CO2/CH4 mixtures separation was investigated
using Matrimid�5218 hollow fibre membranes and mea-
suring the membrane flux feeding singly CH4 and CO2 and
their mixtures, with CH4 concentration ranging from 5 to
70 %molar. Specific attention was paid to membrane prop-
erties at a high temperature (up to 75 �C) and feeding
humidified streams, not yet particularly investigated, in a
pressure range 400–600 kPa. The membrane properties
were restored when water vapour was removed and tem-
perature decreased stating the excellent hydro-thermal
stability of these membranes. Maps of the separation per-
formance were also calculated for a range of operating
conditions wider than the experimental one paying specific
attention to the feed/permeate pressure ratio further to
membrane selectivity and permeance. Single and multi-
stage membrane separation systems were investigated
using these maps. The prepared Matrimid�5218 hollow
fibres showed very good performance in terms of flux and
selectivity for temperatures up to 60 �C, also in steam
saturated conditions, allowing a methane concentration
meeting the specification for its injection into the grid.
Keywords CO2/CH4 separation � Hollow fibre membrane �Matrimid�5218 � Membrane performance maps
Introduction
CO2 is significantly present in mixtures where CH4 is the
major and valuable component. CH4 is largely utilized fuel
for domestic and automotive uses, electricity and power
generation, owing to its large production and after its
concentration [1]. Natural gas mainly contains CH4
(60–90 %) and undesired compound such as CO2 (4–35 %)
and H2O (5–10 %) [2, 3]. CH4 (50–70 %), CO2 (30–50 %)
and H2O (5–10 %) are the main components of biogas [4].
The presence of CO2 not only reduces the calorific power,
but increases the costs for gas compression and transport.
The removal of CO2 from CH4 mixtures is, thus, very
important in several industrial processes such as biogas
upgrading or natural gas sweetening. To fit the targets for
injecting the gas into the natural gas grid [1, 5], CO2
concentration has to be lowered down to ca. 2–4 %
(Table 1) [6–8]. In addition, a cleaning process is required
for the removal of the other inert (e.g. N2), dangerous (e.g.
H2O) and trace of harmful (e.g. H2S) components for the
environment and gas grid (Table 1). Conventional indus-
trial methods used for CO2 removal include processes such
as adsorption [8], water scrubbing [9] and absorption [10].
Usually, the sweetening is achieved by means of
absorption with an aqueous alkanolamine solution that has
as main drawback the tendency to equipment corrosion and
to lose amine properties by degradation increases [11].
As an alternative membrane, separation processes gen-
erally offer several advantages over the above-mentioned
conventional separation techniques including low capital
cost, ease of processing, small footprint area, high energy
efficiency and ease of preparation and control [12–14].
To use the membranes, they have to exhibit high sepa-
ration performance in real condition. Moreover, they have
to show important characteristics such as thermal,
& Giuseppe Barbieri
1 National Research Council-Institute on Membrane
Technology (ITM-CNR), Via P. Bucci, cubo 17C c/o Unical,
87036 Rende CS, Italy
2 The University of Calabria, cubo 44A, Via Pietro BUCCI,
87036 Rende CS, Italy
123
Appl Petrochem Res (2016) 6:439–450
DOI 10.1007/s13203-016-0164-z
mechanical, chemical resistance and durability, also in the
presence of harsh environments, reproducibility at a high
scale level, easy handling, etc., to be suitable for industrial
use.
Recently, Basu et al. [9] and Zhang et al. [15] published
two reviews reporting the membrane materials used for
CO2/CH4. Cellulose acetates [6] and polyimides [16, 17]
exhibit the best combination of permeability and selectiv-
ity. Cellulose acetate-based membranes for CO2/CH4 sep-
aration have become commercial, since the mid-1980s.
These membranes make up to 80 % of the market for
membranes in natural gas processing, and because of their
wide industrial acceptance have become an industry stan-
dard for comparison purposes. Cynara [18] and UOP
Separex [19] are the two major membrane manufacturers
currently supplying cellulose acetate-based modules as
hollow fibres and spiral wound, respectively. However,
cellulose acetate membranes are sensitive to water vapour
and a stream pre-treatment is necessary to use them for the
treatment of these gas streams [7].
Polyimide hollow fibre membranes are an alternative to
cellulose acetate, because they combine excellent thermal
and chemical stability and show a high water resistance
[20] in biogas upgrading. They are commercialized by
UBE Industries [21] and Air Liquide Medal [22].
In this work, Matrimid�5218 asymmetric hollow fibre
membranes were prepared by means of the phase inversion
dry-jet wet spinning technique [23]. The choice of hollow
fibre configuration, among the various possible membrane
configurations,wasmade owing to their high surface/volume
ratios, excellent mechanical strength, and low production
costs and reduced overall size of the equipment (footprint).
Many studies [24–31] can be found in the open literature
on the use of polyimides for the membranes preparation; in
them, the mass transport proprieties were usually evaluated
feeding single gas such as CO2, CH4, N2, H2, O2 and
mixtures of CO2/CH4 or CO2/N2 in the temperature range
25–75 �C. Most of the studies were also focalized on the
improvement of the separation properties of these
membranes by different blends [24, 25] or the addition of
fillers [26–28] or introducing new preparation techniques
and post-treatments [29–31] for improving durability and
mechanical and thermal resistance.
In addition, in real applications, almost all the streams
contain water vapour. Even though, it is usually removed by
dehydration processes by upfront units; in this work, it was
present in the feed stream also for demonstrating that the
water removal step is not amandatory requirement before the
separation of gases, since the membrane does not suffer any
problem related to the water present in large concentration
too. Such a solution, lowering the flow rate of the stream to be
dehydrated, would reduce the amount of water to be
removed. Thus, a membrane integrating separation has a
freedom degree, for placing the dehydration unit, greater
than the one in conventional separation cycles. The effect of
vapour on the mass transport properties of the membranes is
only partially investigated in the literature since, generally,
the majority of studies refers to the transport properties
measured in dry condition, usually considering single gases.
Chenar et al. [32] and Scholes et al. [33] studied the effect of
water vapour on the performance of polyimide hollow fibre
membranes at 25–35 �C.Investigations on mass transport of polyimides mem-
brane coupling humidified feed mixtures with a higher
temperature range are still missing in the open literature, at
our knowledge. Therefore, this work proposes and dis-
cusses separation performance of prepared Matrimid�5218
membranes feeding humidified gas mixture also in the
temperature range 50–75 �C.On the basis of the previous considerations, the hollow
fibremembrane transport properties were evaluated using, in
addition to single gases and dry condition, humidified
CH4:CO2 mixtures up to 75 �C. The experiments were car-
ried out in a pressure range of 400–600 kPawhich is a typical
range of biogas upgrading. The higher pressure required by
the natural gas sweetening is beyond the aim of this work.
In addition, the experimental data obtained were used as
input data for a simulation analysis devoted to investigate
the capability of these membranes to separate/purify
methane from these streams. In particular, performance
maps were developed with which the purity and recoveries
of both retentate and permeate streams were predicted in a
wider range of operating conditions with respect to the
ones used at laboratory scale.
Materials and experimental methods
Materials
Matrimid�5218 was supplied by Huntsman Advanced
Materials American, the Woodlands (USA). N-Methyl-2-
Table 1 Targets for injecting the gas into the natural gas grid [1]
Component Specification
Germany Austria US
CO2 (%) \2–4 \2–4 \2–4
Water \dew point \dew point \120 ppm
H2S (ppm) \3 \4 \3.7
O2 dehydrated gas
networks (%)
\3 \4 \0.2–1
O2 non-dehydrated gas
networks (%)
\0.5 \0.5 \0.2–1
Total inert gases (N2, He) (%) \4 \4 \4
440 Appl Petrochem Res (2016) 6:439–450
123

pyrrolidone (purity of 99 %) was purchased from VWR
International PBI (Italy). The bi-components, Stycast 1266,
epoxy resin was used for potting fibres in the preparation of
modules, were purchased from Emerson & Cuming (Bel-
gium). Tap water was used as the external coagulant and
distilled water was used as the bore fluid. CO2 and CH4
used in as single gas had a purity of 99.99 %; they were
mixed for producing the mixtures as reported in Table 2.
Hollow fibre preparation
The hollow fibre membranes preparation was carried out
according to the dry-jet wet spinning technique. Details
on the preparation of the polymer solution (dope), on the
spinning setup and on membrane modules were reported
in a previous paper [20]. Membrane modules were pre-
pared with the fibres produced, assembling ten fibres
20 cm long for a total membrane area of 52 cm2. The
skin dense layer being on the outer side of the fibres, the
membrane area was calculated taking the external
diameter of the fibres.
Mass transport properties evaluation
The mass transport properties of the hollow fibre mem-
brane modules were measured with single gases, CH4 and
CO2, and their mixtures, referred to as molar ratio, CH4:-
CO2 = 50:50, CH4:CO2 = 70:30 and CH4:CO2 = 5:95.
All measurements were carried out at different pressures,
temperatures, and relative humidity as reported in Table 2.
During the gas permeation measurements, the modules
which have two inputs (feed and retentate) and one output
(permeate) were placed in a furnace to keep under control
the temperature. The feed and retentate pressures were
measured by manometers and their flow rates were mea-
sured by bubble soap flow meter.
The gas streams were analysed by an Agilent GC 6890
equipped with two parallel analytical lines, identified as
front and back. This means that it was equipped with two
sampling valves, two detectors (TCD), and two series of
columns (HPLOT ? molesieve). The temperature was
120 �C and 150 �C for both front and back sample valves
and detectors, respectively. The oven temperature was kept
at 50 �C. Column 1, an HPLOT, operated at 123 kPa
(17.781 psi) under a carrier gas flow rate of
7.08 mL min-1, whereas column 2, a molesieve, operated
at 128 kPa (18.533 psi) under a carrier gas flow rate of
7.5 mL min-1, for each analytical line.
The permeation measurements with single gases were
performed using the pressure drop method controlling the
pressure by means of a forward pressure controller placed
on the feed line.
The mixtures measurements were carried out using the
concentration gradient method (Fig. 1) and the retentate
and permeate compositions were analysed using a gas
chromatograph. In this case, the feed/retentate pressure was
controlled by means of a back pressure controller placed on
Table 2 Operating conditions used for gas separation measurements
Temperature (�C) 25, 50, 60, 75
Pressure (kPa) Feed/retentate: 400, 500, 600
Permeate: 100
Feed flow rate 24 dm3 (STP) h-1
Relative humidity (%) 0, 50 and 100
Feed composition Single gases: CO2 (purity of 99.99 %)
and CH4 (purity of 99.99 %)
CH4:CO2 mixtures
(molar composition, %)
50:50
70:30
5:95
STP: 0 �C and 100 kPa
CO2
CH4
Manometer
MATRIMID®5218 hollow fiber
membrane module
Furnace
Retentate
PermeateFeed
Back Pressure Regulator
Bubble soap flow meter
GasChromatograph
Bubble soap flow meter
PPI
Mass flow controller 1
Mass flow controller 2
Fig. 1 Scheme of the experimental setup used for mixture measurements
Appl Petrochem Res (2016) 6:439–450 441
123
the retentate line. The mixtures were obtained by mixing
CO2 and CH4 coming from two different cylinders that
were fed to the membrane modules by means of two mass
flow controllers [34].
All the measurements were carried out by feeding the
gas on the outer (shell) side of the fibres and the permeate
was collected from the inner hole. The permeate and
retentate flow rates were measured by means of two bubble
soap flow meters.
In the experiments with water vapour, to obtain 100 %
relative humidity, the feed stream, either single gas or
mixture, was firstly fed into a humidifier at the same
temperature and pressure as the membrane module and
then, once saturated, into the module. For the measure-
ments at 50 % relative humidity, a part of the feed streams
(50 %) is fed into the humidifier and another part not. The
two streams are combined before the module and are then
fed to reach 50 % relative humidity. The relative humidity,
in both cases, was measured by means of two humidity
sensors placed on the feed and permeate lines.
In addition, the modules were placed in oblique position
inside the furnace to avoid any liquid deposition also on the
external surface of the fibres.
All the measurements were performed at a high feed
flow rate Table 2 and, consequently, at a low stage cut,
5–10 %, (ratio of the permeate flow rate to the feed flow
rate). This condition assures the absence of variation of the
species composition in the feed/retentate side.
The performances of the membranes were evaluated in
terms of permeating flux (Eq. 1) and permeance (Eq. 2)
where AMembrane (52 cm2) is the membrane area and the
permeation driving force is given by the difference of the
species partial pressure on the two membrane sides
(Eq. 3). The single gas selectivity and the selectivity in
mixture are given by the ratio of the measured perme-
ances (Eq. 4). In addition, the separation factor was also
calculated, however, owing to the low stage cut it coin-
cides with the mixture selectivity. The investigated hol-
low fibres have an asymmetric structure with a selective
and thin dense layer on others of different porosity and
pore size. The thickness of the selective layer only was
utilized in the permeability evaluation as used for sym-
metric and asymmetric flat films.
Permeating fluxi ¼Permeate flow ratei
AMembrane(molm�2s�1Þ
ð1Þ
Permeancei ¼Permeantingflux
Drivingforceðmolm�2s�1Pa�1Þ ð2Þ
Driving forcei ¼ PFeedi � PPermeate
i ðkPa) ð3Þ
Selectivityij ¼Permeancei
Permeancejð4Þ
Tools for membrane system performance analysis
In some previous papers [12, 13], the authors developed a
simple tool that uses ‘‘maps’’ to enable analysis of per-
formance and the perspectives of membranes in CO2 cap-
ture. That study focused on the application of membrane
gas separation in CO2 processing with a general approach
considering the effect and, eventually, the limitations
offered by the main variables that affect the separation
performance: the pressure ratio, the feed composition, and
the mass transport properties (permeance and selectivity)
of the membrane considered in the installation. As per-
formed, the study is a useful guide for readers interested in
CO2 separation independent of the other gases present in
the feed stream.
In the dimensionless form of the equations, the terms Hi
and / can be distinguished as the permeation number and
the feed to permeate pressure ratio, respectively.
H ¼ PermeanceCO2 � AMembrane � Feed pressure
CO2 feed mole fraction� Flow rateFeedð5Þ
/ ¼ Feedpressure
Permeatepressureð6Þ
The permeation number (Eq. 5) expresses a comparison
between the two main transport mechanisms involved that
are the convective flux along the membrane axis and the
maximum permeating flux achievable. A high permeation
number corresponds to a high membrane area and/or
permeance for the stream and to a high permeation through
the membrane with respect to the total flux along the
module. The pressure ratio (Eq. 6) is one of the most
important and determinant operating parameters affecting
the performance of the membrane unit and is the driving
force for the separation. More details about the model used
and the dimensionless analysis can be found in [12].
Results and discussion
Measurements feeding single gases
The permeating flux was measured up to 75 �C to evaluate
the suitability of the prepared membranes for the targeted
separation at a relative high temperature.
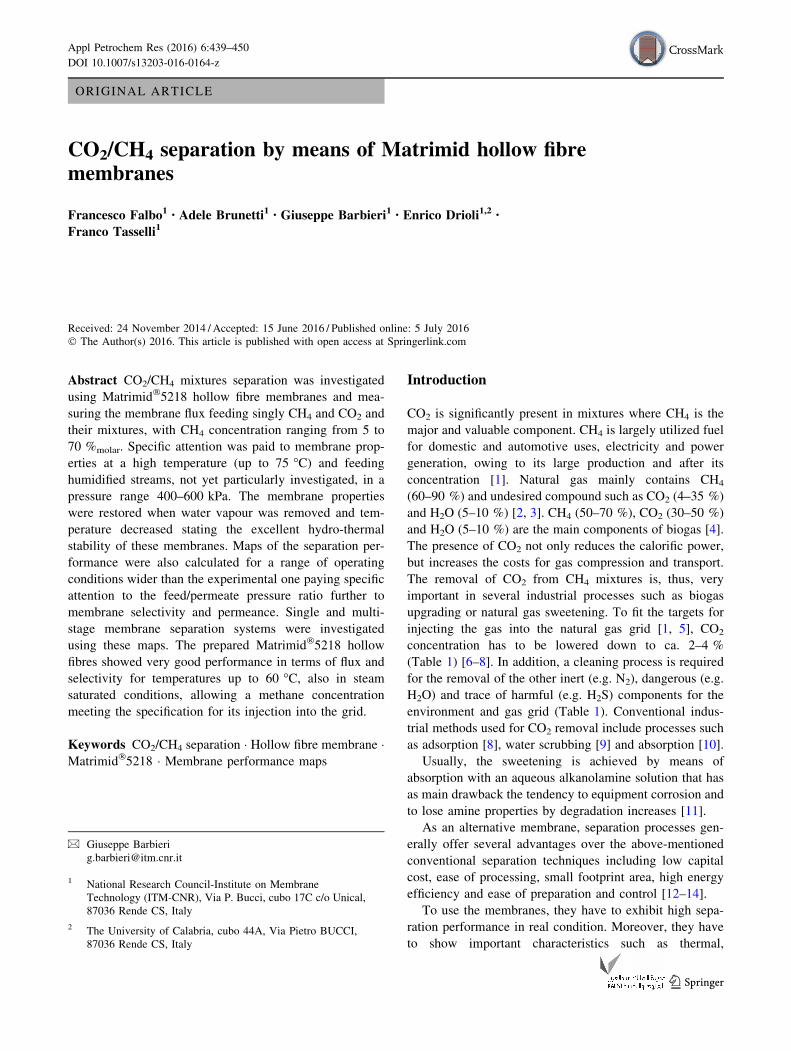
Figure 2 shows the CH4 and CO2 permeating flux as a
function of the driving force at 60 �C. Both CO2 and CH4
fluxes linearly increased indicating that the permeance of
each gas was constant for all the applied values of the
driving force. CO2 flux was always greater than that CH4
since CO2 higher solubility in Matrimid�5218 membrane
with respect to CH4 one. The difference in permeance of
CO2 and CH4 can be explained on the basis of difference in
442 Appl Petrochem Res (2016) 6:439–450
123
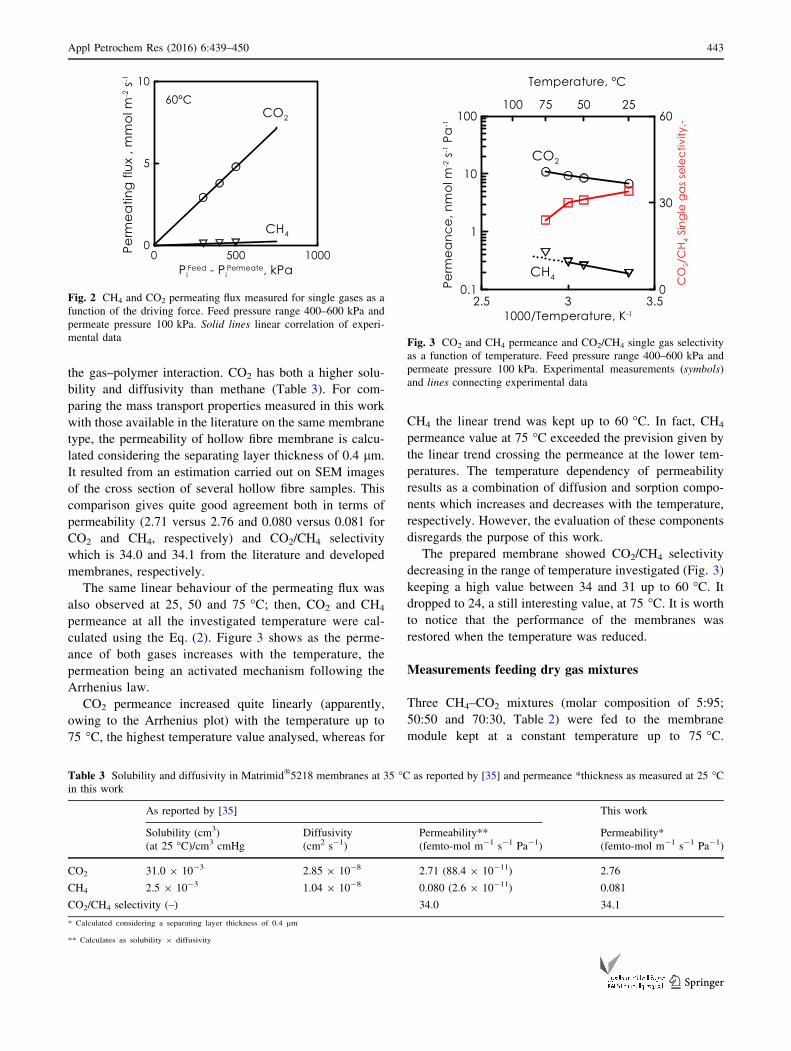
the gas–polymer interaction. CO2 has both a higher solu-
bility and diffusivity than methane (Table 3). For com-
paring the mass transport properties measured in this work
with those available in the literature on the same membrane
type, the permeability of hollow fibre membrane is calcu-
lated considering the separating layer thickness of 0.4 lm.
It resulted from an estimation carried out on SEM images
of the cross section of several hollow fibre samples. This
comparison gives quite good agreement both in terms of
permeability (2.71 versus 2.76 and 0.080 versus 0.081 for
CO2 and CH4, respectively) and CO2/CH4 selectivity
which is 34.0 and 34.1 from the literature and developed
membranes, respectively.
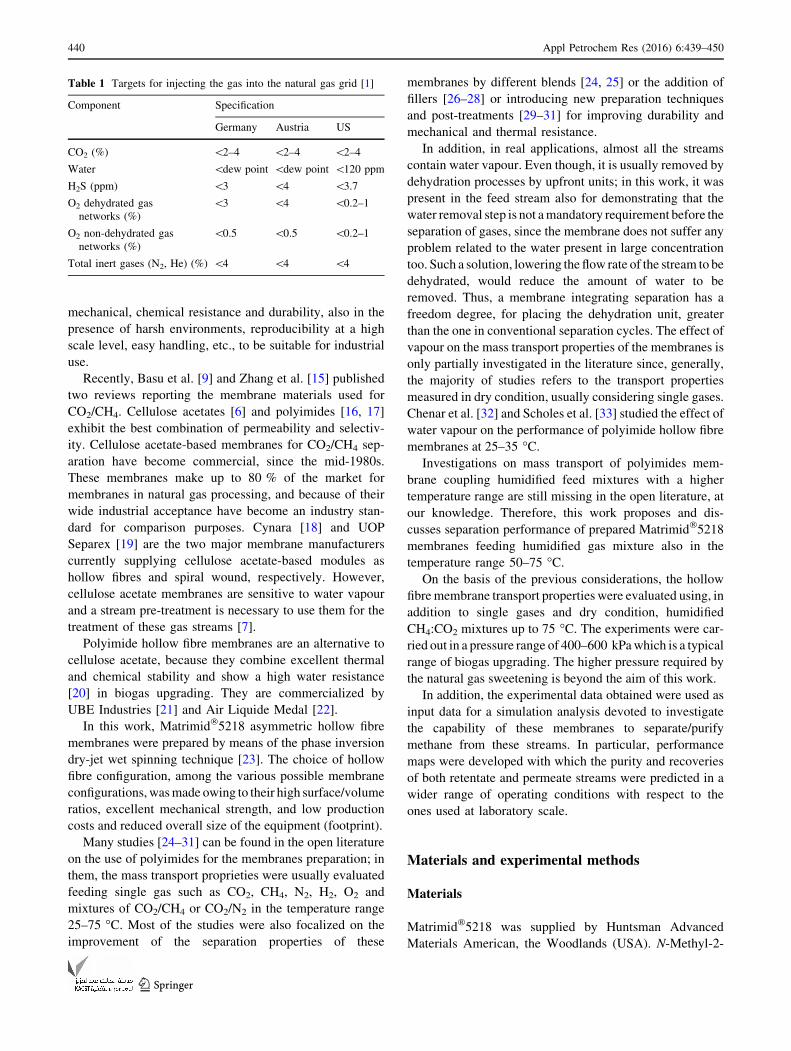
The same linear behaviour of the permeating flux was
also observed at 25, 50 and 75 �C; then, CO2 and CH4
permeance at all the investigated temperature were cal-
culated using the Eq. (2). Figure 3 shows as the perme-
ance of both gases increases with the temperature, the
permeation being an activated mechanism following the
Arrhenius law.
CO2 permeance increased quite linearly (apparently,
owing to the Arrhenius plot) with the temperature up to
75 �C, the highest temperature value analysed, whereas for
CH4 the linear trend was kept up to 60 �C. In fact, CH4
permeance value at 75 �C exceeded the prevision given by
the linear trend crossing the permeance at the lower tem-
peratures. The temperature dependency of permeability
results as a combination of diffusion and sorption compo-
nents which increases and decreases with the temperature,
respectively. However, the evaluation of these components
disregards the purpose of this work.
The prepared membrane showed CO2/CH4 selectivity
decreasing in the range of temperature investigated (Fig. 3)
keeping a high value between 34 and 31 up to 60 �C. Itdropped to 24, a still interesting value, at 75 �C. It is worthto notice that the performance of the membranes was
restored when the temperature was reduced.
Measurements feeding dry gas mixtures
Three CH4–CO2 mixtures (molar composition of 5:95;
50:50 and 70:30, Table 2) were fed to the membrane
module kept at a constant temperature up to 75 �C.
Fig. 2 CH4 and CO2 permeating flux measured for single gases as a
function of the driving force. Feed pressure range 400–600 kPa and
permeate pressure 100 kPa. Solid lines linear correlation of experi-
mental data
Table 3 Solubility and diffusivity in Matrimid�5218 membranes at 35 �C as reported by [35] and permeance *thickness as measured at 25 �Cin this work
As reported by [35] This work
Solubility (cm3)
(at 25 �C)/cm3 cmHg
Diffusivity
(cm2 s-1)
Permeability**
(femto-mol m-1 s-1 Pa-1)
Permeability*
(femto-mol m-1 s-1 Pa-1)
CO2 31.0 9 10-3 2.85 9 10-8 2.71 (88.4 9 10-11) 2.76
CH4 2.5 9 10-3 1.04 9 10-8 0.080 (2.6 9 10-11) 0.081
CO2/CH4 selectivity (–) 34.0 34.1
* Calculated considering a separating layer thickness of 0.4 lm
** Calculates as solubility 9 diffusivity
Fig. 3 CO2 and CH4 permeance and CO2/CH4 single gas selectivity
as a function of temperature. Feed pressure range 400–600 kPa and
permeate pressure 100 kPa. Experimental measurements (symbols)
and lines connecting experimental data
Appl Petrochem Res (2016) 6:439–450 443
123
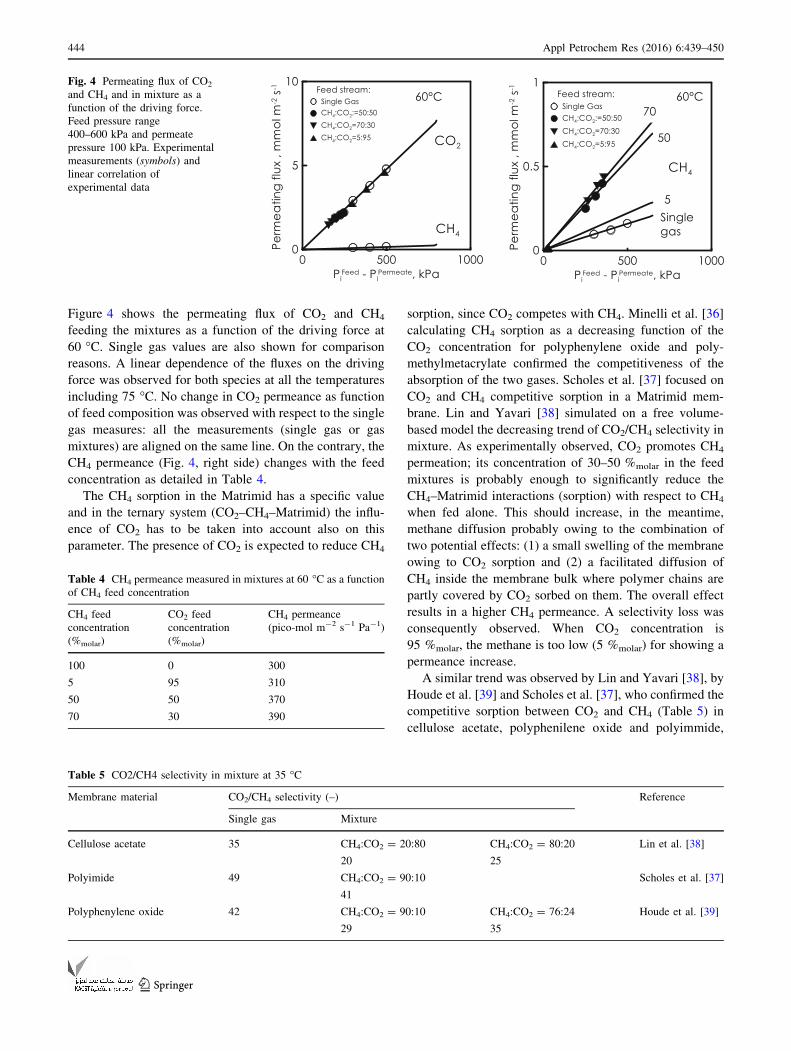
Figure 4 shows the permeating flux of CO2 and CH4
feeding the mixtures as a function of the driving force at
60 �C. Single gas values are also shown for comparison
reasons. A linear dependence of the fluxes on the driving
force was observed for both species at all the temperatures
including 75 �C. No change in CO2 permeance as function
of feed composition was observed with respect to the single
gas measures: all the measurements (single gas or gas
mixtures) are aligned on the same line. On the contrary, the
CH4 permeance (Fig. 4, right side) changes with the feed
concentration as detailed in Table 4.
The CH4 sorption in the Matrimid has a specific value
and in the ternary system (CO2–CH4–Matrimid) the influ-
ence of CO2 has to be taken into account also on this
parameter. The presence of CO2 is expected to reduce CH4
sorption, since CO2 competes with CH4. Minelli et al. [36]
calculating CH4 sorption as a decreasing function of the
CO2 concentration for polyphenylene oxide and poly-
methylmetacrylate confirmed the competitiveness of the
absorption of the two gases. Scholes et al. [37] focused on
CO2 and CH4 competitive sorption in a Matrimid mem-
brane. Lin and Yavari [38] simulated on a free volume-
based model the decreasing trend of CO2/CH4 selectivity in
mixture. As experimentally observed, CO2 promotes CH4
permeation; its concentration of 30–50 %molar in the feed
mixtures is probably enough to significantly reduce the
CH4–Matrimid interactions (sorption) with respect to CH4
when fed alone. This should increase, in the meantime,
methane diffusion probably owing to the combination of
two potential effects: (1) a small swelling of the membrane
owing to CO2 sorption and (2) a facilitated diffusion of
CH4 inside the membrane bulk where polymer chains are
partly covered by CO2 sorbed on them. The overall effect
results in a higher CH4 permeance. A selectivity loss was
consequently observed. When CO2 concentration is
95 %molar, the methane is too low (5 %molar) for showing a
permeance increase.
A similar trend was observed by Lin and Yavari [38], by
Houde et al. [39] and Scholes et al. [37], who confirmed the
competitive sorption between CO2 and CH4 (Table 5) in
cellulose acetate, polyphenilene oxide and polyimmide,
Fig. 4 Permeating flux of CO2
and CH4 and in mixture as a
function of the driving force.
Feed pressure range
400–600 kPa and permeate
pressure 100 kPa. Experimental
measurements (symbols) and
linear correlation of
experimental data
Table 4 CH4 permeance measured in mixtures at 60 �C as a function
of CH4 feed concentration
CH4 feed
concentration
(%molar)
CO2 feed
concentration
(%molar)
CH4 permeance
(pico-mol m-2 s-1 Pa-1)
100 0 300
5 95 310
50 50 370
70 30 390
Table 5 CO2/CH4 selectivity in mixture at 35 �C
Membrane material CO2/CH4 selectivity (–) Reference
Single gas Mixture
Cellulose acetate 35 CH4:CO2 = 20:80 CH4:CO2 = 80:20 Lin et al. [38]
20 25
Polyimide 49 CH4:CO2 = 90:10 Scholes et al. [37]
41
Polyphenylene oxide 42 CH4:CO2 = 90:10 CH4:CO2 = 76:24 Houde et al. [39]
29 35
444 Appl Petrochem Res (2016) 6:439–450
123
respectively; CO2 plasticization which causes membrane
swelling also plays a crucial role. The CO2/CH4 selectivity
value in mixtures was lower for ca. 35 % than that obtained
for the single gas. CO2 permeance, mainly owing to CO2
solubility (and not its diffusion), does not undergo a sig-
nificant change and CO2 permeates the membrane in the
same way fed singly or in a gas mixture. Differently, CH4
permeance benefits of the swelling effects with consequent
diffusion increase.
The same behaviour was also observed at the other
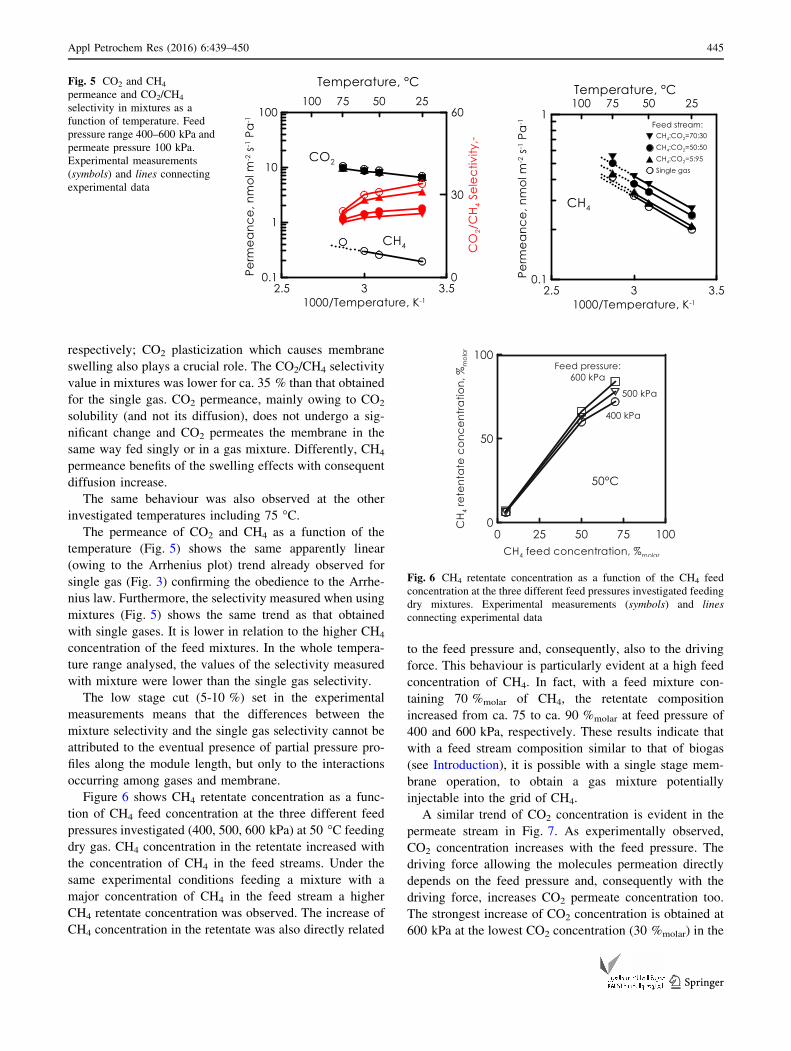
investigated temperatures including 75 �C.The permeance of CO2 and CH4 as a function of the
temperature (Fig. 5) shows the same apparently linear
(owing to the Arrhenius plot) trend already observed for
single gas (Fig. 3) confirming the obedience to the Arrhe-
nius law. Furthermore, the selectivity measured when using
mixtures (Fig. 5) shows the same trend as that obtained
with single gases. It is lower in relation to the higher CH4
concentration of the feed mixtures. In the whole tempera-
ture range analysed, the values of the selectivity measured
with mixture were lower than the single gas selectivity.
The low stage cut (5-10 %) set in the experimental
measurements means that the differences between the
mixture selectivity and the single gas selectivity cannot be
attributed to the eventual presence of partial pressure pro-
files along the module length, but only to the interactions
occurring among gases and membrane.
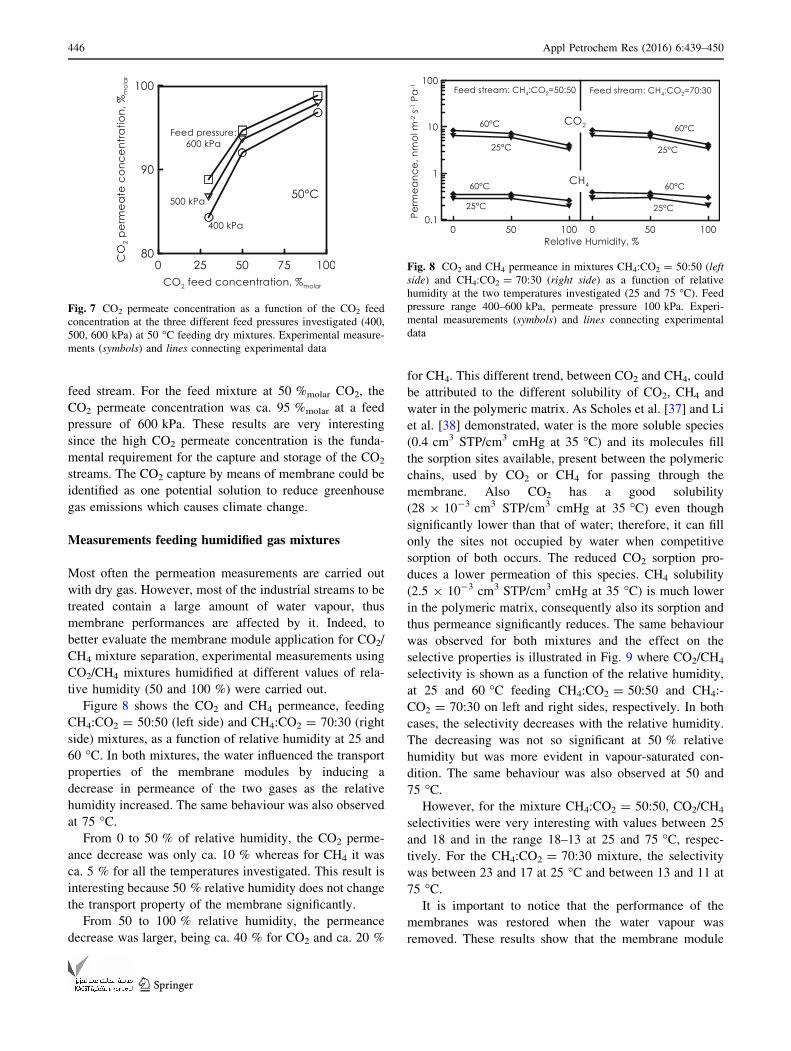
Figure 6 shows CH4 retentate concentration as a func-
tion of CH4 feed concentration at the three different feed
pressures investigated (400, 500, 600 kPa) at 50 �C feeding
dry gas. CH4 concentration in the retentate increased with
the concentration of CH4 in the feed streams. Under the
same experimental conditions feeding a mixture with a
major concentration of CH4 in the feed stream a higher
CH4 retentate concentration was observed. The increase of
CH4 concentration in the retentate was also directly related
to the feed pressure and, consequently, also to the driving
force. This behaviour is particularly evident at a high feed
concentration of CH4. In fact, with a feed mixture con-
taining 70 %molar of CH4, the retentate composition
increased from ca. 75 to ca. 90 %molar at feed pressure of
400 and 600 kPa, respectively. These results indicate that
with a feed stream composition similar to that of biogas
(see Introduction), it is possible with a single stage mem-
brane operation, to obtain a gas mixture potentially
injectable into the grid of CH4.
A similar trend of CO2 concentration is evident in the
permeate stream in Fig. 7. As experimentally observed,
CO2 concentration increases with the feed pressure. The
driving force allowing the molecules permeation directly
depends on the feed pressure and, consequently with the
driving force, increases CO2 permeate concentration too.
The strongest increase of CO2 concentration is obtained at
600 kPa at the lowest CO2 concentration (30 %molar) in the
Fig. 5 CO2 and CH4
permeance and CO2/CH4
selectivity in mixtures as a
function of temperature. Feed
pressure range 400–600 kPa and
permeate pressure 100 kPa.
Experimental measurements
(symbols) and lines connecting
experimental data
Fig. 6 CH4 retentate concentration as a function of the CH4 feed
concentration at the three different feed pressures investigated feeding
dry mixtures. Experimental measurements (symbols) and lines
connecting experimental data
Appl Petrochem Res (2016) 6:439–450 445
123
feed stream. For the feed mixture at 50 %molar CO2, the
CO2 permeate concentration was ca. 95 %molar at a feed
pressure of 600 kPa. These results are very interesting
since the high CO2 permeate concentration is the funda-
mental requirement for the capture and storage of the CO2
streams. The CO2 capture by means of membrane could be
identified as one potential solution to reduce greenhouse
gas emissions which causes climate change.
Measurements feeding humidified gas mixtures
Most often the permeation measurements are carried out
with dry gas. However, most of the industrial streams to be
treated contain a large amount of water vapour, thus
membrane performances are affected by it. Indeed, to
better evaluate the membrane module application for CO2/
CH4 mixture separation, experimental measurements using
CO2/CH4 mixtures humidified at different values of rela-
tive humidity (50 and 100 %) were carried out.
Figure 8 shows the CO2 and CH4 permeance, feeding
CH4:CO2 = 50:50 (left side) and CH4:CO2 = 70:30 (right
side) mixtures, as a function of relative humidity at 25 and
60 �C. In both mixtures, the water influenced the transport
properties of the membrane modules by inducing a
decrease in permeance of the two gases as the relative
humidity increased. The same behaviour was also observed
at 75 �C.From 0 to 50 % of relative humidity, the CO2 perme-
ance decrease was only ca. 10 % whereas for CH4 it was
ca. 5 % for all the temperatures investigated. This result is
interesting because 50 % relative humidity does not change
the transport property of the membrane significantly.
From 50 to 100 % relative humidity, the permeance
decrease was larger, being ca. 40 % for CO2 and ca. 20 %
for CH4. This different trend, between CO2 and CH4, could
be attributed to the different solubility of CO2, CH4 and
water in the polymeric matrix. As Scholes et al. [37] and Li
et al. [38] demonstrated, water is the more soluble species
(0.4 cm3 STP/cm3 cmHg at 35 �C) and its molecules fill
the sorption sites available, present between the polymeric
chains, used by CO2 or CH4 for passing through the
membrane. Also CO2 has a good solubility
(28 9 10-3 cm3 STP/cm3 cmHg at 35 �C) even though
significantly lower than that of water; therefore, it can fill
only the sites not occupied by water when competitive
sorption of both occurs. The reduced CO2 sorption pro-
duces a lower permeation of this species. CH4 solubility
(2.5 9 10-3 cm3 STP/cm3 cmHg at 35 �C) is much lower
in the polymeric matrix, consequently also its sorption and
thus permeance significantly reduces. The same behaviour
was observed for both mixtures and the effect on the
selective properties is illustrated in Fig. 9 where CO2/CH4
selectivity is shown as a function of the relative humidity,
at 25 and 60 �C feeding CH4:CO2 = 50:50 and CH4:-
CO2 = 70:30 on left and right sides, respectively. In both
cases, the selectivity decreases with the relative humidity.
The decreasing was not so significant at 50 % relative
humidity but was more evident in vapour-saturated con-
dition. The same behaviour was also observed at 50 and
75 �C.However, for the mixture CH4:CO2 = 50:50, CO2/CH4
selectivities were very interesting with values between 25
and 18 and in the range 18–13 at 25 and 75 �C, respec-tively. For the CH4:CO2 = 70:30 mixture, the selectivity
was between 23 and 17 at 25 �C and between 13 and 11 at
75 �C.It is important to notice that the performance of the
membranes was restored when the water vapour was
removed. These results show that the membrane module
Fig. 7 CO2 permeate concentration as a function of the CO2 feed
concentration at the three different feed pressures investigated (400,
500, 600 kPa) at 50 �C feeding dry mixtures. Experimental measure-
ments (symbols) and lines connecting experimental data
Fig. 8 CO2 and CH4 permeance in mixtures CH4:CO2 = 50:50 (left
side) and CH4:CO2 = 70:30 (right side) as a function of relative
humidity at the two temperatures investigated (25 and 75 �C). Feedpressure range 400–600 kPa, permeate pressure 100 kPa. Experi-
mental measurements (symbols) and lines connecting experimental
data
446 Appl Petrochem Res (2016) 6:439–450
123

developed can separate the CH4 from CO2 in the presence
of water vapour.
A wide comparison of mass transport properties mea-
sured in this work with those currently available in the open
literature, the state of the art (the Robeson’s upper-bound),
can be done only through the permeability. Thus, the per-
meability was calculated considering the separating layer
thickness of 0.4 lm, as estimated by SEM analysis. Fig-
ure 10 compares the mass transport properties measured in
this work, with the current state of art on the Matrimid�5218
and polyimide, a material similar to Matrimid�5218.
The better results in terms of selectivity and permeance
were obtained for the single gas measurements. There was
no change in CO2 permeance feeding single gas or a gas
mixture. A reduction of selectivity of ca. 20 % was
observed when a dry CH4:CO2 = 50:50 mixture was fed.
The membrane selectivity was reduced of ca. 25 and 50%
in presence of 50 and 100 % of relative humidity in the
feed stream, respectively. Permeability and selectivity of
the developed membranes were lower than the better val-
ues (ca. 50 as selectivity and ca. 20 nmol m-2 s-1 Pa-1 as
CO2 permeance) of literature data of 6FDA-based poly-
imides. However, the membranes prepared in this work
show interesting gas transport properties, also a tempera-
ture of 75 �C and feeding dry and humidified streams. In
particular, CO2/CH4 selectivity in the range of 34–24 and
25–21 was obtained feeding dry single gas and dry mixture,
respectively. In humidified conditions, the CO2/CH4
selectivity was between 25 and 12 and between 18 and 13
feeding single gas and mixture, respectively. It is important
to notice that the performance of the membranes was
restored when the water vapour was removed and when the
temperature was reduced.
Some remarks on the membrane system
performance
One of the main points of discussion which often interfaces
material scientists with process engineers is the possibility
of using the materials produced and that gave interesting
performance in mixtures in the laboratory. Apart from the
necessity to test the performance in mixtures, a crucial role
for the application of membrane technology in CO2 sepa-
ration is played by the membrane engineering who knows
how to operate the membrane unit and to design the sep-
aration process to obtain the best performance. By means
of the performance maps developed elsewhere, it is pos-
sible to elaborate a predictive analysis of the membrane
unit performance in a wider range of operating conditions.
Figure 11 shows the CO2 permeate concentration versus
recovery for different values of feed compositions experi-
mentally tested at various values of pressure ratio and
permeation number.
Once, on the basis of global economic considerations
the optimal performance (that is, a point on the plot of CO2
permeate concentration versus CO2 recovery) has been
chosen, it can be univocally individuated on the maps; the
parametric curves crossing this optimal point provide the
corresponding pressure ratio and permeation number. This
leads to the identification of the operating conditions,
membrane characteristics (permeance, area, etc.), or feed
conditions required to obtain the final product with certain
characteristics.
Fig. 9 Selectivity in mixture for CH4:CO2 = 50:50 (left side) and
CH4:CO2 = 70:30 (right side) as a function of relative humidity at
the two temperatures investigated (25 and 60 �C). Feed pressure
range 400–600 kPa, permeate pressure 100 kPa. Experimental mea-
surements (symbols) and lines connecting experimental data
Fig. 10 CO2/CH4 single gas selectivity or mixture selectivity of
gases measured as a function of the CO2 permeability; Symbols:
triangles and diamonds refer to experimental data; circles refer to the
literature data: Ayala et al. [40]; Xiao et al. [41]; Chan et al. [42];
Staudt Bickel et al. [43]; Peter et al. [44]; Shao et al. [45]; Hillock et
Koros [46]; Suzuki et al. [47]; Swaidan et al. [48]; Sanders et al. [49];
Vinh-Thang et al. [50]; Nik et al. [51]; Qui et al. [52]; Hosseini et al.
[53]; Askari et al. [54]; Scholes et al. [37]
Appl Petrochem Res (2016) 6:439–450 447
123

For instance, if 60 %molar CO2 recovery in the permeate
is desired, the pressure ratio required is close to 2.5 in the
case of the equimolecular mixture (CH4:CO2 = 50:50),
whereas it increases to 5 for the mixture with the higher
concentration of methane (CH4:CO2 = 70:30). Assuming
this latter as reference mixture, for a pressure ratio of 5, the
CO2 concentration in the permeate can range between 50 to
more than 80 to 90 %molar, according to the permeation
number chosen with consequent changes on the recovery
which can pass from 80 down to 40 %molar, respectively.
Following the indications of the International Energy
Agency [55–58] for which a purity higher than 80 %molar
and a recovery[60 %molar are desirable targets, the per-
meation number selected should be close to 1. For defined
feed conditions and membrane characteristics, it is possible
to calculate the membrane area required to treat certain
feed flow rates. At a greater pressure, the ratio would
correspond to a reduction in membrane area.
Apart from the details of the calculation, it appears
evident that in a single stage the proposed membranes
cannot contemporarily reach high recovery and purity.
However, this analysis provides an indication on the pos-
sibility of using these membranes as the first stage in a
multistage system to concentrate the feed stream or as a
single stage unit when the recovery target is not important.
In the case of biogas separation or natural gas sweet-
ening, still much more important than the CO2 character-
istics are the characteristics of the methane stream which
remains as retentate. The treatment of these gas streams
leads not only to the recovery and sequestration of CO2, but
also to much greater purification and recovery of value-
added CH4 to feed it directly to pipelines for domestic or
stationary uses. From this perspective, since CH4 has to be
fed to pipelines at a high pressure, the possibility of
installing a compressor before the membrane system and
recovering the methane already concentrated and com-
pressed as a retentate stream makes this operating option
quite realistic. Figure 12 depicts the performance map not
only for CO2 characteristics but also for CH4 ones. From
the figure, the advantage achieved both in terms of purity
and recovery when a high pressure ratio can be used
appears evident. For example, at / = 50, it is possible to
obtain a CH4 purity greater than 97 %, the limit imposed
for directly feeding in pipelines, even though with recovery
not so high (ca. 50 %molar for a permeation number equal to
1). To this corresponds a CO2 recovery greater than 90 %
but with a CO2 concentration of ca. 55 %, at all permeation
numbers considered. This stream would require a further
separation treatment to fit the indications imposed for CO2
storage; therefore, a multistage cascade system has to be
applied for this solution.
Conclusions
The transport properties of Matrimid�5218 hollow fibre
membranes prepared by dry-jet wet spinning were evalu-
ated by feeding singly CH4 and CO2 and as CH4–CO2
mixtures (of molar composition of 50:50, 70:30 and 5:95).
Fig. 11 Maps of CO2 concentration in permeate streams, respec-
tively, as a function of recovery at various values of pressure ratio and
permeation numberFig. 12 Maps of CH4 and CO2 concentration in retentate and
permeate streams, respectively, as a function of correspondent
recovery at various values of pressure ratio and permeation number
448 Appl Petrochem Res (2016) 6:439–450
123

Specifically, relatively high temperatures for polymeric
membranes up to 75 �C and wet condition were operated in
measuring the membrane separation properties.
The permeation measurements in the range 25–60 �Cshowed CO2/CH4 selectivity values between 34 and 31 and
between 30 and 23 feeding single gases or gas mixtures,
respectively. At 75 �C, no difference in CO2 permeance was
observed feeding the different streams, whereas the perme-
ance of CH4, the less permeating specie, was little higher
feeding a mixture stream than that measured as single gases;
consequently, the membrane selectivity ranges 22–13 when
feeding mixtures. Good CO2 and CH4 permeance and selec-
tivity measured up to 75 �C and under water vapour presence.
In addition, the membrane properties were restored when
water vapour was removed and temperature decreased stating
the excellent hydro-thermal stability of these membranes.
The membrane, in fact, shows very good water vapour
resistance (50 and 100 % as relative humidity) even though
a loss in CO2/CH4 selectivity (e.g. 22 at 25 �C; and 11 at
75 �C) was observed. The water vapour, owing to its high
solubility in the polymeric matrix, also causes a permeance
decrease of 50 and 25 % (at 100 % of relative humidity) of
CO2 and CH4, respectively.
The measurements in the presence of water vapour (50
and 100 % relative humidity) showed water resistance and
a certain loss of selectivity, although not so significant. The
measurements also highlight a really good thermal stability
because the performance of the membrane was restored
when the temperature decreased.
Performance maps calculated for the specific case in a
wider range of operating conditions with respect to the ones
analysed in laboratory foresee the possibility of using these
membranes both as the first stage for stream concentration in
a multi-stages system or as single stage membrane unit,
particularly when high pressure ratio can be applied.
Acknowledgments The research project PON 01_02257 ‘‘Fo-
toRiduCO2 - Photoconversion of CO2 to methanol fuel’’, co-funded
by MiUR (Ministry of University Research of Italy) with Decreto
930/RIC 09-11-2011 in the framework the PON ‘‘Ricerca e compet-
itivita 2007–2013’’ is gratefully acknowledged.
Open Access This article is distributed under the terms of the
Creative Commons Attribution 4.0 International License (http://
creativecommons.org/licenses/by/4.0/), which permits unrestricted use,
distribution, and reproduction in any medium, provided you give
appropriate credit to the original author(s) and the source, provide a link
to the Creative Commons license, and indicate if changes were made.
References
1. Abatzologlou N, Boivin S (2009) A review of biogas purification
processes. Biofuels Bioprod Biorefining 3:42–71
2. Boehm P, Saba T (2009) Identification of natural gas sources
using geochemical forensic tools. Expon Env Forens Notes 5:1–5
3. Scholes CA, Stevens GW, Kentish SE (2012) Membrane gas
separation applications in natural gas processing. Fuel 96:15–28
4. Anderson C (2011) Landfill gas upgrading to pipeline quality in
the US, World Congress of Bioenergy, Dalian, China
5. Baker R, Lokhandawala K (2008) Natural gas processing with
membranes: an overview. Ind Eng Chem Res 47:2109–2121
6. Bounaceur R, Lape N, Roizard D, Vallieres C, Favre E (2006)
Membrane processes for post-combustion carbon dioxide cap-
ture: a parametric study. Energy 31:2556–2570
7. Datta AK, Sen PK (2006) Optimization of membrane unit for
removing carbon dioxide from natural gas. J Membr Sci
283:291–300
8. Drioli E, Romano M (2001) Progress and new perspectives on
integrated membrane operations for sustainable industrial growth.
Ind Eng Chem Res 40:1277–1281
9. Basu S, Khan AL, Cano-Odena A, Liu C, Vankelecom IFJ (2009)
Membrane-based technologies for biogas separations. Chem Soc
Rev 39(2):750–768
10. Tuinier MJ, van Sint Annaland M, Kramer GJ, Kuipers JAM
(2010) Cryogenic CO2 capture using dynamically operated
packed beds. Chem Eng Sci 65:114–121
11. Aliabad ZH, Mirzaei S (2009) Removal of CO2 and H2S using
aqueous alkanolamine solusions. World Acad Sci Eng Technol
3:1–25
12. Brunetti A, Scura F, Barbieri G, Drioli E (2010) Membrane
technologies for CO2 separation. J Membr Sci 359:115–125
13. Brunetti A, Drioli E, Lee YM, Barbieri G (2013) Engineering
evaluation of CO2 separation by membrane gas separation sys-
tems. J Membr Sci 454:305–315
14. Brunetti A, Sun Y, Caravella A, Drioli E, Barbieri G (2015)
Process intensification for greenhouse gas separation from bio-
gas: more efficient process schemes based on membrane-inte-
grated systems. Int J Greenh Gas Control 35:18–29
15. Zhang Y, Sunarso J, Liu S, Wang R (2013) Current status and
development of membranes for CO2/CH4 separation: a review.
Int J Greenh Gas Control 12:84–107
16. Jeon YW, Lee DH (2015) Gas membranes for CO2/CH4 (biogas)
separation: a review. Environ Eng Sci 32(2):172–184
17. Sazali N, Harun Z (2015) Gas permeation properties of the
Matrimid based carbon tubular membrane: the effect of car-
bonization temperature. Int J Concept Mech Civil Eng
31:2357–2760
18. Cameron (2010) CYNARA_CO2 membrane separation solutions.
TC9814-012. USA. https://cameron.slb.com/products-and-services/
separation-processing-and-treatment/gas-processing-andtreatment/
acid-gas-treatment-and-removal/cynara-co2-separation-systems.
Accessed 27 June 2016
19. UOP LLC SeparexTM (2009) membrane technology. UOP
5241E-01. url:http://www.slideshare.net/hungtv511/uopseparex-
membrane-technology. Accessed 27 June 2016
20. Falbo F, Tasselli F, Brunetti A, Drioli E, Barbieri G (2014)
Polyimide hollow fiber membranes for CO2 separation from wet
gas mixtures. Braz J Chem Eng 31(4):1023–1034
21. UBE Expands Gas Separation Membrane Production (2006)
Membr technol 11:4–5. doi:10.1016/S0958-2118(06)70831-X
22. Air Liquide to Install ASU for Dongbei Special Steel Group
(2007) China chemical reporter
23. Choi S, Jansen JC, Tasselli F, Barbieri G, Drioli E (2010) In-line
formation of chemically cross-linked P84� co-polyimide hollow
fibre membranes for H2/CO2 separation. Sep Purif Technol
76(2):132–139
24. Madaeni SS, Mohammadi NR, Vatanpour V (2012) Preparation
and characterization of polyimide and polyethersulfone blend
membrane for gas separation. Asia Pac J Chem Eng 7:747–754
Appl Petrochem Res (2016) 6:439–450 449
123
25. Loloei M, Moghadassi A, Omidkhah M, Amooghin AE (2015)
Improved CO2 separation performance of Matrimid�5218
membrane by addition of low molecular weight polyethylene
glycol. Greenh Gas Sci Technol 5:1–15
26. Askari M, Chung TS (2013) Natural gas purification and
olefin/paraffin separation using thermal crosslinkable co-poly-
imide/ZIF-8 mixed matrix membranes. J Membr Sci
444:173–183
27. Diestel L, Wang N, Schulz A, Steinbach F, Caro J (2015)
Matrimid-based mixed matrix membranes: interpretation and
correlation of experimental findings for zeolitic imidazolate
frameworks as fillers in H2/CO2 separation. Ind Eng Chem Res
54:1103–1112
28. Dorosti F, Omidkhah M, Abedini R (2014) Fabrication and
characterization of Matrimid/MIL-53 mixed matrix membrane
for CO2/CH4 separation. Chem Eng Res Des 92(11):2439–2448
29. Rahmania MR, Kazemib A, Talebniaa F, Khanbabaeib G (2014)
Preparation and characterization of cross-linked Matrimid mem-
branes for CO2/CH4 separation. Polym Sci 56(5):650–656
30. Ansaloni L, Minelli M, Baschetti MG, Sarti GC (2015) Effects of
thermal treatment and physical aging on the gas transport prop-
erties in Matrimid�. Oil Gas Sci Technol 70(2):367–379
31. Salleh WNW, Isa NAIM, Sazali N, Ismail AF (2014) Preparation
and characterization of Matrimid-based carbon membrane sup-
ported on tube for CO2 separation. Adv Mater Res
1025–1026:770–775
32. Chenar MP, Soltanieh M, Matsuura T, Tabe-Mohammadi A,
Khulbe KC (2006) The effect of water vapor on the performance
of commercial polyphenylene oxide and Cardo-type polyimide
hollow fiber membranes in CO2/CH4 separation applications.
J Membr Sci 285:265–271
33. Chen GQ, Scholes CA, Qiao GG, Kentish SE (2011) Water vapor
permeation in polyimide membranes. J Membr Sci 379:479–487
34. Brunetti A, Simone S, Scura F, Barbieri G, Figoli A, Drioli E
(2009) Hydrogen mixture separation with PEEK-WC asymmetric
membranes. Sep Purif Technol 69:195–204
35. Li X, Wang M, Wang S, Li Y, Jiang Z, Guo R, Wu H, Cao XZ,
Yang J, Wang B (2015) Constructing CO2 transport passageways
in Matrimids membranes using nanohydrogels for efficient car-
bon capture. J Membr Sci 474:156–166
36. Minelli M, Campagnoli S, De Angelis MG, Doghieri F, Sarti GC
(2011) Predictive model for the solubility of fluid mixtures in
glassy polymers. Macromolecules 44:4852–4862
37. Scholes AC, Stevens GW, Kentish SE (2012) Membrane gas
separation applications in natural gas processing. Fuel 96:15–28
38. Lin H, Yavari M (2015) Upper bound of polymeric membranes
for mixed-gas CO2/CH4 separations. J Membr Sci 475:101–109
39. Houde AY, Krishnakumar B, Charati SG, Stern SA (1996) Per-
meability of dense (homogeneous) cellulose acetate membranes
to methane, carbon dioxide, and their mixtures at elevated pres-
sures. J Appl Polym Sci 62:2181–2192
40. Ayala D, Lozano AE, de Abajo J, Garcia-Perez C, de la Campa
JG, Peinemann KV, Freeman BD, Prabhakar R (2003) Gas sep-
aration properties of aromatic polyimides. J Membr Sci
215:61–73
41. Xiao Y, Chung TS, Guan HM, Guiver MD (2007) Synthesis,
cross-linking and carbonization of co-polyimides containing
internal acetylene units for gas separation. J Membr Sci
302:254–264
42. Chan SS, Chung TS, Liu Y, Wang R (2003) Gas and hydrocarbon
(C2 and C3) transport properties of co-polyimides synthesized
from 6FDA and 1,5-NDA(naphthalene)/durene diamines.
J Membr Sci 218:235–245
43. Staudt-Bickel C, Koros WJ (1999) Improvement of CO2/CH4
separation characteristics of polyimides by chemical crosslinking.
J Membr Sci 155:145–154
44. Peter J, Khalyavina A, Krız J, Bleha M (2009) Synthesis and gas
transport properties of ODPA-TAP-ODA hyperbranched poly-
imides with various comonomer ratios. Euro Polym J
45:1716–1727
45. Shao L, Chung TS, Goh SH, Pramoda KP (2005) The effects of
1,3-cyclohexanebis(methylamine) modification on gas transport
and plasticization resistance of polyimide membranes. J Membr
Sci 267:78–89
46. Hillock AM, Koros WJ (2007) Cross-linkable polyimide mem-
brane for natural gas purification and carbon dioxide plasticiza-
tion reduction. Macromolecules 40:583–587
47. Suzuki T, Yamada Y, Sakai J, Itahashi K (2010) Physical and gas
transport properties of hyperbranched polyimide–silica hybrid
membranes. In: Yampolskii Y, Freeman B (eds) Membrane gas
separation. Wiley, Singapore, pp 143–158
48. Swaidan R, Ghanem B, Litwiller E, Pinnau I (2015) Effects
ofhydroxyl-functionalization and sub-Tg thermal annealing on
high pressure pure-and mixed-gas CO2/CH4 separation by poly-
imide membranes based on 6FDA and triptycene- containing
dianhydrides. J Membr Sci 475:571–581
49. Sanders DE, Smith ZP, Guo RL, Robeson LM, McGrath JE, Paul
DR, Freeman BD (2013) Energy-efficient polymeric gas separa-
tion membranes for a sustainable future: a review. Polymer
54:4729–4761
50. Vinh-Thang H, Kaliaguine S (2011) MOF-based mixed matrix
membranes for industrial applications. In: Ortiz OL, Ramirez LD
(eds) Coordination polymers and metal organic frameworks.
Nova Science Publishers, Hauppauge NY USA, pp 1–38
51. Nik OG, Chen XY, Kaliaguine S (2012) Functionalized metal
organic framework polyimide mixed matrix membranes for CO2/
CH4 separation. J Membr Sci 413–414:48–61
52. Qiu W, Zhang K, Li FS, Zhang K, Koros WJ (2014) Gas sepa-
ration performance of carbon molecular sieve membranes based
on 6FDA-mPDA/DABA (3:2) polyimide. ChemSusChem
7:1186–1194
53. Hosseini SS, Chung TS (2009) Carbon membranes from blends
of PBI and polyimides for N2/CH4 and CO2/CH4 separation and
hydrogen purification. J Membr Sci 328:174–185
54. Askari M, Yang T, Chung TS (2012) Natural gas purification and
olefin/paraffin separation using cross-linkable dual-layer hollow
fiber membranes comprising b-cyclodextrin. J Membr Sci
423–424:392–403
55. Davison J, Thambimuthu K (2004) Technologies for capture of
carbon dioxide. In: Proceedings of the seventh greenhouse gas
technology conference, Vancouver, Canada. International Energy
Association (IEA), Greenhouse Gas R&D Progamme www.
ghght7.ca
56. Ryckebosch E, Drouillon M, Vervaeren H (2011) Techniques for
transformation of biogas to biomethane. Biomass Bioenergy
35:1633–1645
57. Favre E (2007) Carbon dioxide recovery from post-combustion
processes: can gas permeation membranes compete with
absorption? J Membr Sci 294:50–59
58. Papadias D, Ahmed S, Kumar R (2012) Fuel quality issues with
biogas energy e an economic analysis for a stationary fuel cell
system. Energy 44:257–277
450 Appl Petrochem Res (2016) 6:439–450
123