coal basin outlook
TRANSCRIPT

Domestic Coal Basin Outlooks —Powder River Basin, Illinois Basin,
NAPP, and CAPP
Presentation to:
Platts 37th Annual Coal Marketing Days Conference
Pittsburgh, PennsylvaniaSeptember 22, 2014
Nick BradleyAlan K. Stagg
Stagg Resource Consultants, Inc.
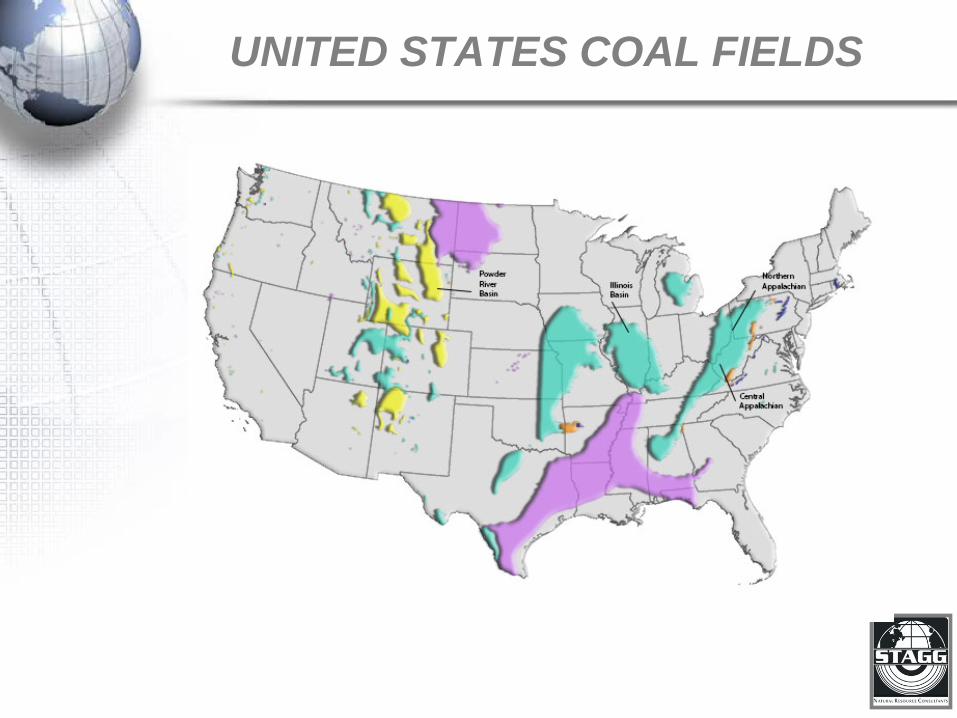
UNITED STATES COAL FIELDS

HISTORIC COAL PRODUCTION UNITED STATES
1994 - 2013
750
800
850
900
950
1,000
1,050
1,100
1,150
1,200
1994 1995 1996 1997 1998 1999 2000 2001 2002 2003 2004 2005 2006 2007 2008 2009 2010 2011 2012 2013
TOTA
L PR
OD
UC
TIO
N (M
ILLI
ON
S SH
OR
T TO
NS)

HISTORIC COAL PRODUCTION POWDER RIVER BASIN
1994 - 2013
0%
10%
20%
30%
40%
50%
60%
70%
80%
90%
100%
0
100
200
300
400
500
600
700
800
900
1,000
1994 1995 1996 1997 1998 1999 2000 2001 2002 2003 2004 2005 2006 2007 2008 2009 2010 2011 2012 2013
% O
F TO
TAL
U.S
. PR
OD
UC
TIO
N
TOTA
L PR
OD
UC
TIO
N (M
ILLI
ON
SH
OR
T TO
NS)
Source: Energy Information Administration
MONTANA AND WYOMING PRODUCTION

HISTORIC COAL PRODUCTIONILLINOIS BASIN REGION
1994 - 2013
0%
10%
20%
30%
40%
50%
60%
70%
80%
90%
100%
0
20
40
60
80
100
120
140
160
180
200
1994 1995 1996 1997 1998 1999 2000 2001 2002 2003 2004 2005 2006 2007 2008 2009 2010 2011 2012 2013
% O
F TO
TAL
U.S
. PR
OD
UC
TIO
N
TOTA
L PR
OD
UC
TIO
N (M
ILLI
ON
SH
OR
T TO
NS)
Source: Energy Information Administration
ILLINOIS BASIN PRODUCTION

HISTORIC COAL PRODUCTIONAPPALACHIAN REGION
1994 - 2013
0%
10%
20%
30%
40%
50%
60%
70%
80%
90%
100%
0
100
200
300
400
500
600
700
800
900
1,000
1994 1995 1996 1997 1998 1999 2000 2001 2002 2003 2004 2005 2006 2007 2008 2009 2010 2011 2012 2013
% O
F TO
TAL
U.S
. PR
OD
UC
TIO
N
TOTA
L PR
OD
UC
TIO
N (M
ILLI
ON
SH
OR
T TO
NS)
Source: Energy Information Administration
APPALACHIAN PRODUCTION

HISTORIC COAL PRODUCTIONNORTHERN APPALACHIAN REGION
1994 - 2013
0%
10%
20%
30%
40%
50%
60%
70%
80%
90%
100%
0
20
40
60
80
100
120
140
160
180
19941995199619971998199920002001200220032004200520062007200820092010201120122013
% O
F TO
TAL
U.S
. PR
OD
UC
TIO
N
TOTA
L PR
OD
UC
TIO
N (M
ILLI
ON
SH
OR
T TO
NS)
Source: Energy Information Administration
NORTHERN APPALACHIA PRODUCTION

HISTORIC COAL PRODUCTIONCENTRAL APPALACHIAN REGION
1994 - 2013
0%
10%
20%
30%
40%
50%
60%
70%
80%
90%
100%
0
50
100
150
200
250
300
350
400
450
500
% O
F TO
TAL
U.S
. PR
OD
UC
TIO
N
TOTA
L PR
OD
UC
TIO
N (M
ILLI
ON
SH
OR
T TO
NS)
Source: Energy Information Administration
CENTRAL APPALACHIA PRODUCTION

Introduction
Percentage Change in Production Selected U.S. Coal Regions
Region 2008 – 2013 (Annual)
2013 – 2014 (YTD)
U.S. –16 –1.2 PRB –16 –1.6 ILB +33 +4 APP –31 –1.4
NAPP –8 +1.8 CAPP –46 –4.5
Source: U.S. Energy Information Administration

Introduction
Tonnage Change in Production Selected U.S. Coal Regions
Region 2008 – 2013 (Annual)
2013 – 2014 (YTD)
U.S. –188.1 –8.7 PRB –81.9 –1.9 ILB +33.1 +4.0 APP –120.1 –2.7
NAPP –11.4 –2.7 CAPP –105.4 +1.6
Source: U.S. Energy Information Administration

HISTORIC PRODUCTION RELATIONSHIPEASTERN AND WESTERN UNITED STATES
1994 - 2013
0%
10%
20%
30%
40%
50%
60%
70%
80%
90%
100%
1994 1995 1996 1997 1998 1999 2000 2001 2002 2003 2004 2005 2006 2007 2008 2009 2010 2011 2012 2013
% O
F TO
TAL
U.S
. PR
OD
UC
TIO
N
Source: Energy Information Administration; Mine, Safety, and Health Administration
% EASTERN U.S. % WESTERN U.S.

Southern Powder River Basin
Southern PRB –Mines in three groups Northern Area Central Area Southern Area

Southern Powder River Basin
Northern Area Mines –Buckskin (Kiewit)Rawhide (Peabody Energy)Eagle Butte (Alpha Natural Resources)Dry Fork (Western Fuels Association)Wyodak (Black Hills Corporation)

Southern Powder River Basin
Central Area Mines –Caballo (Peabody Energy)Belle Ayr (Alpha Natural Resources)Cordero Rojo (Cloud Peak)Coal Creek (Alpha Natural Resources)

Southern Powder River Basin
Southern Area Mines –Black Thunder (Arch Minerals)School Creek (Peabody Energy)North Antelope/Rochelle (Peabody Energy)Antelope (Cloud Peak)

Southern Powder River Basin
Typical Shipped Quality Ranges by Area Southern Powder River Basin
Area Sulfur (%l)
Heat Content (Btu’s/Lb.)
Northern 0.27 – 0.45 7,800 – 8,400 Central 0.25 – 0.32 8,300 – 8,600
Southern 0.20 – 0.30 8,700 – 8,900 Source: Federal Energy Regulatory Commission

Southern Powder River Basin
SPRB Production – Northern Area (millions short tons)
Mine 2014) (1st Half)
2014 (Annualized)
2013 (Full Year)
Buckskin 7,553 15,106 15,024 Rawhide 7,524 15,048 14,246
Eagle Butte 10,335 20,670 19,904 Dry Fork (Captive) 2,546 5,092 5,434 Wyodak (Captive) 2,150 4,300 4,285
Total 30,107 60,214 58,894 Source: U.S. Department of Labor, Mine Safety & Health Administration
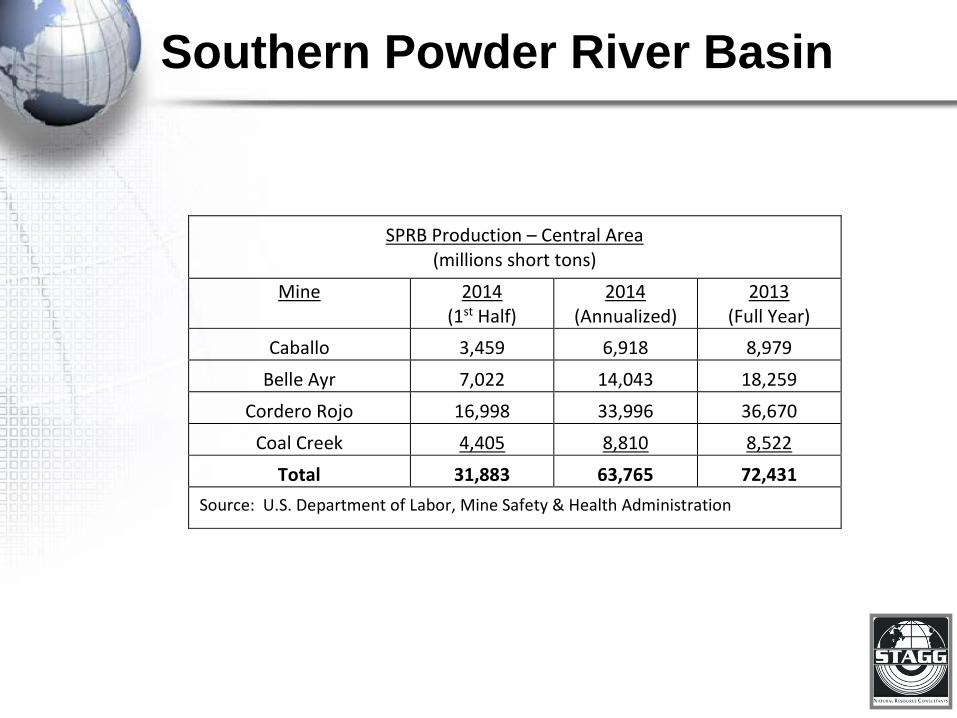
Southern Powder River Basin
SPRB Production – Central Area (millions short tons)
Mine 2014 (1st Half)
2014 (Annualized)
2013 (Full Year)
Caballo 3,459 6,918 8,979 Belle Ayr 7,022 14,043 18,259
Cordero Rojo 16,998 33,996 36,670 Coal Creek 4,405 8,810 8,522
Total 31,883 63,765 72,431 Source: U.S. Department of Labor, Mine Safety & Health Administration

Southern Powder River Basin
SPRB Production – Southern Area (millions short tons)
Mine 2014 (1st Half)
2014 (Annualized)
2013 (Full Year)
Black Thunder 48,035 96,071 100,688 School Creek (1) (1) (1)
North Antelope/Rochelle 58,355 116,710 111,006 Antelope 16,388 32,776 31,354
Total 122,779 245,557 243,048 (1) Included with North Antelope/Rochelle Source: U.S. Department of Labor, Mine Safety & Health Administration

Northern Powder River Basin
Producing Mines –Absaloka (Westmoreland Resources)Colstrip (Westmoreland Resources)Spring Creek (Cloud Peak)Decker (Ambre Energy)
Bull Mountain FieldSignal Peak (Global Mining Group)

Northern Powder River Basin
Northern Powder River Production By Mine (millions short tons)
Mine 2014) (1st Half)
2014 (Annualized)
2013 (Full Year)
Absaloka 3,237 6,474 4,169 Colstrip (Captive) 3,826 7,652 8,234
Decker 1,312 2,624 3,122 Spring Creek 7,656 15,312 17,670
Subtotal 16,031 32,062 33,195
Signal Peak 3,724 7,448 8,683 Grand Total 19,755 39,510 41,878
Source: U.S. Department of Labor, Mine Safety & Health Administration

Illinois Basin
Illinois Basin Production By State (millions short tons)
State 2014 (YTD 09-13)
2013 (YTD 09-13)
2013 (Full Year)
Illinois 38,682 37,847 52,124 Indiana 28,392 27,481 38,945
Kentucky (West) 31,416 29,152 40,901 Total 98,490 94,480 131,970
Source: U.S. Energy Information Administration

Illinois Basin
Illinois Basin Longwall Production by Operator Selected Years
(000’s short tons) Operator 2009
2011
2013
2014
(1st Half) Alliance Resource Partners 0 0 186 554 Foresight Energy 5,921 8,574 18,033 10,242 Murray Energy 6,267 6,746 9,870 5,309 Total 12,188 15,320 28,289 16,105
Longwall as % ILB 12 13 21 23
Sources: U.S. Department of Labor, Mine Safety & Health Administration, U.S. Energy Information Administration

Northern Appalachian Region
Northern Appalachia Longwall Production by Operator Selected Years
(000’s short tons) Operator 2009
2011
2013
2014
(1st Half) Alliance Resource Partners 2,215 2,593 6,023 3,683 Alpha Natural Resources 12,377 9,898 9,161 5,704 Arch Coal, Inc. 0 10 569 1,269 CONSOL Energy 44,453 51,365 49,349 13,259 Murray Energy 12,766 13,496 13,590 23,502 Patriot Coal Corporation 3,810 3,745 3,363 1,615 Total 75,622 81,107 82,055 49,031
Longwall as % NAPP 60 61 66 75
Sources: U.S. Department of Labor, Mine Safety & Health Administration, U.S. Energy Information Administration

Central Appalachian Region
Central Appalachia Production by State (000’s short tons)
State 2009
2011
2013
2014 (1st Half)
Kentucky (East) 74,719 67,930 39,048 17,777 Virginia 21,019 22,523 16,170 32,845 West Virginia (Southern) 98,732 92,813 70,442 7,256 Total 194,470 183,266 126,200 57,878 Source: U.S. Energy Information Administration

HISTORIC PRODUCTION RELATIONSHIPCENTRAL APPALACHIAN REGION AND ILLINOIS BASIN
1994 - 2013
0
50
100
150
200
250
300
350
1994 1995 1996 1997 1998 1999 2000 2001 2002 2003 2004 2005 2006 2007 2008 2009 2010 2011 2012 2013
TOTA
L PR
OD
UC
TIO
N (M
ILLI
ON
S SH
OR
T TO
NS
CENTRAL APPALACHIA PRODUCTION ILLINOIS BASIN PRODUCTION

Geology
Illinois Basin –Moderately thick coal beds in context of
underground mining.Generally favorable mining conditions.Large blocks of undeveloped reserves remain
– particularly in Illinois.Amenable to use of longwalls in Illinois.Result – productive to highly productive and
low to moderate cost underground producer.

Geology
Northern Appalachia –Moderately thick to thick coal beds in context
of underground mining.Generally favorable mining conditions.Amenable to use of longwalls (Pittsburgh).Blocks remain that can effectively be mined
by room-and-pillar methods.Result – productive to highly productive and
low to moderate cost underground producer.

Geology
Central Appalachia –Two types of coal beds remain –Thick and dirtyThin and clean
Frequently complex geology –Remaining blocks highly fragmented in many
instances.Result – generally moderately productive and
moderate to high cost underground producer.

Transportation
Powder River Basin –Mine to rail car –Relatively flat haul routes Large off-road trucksOverland conveyors
Rail car to market –Rail system in placeLacking substantial port capability if to export

Transportation
Illinois BasinMine to rail car –Large blocks of coal support preparation plant
at mine mouth in many instances.Major portion of transportation to plant occurs
underground.If highway trucking, generally over moderate
terrain.Rail car to market –Rail system in place.Has port capacity if to export.

Transportation
Northern Appalachia –Mine to rail car –Large blocks of coal support preparation plant
at mine mouth in many instances.Major portion of transportation to preparation
plant occurs underground.Highway trucking over generally moderate
terrain.Rail car to market –Rail system in place.Has port capacity if to export.

Transportation
Central Appalachia –Mine to rail car –Fragmented blocks of coal require trucking over
public roads to preparation plant.Rugged and highly incised terrain results in
circuitous routes and long uphill grades.Some larger complexes use underground
conveyors through non-producing mines to avoid overland truck hauls.
Rail car to market –Rail system in place.Has port capacity if to export.

Markets
Two broad types of markets –Thermal Metallurgical
Regional profilesPowder River Basin – ThermalIllinois Basin – ThermalNorthern Appalachia – Thermal, slight
metallurgicalCentral Appalachia – Thermal, modest
metallurgical

Markets
Thermal markets –Two issues affecting U.S. coal industry –General decline in demand in response to
economy, both domestically and internationally.Low natural gas prices and resulting increase in
market share at expense of coal.Affects all supply regions.

Natural Gas
Has its own critical issues –Hydraulic fracturing.Truck traffic, impact on residents/communities. Potential impact on groundwater.Potential methane emissions.Disposal issues – deep wells.
o Potential for earthquakes
Public pushback.

Natural Gas
Should not necessarily underestimate the potential adverse impact the hydraulic fracturing issue could have on future gas development and production costs.

Markets
Metallurgical markets –Impacts Central Appalachia the most,
particularly Southern West Virginia and Virginia.
Requires not only increase in demand, but substantial increases in price.

Regulatory
US EPA New Source Carbon Emission StandardsAffects all supply regions, but how much
impact will it have in the near- to medium-term?

Regulatory
Waiting for the other shoe to fall –Anticipated carbon emissions standards on
existing plants.

Wrap Up
Powder River Basin –Substantial reserves, favorable geology.Although modest increases in overburden-to-coal
ratios will continue, does not affect its competitiveness to a significant extent.
Transportation systems favorable except to export markets – this is the wild card if markets develop.
Markets –Domestic – depends on economic growth, how
natural gas issues play out, and pending carbon emissions standards on existing plants.Export – jury still out.

Wrap Up
Illinois Basin Substantial reserves, favorable geology.Overall, will be a moderate cost producer, with
longwall systems being low cost producers.Transportation systems generally favorable.Markets –Domestic – depends on economic growth, how
natural gas issues play out, and pending carbon emission standards on existing plants.Export – jury still out.

Wrap Up
Northern Appalachia Moderate to substantial reserves, favorable
geology.Overall, will be a moderate cost producer, with
longwall systems being low cost producers.Transportation systems generally favorable.Markets –Domestic – depends on economic growth, how
natural gas issues play out, and pending carbon emission standards for existing plants.Export – jury still out.

Wrap Up
Central Appalachia Seriously reserve constrained, geology an issue.Overall, will be a high cost producer. Surface
mining will play less of a role given permitting and societal issues.
Transportation systems from mine to rail car disadvantaged; systems from rail car to market in place.

Wrap Up
Central Appalachia (continued)Metallurgical – will be a high cost producer but has
the capability of supplying very high quality coal. Pricing will be the issue.
Thermal – will be a moderate to high cost producer but, as in other regions, depends on economic growth, how natural gas issues play out, and on pending carbon emission standards for existing plants.

The Thought For The Day
“In business – things are never as bad as they seem. Or as good.”
Harold U. Zerbe

Alan K. Stagg, PG, CMAStagg Resource Consultants, Inc.5457 Big Tyler RoadCross Lanes, WV 25313
(304) 776-6660