coal mining in india - · pdf filecoal mining in india 9 . overview of coal sector ......
TRANSCRIPT

COAL MINING IN INDIA
A Presentation by MANOJ KUMAR SINGH
Manager(IE), NCL, Singrauli(MP)-486 889 E-mail : [email protected], M-9993875526
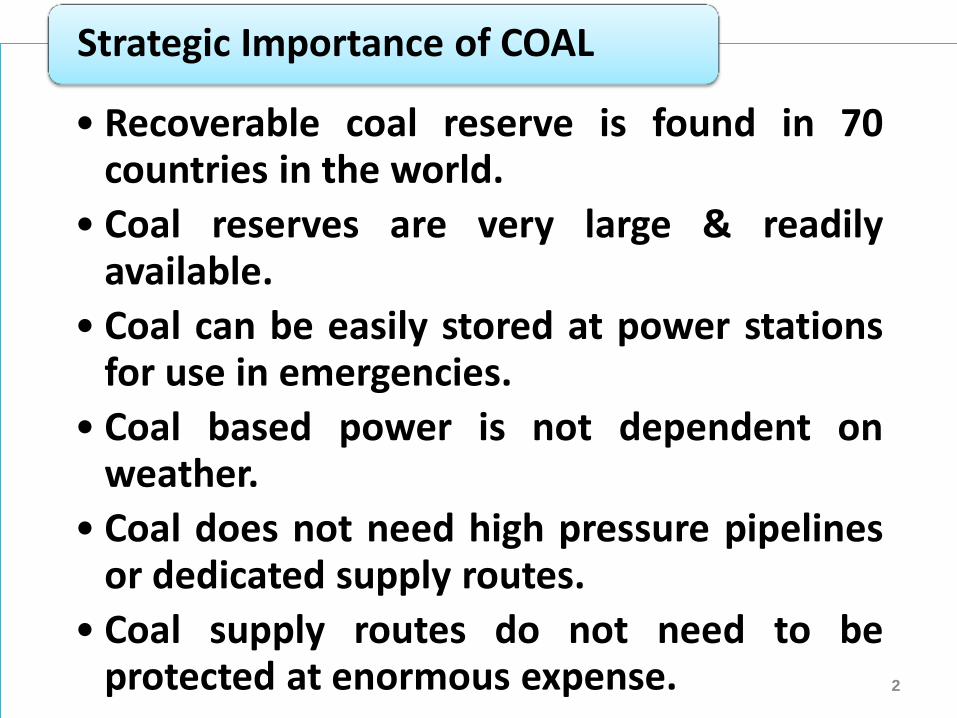
• Recoverable coal reserve is found in 70 countries in the world.
• Coal reserves are very large & readily available.
• Coal can be easily stored at power stations for use in emergencies.
• Coal based power is not dependent on weather.
• Coal does not need high pressure pipelines or dedicated supply routes.
• Coal supply routes do not need to be protected at enormous expense.
Strategic Importance of COAL
2

FUEL SHARE
COAL 52.40%
OIL 31.70%
NATURAL GAS 10.00%
HYDRO 5.10%
NUCLEAR 0.80% 3
Primary Energy Consumption in India (2009-10)

Energy Source Issues
Crude Oil No significant finds within country. High import dependence. High cost of energy conversion.
Gas Supply constraint and availability of trans-India national gas pipe line network.
Nuclear High capital cost and longer gestation period.
Hydro Power Long gestation period. Uncertain energy availability. Development challenges.
Renewable Energy
Unpredictable power. 4
ALTERNATE ENERGY SOURCES FOR INDIA & ISSUES

Power Generation Capacity of INDIA
Source Installed Capacity (31-03-2011)
MW %age
HYDRO 37,567.40 22.64
THERMAL 1,12,824.48 64.98
Coal 93,918.38 54.09
Gas 17,706.35 10.20
Diesel 1,199.75 0.69
NUCLEAR 4,780.00 2.75
RENEWABLE 18,454.52 10.63
TOTAL 1,69,748.86 100.00
5
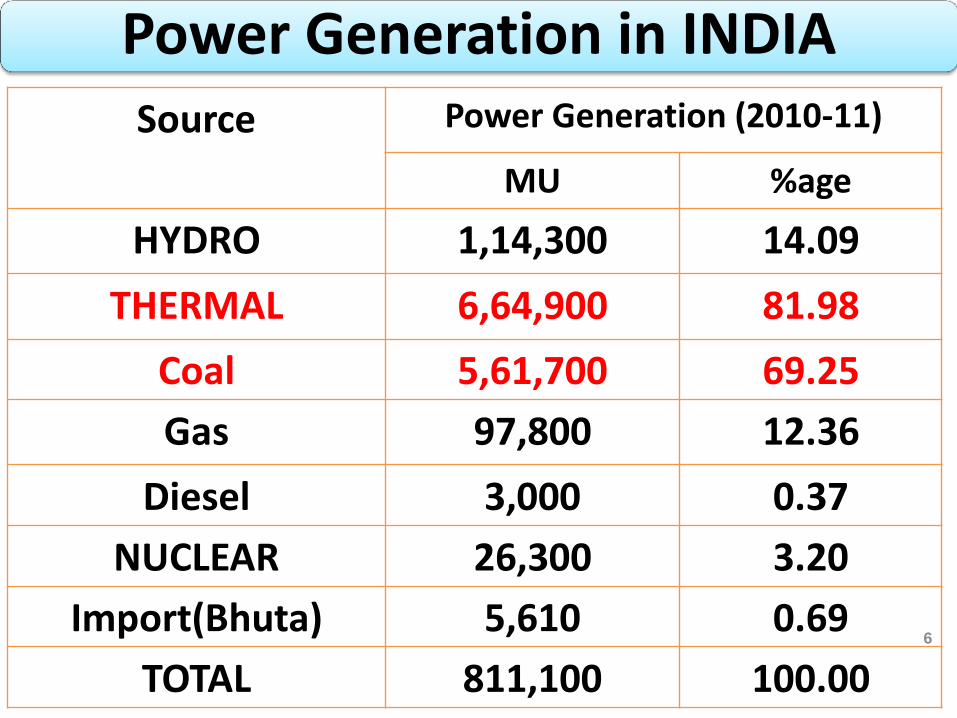
Power Generation in INDIA
Source Power Generation (2010-11)
MU %age
HYDRO 1,14,300 14.09
THERMAL 6,64,900 81.98
Coal 5,61,700 69.25
Gas 97,800 12.36
Diesel 3,000 0.37
NUCLEAR 26,300 3.20
Import(Bhuta) 5,610 0.69
TOTAL 811,100 100.00 6

Fuel Type Variable Cost
Fixed Cost
Total
Captive Coal 0.8 1.2 2.00
Coal Linkages 1.2 1.2 2.40
Imported Coal 1.5 1.2 2.70
Hydro Electric - 2.8 2.80
Gas 2.1 1.0 3.10 7
Cost of Electricity Generation (Rs./Kwh)

• Conservation of the scarce coal resources (particularly coking coal).
• Halting wasteful, selective & slaughter mining.
• Planned development of available coal resources.
• Improvement in safety standards.
• Ensuring adequate investment for optimal utilisation, consistent with growth needs.
• Improving the quality of the work force.
Objectives of Nationalisation of Coal Mines in India
8

• Coal is the most dominant energy source in India.
• India is the third largest coal producing company in the world after China & USA.
• CIL is the largest coal producing company in the world.
• CIL accounts for 81.9% of total coal production
• Coal meets 52.4% of India’s primary energy requirement.
• There are 637 coal block spread over 25 coalfields of India.
• CIL operates 470 mines in 21 major coalfields under 07 subsidiary companies across 08 states in India.
• CIL Production (Non-Coking - 91.6%, Coking - 8.4%)
• CIL Coal Production (OC - 90%, UG - 10%)
COAL MINING IN INDIA
9
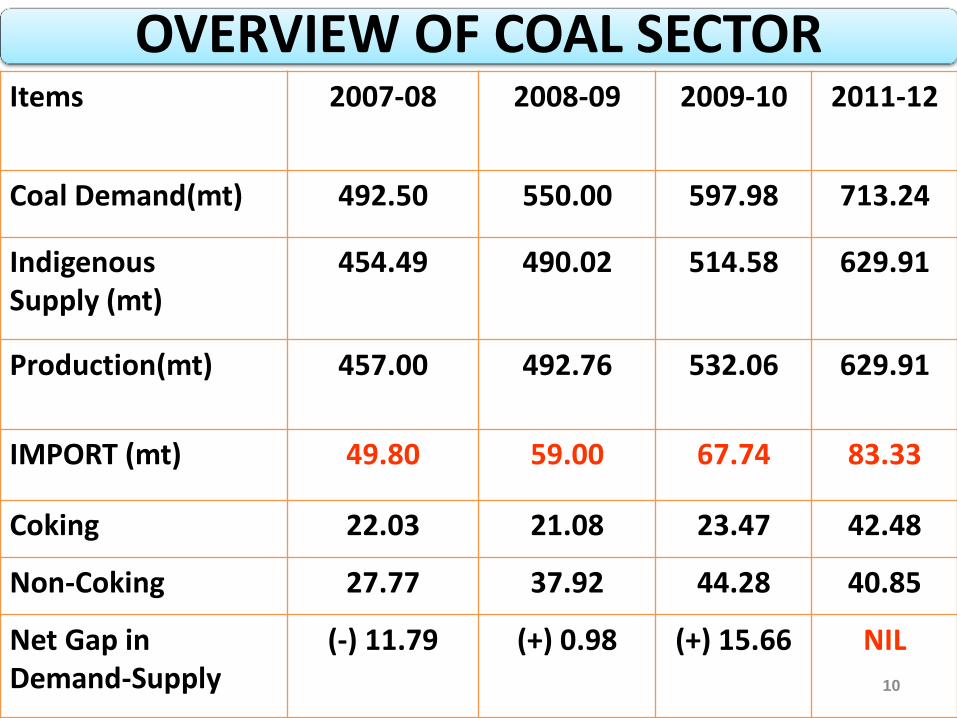
OVERVIEW OF COAL SECTOR Items 2007-08 2008-09 2009-10 2011-12
Coal Demand(mt) 492.50 550.00 597.98 713.24
Indigenous Supply (mt)
454.49 490.02 514.58 629.91
Production(mt) 457.00 492.76 532.06 629.91
IMPORT (mt) 49.80 59.00 67.74 83.33
Coking 22.03 21.08 23.47 42.48
Non-Coking 27.77 37.92 44.28 40.85
Net Gap in Demand-Supply
(-) 11.79 (+) 0.98 (+) 15.66 NIL
10

COAL DEMAND IN INDIA (mt) Sectors 2007-08 2008-09 2009-10 2010-11 2011-12
COKING COAL
Steel/Coke Oven 40.01 40.84 40.30 50.51 68.50
NON-COKING COAL
Power 332.09 361.78 351.10 434.00 473.00
Power(Captive) 31.58 29.92 35.36 43.00 47.00
Cement 19.32 21.01 14.60 30.00 33.35
Sponge Iron 20.92 19.33 22.60 35.20 28.96
Fertilizers, BRK & Others
60.29 75.98 73.08 61.00 62.43
Sub-Total 464.20 508.02 541.02 103.20 644.74
Grand Total 504.21 548.85 581.32 653.71 713.24 11

COAL SUPPLY IN INDIA (mt) Company 2006-07 2007-08 2008-09 2009-10
CIL 361 379 404 431
SCCL 38 41 45 45
Others 32 37 45 53
Imports 43 50 59 68
Total 474 507 552 597 12

COAL PRODUCTION IN INDIA (mt) Comp. No. of
Mines 2007-08 2008-09 2009-10 2010-11 2011-12
Target 2016-17 Target
ECL 110 24.06 28.13 30.07 30.81 33.20 48.00
BCCL 82 25.22 25.51 27.51 29.00 30.20 35.00
CCL 62 44.15 43.24 47.08 47.52 51.50 115.00
NCL 10 59.62 63.65 67.67 66.25 69.50 80.50
WCL 86 43.51 44.70 45.74 43.66 45.70 45.00
SECL 91 93.79 101.15 108.01 112.71 113.75 140.00
MCL 24 88.01 96.34 104.08 100.28 107.10 197.00
NEC 8 1.10 1.01 1.11 1.10 1.05 3.50
CIL 473 379.46 403.73 431.27 431.33 452.00 664.00
SCCL 50 40.60 44.54 44.50 47.00
Others 38 37.02 44.68 56.29 58.28
TOTAL 561 457.08 492.95 532.06 557.28
13

Raw Coal Offtake (2009-10) Sector %age
Share
Power 80%
Small & Medium Industries 11%
Steel 5%
Cement 2%
Other Industries 2% 14

Type of Coal 2007-08 2008-09 2009-10 2011-12 (Tgt)
COKING 22.03 21.08 23.47 42.48
NON-COKING 27.77 37.92 44.28 40.85
TOTAL 49.80 59.00 67.74 83.33
15
COAL IMPORT (MT) IN INDIA

Brief History of CIL 1774 First coal mine started in Raniganj Coalfield
1956 Formation of National Coal Development Corporation (NCDC).
01-05-1972 Nationalisation of Coking Coal Mines & formation of BCCL.
01-05-1973 Nationalisation of Non-Coking Coal Mines & formation of Coal Mines Authority Limited (CMAL).
01-11-1975 Formation of CIL with 5 subsidiaries BCCL, CCL, WCL, ECL & CMPDIL.
28-11-1985 NCL carved out of CCL & SECL carved out of WCL.
03-04-1992 MCL formed out of SECL
01-01-2000 Deregulation of Coal pricing & distribution.
2007 CIL & 5 subsidiaries (NCL, SECL, MCL, CCL & WCL) was accorded MINI-RATNA Cat-I.
29-05-2009 CMPDIL was accorded MINI-RATNA Cat-II status.
24-10-2008 CIL was accorded NAV-RATNA status.
11-04-2011 CIL was accorded MAHA-RATNA status. 16
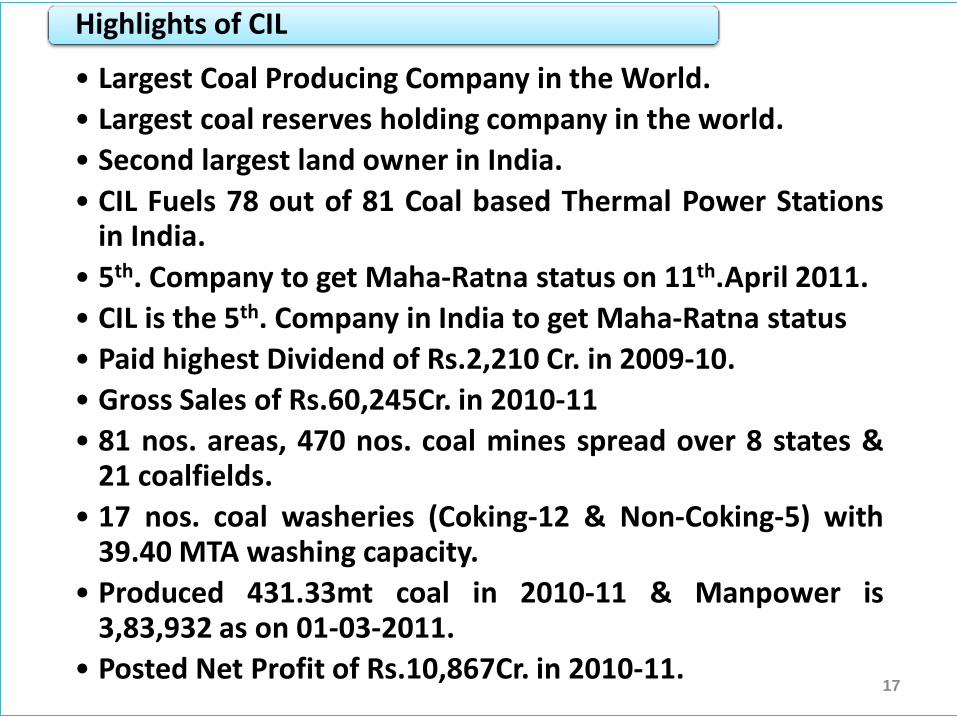
• Largest Coal Producing Company in the World.
• Largest coal reserves holding company in the world.
• Second largest land owner in India.
• CIL Fuels 78 out of 81 Coal based Thermal Power Stations in India.
• 5th. Company to get Maha-Ratna status on 11th.April 2011.
• CIL is the 5th. Company in India to get Maha-Ratna status
• Paid highest Dividend of Rs.2,210 Cr. in 2009-10.
• Gross Sales of Rs.60,245Cr. in 2010-11
• 81 nos. areas, 470 nos. coal mines spread over 8 states & 21 coalfields.
• 17 nos. coal washeries (Coking-12 & Non-Coking-5) with 39.40 MTA washing capacity.
• Produced 431.33mt coal in 2010-11 & Manpower is 3,83,932 as on 01-03-2011.
• Posted Net Profit of Rs.10,867Cr. in 2010-11.
Highlights of CIL
17

Mission of CIL
18
To produce the planned quantity of coal efficiently & economically with due regards to safety, conservation & quality.
Be the leading energy supplier in the country through best practices from mine to market.
Vision of CIL

Board of Directors of CIL (as on 01.04.2011)
• Sri NC Jha, Chairman
• Sri AK Sinha, Director(Fin.)
• Sri NC Jha, Director(Tech.)
• Sri R. Mohan Das, Director(P&IR)
• Dr. AK Sarkar, Director(Marketing)
EXECUTIVE DIRECTORS
• Sri Alok Perti, Addl. Secy., MOC, New Delhi
• Smt. Anjali Anand Srivastava, Jt. Secy & Financial Advisor, MOC
GOVT. NOMINEE DIRECTORS
• Dr. AK Rath
• Smt. Sheela Bhinde
• Sri Kamal R. Gupta
INDEPENDENT DIRECTORS
• Sri DC Garg, CMD, WCL
• Sri AK Singh, CMD, CMPDIL
• Sri Pradeep Bhatnagar, Addl. Member (Traffic Transp.), Railway Board
PERMANENT INVITEES
19

Coalfields under CIL Co. Coalfields
ECL Deogarh, Rajmahal & Raniganj
BCCL Jharia & Raniganj
CCL Daltonganj, East Bokaro, Bokaro, Giridih, Hutar, North Karanpura, Ramgarh, South Karanpura & West Bokaro
NCL Singrauli
WCL Kamptee, Pathakhera, Pench-Kanhan, Umer Nand Bander & Wardha Valley
SECL Bisrampur, Chirimiri, Jhilimili, Johila, Korba, Lakhanpur, Mand-Raigarh, Sundergarh, Sohagpur, Sonhat, Tatapani-Ramkola & Umaria
MCL Ib-Valley, Talcher
NEC Makum & Dilli-Jeypore
20

Coalfield Comp Reserve (MT)
Daltonganj CCL 15.90
Hutar CCL 00.00
Tattapani-Ramkola SECL 478.80
Dilli-Jeypore NEC(CIL) 18.90 21
Coalfields currently not under Production

•Eastern Coalfields Limited (ECL)
•Bharat Coking Coal Limited (BCCL)
•Central Coalfields Limited (CCL)
•Northern Coalfields Limited (NCL)
•Western Coalfields Limited (WCL)
•South Eastern Coalfields Limited (SECL)
•Mahanadi Coalfields Limited (MCL)
•Central Mine Planning & Design Institute Ltd (CMPDIL)
•Coal India Africana Limitada
SUBSIDIARIES OF CIL
22

Co. CMD D(T/O) D(T/P&P) D(F) D(P)
BCCL T.K. Lahiri - D.C. Jha P.G. Nandy P.E. Kachhap
ECL Rakesh Sinha S.K. Chakravarty N.Kumar - S.K.Srivastava
CCL R.K. Saha T.K. Nag - A. Chatterjee -
WCL D.C.Garg B.K. Saxena Om Prakash S.Behl O.P.Miglani
NCL V.K. Singh O. P. Mishra N. Das S.K. Rawat S. Sahu
SECL A.K.Singh P.K.Raichoudhury G. Singh A.R.Komawar R.S.Singh
MCL A.N. Sahay A.K. Tiwari A.K.Singh K. Biswas S.C.Padhy
CIL N.C. Jha
Chairman
N.C.Jha
D(T/O)
Dr.A.K.Sarkar
Dir(Mktg)
A.K.Sinha
D(F)
R.Mohan Das
D(P)
CMPDI A.K.Singh
CMD
-
N.Khurana,
D(T)/(CRD)
A.K.Debnath,
D(T)/(P&D)
S. K. Mitra,
D(T)/(ES)
23
FUNCTIONAL DIRECTORS (as on 01.04.2011)

REGIONAL INSTITUTES (RI) OF CMPDIL
Regional Institute-I : ASANSOL (ECL)
Regional Institute-II : DHANBAD (BCCL)
Regional Institute-III : RANCHI (CCL)
Regional Institute-IV : NAGPUR (WCL)
Regional Institute-V : BILASPUR (SECL)
Regional Institute-VII : SINGRAULI (NCL)
Regional Institute-VII : BHUBANESHWAR(MCL) 24

AREAS & MINES OF CIL (1st.April 2009) Co. Coal
Reserve (bt)
No.of Areas
No. of mines
OC UG Mix. Total
ECL 45.04 14 21 82 7 110
BCCL 19.43 13 18 47 17 82
CCL 40.73 11 36 24 2 62
NCL 13.478 10 10 - - 10
WCL 13.086 10 39 43 4 86
SECL 50.116 13 21 69 1 91
MCL 65.227 9 15 9 0 24
NEC 1.177 1 3 5 0 8
CIL 248.28 81 163 279 31 473 25

MANPOWER OF CIL (as on 1st.November 2010)
Company Executive Supervisor Workmen Total
ECL 2,144 6,743 73,590 82,477
BCCL 2,012 6,603 60,525 69,140
CCL 2,285 3,700 46,984 52,969
WCL 2,249 5,923 51,340 59,512
SECL 2,712 8,577 67,089 78,378
MCL 1,345 2,910 17,154 21,409
NCL 1,351 1,993 12,967 16,311
NEC 100 449 2,112 2,661
CMPDI 842 752 1,560 3,154
DCC 35 96 462 593
CILHQ 356 109 576 1,041
Total 15,431 37,855 3,34,359 3,87,645 26

Top 10 Areas of CIL (2009-10) S.N. Areas Comp. Prod(mt)
1 Gevra SECL 35.00
2 Dipka SECL 24.10
3 Jagannath MCL 22.52
4 Lakhanpur MCL 20.21
5 Piparwar CCL 17.20
6 Kusmunda SECL 14.20
7 Jayant NCL 13.35
8 Dudhichua NCL 13.31
9 Lingraj MCL 13.00
10 Hingula MCL 12.43 27

Top 10 Mines of CIL (2009-10) S.N. Mines Comp. Prod(mt)
1 Gevra SECL 35.00
2 Dipka SECL 24.10
3 Jayant NCL 13.35
4 Dudhichua NCL 13.31
5 Lakhanpur MCL 13.06
6 Lingraj MCL 13.00
7 Ananta MCL 12.82
8 Nigahi NCL 12.36
9 Rajmahal ECL 11.26
10 Kusmunda SECL 11.20 28

Expansion of Big OCP Mines Comp. Cap.(mt)
Gevra SECL 35
Dipka SECL 25
Talabira MCL 20
Rajmahal ECL 17
Lingraj MCL 16
Amrapali CCL 12
Pelma SECL 10
Khadia NCL 10
Magadh CCL 08 29

Coal Reserves under CIL as on 1st.April 2010 (bt)
Coal Reserves INDIA CIL
Proved 110 53
Indicated 131 10
Inferred 36 2
Total 277 65
Extractable NA 22 30

Cost of Coal Production in CIL Year Cost of Production (Rs./tonne)
OC UG
2006-07 447 2,254
2007-08 476 2,584
2008-09 507 2,660
2009-10 520 2,796 31

MODE % Share
INDIA CIL
RAIL 46.34% 46.70%
ROAD 28.70% 29.50%
MGR 18.95% 20.80%
OTHER 6.00% 3.00% 32
Modewise Coal Transportation (2009-10)

CIL PERFORMANCE AT A GLANCE S. N.
Description Unit 2009-10 2008-09
UG OC O/all UG OC O/all
1 Coal Production mt 43.25 388.01 431.26 43.96 359.77 403.73
4 Coking Coal mt 36.13 26.54
5 Non-Coking Coal mt 395.13 377.19
6 Washed Coal mt 14.58 14.96
7 OBR mcum 682.03 645.13
8 Offtake mt 415.88 401.46
9 Despatch mt 415.22 400.74
10 OMS te 0.78 9.51 4.47 0.76 9.07 4.16
13 Manpower Lakh 3.97 4.12
14 Profit Rs.cr 13,964.93 5,744.10
15 Cap.Utilisation % 86.80 91.39 90.25 85.10 95.01 94.67 33
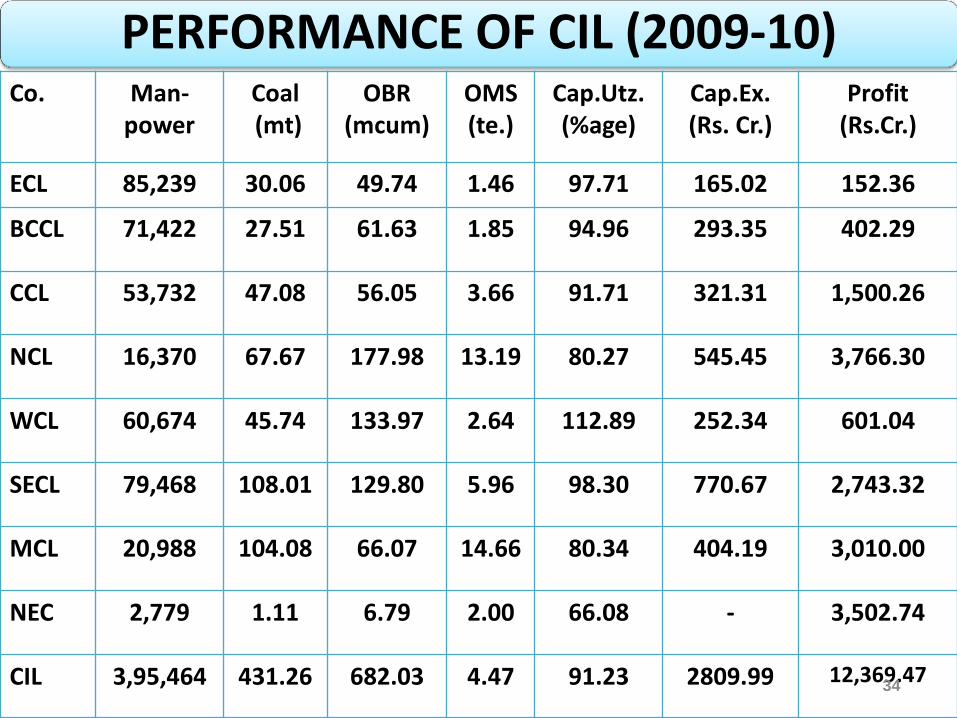
PERFORMANCE OF CIL (2009-10) Co. Man-
power Coal (mt)
OBR (mcum)
OMS (te.)
Cap.Utz. (%age)
Cap.Ex. (Rs. Cr.)
Profit (Rs.Cr.)
ECL 85,239 30.06 49.74 1.46 97.71 165.02 152.36
BCCL 71,422 27.51 61.63 1.85 94.96 293.35 402.29
CCL 53,732 47.08 56.05 3.66 91.71 321.31 1,500.26
NCL 16,370 67.67 177.98 13.19 80.27 545.45 3,766.30
WCL 60,674 45.74 133.97 2.64 112.89 252.34 601.04
SECL 79,468 108.01 129.80 5.96 98.30 770.67 2,743.32
MCL 20,988 104.08 66.07 14.66 80.34 404.19 3,010.00
NEC 2,779 1.11 6.79 2.00 66.08 - 3,502.74
CIL 3,95,464 431.26 682.03 4.47 91.23 2809.99 12,369.47 34

Performance of CIL (2010-11) Comp Coal Production (mt) OB
(Mcum) Off-take
(mt)
UG OC Total
ECL 7.372 23.432 30.804 56.246 29.744
BCCL 3.696 25.308 29.004 83.226 29.341
CCL 1.270 46.250 47.520 62.520 46.230
NCL - 66.253 66.253 182.216 64.208
WCL 8.704 34.950 43.654 115.824 42.560
SECL 16.803 95.902 112.705 137.565 109.020
MCL 2.167 98.113 100.280 88.702 102.092
NEC 0.001 1.099 1.100 5.809 1.102
CIL 40.013 391.307 431.320 732.108 424.297 35

TARGETS FOR CIL (2011-12) Co. Sp.
Density Coal
Prodn (mt)
Coal Offtake
(mt)
Coal Desp (mt)
OBR (mcum)
OMS (O/All)
(te)
Cap. Utlz. (%)
ECL 1.59 33.20 34.10 33.70 61.00 4.73 102
BCCL 1.53 30.20 36.20 36.04 84.00 2.20 116
CCL 1.60 51.50 56.05 56.04 63.00 4.51 98
NCL 1.55 69.50 70.50 70.50 239.00 17.68 86
WCL 1.55 45.70 46.50 46.80 127.00 2.55 100
SECL 1.62 113.75 116.92 116.90 153.00 6.29 112
MCL 1.66 107.10 115.68 115.68 100.00 15.84 91
NEC 1.40 1.05 1.05 1.05 8.00 2.17 88
CIL 1.60 452.00 477.00 476.39 835.00 4.97 98 36
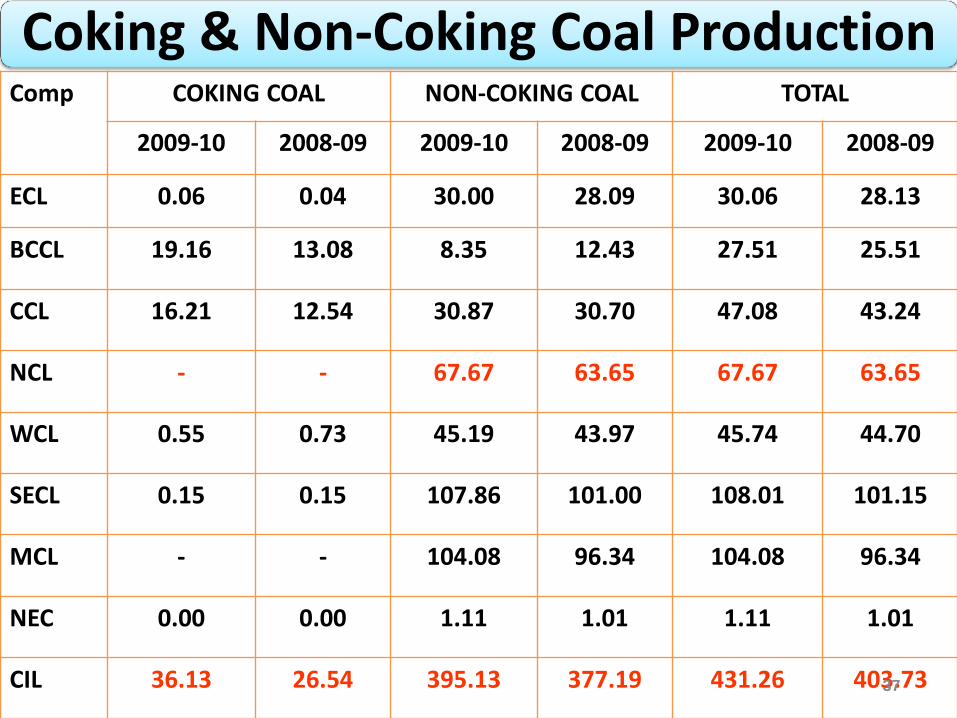
Coking & Non-Coking Coal Production Comp COKING COAL NON-COKING COAL TOTAL
2009-10 2008-09 2009-10 2008-09 2009-10 2008-09
ECL 0.06 0.04 30.00 28.09 30.06 28.13
BCCL 19.16 13.08 8.35 12.43 27.51 25.51
CCL 16.21 12.54 30.87 30.70 47.08 43.24
NCL - - 67.67 63.65 67.67 63.65
WCL 0.55 0.73 45.19 43.97 45.74 44.70
SECL 0.15 0.15 107.86 101.00 108.01 101.15
MCL - - 104.08 96.34 104.08 96.34
NEC 0.00 0.00 1.11 1.01 1.11 1.01
CIL 36.13 26.54 395.13 377.19 431.26 403.73 37

UG & OC Production Comp UNDERGROUND OPENCAST TOTAL
2009-10 2008-09 2009-10 2008-09 2009-10 2008-09
ECL 8.23 8.39 21.83 19.74 30.06 28.13
BCCL 3.90 4.13 23.61 21.38 27.51 25.51
CCL 1.47 1.56 45.61 41.68 47.08 43.24
NCL - - 67.67 63.65 67.67 63.65
WCL 9.62 10.11 36.12 34.59 45.74 44.70
SECL 17.83 17.57 90.18 83.58 108.01 101.15
MCL 2.20 2.15 101.88 94.19 104.08 96.34
NEC 0.00 0.05 1.11 0.96 1.11 1.01
CIL 43.25 43.96 388.01 359.77 431.26 403.73 38

OUTPUT PER MANSHIFT (tes.) Comp UNDERGROUND OPENCAST TOTAL
2009-10 2008-09 2009-10 2008-09 2009-10 2008-09
ECL 0.47 0.46 7.29 6.42 1.46 1.33
BCCL 0.39 0.41 4.85 2.91 1.85 1.22
CCL 0.35 0.36 5.24 4.65 3.66 3.27
NCL - - 13.19 14.58 13.19 14.58
WCL 1.12 1.14 4.12 3.99 2.64 2.55
SECL 1.33 1.26 18.89 15.76 5.96 5.26
MCL 1.29 1.25 18.89 23.06 14.66 16.60
NEC 0.00 0.10 7.85 7.83 2.00 1.77
CIL 0.78 0.76 9.51 8.95 4.47 4.09 39

COST OF PRODUCTION (Rs./tonne) Comp OC UG OVERALL
ECL 792.32 4,930.41 1,984.67
BCCL 927.51 6,480.00 1,794.40
CCL 663.59 5,652.13 842.72
NCL 601.06 - 601.06
WCL 821.20 2,123.20 1,115.76
SECL 378.67 1,963.78 652.38
MCL 324.00 1,664.06 353.84
CIL 536.13 3,114.36 812.71 40

SALE VALUE (Rs./tonne) Comp OC UG OVERALL
ECL 1,169.77 1,936.04 1,390.57
BCCL 1,224.30 1,626.82 1,287.15
CCL 958.21 1,494.07 977.45
NCL 1,010.07 - 1,010.07
WCL 1,188.27 1,435.90 1,244.31
SECL 708.30 1,411.32 829.69
MCL 550.47 926.62 558.84
CIL 856.99 1,514.11 927.48 41

OB Removal (Mcum) in CIL
Comp 2010-11 2009-10 2008-09
ECL 56.54 49.74 43.07
BCCL 83.45 61.63 53.60
CCL 62.52 56.05 55.63
NCL 186.52 177.98 202.75
WCL 115.82 133.97 126.66
SECL 138.43 129.80 107.00
MCL 88.70 66.07 51.84
NEC 6.16 6.79 4.58
CIL 738.16 682.03 645.13 42

MANPOWER OF COAL INDIA Comp. 31.03.2009
(Actual) 31.03.2010
(Actual) 31.03.2011 (Estimated)
31.03.2012 (BE)
ECL 90,470 85,617 81,331 77,541
BCCL 76,369 71,838 68,180 65,234
CCL 56,553 54,057 51,117 48,475
NCL 16,450 16,373 16,661 17,025
WCL 62,492 60,870 63,310 64,273
SECL 82,054 80,381 78,676 76,944
MCL 20,869 20,978 22,275 23,643
NEC 2,962 2,820 2,694 2,649
CMPDI 3,065 3,156 3,565 3,565
CIL-HQ 1,056 1,048 1,015 1,001
CIL 4,12,350 3,97,138 3,88,724 3,80,350 43

PROFIT (Rs.Cr.) OF CIL Comp. 2008-09 2009-10
ECL -2,105.70 +333.40
BCCL -1,376.99 +793.93
CCL +763.80 +1533.05
NCL +3,131.01 +3,766.30
WCL +516.12 +931.02
SECL +1,817.93 +3,063.57
MCL +2,580.25 2,953.90
CMPDIL +6.74 +19.61
CIL/NEC +3,657.68 +3,870.40
Overall +5,744.10 +13,964.93 44

Manpower vs OMS of CIL Comp. Prodn
(MT) Manpower (Year End)
OMS (UG)
OMS (OC)
OMS (O/All)
2000-01 268.14 5,42,051 0.63 5.90 2.29
2001-02 279.65 5,19,922 0.64 6.08 2.45
2002-03 290.69 5,01,419 0.69 6.30 2.67
2003-04 306.36 4,84,703 0.68 6.67 2.82
2004-05 323.58 4,68,450 0.69 7.18 3.05
2005-06 343.39 4,52,287 0.71 7.51 3.26
2006-07 360.91 4,39,343 0.71 8.00 3.54
2007-08 379.46 4,26,077 0.73 8.60 3.79
2008-09 403.73 4,12,350 0.76 8.95 4.09
2009-10 431.26 3,97,138 0.78 9.51 4.47 45

Share of UG & OC Production in CIL Year Coal Production (MT) Share (%)
UG OC Total UG OC
1974-75 58.22 20.77 78.99 73.71 26.29
1984-85 60.50 70.31 130.81 46.25 53.75
1994-95 55.60 167.46 223.06 24.93 75.07
2000-01 50.56 217.58 268.14 18.86 81.14
2004-05 47.04 276.54 323.58 14.54 85.46
2005-06 45.82 297.57 343.39 13.34 86.66
2006-07 43.32 317.59 360.91 12.00 88.00
2007-08 43.54 335.92 379.46 11.50 88.50
2008-09 43.96 359.77 403.73 10.90 89.10
2009-10 43.25 388.01 431.26 10.20 89.80
2010-11 40.02 391.31 431.33 9.28 90.72 46

FINANCIAL PERFORMANCE OF CIL Description Unit 2006-07 2007-08 2008-09 2009-10
Coal Prodn. mt 360.91 379.46 403.73 431.26
Coal Off take mt 375.33 375.33 401.46 415.96
Gross Sales Rs.Cr. 35,129.17 38,865.70 46,131.24 52,187.79
Gross Profit Rs.Cr. 8,687.40 8,888.39 5,900.60 14,101.39
Capital Employed Rs.Cr. 16,223.74 17,108.20 16,963.98 23,450.74
Net Worth Rs.Cr. 17,889.30 19,342.36 19,165.04 25,793.68
Profit before Tax Rs.Cr. 8,602.47 8,738.46 5,744.10 13,964.93
Profit after Tax Rs.Cr. 5,708.73 5,243.27 2,078.69 9,622.45
47

• Post the implementation of New Coal Distribution Policy (NCDP), 2007, CIL issues Letter of Assurance (LOA) on the basis of recommendation made by the inter-ministerial Standing Linkage Committee for supply of coal.
FUEL SUPPLY AGREEMENT (FSA)
• CIL an sell around 10%of its production through E-Auctions at market determined prices.
E-AUCTION Route
• CIL sells higher grade non-coking coal (A, B, C grade) & beneficiated coking and non-coking coal under specific MOUs with the clients
MOUs
48
CIL’s Coal Sales Mechanism

Producer’s share in destination price of coal
(CCL grade E Coal for a haul distance of 750km as on 01.04.2010)
Description Share
Rs./Te %age
CIL 834.00 50.00
Railway 677.30 40.60
Govt. 157.64 9.40 49

TYPES OF COAL
• Largely Power Generation LIGNITE(Brown Coal)
• THERMAL COAL (Steam Coal/Non-Coking Coal)
• Power Generation.
• Cement Manufacture.
• Industrial Uses.
• METALLURGICAL COAL(Coking Coal)
• Manufacture of Iron & steel.
BITUMINOUS
• Domestic fuel.
• Industrial use.
• Smokeless fuel.
ANTHACITE
50

GLOBAL

• HU in Kilocalorie/Kg = 8900 - 138 (A +M)
• Where A is Ash Content in %age
• M is Moisture Content in %age
• In case of coal having moisture less than 2% & volatile content less than 19%, the useful heat value shall be the value arrived at as above reduced by 150 kCal/Kg for each 1% reduction in volatile content below 19% fraction pro-rata.
• Both moisture & ash shall be determined after equilibrating at 60% Relative Humidity & 40 degree temperature as per revelant clauses of Indian Specifications No. IS : 1350 – 1959.
USEFUL HEAT VALUE (HUV)
52

Categorisation of Non-Coking Coal Grade UHV (kcal/kg)
UHV=8900-138(A+M) GCV (kcal/kg)
at 5% moisture level
A Exceeding 6,200 Exceeding 6,454
B Exceeding 5,600 but not Exceeding 6200
Exceeding 6,049 but not Exceeding 6,454
C Exceeding 4,940 but not Exceeding 5,600
Exceeding 5,597 but not Exceeding 6,049
D Exceeding 4,200 but not Exceeding 4,940
Exceeding 5089 but not Exceeding 5597
E Exceeding 3,360 but not Exceeding 4,200
Exceeding 4324 but not Exceeding 5089
F Exceeding 2,400 but not Exceeding 3,360
Exceeding 3865 but not Exceeding 4324
G Exceeding 1,300 but not Exceeding 2,400
Exceeding 3,113 but not Exceeding 3,865
53

Categorisation of Coking Coal GRADE ASH CONTENT
Steel Grade I Not exceeding 15%
Steel Grade II Exceeding 15% but not exceeding 18%
Washey Grade I Exceeding 18% but not exceeding 21%
Washery Grade II Exceeding 21% but not exceeding 21%
Washery Grade III Exceeding 24% but not exceeding 28%
Washery Grade IV Exceeding 28% but not exceeding 35% 54

Categorisation of Semi-Coking Coal
GRADE ASH + MOISTURE Content
Semi Coking Grade I Not exceeding 19%
Semi Coking Grade II Exceeding 19% but not exceeding 24%
55
Grade UHV (kcal/kg)
A 6,200 – 6,299
B 5,600 – 6,199
Categorisation of NEC Coal
• Coking Coal is converted to coke by driving off impurities to leave almost pure carbon.
• The physical properties of coking coal cause the coal to soften, liquefy & then re-solidify into hard but porous lumps when heated in the absence of air.
• The coking process consists of heating coal to around 1,000-1,100 degree C in the absence of oxygen to drive-off the volatile compound (pyrolysis).
• This process results in a hard porous material – Coke.
• The coking process takes between 12 to 36 hours.
What is COKE ?
56
• It is produced by high temperature carbonisation process.
• It is used in blast furnace for steel making.
• It is hard.
HARD COKE
• It is produced by low temperature carbonisation process.
• It is used as domestic fuel.
• It is soft.
SOFT COKE
57
Categorisation of Coke

• It is the process of coal washing resulting in value addition of coal due to reduction in ash percentage.
COAL BENEFICIATION
• Reduction in emission in to the atmosphere by end user industries.
• Reduction in ash handling and disposal cost.
• Reduction in load on transportation system.
• Increase in in thermal efficiency.
ADVANTAGES OF COAL BENEFICIATION
58

Size Fraction Washing Technique Used
COARSE COAL (100/75/50 –
25/15mm)
Coarse Coal Jig, Fine Coal Jig, Dense media bath, Cyclone, Barrel washer.
SMALL COAL
(15-0.5mm)
Small coal jig, DM Cyclone, FBC
FINE COAL
(-0.5mm)
Froth flotation, spiral concentrator, water only cyclone
Dewatering Vacuum filters, High frequency screen, centrifuge, Belt press filter
COAL WASHING TECHNOLOGY
• Less quantity of high quality coal reserves
• Huge reserves of poor quality coal in the country (65 % of non-coking coal reserve is of inferior grade ‘E to G’).
• MOEF’s mandatory requirements
• Varying customers’ needs
• Environmental threat
• Increased demand of lower ash coal i.e. high calorific value
• High cost of transportation of dirt along with coal and consequent disposal of ash
NEED FOR BENEFICIATION OF COAL
60

Categorisation of Coal as per size
•Unscreened coal of all sizes. R.O.M. Coal
•0 to 50 mm Slack Coal
•25 to 50 mm Rubble Coal
• 50 to 200 mm & above Steam Coal
61


1
2
3 4 5
6
7
9
8
10
COAL
LIGNITE
MAJOR COAL PRODUCING
COMPANIES IN INDIA
A) COAL INDIA LTD. EASTERN COALFIELDS LTD. (1)
BHARAT COKING COAL LTD. (2)
CENTRAL COALFIELDS LTD. (3)
NORTHERN COALFIELDS LTD. (4)
WESTERN COALFIELDS LTD. (5)
SOUTH EASTERN COALFIELDS LTD. (6)
MAHANADI COALFIELDS LTD. (7)
NORTH EASTERN COALFIELDS. (8)
CENTRAL MINE PLANNING & DESIGN
INSTITUTE
B) SINGARENI COLLIERIES CO.
LTD. (9)
C) NEYVELI LIGNITE
CORPORATION (10)

COAL RESERVES IN INDIA as on 1st.April 2010 (mt)
Type of Coal Proved Indicated Inferred Total %age Share
Prime Coking 4,614 699 0 5,313 1.92
Medium Coking 12,573 11,940 1,880 26,393 9.53
Semi-coking 482 1,003 222 1,707 0.62
Non-Coking 92,129 117,012 34,257 243,398 87.93
Total 109,798 130,654 36,359 276,810 100 64

State Reserve(bt)
Chhattisgarh 46.682
Orissa 66.307
Jharkhand 76.964
Madhya Pradesh 21.988
Andhra Pradesh 22.016
Maharashtra 10.3988
West Bengal 29.853
Uttar Pradesh 1.062
Meghalaya 0.576
Assam 0.385
J&K -
Arunachal Pradesh 0.090
TOTAL 276.81
State wise Coal Reserves (1st.April 2010)
65

State OC UG Mixed Total
Chhattisgarh 18 42 1 61
Orissa 16 9 0 25
Jharkhand 68 84 21 173
Madhya Pradesh 21 50 4 75
Andhra Pradesh 13 37 0 50
Maharashtra 33 22 0 55
West Bengal 19 76 6 101
Uttar Pradesh 5 0 0 5
Meghalaya - - - -
Assam 16 9 0 25
J&K 0 7 0 7
Arunachal Pradesh 1 0 0 1
TOTAL 197 332 32 561
Coal Mines in India (31st.March 2009)
66
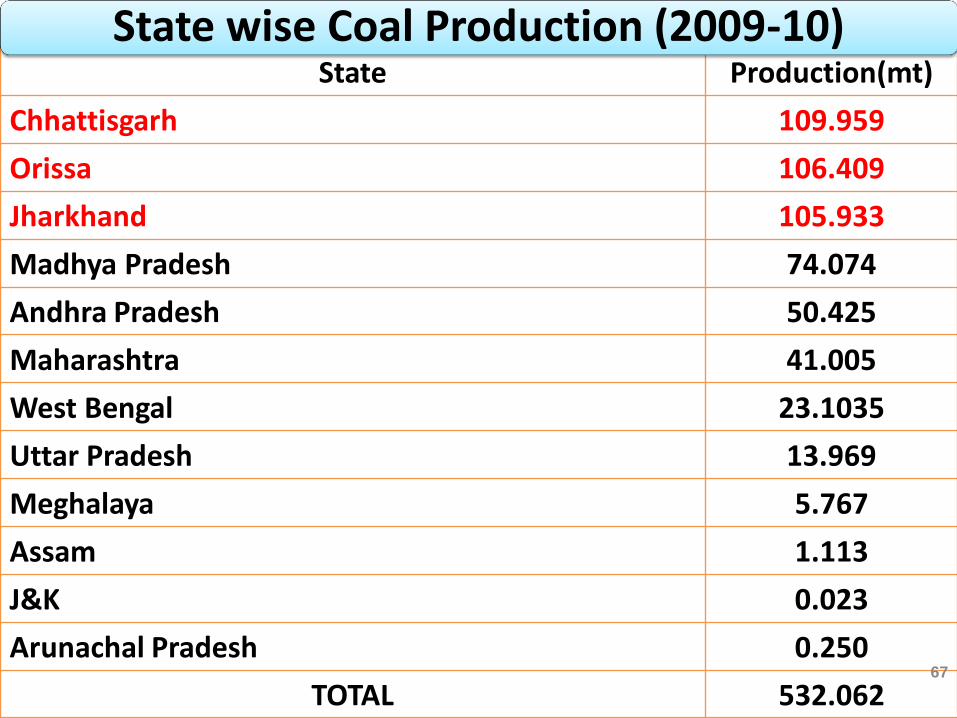
State Production(mt)
Chhattisgarh 109.959
Orissa 106.409
Jharkhand 105.933
Madhya Pradesh 74.074
Andhra Pradesh 50.425
Maharashtra 41.005
West Bengal 23.1035
Uttar Pradesh 13.969
Meghalaya 5.767
Assam 1.113
J&K 0.023
Arunachal Pradesh 0.250
TOTAL 532.062
State wise Coal Production (2009-10)
67

Coalfield wise Reserves (1st.April 2010) Coalfield State Company
Reserve (mt)
1. RANIGANJ WB/JH ECL/BCCL 25,766
2. RAJMAHAL GROUP JH/BH ECL 14,498
3. JHARIA JH BCCL 19,430
4. EAST & WEST BOKARO JH CCL 13,096
5. NORTH & SOUTH KARANPURA JH CCL 23,223
6. SINGRAULI MP/UP NCL 13,478
7. TALCHER ORISSA MCL 43,859
8. IB VALLEY ORISSA MCL 22,448
9. KORBA-MAND/RAIGARH CG SECL 33,883
10. CENTRAL INDIA COALFIELD (CIC) MP/CG SECL 10,955
11. WARDHA MS WCL 6,044
12. KAMPTEE MS WCL 2,973
13. PENCH-KANHAN-TAWA VALLEY-PATHAKHERA MP WCL 2,939
14. GODAWARI AP SCCL 22,016
15. MAKUM ASSAM NEC 327 68

Coalfieldwise Production (2009-10) Coalfield State Company Prodn.(mt)
1. RANIGANJ WB/JH ECL/BCCL 15.29
2. RAJMAHAL GROUP JH/BH ECL 14.83
3. JHARIA JH BCCL 27.45
4. EAST & WEST BOKARO JH CCL 18.44
5. NORTH & SOUTH KARANPURA JH CCL 27.54
6. SINGRAULI MP/UP NCL 67.67
7. TALCHER ORISSA MCL 59.74
8. IB VALLEY ORISSA MCL 44.34
9. KORBA-MAND/RAIGARH CG SECL 83.29
10. CENTRAL INDIA COALFIELDS (CIC) MP/CG SECL 24.72
11. WARDHA MS WCL 29.32
12. KAMPTEE MS WCL 5.03
13. PENCH-KANHAN-TAWA VALLEY-PATHAKHERA MP WCL 11.39
14. GODAWARI AP SCCL 44.50
15. MAKUM ASSAM NEC 1.11 69

• SDL : Side Discharge Loader
• LHD : Low Haul Dump
• UHV : Useful Heat Value
• GCV : Gross Calorific Value
• CBM : Coal Bed Methane
• ROM : Run of mine
• PSLW : Power Support Longwall
• MGR : Merry Go Round
• MARC : Maintenance And Repair Contract
• LCCM : Low Cost Continuous Miner
• UDM : Universal Drilling Machine
• UCG : Underground Coal Gasification
• NCDP : New Coal Distribution Policy
• BWE : Bucket Wheel Excavator
• FSA : Fuel Supply Agreement
• HEMM : Heavy Earth Moving Machinery
ABBREVIATIONS
70
• BEFEFICIATION : Process for cleaning of coal
• CALORIFIC VALUE : Amount of heat released during the combustion of a material.
• COKE : Solid carbonaceous material derived from destructive distillation of low ash & low sulphur bituminous coal
• ASH : The incombustible residue from mineral matter inherent within the coal
• FEEDER BREAKER : Coal crushing Equipment
• MIDDLINGS : By-product obtained from washing of coking coal.
• SHORTWALL : An UG mining method in which small areas are worked.
• OVERBURDEN(OB) : The material of any nature that overlies a deposit.
TERMINOLOGY
71

• LONGWALL MINING : A form of UG coal mining method, employs a steal plow or rotating drum, which is pulled mechanically back & forth across a face of coal that is usually several hundred feet long.
• COAL : A readily combustible rock containing more than 50% by weight & 70% by volume of carbonaceous material, including inherent moisture. It is formed from plant remains that have been compacted, indurated, chemically altered and metamorphosed by heat & pressure during geological time.
• LIGNITE : Low rank coal with a relatively high moisture content & low heat energy content available in colours ranging from black to brown.
TERMINOLOGY
72