coffee market performance and producer welfare upon the
TRANSCRIPT

Coffee Market Performance and Producer Welfare Upon the Introduction of the
Ethiopian Commodity Exchange
TINSAE DEMISE

ii
Promoters: Prof. dr. ir. Marijke D’Haese
Prof. dr. ir. Wim Verbeke
Dean: Prof. dr. ir. Marc Van Meirvenne
Rector: Prof. dr. Anne De Paepe

iii
MEMBERS OF THE JURY
Prof. dr. ir. Koen Dewettinck (Chairman)
Ghent University
Department of Food Safety and Food Quality
Prof. dr. ir. Pascal Boeckx (Secretary)
Ghent University
Department of Applied Analytical and Physical Chemistry, ISOFYS
Prof. dr. ir. Marijke D'Haese (Promoter)
Ghent University
Department of Agricultural Economics
Prof. dr. ir. Wim Verbeke (Promoter)
Ghent University
Department of Agricultural Economics
Prof. dr. ir. Jeroen Buysse
Ghent University
Department of Agricultural Economics
Dr. Kindie Getnet
International Food Policy Research Institute, Dhaka, Bangladesh
Dr. ir. Valeri Natanelov
Grow-a-bric

iv
TINSAE DEMISE
Coffee Market Performance and Producer Welfare Upon the Introduction of the Ethiopian
Commodity Exchange
Thesis submitted in the fulfillment of the requirements for the degree of
Doctor (PhD) in Applied Biological Sciences
This research was funded by a PhD grant of The Netherlands Organization
for International cooperation in Higher Education (NUFFIC)

v
Dutch title:
Prestatie van de koffiemarkt en welvaart van de producenten na de invoering
van de Ethiopian Commodity Exchange

vi
Acknowledgments
At the outset, I would like to praise the Almighty God who always let the bulk of unfinished
work to be completed at a moment. I am grateful to my respected promoters, Prof. dr. ir.
Marijke D’Haese and Prof. dr. ir. Wim Verbeke for their unreserved advice, guidance, and
constructive criticism starting from the very commencement up to my PhD completion.
Without their encouragement, insight and professional expertise, the completion of this
work would not have been possible. I also would like to express my gratitude to Dr. ir.
Valéri Natanelov, for your support during the last four years. You were the one who
introduce me to the world of time series econometrics. I furthermore wish to express my
sincere gratitude to the members of the jury a for their comments and advise to improve
the quality of this dissertation.
A special thanks to Firew Demise. Thank you for your assistance, encouragement and
precious time you spent on sharing my burden in all my way. Thank you brother. I am
indebted to many individuals for their help and encouragement rendered while conducting
this study. I would also like to thank all of my colleagues at Jimma University for all your
supports.
Thanks to all colleagues at the Department of Agricultural Economics. I will always
remember all the happy moments I had with you, drink after work, board game, sport
events, special dinner…My special thanks extend to my officemates Lotte, Eline and
Annelien who made my Gent stay as pleasant as possible.
I would like to thank the Netherlands organization for international cooperation in higher
education (NUFFIC) for the financial grant to do my PhD work. My deepest gratitude goes
to Mr. Jaspers Carel who has been easing all of my financial matters. My PhD would have
been quite a long journey without the help of the project management team from the North
(Q-point, Netherland) and Jimma University (Dr. Derbew Belew, Mr. Getachew Negussie
and Mrs. Selamawit Teshome)

vii
I am very grateful to my parents for their incessant moral support. The generous support
and encouragement of my mother Aregash Abiyo and my father Demise Handino, all
closest families and relatives are deeply acknowledged and emphasized in all cases of
my future life.

viii
Table of Contents
Acknowledgments ........................................................................................................... vi
List of tables ................................................................................................................... xii
List of figures ................................................................................................................. xiii
List of abbreviations ........................................................................................................ xv
Summary ...................................................................................................................... xvii
Chapter 1 ......................................................................................................................... 1
Introduction, objectives, and outline of the thesis ......................................................... 1
1.1 Background ............................................................................................................ 2
1.2 Problem statement and Motivation of the study...................................................... 4
1.3 Research objectives and research questions ......................................................... 6
1.4 Research questions ................................................................................................ 6
1.5 Analytical framework .............................................................................................. 7
1.6 Data ...................................................................................................................... 11
1.6.1 Price data ....................................................................................................... 11
1.6.2 Study area for household level analysis ......................................................... 12
1.6.3 Sampling ........................................................................................................ 13
1.7 Methodological approaches ................................................................................. 14
1.8 Thesis outline ....................................................................................................... 16
Chapter 2 ....................................................................................................................... 18
Understanding the Ethiopian coffee market ............................................................... 18
2.1 Coffee market in the pre ECX era ........................................................................ 19
2.2 Coffee market in the post ECX era ....................................................................... 22
2.3 Ethiopian Coffee Variety, Processing and Grading .............................................. 26
2.4 Coffee Processing ................................................................................................ 31
2.5 Quality and grading .............................................................................................. 33
Chapter 3 ....................................................................................................................... 36
Cointegration of Ethiopian export coffee with global markets under origin differentials
before and after the establishment of the Ethiopian Commodity Exchange ............... 36
3.1 Introduction........................................................................................................... 37

ix
3.2 Background .......................................................................................................... 40
3.3 Data sources and econometric methods .............................................................. 41
3.3.1 Data and sources ........................................................................................... 41
3.4 Econometrics methodology .................................................................................. 44
3.4.1 Stationarity test .............................................................................................. 45
3.4.2 The bounds test approach to cointegration (ARDL model) ............................ 45
3.4.3 Nonlinear Autoregressive Distributed Lag model (NARDL) ............................ 48
3.5 Results ................................................................................................................. 50
3.5.1 Stationary test ................................................................................................ 50
3.5.2 Cointegration tests between prices of Ethiopian and internationally traded
coffees .................................................................................................................... 51
3.5.3 Long-run price adjustment and speed of adjustment ..................................... 53
3.6 Robustness test .................................................................................................... 56
3.7 Discussion and Conclusion .................................................................................. 56
Chapter 4 ....................................................................................................................... 59
Empirical Investigation into Spatial Integration Without Direct Trade: Comparative
Analysis Before and After the Establishment of the Ethiopian Commodity Exchange 59
4.1 Introduction........................................................................................................... 60
4.2 Background and research approach .................................................................... 63
4.3 Data sources ........................................................................................................ 66
4.4 Econometric analysis ........................................................................................... 66
4.4.1 The bounds test approach to cointegration .................................................... 66
4.4.2 The Toda–Yamamoto approach to the Granger causality test ....................... 66
4.5 Persistence profile ................................................................................................ 67
4.6 Empirical results ................................................................................................... 68
4.6.1 Stationary analysis ......................................................................................... 68
4.6.2 ARDL bounds tests for cointegration .............................................................. 70
4.6.3 Toda and Yamamoto causality test results .................................................... 74
4.7 The persistence profiles test................................................................................. 76
4.8 Conclusions .......................................................................................................... 78
Chapter 5 ....................................................................................................................... 80

x
Market integration and price transmission under institutionalised Ethiopian coffee
market: Evidence from nonlinear ARDL model .......................................................... 80
5.1 Introduction........................................................................................................... 81
5.2 Empirical Literature .............................................................................................. 85
5.3 Data Sources and Econometric Methods ............................................................. 87
5.3.1 Data and sources ........................................................................................... 87
5.3.2 Econometric analysis: Nonlinear Autoregressive Distributed Lag model
(NARDL) ................................................................................................................. 91
5.4.2 Coffee market channel ................................................................................... 94
5.4.3 NARDL bounds tests for cointegration ........................................................... 96
5.4.4 Asymmetric price transmission....................................................................... 97
5.5 Robustness tests ................................................................................................ 101
5.6 Conclusions ........................................................................................................ 101
Chapter 6 ..................................................................................................................... 104
De-commoditising Ethiopian coffees after the establishment of the ECX: An empirical
investigation of smallholder coffee producers in Ethiopia ......................................... 104
6.1 Introduction......................................................................................................... 105
6.2 Empirical challenges .......................................................................................... 107
6.3 Methodology ....................................................................................................... 109
6.3.1 Study area, data collection and sampling ..................................................... 109
6.3.2 The propensity score matching method ....................................................... 111
6.3.3 Treatment heterogeneity .............................................................................. 113
6.4 Result and discussion ........................................................................................ 114
6.4.1 Farm characteristics and matching coffee producers ................................... 114
6.4.2 Average impact of certification and traceability on producer’s welfare ......... 117
6.5 Sensitivity Analysis ............................................................................................. 122
6.5.1 Robustness of matching algorithm ............................................................... 122
6.5.2 Sensitivity of ATT to hidden bias .................................................................. 123
6.6 Heterogeneous impact of certification and traceability ....................................... 124
6.6.1 Stratification Multilevel- Heterogeneous treatment effect ............................. 124
6.6.2 Matching Smoothing Heterogeneous Treatment Effects estimation............. 126
6.7 Discussion and Conclusion ................................................................................ 126

xi
Chapter 7 ..................................................................................................................... 130
Conclusion ............................................................................................................... 130
7.1 Revisiting and answering research questions .................................................... 131
7.2 Major research contributions .............................................................................. 137
7.3 Policy recommendation ...................................................................................... 138
7.4 Limitation and further study ................................................................................ 141
Appendices .................................................................................................................. 143
Appendix I: Nonlinear cointegration test results (NARDL) of prices of Ethiopian coffees
with prices of coffees on the international market..................................................... 143
Appendix II: CUSUM Test ........................................................................................ 144
Appendix III: Stratification-Multilevel (SM) Heterogeneous traceable effects ........... 147
Appendix IV: Matching-Smoothing (MS) Heterogeneous certification and traceability
effect ........................................................................................................................ 149
Appendix V: Balancing tests of matched samples .................................................... 151
Reference .................................................................................................................... 152
Curriculum Vitae ....................................................................................................... 163
xii
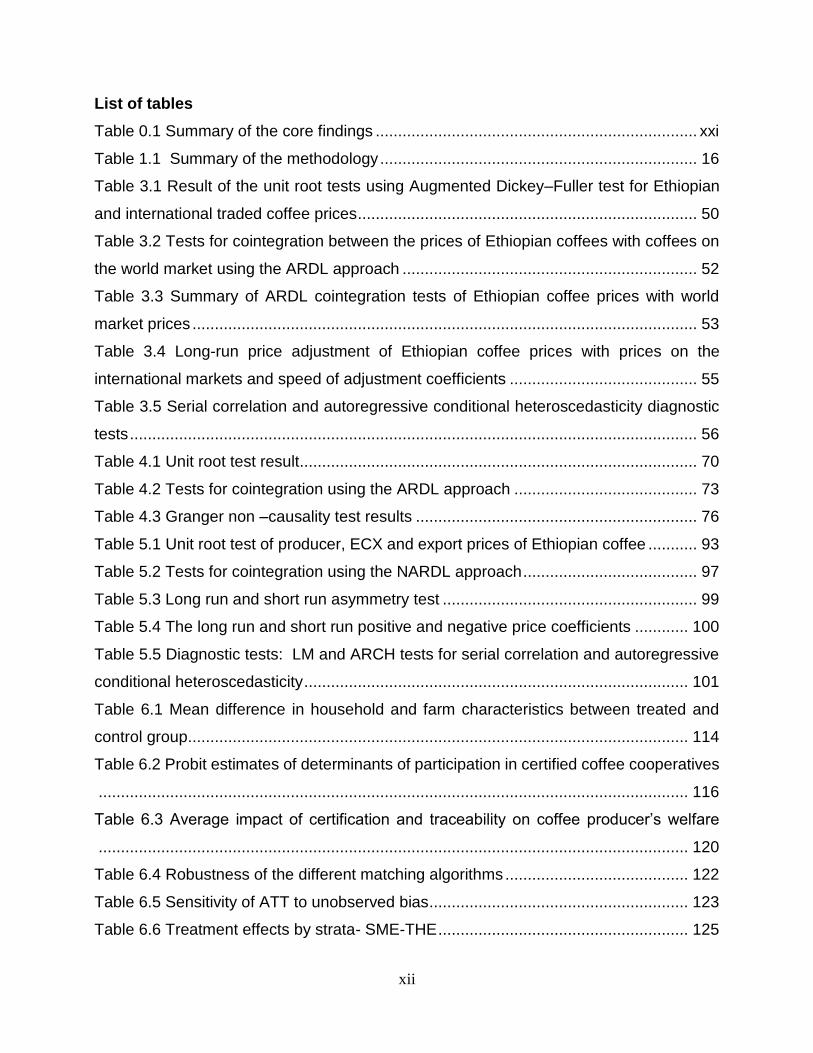
List of tables
Table 0.1 Summary of the core findings ........................................................................ xxi
Table 1.1 Summary of the methodology ....................................................................... 16
Table 3.1 Result of the unit root tests using Augmented Dickey–Fuller test for Ethiopian
and international traded coffee prices ............................................................................ 50
Table 3.2 Tests for cointegration between the prices of Ethiopian coffees with coffees on
the world market using the ARDL approach .................................................................. 52
Table 3.3 Summary of ARDL cointegration tests of Ethiopian coffee prices with world
market prices ................................................................................................................. 53
Table 3.4 Long-run price adjustment of Ethiopian coffee prices with prices on the
international markets and speed of adjustment coefficients .......................................... 55
Table 3.5 Serial correlation and autoregressive conditional heteroscedasticity diagnostic
tests ............................................................................................................................... 56
Table 4.1 Unit root test result ......................................................................................... 70
Table 4.2 Tests for cointegration using the ARDL approach ......................................... 73
Table 4.3 Granger non –causality test results ............................................................... 76
Table 5.1 Unit root test of producer, ECX and export prices of Ethiopian coffee ........... 93
Table 5.2 Tests for cointegration using the NARDL approach ....................................... 97
Table 5.3 Long run and short run asymmetry test ......................................................... 99
Table 5.4 The long run and short run positive and negative price coefficients ............ 100
Table 5.5 Diagnostic tests: LM and ARCH tests for serial correlation and autoregressive
conditional heteroscedasticity ...................................................................................... 101
Table 6.1 Mean difference in household and farm characteristics between treated and
control group ................................................................................................................ 114
Table 6.2 Probit estimates of determinants of participation in certified coffee cooperatives
.................................................................................................................................... 116
Table 6.3 Average impact of certification and traceability on coffee producer’s welfare
.................................................................................................................................... 120
Table 6.4 Robustness of the different matching algorithms ......................................... 122
Table 6.5 Sensitivity of ATT to unobserved bias .......................................................... 123
Table 6.6 Treatment effects by strata- SME-THE ........................................................ 125
xiii
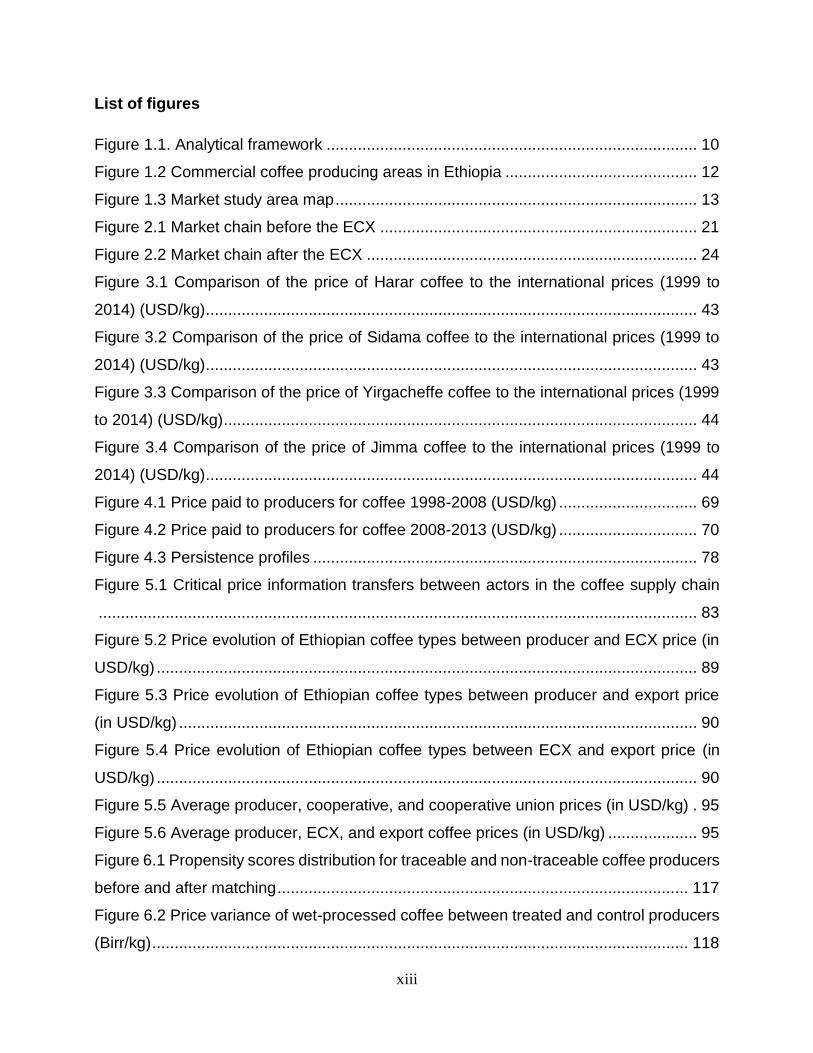
List of figures
Figure 1.1. Analytical framework ................................................................................... 10
Figure 1.2 Commercial coffee producing areas in Ethiopia ........................................... 12
Figure 1.3 Market study area map ................................................................................. 13
Figure 2.1 Market chain before the ECX ....................................................................... 21
Figure 2.2 Market chain after the ECX .......................................................................... 24
Figure 3.1 Comparison of the price of Harar coffee to the international prices (1999 to
2014) (USD/kg) .............................................................................................................. 43
Figure 3.2 Comparison of the price of Sidama coffee to the international prices (1999 to
2014) (USD/kg) .............................................................................................................. 43
Figure 3.3 Comparison of the price of Yirgacheffe coffee to the international prices (1999
to 2014) (USD/kg) .......................................................................................................... 44
Figure 3.4 Comparison of the price of Jimma coffee to the international prices (1999 to
2014) (USD/kg) .............................................................................................................. 44
Figure 4.1 Price paid to producers for coffee 1998-2008 (USD/kg) ............................... 69
Figure 4.2 Price paid to producers for coffee 2008-2013 (USD/kg) ............................... 70
Figure 4.3 Persistence profiles ...................................................................................... 78
Figure 5.1 Critical price information transfers between actors in the coffee supply chain
...................................................................................................................................... 83
Figure 5.2 Price evolution of Ethiopian coffee types between producer and ECX price (in
USD/kg) ......................................................................................................................... 89
Figure 5.3 Price evolution of Ethiopian coffee types between producer and export price
(in USD/kg) .................................................................................................................... 90
Figure 5.4 Price evolution of Ethiopian coffee types between ECX and export price (in
USD/kg) ......................................................................................................................... 90
Figure 5.5 Average producer, cooperative, and cooperative union prices (in USD/kg) . 95
Figure 5.6 Average producer, ECX, and export coffee prices (in USD/kg) .................... 95
Figure 6.1 Propensity scores distribution for traceable and non-traceable coffee producers
before and after matching ............................................................................................ 117
Figure 6.2 Price variance of wet-processed coffee between treated and control producers
(Birr/kg) ........................................................................................................................ 118

xiv
Figure 6.3 Price variance of dry-processed coffee between treated and control producers
(Birr/kg) ........................................................................................................................ 118

xv
List of abbreviations
ADF Augmented Dickey–Fuller
AIC Akaike Information Criterion
ARCH Autoregressive Conditional Heteroscedasticity
ARDL Autoregressive Distributed Lag
ATT Average Treatment Effect on the Treated
BEKK Baba-Engle-Kraft-Kroner Models
CIA Conditional Independence Assumption
CLU Coffee Liquoring Unit
CR4 Four-Firm Concentration Ratio
CR8 Eight-Firm Concentration Ratio
CSA Central Statistical Agency
CSC Common Support Condition
CUSUM Cumulative Sum
DCC Dynamic Conditional Correlation
DST Direct Specialty Trade
ECEA Ethiopian Coffee Exporters Association
ECM Error-Correction Model
ECT Error Correction Term
ECX Ethiopia Commodity Exchange
ENSO El Nino Southern Oscillation
eTRADE Electronic Trade
FDRE Federal Democratic Republic of Ethiopia
FOB Free on Board
ICO International Coffee Organization
IFPRI International Food Policy Research Institute
LM Lagrange Multiplier
IMF International Monetary Fund
KM Kernel Matching
MGARCH Multivariate Generalized Autoregressive Conditional Heteroscedasticity
MoFED Ministry of Finance and Economic Development
MS-HTE Matching Smoothing-Heterogeneous Treatment Effect
MWALD Modified Wald
NARDL Nonlinear Autoregressive Distributed Lag Model
NGO Non-Governmental Organization
NN Nearest Neighbor
NP Without Parchment
OLS Ordinary Least Squares

xvi
P Parchment
PSM Propensity Score Matching
SAP Structural Adjustment Programs
SBC Schwarz’s Bayesian Criterion
SM-HTE Stratification Multilevel-Heterogeneous Treatment Effect
UG Under Grade
UNESCO United Nations Educational, Scientific and Cultural Organization
USAID United States Agency for International Development
VAR Vector Autoregression
VECM Vector Error-Correction Model

xvii
Summary

xviii
Summary
Market policy reforms in the ever-changing global commodity market are needed to
accommodate the needs arising from the domestic economy but also for a sector to
sustainably integrate in a globalized commodity market. This doctoral thesis focuses on
policy reforms in the Ethiopian coffee sector that aim to support marketing institutions in
the creation of national and local value chains that serve all stakeholders. This doctoral
thesis examines how the establishment of the Ethiopian Commodity Exchange (ECX)
impacted on the coffee sector. It focusses on the integration of prices of coffees from
different Ethiopian origins (a) with prices on the international market, (b) between the
different local markets and (c) between the different actors in the Ethiopian coffee chains.
It also studies how farmers could benefit from integration within traceable export chains
that are organised at a cooperative level. The specific objectives are to analyse the
cointegration of Ethiopian coffee prices with the international markets under quality
differentials, the extent of spatial price integration of major coffee-grower markets in
Ethiopia, the price relationship between the different actors in the Ethiopian coffee chain,
and the welfare impact of de-commoditisation on coffee producers marketing through
membership of traceable coffee cooperatives.
The thesis starts by giving an overview of the Ethiopian coffee market by
introducing the different market actors and their role and the main characteristics of the
different Ethiopian coffee types.
Chapter 3 focusses on the relationships between the prices of Ethiopia coffee types
and the international coffee prices. It compares these relationships for the prices before
and after the ECX was established. The study used the Pesaran et al. (2001)
autoregressive distributed lag model (ARDL) and the Shin et al. (2014) nonlinear
autoregressive distributed lag model (NARDL) to analyse the cointegration of the various
Ethiopian origin coffees and with the prices of the different Arabica natural and Robusta
coffees on the international market. Results show that during the pre-ECX period (January
1998 - November 2008) all types of Ethiopian origin coffees established a long run
cointegration with the prices of Arabica coffees on the international markets. Similarly, in
the post-ECX (December 2008-May2013) period prices of all types of Ethiopian coffee

xix
except Harar coffee cointegrated with the international prices of the Other Milds,
Colombian Milds and Brazilian naturals. These results suggest that Ethiopian coffees
adjusted most to the price changes of Colombian Milds and Other Milds coffees, except
for Harar coffee. The study also finds that prices of Ethiopian origin coffees that fetch
lower prices on the international markets adjusted more slowly to changes in prices of all
Arabica coffees in the pre-ECX period and coffees known for their better quality seemed
to adjust faster. This changed in the post-ECX period and the reaction time taken to
correct the disequilibrium error was shorter for coffees that fetch lower prices and longer
for prices of premium and higher priced Ethiopian coffees. The price of Harar coffee was
not cointegrating with the prices on the international market which was ascribed to the
particular market on which Harar coffee was sold.
The fourth chapter was set out to investigate if the levels of spatial coffee market
integration in Ethiopia changed between pre-ECX (1998-2008) and post-ECX (2008-
2013) periods. The study specifically examined the extent to which, despite there being a
prohibition arbitrage trade between producer markets of different origins, the
establishment of the ECX increased the integration of domestic coffee markets. The
cointegration results suggest that between 2008 and 2013 producer markets integrated
more within their own region rather than that a national harmonization was created. The
prices on the producer markets in southern and southwestern Ethiopia cointegrated more
amongst each other than they did with markets in other regions. In the post ECX period,
even though it was limited, an opportunity was created for lower priced coffee producing
markets to establish themselves in the market. However, the market was dominated by
the high-quality coffee producing markets.
The objective of the fifth chapter was to empirically investigate the market
integration and price transmission asymmetry for the five major types of Ethiopian coffee
along the coffee value chain after the establishment of the ECX. The study considered the
formation of the ECX as a step towards the establishment of an institutionalized Ethiopian
coffee market. Results from an NARDL model showed that there is an asymmetric price
relationship for higher quality coffees (Harar, Sidama and Yirgacheffe) at different level of
the market. This may be due to the market power of a small number of large companies

xx
at the export level. However, frequent transmission towards producers is observed when
there is a price decrease.
The question whether producers who market coffee through certified (and hence
traceable) chains were better off was examined in chapter six. A Propensity score
matching model using primary data collected amongst members and non-members of
certified cooperatives showed that engagement in the certified and traceable coffee
channels enabled producers to fetch a better and more stable price for their wet-
processed coffee supply. Yet, this higher price was not sufficient to substantially increase
coffee income. Net cash returns from coffee and production costs on inputs and labour
were not significantly different. Despite the sustainable production activities adopted by
the members of the certified cooperatives, their coffee yields were relatively lower
amongst cooperative members compared to the farmers in the control group. Finally, the
study showed that the heterogeneity impact of being a member of a certified cooperative.
Generally, ECX is a great milestone for a developing country economy such as that
of Ethiopia which encountered numerous socio-economic problems. However, the ECX
faces challenges in achieving the institutionalization of the Ethiopian coffee market. There
are two points that this study considers most critical in the overall institutionalization
process of ECX. The first point is ECX’s failure to understand the coffee market, in which
ECX has been treating coffee as a commercial commodity. It is believed that the
commoditization of coffee emanated from the intense need of foreign currency, which
pose a challenge towards the sustainability of coffee sector. The second point is that, ECX
has been working to create a transparent and accountable marketing institution for the
stakeholders in the coffee market, but the lack of institutional trust at all levels, especially
at higher-level of Ethiopian coffee market need due consideration.

xxi
Table 0.1 Summary of the core findings
Pre ECX Post ECX
All Ethiopian coffees integrated with prices of
Arabica coffee
Prices of lower-priced Ethiopian coffees
adjusted slowly to Arabica coffee price
changes
Prices of better quality Ethiopian coffees
adjusted faster to Arabica coffee price
changes
Prices of all Ethiopian coffees except
Harar integrated with prices Arabica
coffee
Prices of lower-priced Ethiopian
coffees adjusted faster to Arabica
coffee price changes
Prices of better quality Ethiopian
coffees adjusted slowly to Arabica
coffee price changes
Mixed pattern of spatial integration
Markets of relatively lower quality coffees
integrated within their regional market
More regional integration than national
harmony
Harar coffee dominated the market
Relatively lower quality coffee able to
integrate with high price coffee
After ECX Producer - ECX
Symmetric/Asymmetric Short run
Price Adjustment Symmetric/Asymmetric Long run
Price Adjustment
Harar Asymmetric Increasing/decreasing
Symmetric -
Jimma Symmetric - Symmetric - Sidama Symmetric - Symmetric - Wollega Symmetric - Symmetric - Yirgacheffe Symmetric - Symmetric - Producer – Export
Symmetric/Asymmetric Short run
Price Adjustment Symmetric/Asymmetric Long run
Price Adjustment
Harar symmetric - Asymmetric Decreasing Jimma Asymmetric Decreasing Symmetric -
Sidama Asymmetric Decreasing Asymmetric Increasing Wollega Symmetric - Symmetric -
Yirgacheffe Symmetric - Asymmetric Increasing/Decreasing
ECX – Export

xxii
Symmetric/Asymmetric Short run
Price Adjustment Symmetric/Asymmetric Long run
Price Adjustment
Harar Asymmetric Decreasing Symmetric - Jimma Symmetric - Symmetric -
Sidama Symmetric - Symmetric - Wollega Symmetric - Symmetric -
Yirgacheffe
Symmetric - Symmetric -
De-commoditisation impact through certified cooperatives
Better and stable price for wet processed coffee
Did not change coffee income
Lower coffee yield
Higher level of wet processed coffee supply
Highly engaged in sustainable coffee farming
Heterogeneity between member of certified coffee cooperatives

xxiii
Samenvatting
Hervormingen in het marktbeleid zijn noodzakelijk in de steeds veranderende globale
markten van basisproducten, dit om enerzijds aan de noden van de lokale economie te
voldoen maar ook om een sector duurzaam in deze globale markt te integreren. Dit
doctoraat focust op beleidshervormingen in de koffie sector in Ethiopië die als doel hebben
om markt instituties te ondersteunen zodat waardeketens worden gevormd waarin alle
actoren worden ondersteund. De thesis bestudeert hoe het oprichten van de Ethiopian
Commodity Exchange (ECX) een impact heeft gehad op de koffie sector. In de
verschillende hoofdstukken wordt bestudeerd hoe de prijsintegratie van de Ethiopische
koffie ten opzichte van de internationale markten alsook binnen Ethiopië en tussen
actoren in de keten werd beïnvloed door het oprichten van de ECX. Daarnaast wordt ook
bekeken hoe producenten baat kunnen hebben bij het integreren in andere ketens dan
de ECX, zoals de gecertificeerde coöperatieven waar de koffie wel traceerbaar blijft. De
specifieke objectieven van deze studie zijn het bestuderen van: de cointegratie van de
prijzen van Ethiopische koffie uit verschillende oorsprongsgebieden in het land met prijzen
voor koffie op de internationale markten; de spatiale prijsintegratie tussen de verschillende
oorsprongsgebieden van Ethiopische koffie; de transmissie van prijzen doorheen de
ketens in de verschillende oorsprongsgebieden en de welvaartsimpact voor de
producenten van de verkoop van koffie via alternatieve kanalen dan de ECX met name
via coöperatieven die gecertifieerd zijn waardoor de verkochte koffie traceerbaar wordt.
De thesis start met het geven van een overzicht van de Ethiopische koffiemarkt
door de verschillende actoren in de markt en hun rol te beschrijven alsook door de
belangrijkste karakteristieken te belichten van de koffie uit de voornaamste
oorsprongsgebieden.
Het eerste empirische hoofdstuk focust op de relatie tussen de prijzen van de
koffies uit de verschillende Ethiopische oorsprongsgebieden en de internationale
koffieprijzen. Het beschrijft deze relatie voor de prijzen voor periodes voor en na de
invoering van de ECX. Het maakt gebruik van een autoregressive distributed lag model
(ARDL) van Pesaran et al. (2001) evenals het nonlinear autoregressive distributed lag
model (NARDL) van Shin et al. (2014) om de cointegratie te testen tussen de prijzen van

xxiv
de koffies van verschillende oorsprongsgebieden in Ethiopië met deze van verschillende
Arabica en Robusta koffies op de internationale markt. De resultaten geven aan dat in de
periode voor de invoering van de ECX, de prijzen van koffies van alle Ethiopische
oorsprongsgebieden integreerden met de prijzen van Arabica koffies in de internationale
markten op lange termijn. Een gelijkaardig niveau van prijsintegratie werd gevonden voor
de prijzen Other Milds, Colombian Milds en Brazilian naturals op de internationale markten
en de prijzen van Ethiopische koffie behalve deze van Harar na de invoering van de ECX.
De resultaten geven ook aan dat de prijzen van de Ethiopische koffies (behalve Harar
koffie) zich vooral aanpassen aan prijsveranderingen van Colombian Milds en Other Milds
koffies. De studie toont dat de prijzen van de Ethiopische koffies van oorsprongsgebieden
die aan lagere prijzen worden verkocht, zich trager aanpassen aan de prijsveranderingen
van alle Arabica koffies in de periode voor de invoering van de ECX, en de koffies die
gekend zijn om hun betere kwaliteit zich sneller aanpassen. Voor de prijzen genoteerd na
de start van de ECX was dit anders, en de reactietijd na een prijsonevenwicht was korter
voor de lager geprijsde Ethiopische koffie en langer voor de premium Ethiopische koffies.
De prijs van Harar koffie cointegreerde niet met de koffieprijzen op de internationale
markten wat terug te brengen is tot de andere markt waarop Harar koffie wordt verkocht.
Het vierde hoofdstuk bestudeert of de spatiale integratie tussen de verschillende
koffiemarkten in Ethiopië is veranderd tussen de periode voor de invoering van de ECX
(1998-2008) en de periode er na (2008-2013). Het hoofdstuk analyseert of de invoering
van de ECX en het verbod om koffie te verhandelen tussen de oorsprongsgebieden, een
mogelijk effect hadden op de prijsintegratie tussen de verschillende Ethiopische koffies.
De resultaten geven aan dat de markten in de verschillende oorsprongsgebieden meer
op regionaal niveau cointegreerden dan op nationaal niveau. De prijzen van de koffie op
de markten in Zuid en Zuidwest Ethiopië cointegreerden meer onderling dan dat ze deden
met markten in andere oorsprongsgebieden. In de periode na de invoering van de ECX,
werd tot op een zeker niveau een mogelijkheid gecreëerd dat de koffie uit
oorsprongsgebieden waarvoor de prijzen laag zijn, zich kon plaatsen in de markt. De
markt blijft evenwel gedomineerd door de prijzen van koffies uit gebieden die gekend zijn
voor een hogere kwaliteit.

xxv
De doelstelling van het vijfde hoofdstuk was om empirisch de marktintegratie en de
prijs asymmetrie tussen de actoren in de koffie ketens uit de vijf belangrijkste
oorsprongsgebieden in Ethiopië te bestuderen na het opstarten van de ECX. De studie
nam aan dat de opstart van de ECX een mogelijke stap was naar het institutionaliseren
van de Ethiopische koffiemarkt. Resultaten van het NARDL model tonen aan dat er een
asymmetrische prijsrelatie is voor koffies uit oorsprongsgebieden gekend voor hun hogere
kwaliteit (Harar, Sidama and Yirgacheffe) tussen de verschillende actoren in de keten. We
vermoeden dat het relatief kleine aantal weliswaar grotere exportbedrijven hierin een rol
speelt. Vooral een daling van prijzen wordt doorgegeven tot bij de producent.
De vraag of producenten die hun koffie verkopen via ketens die gecertifieerd zijn
(en dus traceerbaar) hiervan baat kon hebben, werd in hoofdstuk zes behandeld. Een
Propensity score matching model, gebaseerd op data die werd verzameld bij leden en
niet-leden van gecertifieerde coöperatieven, toont aan dat leden een betere en minder
variabele prijs konden krijgen voor de gewassen koffie. Toch was deze hogere prijs niet
voldoende voor deze boeren om een hoger inkomen te generen uit de verkoop van hun
koffie. De netto-cash winsten van koffie en de productiekosten van grondstoffen en arbeid
bleken niet te verschillen tussen de groepen boeren. Ondanks dat bepaalde
duurzaamheidsparameters beter waren voor de leden van de gecertifieerde
coöperatieven, was de gemiddelde koffie opbrengst per hectare lager bij leden van de
gecertifieerde coöperatieven ten opzichte van de niet leden. Tot slot toonden de resultaten
dat er een heterogene impact is tussen de leden van de gecertifieerde coöperatieven.
Over het algemeen, kan het opstarten van de ECX als een belangrijke mijlpaal
worden gezien voor een economie in een ontwikkelingsland die geplaagd wordt door
meerdere socio-economische problemen. Toch zijn er een aantal uitdagingen voor ECX
om een geinstitutionaliseerde koffiemarkt te laten ontstaan in Ethiopië. Er zijn twee punten
die doorheen de studie bijzonder moeilijk bleken. Ten eerste blijkt het voor de ECX
moeilijk om de koffiemarkten goed te verstaan. De ECX behandelt koffie als een
basisproduct. Het blijkt dat de commodificatie van koffie voornamelijk voorkomt door de
grote nood aan deviezen, wat dan evenwel een belangrijke uitdaging blijkt voor een
duurzame koffiesector. Ten tweede blijkt dat de ECX werkt aan het creëren van een

xxvi
transparte en toerekeningsvatbare koffiemarkt voor alle actoren, maar dat vooral het
institutioneel vertrouwen op alle niveaus nog ontbreekt, vooral voor de Ethiopische koffies
van betere kwaliteit.

Chapter 1
Introduction, objectives, and outline of the thesis

2
1.1 Background
Agricultural policies can be considered as measures used by governments to influence the social
and economic context within which agricultural production takes place (Ellis, 1992). Many
developing countries have implemented market reforms, either to satisfy the interests of
international donors or to implement measures motivated by the local government. Among these
policy reforms, market liberalisation has been critical in developing countries (Krueger et al.,
1988). However, the outcomes of measures proposed by the neoliberal policies of the donors in
the early 1980s and 1990s, summarised as the Washington Consensus with its Structural
Adjustment Programmes (SAPs), have been disappointing in most developing countries.
Enhancing the competitiveness of nations’ economies and improving the welfare of the
producers, were among the goals envisaged by the SAPs, which they have subsequently failed
to achieve (Onis and Senses, 2005). This is as a result of many developing counties’
governments attempts to design market policy reforms in their agricultural sectors that seek to
improve the stability of prices and marketing margins, and to improve the position of farmers in
the market chains (Karanja et al., 2003; Gemech and Struthers, 2007; Worako et al., 2010).
The Ethiopian coffee industry underwent numerous structural changes as a result of
transformations in the country’s political and economic landscape. Prior to 1991, coffee markets
were highly regulated and coffee producers were faced with implicit and explicit taxation
(Worako et al., 2008). Farmers in the primary coffee-growing areas of Ethiopia had to supply a
predetermined quota to the government (through the Ethiopian coffee marketing corporation) at
a fixed price (Gemech and Struthers, 2007). Following this, a series of policy changes were
introduced in 1992. These included a change in the macroeconomic policies of the country,
involving stabilisation, adjustment, and market liberalisation programmes. The policies were
largely aimed at levelling the playing field for all participants in the coffee market. It was hoped
that this would increase the coffee growers’ share in the export value as well as the total volume
of coffee exported. Ultimately, it was envisaged that this would result in an increase in the total
exchange earnings from coffee exports. However, the changes led to a concentration of power
within the export market and unhealthy competition in the primary and auction markets (Petit,
2007; Gemech and Struthers, 2007; Worako et al., 2008).
As in many other African countries, not all market liberalisation policies were successful in
Ethiopia. Empirical evidence from the Ethiopian grain market illustrated that the removal of policy
distortions was necessary but not sufficient to enhance market performance (Gabre-Madhin and

3
Goggin, 2005). The study suggested that a new development agenda, not only for Ethiopia, but
throughout Africa, should aim to move beyond market reform and focus on market development.
In addition to policy incentives, key interventions are required to develop appropriate market
institutions and build necessary infrastructure (Gabre-Madhin and Goggin, 2005). This is
essentially what inspired the Ethiopian Government to reform agricultural markets including the
coffee market.
Following a period of reorganisation of the powers and duties of the institutions involved in
the Ethiopian coffee sector, the Government decided to abolish the National Auction in 2008
and to harmonise coffee marketing within the Ethiopia Commodity Exchange (ECX) (FDRE
Proclamation n. 602/2008, also known as ‘the Coffee Quality Control and Marketing
Proclamation and its Directives 159/2009 and 161/2009). The ECX was initially established in
April 2008 for grains, but after eight months in December 2008, it started trading coffee as well.
The idea of trading coffee through a commodity exchange was originally conceptualised in 2003
(Celeste, 2010).
In principle, the ECX aims to improve farmers’ access to domestic and export coffee
markets. It intends to bring producer prices closer to international levels and reduce the effects
of market imperfections. It also seeks to improve the transmission of world and auction market
price signals to domestic growers within their respective markets (Worako et al., 2008).
Ethiopian coffee is produced in different regions throughout the country. These coffees differ in
terms of quality and taste, hence, fetching different prices at farm gate, auction, and on
international markets (Worako et al., 2008).
This doctoral thesis investigates how the ECX has impacted the market integration of
coffee producers, traders, and exporters at the international, national, and chain levels. It is
assumed that if markets are integrated, the effect of policy interventions and support in one
market would be transmitted to other markets. This would reduce the need for duplication of
interventions and, thus, reduce the fiscal burden (Baulch, 1997a). Without spatial market
integration, price signals will not be transmitted across spatially separated markets (Goodwin
and Piggott, 2001; Ghoshray and Ghosh, 2011). Therefore, high levels of spatial market
integration could be important for improving market performance. Markets that are not integrated
may convey inaccurate price information, leading to misguided policy decisions and a
misallocation of resources (Alam, 2012). In Ethiopia, where coffee grows in geographically
alienated areas, market-based policies for poverty alleviation of coffee producers and traders

4
could be more effective if markets were better integrated. It is assumed that better market
integration, monitoring and forecasting of price movements, as well as improving marketing
infrastructure to enhance market integration (Worako et al., 2008), could benefit coffee
producers. It is noteworthy to mention that farmers may also benefit in non-integrated markets
if protectionist policies were to be implemented properly or if niche markets were established
that fetched higher prices.
1.2 Problem statement and motivation of the study
Agriculture remains Ethiopia’s key sector, contributing 38.8% of gross domestic product in 2014,
with coffee constituting the bulk of Ethiopia’s exports (Tefera, 2015). Currently, it is largely
understood that agricultural development is vital for developing countries like Ethiopia (Hanmer
& Nashold, 2000), which obtain most of their export income from a few agricultural commodities.
In an attempt to improve farmers’ welfare, the Ethiopian Government made an agricultural
market policy reform in 2008 which included the establishment of the ECX to market the major
agricultural export commodities. The primary aim of the ECX within the coffee sector is to
strengthen the sector’s position as one of the main pillars of the economy, and to enable coffee
producers to increase their income (Celeste, 2010).
Since world coffee markets between countries exporting Arabica and Robusta coffee are
relatively competitive, distortions in one of the major coffee-exporting countries will subsequently
be observed in other coffee-exporting nations. While the establishment of ECX aimed to initially
address the internal Ethiopian coffee market, it may have impacted the position of Ethiopian
coffee on the international coffee market. Hence, it is important to investigate whether the price
relationship between the Ethiopian coffee prices and other coffee exporting countries changed
with the establishment of the ECX. It can be assumed that Ethiopian exports would not influence
international market prices, as volumes are relatively small compared to other exporting
countries. Nevertheless, it is of interest to determine whether trading under the ECX has brought
about a change in the rate of price transmission from international to national prices.
As previously mentioned, the national auction was abolished as part of the agricultural
market policy reforms and was replaced by the ECX, which has warehouses in the major coffee-
growing areas of Ethiopia. Prior to the market reform, most of the coffees were transported from
the coffee-growing areas of Ethiopia to the central market in Addis Ababa for sorting, inspection,

5
and grading. Currently, under the ECX, warehouses and information communication systems
are transmitting daily coffee prices in an attempt to enhance spatial market integration. Despite
trade being strictly prohibited within the Ethiopian coffee market, several studies (Goodwin and
Piggott, 2001; Barrett and Li, 2002; Lohano and Mari, 2006) have concluded that this spatial
trade and arbitrage could be a primary mechanism for ensuring spatial integration. This would
signal the possible gains in transferring excess demand and supply between potential markets.
However, the Ethiopian Government’s motivation for prohibiting the spatial trade of coffee
between different coffee-producing regions was to protect coffee quality and to prevent
adulteration between different coffee types.
Market reforms intend to enhance the bargaining power of the coffee producers to enable
them to receive a better price and to improve their welfare. The ECX started selling coffee as a
commodity, with different varieties being sold in bulk. Coffee marketed through ECX is not
traceable to the producer once it leaves the farm gate. Yet, traceability may add value by
enhancing product differentiation (Leung, 2014). The traceable coffee chains are managed
through cooperatives which could improve the bargaining power of the producers, incentivise
production, and reduce transaction costs. Interestingly, these cooperatives imply a level of
integration at horizontal level at the same time of vertical market integration (Lazzarini et al.
2001).
This description clearly indicates that the introduction of ECX as a trading platform has had
an impact on the different actors in the chain. Firstly, ECX changed the way that coffee is graded
for export and how it is sold from traders to exporters. Secondly, ECX implemented a regional
warehouse system which changed the way the coffee is traded between the farmers and the
traders in the market. Thirdly, the trade of coffee between the regions has been prohibited,
meaning that all coffee is sold from the regional warehouses to the central ECX markets.
Fourthly, ECX has established several information lines through which price information is
transferred between the different actors in the market. And, finally, alternative trade through
cooperatives has been allowed, yet its importance remains restricted.
Thus, this study aims to determine the impact of the ECX on price integration between the
different actors at the different levels of the chain. It aims to investigates how the ECX has
influenced price integration between the Ethiopian markets and international markets, between
different coffee-growing areas, and actors throughout the chains across the areas. Furthermore,

6
it aims to explore how farmers’ well-being is affected by marketing through alternative channels
to the ECX.
1.3 Research objectives and research questions
This study examines the price integration of Ethiopian coffee markets at farmer, ECX, and export
levels in the value chain, as well as how farmers could benefit from integration within traceable
export chains that are organised at a cooperative level. The specific objectives are to:
1. Analyse the cointegration of Ethiopian coffee prices with the international markets under
quality differentials, before and after the establishment of the ECX.
2. Examine the extent of spatial price integration of major coffee-grower markets in Ethiopia,
before and after the establishment of the ECX.
3. Study if the price transmission along the coffee value chain changed within the chains of the
different types of Ethiopian coffees.
4. Investigate the welfare impact of de-commoditisation on coffee producers marketing through
membership of traceable coffee cooperatives.
1.4 Research questions
In accordance with the research objectives for this study, the following research questions are
addressed:
Did the cointegration of the prices on the Ethiopian coffee market with international coffee
prices change after the establishment of the ECX?
What kind of price behaviour and relationships exist between coffees of different Ethiopian
origin in the international coffee market?
Does restriction of direct trade between coffee-growing regions affect the level of price
integration?
Has the establishment of the ECX created a harmonised cointegration of prices at regional
coffee producers’ markets?
Has the price transmission along the coffee value chain changed for the different types of
Ethiopian coffees?
How well do farmers fare if they sell their coffee through certified, traceable cooperatives
that are alternative market channels to ECX?

7
These research questions are answered in four empirical chapters that are at the core of this
thesis. These chapters are written as stand-alone papers. Some repetition in the introduction
and the structure of the papers may occur.
1.5 Analytical framework
This section presents the analytical framework which guides the different chapters in this thesis.
Figure 1.1 illustrates the different impacts that market policy reforms may have on the price
integration between the different levels of market actors. We broadly distinguish between
producers who sell to either traders in the regional coffee markets, or to certified cooperatives.
The traders send coffee to the ECX trading platform where the coffee is sold to exporters.
Chapter 2 provides a more detailed account of the Ethiopian coffee market chain, its different
actors, and their relationships (Figure 1.1 is a simplified representation). Within its different
chapters, this thesis aims to explore the effect of the introduction of the ECX and related policy
reforms in the coffee sector on the level of price integration and transmission between the
different actors and producers’ welfare. The ECX is an important milestone in the reforms of
Ethiopian commodity markets. Thus, in the analytical framework, the direct impacts are those
measures and changes made in the market as a result of the policy reform. The indirect impacts
are the changes that occurred in the market, indirectly due to the policy reform. Therefore, the
first three analytical chapters of this thesis will focus on how price relationships between actors
have changed with the establishment of the ECX. Further, the fourth and fifth empirical chapters
will analyse the effect of the alternative chains to the ECX, namely, sales through certified
cooperatives.
Market integration of agricultural products has remained a core issue in developing
countries due to its strong relevance in the build-up of the policy framework. Economists often
use the term, market integration, explained as the degree of price transmission between
vertically or spatially related markets, as a measure of market efficiency (Goletti, Ahmed, and
Farid, 1995). Moreover, a government may enhance market integration with policies and
strategies that provide infrastructure and information regulatory services that could avoid market
exploitation (Dercon, 1995; Baulch, 1997b).
In most cases, producers rely on market price information when making marketing
decisions. Poorly integrated markets convey inaccurate price information, subsequent to
inefficient arbitrage (Goodwin and Schroeder, 1991). Moreover, the extent of market integration

8
has important repercussions for the effectiveness of developing agricultural price stabilisation
policies (Fackler and Goodwin, 2001).
Systematic paternal movements and relationships between commodity prices arise as
effects of shared macroeconomic shocks, and is enhanced by a complementarity or
substitutable nature of the commodities (Cashin et al., 1999). Such harmonic price relations
could be viewed as outcomes of well-integrated markets, to the benefit of those involved.
However, when prices are not integrated, this could also indicate that a commodity is traded in
niche markets where better prices are paid. If these better prices are to the benefit of the
producers, this could generate positive welfare effects.
The ECX may not (yet) have substantially changed Ethiopia’s position in the international
coffee market as Ethiopia represents approximately 3.9% of the coffee volume traded in the
international coffee market (ICO, 2016). Nevertheless, the ECX framework may have influenced
how the prices of the different Ethiopian coffees integrate with the international market. The
transparency and quality oriented institutionalisation process of ECX has changed the way
exporters interact in the international market. The question whether the ECX has influenced the
extent to which the prices of Ethiopian coffees integrate with world market prices is addressed
in Chapter 3.
Within Ethiopia, the ECX attempts to have an impact on the levels price integration
between regional coffee markets, primarily by improving the transfer of information, trade
logistics, and infrastructure. Studies on spatial cointegration consider both spatial trade and
arbitrage as mechanisms for ensuring spatial integration, in case there is a continuous
information flow between central and regional markets (Goodwin and Piggott, 2001; Ghoshray
and Ghosh, 2011). The regional Ethiopian coffee markets are not allowed to trade directly, which
has a similar effect to when markets do not trade because of excessive transaction costs. Yet,
under the ECX, the different regional coffees are traded at a central market place, which conveys
price information to all regional trading centers. Thus, chapter 4 aims to assess whether the
establishment of the ECX changed the price relationships between the different regional
Ethiopian coffee markets.
Price relationships between market actors could improve significantly if new policies and
institutions address market failures. As such, prices would be better transmitted, and markets
would integrate across space and time, particularly between international and local markets
(Hernandez et al., 2015). However, when price adjustments are not efficiently conveyed to

9
producers, market intermediaries benefit from imperfections and from reduced market
transparency (Le Goulven, 2001). In addition, poor infrastructure and limited communication
services increases transfer costs (Rapsomanikis et al., 2003) and affects the transmission of
prices. The ECX was introduced in the coffee market to institutionalise the coffee value chain
with the ultimate goal of overcoming these marketing challenges, and to increase the efficiency
of the market operations. Therefore, chapter 5 investigates the extent to which the price
transmission of the different types of Ethiopian coffee has improved along the coffee value chain.
As coffee is mainly produced by small-scale producers, the ECX also aims to improve
producer productivity. However, when trading through the commoditisation process of the ECX,
much of the traceability of the coffee is lost. Such loss of traceability could have a direct impact
on the welfare of the producers. The alternative traceable chain of coffee, namely sales through
certified cooperatives, as a form of decommodification is studied in chapter 6. Coffee production
could be certified on the production process (organic production) or on the farming system (fair
trade).

10
CH6
CH4
CH5
CH5
Origin differentiation
Organic, fair trade,
and other certified
coffees
Policy impact
Direct – establishment
of the trade platform
Indirect – changes in the
trade platform
Central ECX market
Coffee producers
Input and efforts
Cooperative
membership
Price received
Welfare
Direct - Trade restrictions
between regional markets,
warehouses and information
information Traceable and
certified
cooperatives
Exporters
Direct – Sales option through
regional warehouses and
information
International coffee markets
CH3
Information flows and
price transmission
Coffee flow
Regional coffee markets
De-commoditisation
Direct – Possible
bypassing of the ECX
Market
Policy
Reform
Figure 1.1. Analytical framework

11
1.6 Data
1.6.1 Price data
Data for this study were collected from different stakeholders and cover the prices for different
types of Ethiopian coffee. The producer level price series were collected from the Ethiopian
central statistical agency (CSA). Traders’ prices at the ECX were collected from the ECX head
office in Addis Ababa. The export price for all types of Ethiopian coffee was taken from the
Ethiopian revenue office. The price data spans from January 1998 to May 2013 for producers;
December 2008 to March 2015 for traders at ECX, and January 1999 to March 2015 for
Exporters.
The major coffee-producing areas considered for this study included Kaffa, Wollega,
Sidama, Yirgacheffe, Jimma, and Harar. A unique characteristic of the coffees produced in
Ethiopia is the vast difference in quality between the different production areas. Despite these
quality differences, all the coffees produced in the country are rather homogenous (Worako et
al., 2008). As shown in Figure 1.2, many of the coffee-producing areas are located in the
southern, south-western and eastern highlands of Ethiopia. In the southern part of Ethiopia,
Sidama and Yirgacheffe coffee are the main branded types of coffee. Jimma, Kaffa, and Wollega
are located close to each other in the south-western part of Ethiopia. Wollega coffee is said to
be superior to Jimma and Kaffa coffee. Harar coffee, produced in the south-east of the country,
is reputed to be one of the premium coffees on the world coffee market (Minten et al., 2014).
The following chapter will provide a brief description of the characteristics of these different
coffee markets.

12
Figure 1.2 Commercial coffee producing areas in Ethiopia
Source: Café imports, 2015
1.6.2 Study area for household level analysis
The analysis of the impact of de-commoditised/ certified coffee presented in chapter 5 uses
household data collected in the Jimma and Kaffa zones in south-western Ethiopia. These two
zones were selected since they are known coffee production areas with significant potential and
a long-standing experience of coffee production. Moreover, these two areas are among the few
coffee growing areas that market fully traceable coffee.
The Jimma zone is comprised of 13 woredas1, with a population of over 2.8 million (CSA,
2014). The elevation ranges from 880m to 3360m above sea level and the zonal agro-ecological
setting is stratified as highlands (15%), mid-lands (67%) and lowlands (18%). The zonal rainfall
level ranges from 1200mm to 2800mm per annum. In typical years, the rainy season extends
1 A woreda is a third-level administrative division of Ethiopia.

13
from February to October. In addition, various other major crops are produced in the Jimma
zone, namely maize, teff, sorghum, barley, pulses, root crops, and fruit (Dechassa, 2000).
The Kaffa zone is 10602km2 in size and lies at approximately 500m to 3500m above sea
level. Most of the land is classified as mid-land (59%), in addition to lowland (29%) and highland
(11%). The mean annual temperature of the zone ranges from 10.1 to 27.5°C with a mean
rainfall of 1001mm to 2200mm per annum. Of the total land, approximately 23.1% is cultivated,
31.5% is forestland, 6% is grazing land, 25% is cultivable land, and the remaining 14.4% of the
land is considered to be uncultivable (Chernet, 2008).
Figure 1.3 Market study area map
Source: Ethiopian Mapping Agency, 2015
1.6.3 Sampling
From the two zones, five certified cooperatives from Kaffa and twenty-two from the Jimma zone,
trading under a traceable market, were identified. Using the list of cooperatives from each zone,
Kaffa Zone
Jimma Zone

14
these cooperatives were categorised according to their certification system; certified to sell
organic, fair trade, organic and fair trade, and forest coffee. Once the certified traceable
cooperatives in the two zones had been classified into the different types, they were further
classified into small, medium, and large according to the size of their membership. From the
identified set of certified cooperatives, a proportional number of cooperatives were randomly
selected from each zone (three cooperatives from Kaffa and six from Jimma). Finally, totally,
292 household heads were selected according to the sample size determination table at alpha
0.05 (Bartlett et al., 2001). When selecting members, consideration was given to their affiliation
with cooperatives that had consistent sales of a reasonable quantity (30-40%) of their coffee
production through the certified and traceable routes over the past two years.
Thus, the current study’s sample consists of coffee producers and their families. After
minimising possible sampling bias, the study estimated the propensity scores used to match the
292 household members of the certified and traceable cooperatives with 332 households among
the comparison groups. Furthermore, we estimated each household’s propensity score for
joining a certified and traceable cooperative (explained as the probability that a household would
participate in a certified and traceable cooperative, given a set of observable characteristics).
Household data were collected during the period of October 2012 to February 2013 from the
coffee producers in these two zones.
1.7 Methodological approaches
The study made use of different methodologies to answer the aforementioned research
questions. The Pesaran et al. (2001) autoregressive distributed lag model (ARDL) and the Shin
et al. (2014) nonlinear autoregressive distributed lag model (NARDL) were used to explore the
cointegration of Ethiopian export coffee with international coffee prices. Monthly export data from
the Ethiopian revenue office, and international coffee prices from the International Coffee
Organisation (ICO) for the period 1999-2014 were used for the analysis.
The ARDL model, Toda–Yamamoto granger causality approach, and persistence profile
techniques were used to examine the spatial price integration of major coffee growers’ markets
in Ethiopia between which no direct trade is allowed. Producer market prices from the Ethiopian
Central Statistical Agency (CSA) for the major six coffee-growing regions were considered in
these models.
15
To analyse the dynamic relationship between the international and the domestic markets,
a nonlinear ARDL cointegration methodology developed by Shin, Yu and Greenwood-Nimmo
(2011) was used. This approach allows prices to be more flexible and to establish asymmetric
relationships, both in the long and short-run. Price series from December 2008 to May 2013 at
producer, December 2008 to March 2015 at ECX, and export levels, collected from the Ethiopian
revenue office, CSA, and ECX, were used for the analysis.
The household section of this study adopted an impact analysis approach to investigate
the welfare impact of certification and traceability for coffee producers marketing through
certified and traceable coffee cooperatives. The study used a propensity score matching
procedure to compare traceable cooperative members to non-member coffee farmers.

16
Table 1.1 Summary of the methodology
1.8 Thesis outline
This doctoral thesis is a compilation of individual papers. The thesis is divided into seven
chapters, including this introductory chapter, the theoretical briefing of Ethiopian coffee market,
four core empirical chapters, and a concluding chapter. Following this chapter, chapter 2 briefly
introduces how the Ethiopian coffee market is organised and functions. Chapter 3 presents a
comparative analysis of the market integration of the Ethiopian export coffee markets with the
international coffee markets in the pre- and post-ECX period. The chapter further examines the
Objective Chapter Methodology Methodological advantage
Extent of integration of
Ethiopian coffees in the
international coffee market
Estimate the spatial integration
of coffee producer markets in
Ethiopia
3 and 4 ARDL Does not require the order of integration
except order 2 prior to testing for cointegration
Provide more consistent results with a small
sample size
Different variables can have different optimal
lags
Short and the long-run relationships can be
estimated simultaneously
Determine causality in prices
among cointegrated markets
and explore the direction of
causality
4 Toda–
Yamamoto
granger
causality
Avoids problems related to the non-stationary
of the price series while testing for price
causality
Employs a Modified Wald procedure to test for
restrictions on the parameters of the VAR
model
Estimated reaction time for
each of the long-run equilibrium
relations to absorb system
wide-shocks
4 Persistence
profile
Model the time profile of the response of the
cointegrating relation to system-wide shocks
To analyse the dynamic
relationship between the
international and the domestic
markets,
3 and 5 NARDL Extension of the ARDL model
Detect both short and long-run asymmetries
between the time series, using positive and
negative partial sum decomposition.
Estimate impact of
de-commoditization on coffee
producers’ welfare
6 PSM Match treated and untreated observations on
the estimated probability of being treated
Overcomes observed differences between
treatment and comparison
It balances treatment and control groups on a
large number of covariates without losing a
large number of observations
Evaluate the heterogeneity
effect of the de-
commoditization
6 SM-HTE and
MS-HTE
Estimate a pattern of treatment heterogeneity
effect
Address self-selection bias in impact studies

17
price dynamics of Ethiopian coffee markets in relation to the international coffee market, taking
origin (and hence quality) differences as a point of reference.
Chapter 4 discusses the spatial price cointegration of coffee markets in Ethiopia in the pre-
and post-ECX period. Here, market conditions are taken into consideration in which government
policy restricts arbitrage of coffee trade between coffee-producing areas. Furthermore, the role
of coffee quality in establishing market integration is discussed in chapter 4. Chapter 5
investigates market integration and price transmission along the Ethiopian coffee value chain
after the establishment of the ECX during the period 2008 to 2013. The chapter serves to
analyse whether producer-ECX, producer-exporter, and ECX-exporter price dynamics establish
asymmetric relationships, both in the long and short-run.
In addition, the commoditisation process within the ECX has made coffee traceability in the
Ethiopian coffee market much more difficult. With the help of donor institutions and cooperative
unions, some coffee producers are able to trade through certified cooperatives. Therefore,
chapter 6 discusses the impact of certification and traceability in the aftermath of the
establishment of the ECX.
Finally, chapter 7 provides an overview of the answers to the different research questions
raised, and links the findings to policy implications. This concluding chapter will also suggest
recommendations for further studies on the subject.

18
Chapter 2
Understanding the Ethiopian coffee market

19
Firstly, this chapter discusses the structure of the Ethiopian coffee market before the introduction
of ECX which is pertinent to understanding the following chapters. It introduces the major policy
changes that occurred over the course of 30 years. Secondly, this chapter explores the
establishment of the ECX in the Ethiopian agricultural market, more specifically in the coffee
market. It briefly introduces the rationality for the introduction of the ECX, and the policy changes
made to institutionalise the coffee market. Thirdly, this chapter provides an overview of the
different varieties of Ethiopian coffee and the process as to how the three Ethiopian coffees
secured an international brand name. Finally, this chapter provides an overview of coffee
processing and quality inspection services as established by the ECX.
2.1 Coffee market in the pre ECX era
During the military regime that occupied Ethiopia between 1974 and 1991, many private coffee
washing stations and large-scale coffee farms were taken over and controlled by the state.
Washing stations that were not included in state farms, were owned by the rural service
cooperatives, which mainly served the goals set by the government. The cooperatives as well
as the state farms had to sell their washed coffee directly through government coffee marketing
structures. As a result of these measures, most private coffee exporters became bankrupt, with
fewer than 10 who made it through the period (Dempsey, 2006). Moreover, in the same period,
producers in the major coffee growing areas of Ethiopia were obliged to sell a predetermined
amount of coffee to the government at a fixed price (Gemech and Struthers, 2007).
The new government that overthrew the military regime in 1991 implemented several policy
reforms. The corrective measures began with a devaluation of the local currency (Birr) by 142%.
By July 1995, the official exchange rate that was used for imports, and the exchange rate that
was determined at fortnightly auctions of foreign exchange, conducted by the National Bank of
Ethiopia, were aligned. The overall intention of the devaluation and the auction-based exchange
rate determination was to enhance the value of coffee exports in local currency and as such to
increase producer prices. Thus, a relatively consistent and internally driven programme of
commodity market liberalisation was pursued in the 1990s with the consent of the World Bank
and the International Monetary Fund (Gemech and Struthers, 2007).
Petit (2007) described the policy reforms that were put in place progressively through the
years which consisted of both restraining and encouraging practices. The elimination of the

20
former state monopoly on trade and marketing, price controls, the quota system for traders, and
the export coffee tax favoured these private firms. State control remained firm through the
mandatory national auction; the licensing requirements for collectors, suppliers, and exporters;
the policy of selling only non-export standard coffee for domestic consumption; and the strict
exclusion of multinational corporations to trade as an exporter. In line with this, Hamza and
Azenaw (1995) explained that the results of the reforms had a serious impact on the farmers’
share in the Free on Board(FOB) price of coffee exports which increased from an average of
42% during the military period to approximately 75% for the period 1992 to 1994.
The Ethiopian domestic coffee marketing system was based on a centrally administered
auction system that was stationed in Addis Ababa and Dire Dawa2 (Figure 2.1) (Petit, 2007). All
Ethiopian coffee had to pass through one of the two auction centres. The regulation further
requested the physical presence of all coffees at one of the centres. Moreover, depending on
the grade it obtained from the Coffee Liquoring Unit (CLU), the coffee was either exported or
sold domestically. It was only in 2001 that cooperatives were granted permission to bypass the
local traders and coffee auction centres and sell directly to international buyers (Dempsey,
2006). The coffee marketing under cooperatives channel was simple and straightforward. The
primary cooperatives purchased either red cherries or dry cherries from their respective
members. After processing the cherries (washing or hulling), the primary cooperatives
transferred the ownership of the coffee to their cooperative unions (Oromia, Sidama, Yirgacheffe
and Kaffa) who had the privilege of directly exporting the coffee to the international buyers
(Minten et al., 2014).
2 The two grading and inspection centres are located in Addis Ababa and Dire Dawa. The Dire Dawa centre used to serve
coffee from the Harar and Dire Dawa areas.

21
Figure 2.1 Market chain before the ECX
Unlike the cooperative system, coffee traded in the “conventional” channel strictly traded
past the auction system. According to Adinew (2011), the local coffee collectors were given the
Suppliers
Input Supplier
Domestic Consumers Retailers
Coffee Farmers (95%
of local production)
Plantation
(5%)
Red Cherry Dry Cherry Red and dry
Cherry
Suppliers Primary
Cooperatives
Primary
Cooperatives
Legal
collector
Illegal
Collectors
Washing Hulling Washing and
Hulling
Auction center
Cooperative
Unions
Rejected
Coffee wholesalers
Roasters
Liquoring
unit/quality
Export
Private exporters
Export
22
legal mandate to collect coffee from coffee producers and then sell it to suppliers. However, in
some cases it was common practice for suppliers themselves to buy from coffee producers.
After washing or hulling, the suppliers transported their coffee beans to the Addis Ababa or Dire
Dawa auction centres. Once the coffee had arrived at one of the two auction centres, it was
treated in accordance with the origins of the production. The Liquoring Unit performed the
grading based on the sample taken from each coffee and displayed the grade to bidders an hour
before the auction. The bidding process was performed lot by lot for every sample coffee
displayed at the auction centre. The bidding for the export standard coffee was made between
suppliers and private exporters.
Furthermore, the coffee that was consumed domestically was settled between the
suppliers and the domestic traders. Coffee from both state and commercial plantations were
also traded through the conventional channel.
2.2 Coffee market in the post ECX era
The ECX is a commodity exchange that was established with the motivation to revolutionise the
traditional Ethiopian agricultural market through a dynamic, efficient, and orderly marketing
system. The ECX as a commodity exchange platform is unique as it is the first of its kind in
Africa. It has an end-to-end integrated system of central trading, warehousing, product grade
certification, clearing, settlement, delivery, and market information dissemination (MoFED,
2009). The exchange in the ECX is structured in a way to distribute market information and link
the peripheral regional markets. In an effort to create an integrated market across the country,
ECX has established a number of warehouses in production surplus areas (ECX, 2010a). In line
with the warehouses, the primary transaction centres that have been established at the regional
ECX markets were built to serve as trading platforms for smallholder producers, cooperatives,
and suppliers to transact red cherries and sun dried coffee (Adinew, 2011). Within the new
market structure of the ECX, the coffee should no longer be physically present in the Addis
Abeba or Dire Dawa auction centres. The ECX also aimed to improve the information and
communication infrastructure for commodities traded at the exchange. Currently, traders are
able to retrieve various types of market information via sms, interactive voice response, internet,
radio, television, and newspaper. The electronic tickers installed in the major production areas
are another information source for daily commodity price (ECX, 2010a). However, according to
a study conducted by Tilahun (2011) on the effectiveness of marketing communication channels

23
used by the ECX, television, mobile phone, and the radio medium are still the most frequently
utilised. Finally, a legal framework for clearing and settling contracts which would guarantee
payment and delivery, is built within the ECX (ECX, 2010a).
With the establishment of ECX, the market is currently dominated by private traders,
amongst whom the exporters take commanding position amongst the traders. In addition, the
close contact with international buyers is believed to favour the exporters. Since the central ECX
market is located in Addis Ababa, the exporters stationed themselves in Addis Ababa and
installed coffee processing plants that transform the coffee beans brought from regional ECX
warehouses into export quality green beans (Celeste, 2010). Furthermore, within the regional
markets, many “assemblers/ traders” who were collecting coffee from remote producing areas,
have quit the business since the ECX became operational.
Similar to the old auction system, the ECX platform trades coffee at a central market in
Addis Ababa, yet the coffee trade is organised differently (Celeste, 2010). Producers are obliged
to only sell coffee at rural primary transaction centres. According to the ECX, there are
approximately 7300 of such rural primary transaction centres established across the country.
After processing (usually at their own processing plants), suppliers have their coffee graded by
the regional Coffee and Liquoring Units and stored in the regional ECX warehouses from which
they receive a receipt (see below for details on the quality grading systems).

24
Input Supplier
Coffee Farmers (90%
of local production)
Domestic Consumers Retailers
State Farm
(5%) Commercial
Growers (5%)
Red Cherry Dry Cherry Red/dry
Cherry
Suppliers Primary
Cooperatives
Primary
Cooperatives Suppliers
Illegal
Collectors
Washing Hulling Washing/Hulling
Regional liquoring
and quality units &
ECX warehouses
Cooperative
Unions
Rejected
Coffee
wholesalers
Roasters Commercial
Growers ECX Trading Floor
in Addis Ababa
Setting and
Clearance Private Exporters
+ EGTE (further
processing)
CLU (Addis
Ababa or Dire
Dawa)
CLU (Addis
Ababa or Dire
Dawa)
CLU (Addis
Ababa or Dire
Dawa)
Direct Export Export Direct export
Importer Importer Importer
Optional
Optional
Coffee flow
ECX trading
Traceable line
Figure 2.2 Market chain after the ECX

25
Cooperatives and commercial growers also reserve the right, that was granted by the
government, to bypass the ECX and export directly. It is important to note that as the ECX is
responsible to monitor all the coffee transactions, both cooperatives and commercial growers
are obliged to grade their coffee through the ECX, irrespective of where the coffee is traded.
Initially, the sales of coffee were concluded at the Addis Ababa ECX trading floor through
an ‘open outcry’ system. More recently, an electronic trading platform has been used. In the
‘open-cry’ bidding, buyers and sellers use their hands to negotiate prices and quantities. Once
the deal is settled, they wrap-up through a clash of palms (Niguise, 2011). In 2015, ECX
launched an electronic trading system which is more efficient and less costly. Currently, the
eTRADE trade volume reached 94% of the coffee transactions. The remaining 6% of trade
volume is being handled through the outcry system.
The bidding is made based on electronically transmitted information. This has two main
implications: 1) whereas with the old system, the exporting firms relied on the physical presence
of the coffee, they now make the bid based on the information (coffee type and its grade) that
they get from the regional ECX warehouses; and 2) the transportation costs from the regional
ECX warehouses to Addis Ababa (where the coffee will pass through a final processing3 to meet
the export standards) are now incurred by the exporters instead of the suppliers (Celeste, 2010).
Furthermore, all export coffees have a quality certification. This is something that has not
changed since the start of the ECX trade in coffee. Wholesalers serving the domestic market
and coffee roasters are still required to have a license to operate in the market. Moreover,
suppliers who supply coffee to the ECX market have to undergo several competence testes
before acquiring the certificate (Adinew, 2011).
Ethiopian coffee is exported and sold as several different types, including Harar,
Yirgacheffe, Sidama, Wollega, Jimma, and Kaffa. ECX is structured in a way that prevents
spatially separated markets from engaging in direct trade. Keeping the coffee types separate by
region is an important strategic choice to preserve the reputation of Ethiopian coffee in the
international market and to search for niche markets. The regional ECX coffee markets in the
different coffee production areas all have their own marketing infrastructure (including quality
3 Further processing is done to meet export standards, which is approved by the Coffee Liquoring Unit (CLU). Most of the
processing units are located in Addis Ababa
26
and grading units, warehouses, and notice boards announcing price information). These
regional coffee markets are connected with the Addis Ababa ECX market, which is the central
market for all the regional markets. This central market disseminates information on the prices
that the coffees fetch on the export markets. In this way, ECX pursues an end-to-end integrated
marketing system, which integrates central trading, warehousing, product grade certification,
clearance, delivery, and market information dissemination which could lead to price adjustments
even if there is no direct trade between the markets.
ECX was established with the aim of creating transparency and competitiveness at all
levels of the coffee market. Non-value adding actors (for example, assemblers/ local
wholesalers) were eliminated from the market with the expectation that it would reduce
transaction costs and enhance price transmission. With increasing the number of exporters to
175 in 2012 from 100 in 2008 (Minten et al., 2014), the coffee market was expected to improve
the level of competition on the exporter market. While the prices offered in the ECX markets
drive the price setting of the producers’ market, the ECX does not have the mandate to set
export prices. Since the ECX follows the international coffee price for price setting, it most likely
influences the price-setting strategy of the exporters. Therefore, the ECX adopted a strategy of
selling coffee as commodities in an attempt to reduce transaction costs. Only a few certified
cooperatives are permitted to sell coffee, through the unions, for direct export as a way to de-
commodify the exports. However, this alternative trade chain accounts for only 3.7% of the
Ethiopian coffee exports (ECX, 2008).
2.3 Ethiopian coffee variety, processing and grading
Ethiopia is the motherland of all Arabica coffee. The best Arabica coffee growing countries in
the coffee belt have a similar climatic condition to that of Ethiopia. Even before being
commercialised, coffee grew in the Ethiopian high mountain and forests. This endowed the
country with a rich set of varieties. The most interesting part of the species diversity is that most
of these varieties grow only in Ethiopia and yet, a great many of them have not even been
classified.
Some of the world’s finest coffees are produced in the coffee-producing regions of Ethiopia,
boasting unique flavours and aromas. The distinctive characteristics of these coffees
differentiate not only the coffee produced in Ethiopia from other coffee-producing counties but

27
also between the coffees produced within the country. The regional production areas differ in
the agro-climatic conditions as well as typical coffee processing techniques which influence the
quality of the coffee produced. Harar, Yirgacheffe, and Sidama are the most celebrated types of
coffee, each representing a distinct aroma and flavour. In the past decades, international coffee
distributors have been using these coffees to market single origin coffees (Mengistie, 2011).
The Ethiopian government, together with some international organisations, took the
initiative to protect the intellectual property rights within the Ethiopian production chain. In 2005,
the Ethiopian Fine Coffee Trademark Licensing Institute was launched with a mandate to build
a framework to secure legal ownership of specialty coffees in international markets (Arslan and
Reicher, 2010). Within this legal framework, Ethiopia succeeded in registering trademarks in
foreign markets for Harar, Yirgacheffe, and Sidama, and later licensing importers and others
involved in the distribution of these coffees for the use of these names. Twenty-nine countries
signed the Trademark and Licensing Initiative as of August, 2009 (Belete, 2009 as cited in Arslan
and Reicher, 2010). One of the ultimate goals was to de-commodify Ethiopian fine coffees and
de-link their price from the conventional international prices for Arabica coffee. However, the
path towards the registration of trademarks in some countries was not a smooth one.
Nevertheless, the Ethiopian government, in collaboration with Oxfam America, made a
concerted effort to secure the agreement (Arslan and Reicher, 2010). Noteworthy is the coffee
‘war’ between Ethiopia and Starbucks, in which the American coffee chain corporation has
influenced the American National Coffee Association’s (NCA) rejection of the applications for
trademarking the three Ethiopian coffees. However, Starbucks and the Ethiopian government
were able to resolve their differences and Starbucks signed the agreement (WIPO, 2009). The
following section provides a brief overview of the main Ethiopian coffee types of which the
markets are analysed in the subsequent chapters.
HARAR
The climate in Harar is dryer and warmer than the other coffee growing regions of Ethiopia. All
coffee produced and exported from Harar undergoes sundried processing. The region is
endowed with several local varieties that are specific to the area, that are adapted to the altitude,
climate, and soil type to produce unique flavour profiles. Harar coffee is generally grown at
altitudes ranging from 1700m to 2000m above sea level. Harar coffee is predominantly grown in
the open sun, with infrequent shading observed in a few areas only (Boot, 2011). Moreover,

28
intercropping is commonly practiced by the farmers. The shade trees observed in the area
include Erythrina burana (Korch), Cordia africana (Wanza), Albizia sp (Sesa), and Acacia albida
(Girar). Shade trees contribute towards coffee production by creating a favourable microclimate,
improving soil fertility, protecting the soil from erosion, and increasing infiltration rate (Amsalu,
and Ludi, 2010).
In addition, Harar coffees are appreciated for their fruity characteristic, more specifically
their distinct notes of blueberry and a creamy body. In fact, blenders frequently use Harar coffee
and Jimma coffee to make a classic Mocha Java. East Harar coffees tend to have the most
distinct blueberry flavours, for which the region is famous. In blind cupping tests, West Harar
coffees (Bale) outscore East Harar coffees. West Harar coffees generally have a thicker,
smoother body, and a milder fruit flavour (Boot, 2011).
Harar coffee is sold as a specialty and commercial type of coffee. The Harar trade brand
is internationally recognised. While Harar coffee is exported all over the world, there is a
particular demand for it in Saudi Arabia . Trade statistics show that 72% of Saudi Arabia’s coffee
imports are from Ethiopia (see atlas.media.mit.edu), of which Harar constitutes the largest share.
Thus, the high demand for Harar coffee may explain why it fetches higher prices in international
markets (Boot, 2011).
SIDAMA
The region of Sidama is one of the major coffee growing areas in southern Ethiopia. Sidama is
comprised of ever-green vegetation, fresh water lakes, and the Great Rift Valley that runs
through Ethiopia and Kenya. Most of the Sidama coffee features an extraordinarily wide variety
of coffee flavours. Generally, the coffee grows at an altitude of above 1500m. Furthermore,
coffee is grown under the evergreen shade trees of Milletia ferruginea, Albezzia spp., and
Erythrine spp (Tsegaye, 2001). Varying soil types, micro climates, and especially the countless
coffee varieties in this area make for a display of different flavours. Thus, there is ample diversity
amongst the Sidama coffees. With the notable varietal difference, coffees with completely
different coffee profiles are produced in the region. Therefore, it is difficult to literally define
Sidama coffee.
Coffee found in the Sidama region is excellently reflected by its deep complexity. Many
farmers and pickers, each with a very small patch of land, often with their own unique varieties,

29
will pool their coffees. High quality, unwashed Sidama coffees are admired for their intense fruity
characteristics, while being of somewhat lighter body than unwashed Harar coffees. Sidama
coffee also preserves a fruity characteristic when it is subjected to wet processing, which
generally produces a clearer and brighter coffee as compared to the unwashed processed
coffee.
Sidama coffee is one of the three internationally branded Ethiopian coffees. The main
export destinations are Germany (25.54%), Japan (23.1%), the United States (11.42%), Belgium
(7.7%), Italy (6.06%), the United Kingdom (5.07%), the Korean Republic (4.04%), Sweden
(2.78%), Spain (2.22%), France (1.85%), and Australia (1.11%). The remaining 9% of the coffee
is exported to other countries (unpublished raw data). Although it is traded through ECX, Sidama
coffees are given three tags: a grade, a geographical letter designation, and designation as
washed or unwashed. Finally, specialty grade coffee from Sidama is available as both washed
and unwashed types of coffee (Boot, 2011).
YIRGACHEFFE
Despite the smaller size of the region compared to the other coffee producing regions,
Yirgacheffe produces one of the premium quality coffees in Ethiopia, of which the price may at
times exceed that of Harar coffee. The region shares a similar cultural and geographical
environment to the neighbouring area of Sidama. Coffee is produced in the southern highlands
at an altitude of over 2000m above sea level. The coffee production system is predominantly a
garden crop, intercropped with Enset (Enset ventricosum) or under the evergreen shade trees
of Erythrina spp., Milletia ferruginea, and Albezzia spp. (Tefestewold, 1995).
The best Yirgacheffe coffee has several shared characteristics with Sidama coffees. It is
known for its fruit flavours, a bright acidity, and a silky mouthfeel. While Yirgacheffe produces
both washed and unwashed coffees, its quality reputation is particularly high for the washed
coffees. Top quality washed coffees from Yirgacheffe are well known for their bright citrus
acidity, often with a lemony character, with excellent sweetness. However, the area has started
to attract attention for its unwashed coffees as it has been able to produce some high quality
unwashed coffees as well (Boot, 2011).
This is the third internationally branded Ethiopian coffee and the most famous washed
Ethiopian coffee. It’s top export destination is the United States, comprising 33.39% of the total

30
exports. Other major export destinations include Australia (8.53%), Belgium (2.86), Germany
(4.65%), Italy (3.22%), the United Kingdom (2.6%), Taiwan (2.14%), China (1.98%) Japan
(6.09%), the Korean Republic (13.89%), Saudi Arabia (9.83%), New Zealand (1.66%), and the
Netherlands (1.63%). The remaining 7.5% is exported to other countries (unpublished raw data).
Similar to Sidama coffee, Yirgacheffe coffees are also given three tags when traded at the ECX:
a grade, a geographical letter designation, and designation as washed or unwashed. In addition,
specialty grade coffee is available in both washed and unwashed forms.
JIMMA
Jimma coffee is produced in the south-western region of Ethiopia. The area is endowed with
various indigenous vegetation which is quite rich in quality diversity. The washed Jimma coffees
are known for its heavy bodied cup with a winy aftertaste (Woldemariam, 2015). Jimma coffee
grows at an altitude of 1400-2100m above sea level (Adugan et al., 2011). The most important
shade tree species found in the area include Albizia spp., Acacia spp., Cordia africana, Milletia
spp., Erytherinia spp., Sesbania sesban, and Leucenia lecocephala (Amsalu, and Ludi, 2010).
In the international coffee market, the “Djimma Grade 5” coffee was sold at the lowest price
for decades amongst the Arabica coffee. While Jimma is a hub for coffee genetic diversity and
has some of Ethiopia’s best farming land, the coffee sector suffers from poor processing
practices (Tecnoserve, 2013). The major export destinations of Jimma coffee include Germany
(21.82%), France (16.16%), Sudan (14.18%), Belgium (12.99%), Italy (8.83%), the United
States (4.95%), Japan (3.87%), Australia (2.89%), Russia (2.66%), Sweden (2.22%), the United
Kingdom (2.10%), and other countries (7.8%) (unpublished raw data).
KAFFA
The Kaffa region is believed to be the birth place of coffee. In this region, more than 100
Ethiopian investors have been developing estates and farms growing high quality Arabica
coffee. It is blessed with suitable agro-ecological conditions for specialty coffee production.
Coffee is produced on altitudes that range between 1600m and 1900m above sea level, and
temperatures that are conducive to coffee production (Paulos, 1994). The area is known for high
levels of precipitation and this makes it the rainiest region amongst all the coffee growing regions
of Ethiopia (Boot, 2011). The region is also the destination for one of the two biosphere reserves

31
in Ethiopia. Since June 2010, the wild coffee forests in the region have been recognised by
UNESCO as a biosphere reserve (Dennis, 2007).
Currently, most farms, estates, and cooperatives are supplying both washed and natural
sundried coffees to the international market. A full-bodied Kaffa coffee has delicious chocolate
flavours and complex acidity. The major export destinations for Kaffa coffee are Germany
(44.9%), Italy (13.76%), the Korean Republic (10.83%), Sweden (10.83%), the United States
(8.91%), Australia (5.86%), Canada (3.38%) and other countries (1.5%).
WOLLEGA
Coffee from the Wollega area typically enters the market as “Lekempti", a trade name that
originates from western Ethiopian coffees traded through the city of Nekempte. In addition,
coffees from East Wollega may be sold as Lekempti. The coffee growing areas of Wollega are
found in parts of the highland area in the south-western region of Ethiopia, which receives more
rainfall than any other eastern coffee growing areas in Ethiopia. The coffee grows at an altitude
of 1700-2200m above sea level. Originally, Wollega is known for its naturally processed beans
in western Ethiopia. Furthermore, the coffee is known for its large bean size and the sweet odour
from the Wollega coffee is considered extraordinary. Thus, the Wollega coffee reaches high
quality scores due to the co-existence of the sweetness, fruit notes, and bright-toned citrus
(Boot, 2011).
Washed processing stations have been built with the financial support of donors (including
Technoservie) in the region which have led to an increased volume of washed coffee. Wollega
coffee is often used by blenders, but is also sold as an original flavour. The major destinations
that import Wollega coffee are Saudi Arabia (50%), Germany (26.31%), Japan (12.58%), France
(3.01%), the United States (2.22%), Greece (1.8%), the Korean Republic (1.05%), and other
countries (2.2%) (see figure 2.3).
2.4 Coffee Processing
Coffee processing involves transforming the coffee cherry into green coffee beans after
removing the fruit or pulp. The way in which this is done has a vital impact on the flavour of the
resulting coffee (Boot, 2011). A distinction is made between a natural or unwashed processing
method and wet (washed) processing methods. Ethiopia produces both washed and unwashed
coffee (Boot, 2011). While most of the coffee produced prior to the establishment of the ECX

32
was unwashed (estimated at approximately 10% of the total production volume), the wet
processing gained significance after the establishment of the ECX. Subsequently, its share in
volumes processed has gradually increased and currently accounts for 30% of the coffee
production (Minten et al., 2014).
For wet coffee processing, the berries should be collected when they are fully ripe, which
enables the coffee to retain a proper fragrance and smoothness (Kufa 2012). Once they turn
bright red, the berries are picked at intervals of two to three days. This implies that cherry picking
is a rather laborious task. Here after, the collected coffee should be taken to and processed at
the washing stations within the same day of picking. Failure to do so will affect the ultimate coffee
quality.
Furthermore, the coffee cherry passes through several stages before turning into a bean
during the wet processing method. Firstly, the harvested cherries pass through a pulping
machine where the skin and pulp are separated from the bean. The outer cover of the fruit is
washed away discarding the parchment coffee covered in sticky mucilage (Alemu, 2015).
Secondly, the beans are fermented in order to break down the sugars within the mucilage and
to free the beans from the parchment. The fermentation process usually takes a day, but the
local climate, altitude, and other factors could shorten or extend this time (Boot, 2011). Once the
fermentation process is finalised, the coffee is discharged into a rinsing tank. Prior to entering
the rinsing tank, the coffee passes through a long channel filled with water to wash off any
remaining mucilage. Finally, the coffee is taken out of the rinsing tank and dried on a drying bed.
It takes one to two days to dry the coffee before it reaches the recommended moisture level
(Woldemariam, 2015). The washing stations that are needed for wet processing imply a
substantial investment in terms of infrastructure and water consumption. Therefore, water needs
to be available in large quantities which raises questions on the sustainability of the wet
processing in terms of environmental contamination. Yet, the washed coffee is believed to
enhance clarity and aroma.
The ‘old’ processing method involves drying the coffee naturally. This method is still in use
today and involves drying the coffee cherries as a whole. Furthermore, this processing technique
is frequently used in regions where water is scarce. In Ethiopia, drying is usually done on raised
drying beds. The exact number of days needed to dry the coffee will depend on the climatic
conditions. During the drying process, the cherries shrink in size and when the moisture content
33
drops from 65% to approximately 12%, the dry cherries are moved to warehouses where they
are stored (Alemu, 2015). In doing so, caution is taken to guarantee the even dryness of the
cherries and to avoid the contact of the cherries with the ground. The dry processing method
has the advantage of not needing water, hence, this method is common in dryer areas, as well
as poorer or more remote areas (Woldemariam, 2015). In general, the longer hours of sun
exposure results in the sundried natural coffees having a sweet, fruity character with a creamy
mouthfeel (Boot, 2011). The coffee growing areas that are known for their dry processed coffee
include Harar, Wollega, Bale, and Jimma.
2.5 Quality and grading
Coffee quality is of critical importance to all the stakeholders in the coffee industry. Quality coffee
is frequently related to desirable characteristics such as clean, raw, and roasted appearance,
as well as an attractive aroma and good cup taste (Weldesenbet et al., 2008). However, quality
and grading have a different impact for the actors at different levels of the coffee chain. Firstly,
at the farmer level, coffee quality is linked to production levels and easiness of culture. Secondly,
at the exporter or importer level, coffee quality is related to bean size, level of the defects and
regularity of delivery, tonnage available, and physical characteristics. Thirdly, at the roaster level,
coffee quality is the combination of moisture content, stability of the characteristics, origin of
production, price, biochemical compounds, and organoleptic quality (Leroy et al., 2006). Lastly,
at the consumer level, price, taste and flavour, effects on health and alertness, geographical
origin, environmental and sociological aspects as communicated by certification systems and
labels such as organic coffee, rainforest alliance, and fair trade determine the coffee quality
(ISO, 2000). Coffee quality is measured in different ways including the visual inspection of the
coffee and cup quality. Surprisingly, each producing country has developed its own classification
and grade charts. Some of the commonly used criteria include origin, preparation method, bean
size, bean shape, colour, number of defects, and cup quality. Cup quality is a complex measure
of predicting coffee quality as it depends on several factors. These include genetic factors,
botanical variety, agronomical practices, location, processing systems, storage conditions,
industrial processing, preparation of the coffee, and consumer preference ( Tullu, 2008).
As previously mentioned, prior to 2008, quality inspection and auction sale of coffee was
conducted in the two central trading areas, namely Addis Ababa and Dire Dawa. These centres
were stationed quiet far away from the major coffee producing areas and had several issues

34
related to warehousing, sampling, and quality inspection (ECX,2008). During the pre-ECX
period, coffee grading was performed using both green coffee analysis and cup quality tests.
Furthermore, the Ethiopian Coffee Quality Inspection and Auction Centre was responsible for
controlling the quality of export coffee in either Addis Ababa or Dire Dawa, after which the
supplied coffee was certified to meet the minimum requirements of national standard for export
(ECX, 2008). Even though it was not fully operational, the government had set up coffee liquoring
units and quality control mechanisms at regional levels before the coffee was sent to the auction
centres. Finally, the coffee that met the quality requirements of the regional quality control bodies
was sealed and sent to the coffee quality liquoring and inspection centre (Mengistie, 2011).
Green coffee analysis consisted of the visual inspection of the physical characteristics
including size assessment, defect count, colour, and shape of the bean. The assessment
through cup quality testing involved the analysis of roasted coffee by which aroma, acidity, and
other flavour components were tested. From the overall grading of coffee, green analysis and
cup tests accounted for 40% and 60% of the quality inspection process, respectively (Abasanbi,
2010). Moreover, each coffee is scored out of a total of 100.
In the ECX market, coffee is classified according to its origin, class, the preparation type,
grade of coffee, and market type (Gabre-Madhin, 2012). In terms of origin, the broader area
classification of coffee is taken into consideration. Currently, the market has 22 coffee origins,
namely Anderacha, Bale, Bebeka, Bench-Maji, Bi-Product, East Wollega, Forest, Gelana-
Abaya, Gimbi, Godere, Harar, Jimma, Kaffa, Kelem Wollega, Kochere, Lekemite, Limmu, Tepi,
Sidama, Wenago, Yeki, and Yirgacheffe. Since each of the 22 coffee origins covers a wide range
of areas, these coffee origins are grouped by their specific woredas. Each origin coffee has five
classes represented by A, B, C, D, and E (ECX, 2015). Coffees are further classified by their
processing type as washed or unwashed coffee. Furthermore, coffees are classified by their
market type as specialty, export, or local coffee (Boot, 2011). Definitively, specialty coffee is
coffee that is distinctive because of its full cup taste and little to no defects, and that it may
command a market premium.
For the past seven years, ECX has adopted a 10-level grading and standardisation system.
However, since 2015, ECX implemented a new consolidated coffee grading system that reduces
the number of coffee grades from 10 to six, for washed and unwashed coffee based on their
scores. In other words, Grade 1 = 85-100, Grade 2 = 75-84, Grade 3 = 63-74, Grade 4 = 47-62,

35
Grade 5 = 31-46, UG (np4) = UG5 (p) = 15-30. Coffees that obtain a grading of 1, 2, in the
preliminary assessment undergo a specialty assessment based on cup quality to assess for the
potential of specialty coffee. Coffees that receive a Grade 1 (≥ 85.0) or Grade 2 (80.0 - 84.75)
score in the cup quality are thus considered as specialty coffees (ECX, 2015). Washed and
unwashed coffee of Grades 3 to 5, as well as UG, are labelled as export and local coffee,
respectively. In practical terms, it can be put forward that the coffee consumed at the domestic
market have higher levels of impurities.
All export standard coffees are further grouped into four categories: commercial washed,
commercial unwashed, specialty washed, and specialty unwashed. For example, a coffee might
be designated “Yirgacheffe A, Gr. 4” or “Sidama C, Gr. 3”. The first name in the designation
(Yirgacheffe or Sidama) indicates the name of the larger region in which the coffee is produced.
The letter (A, C) refers to the sub-region that the coffee originates from. For instance, “Sidama
C” covers the areas of Kembata & Timbaro, and Wollaita (Tamru and Minten, 2016). This is then
followed by the grade (Gr. 4 or Gr. 3).
4 p and np stand for coffee with and without parchment, respectively. 5 UG represents under grade (rejected quality coffee).
36
Chapter 3
Cointegration of Ethiopian export coffee with global markets under origin differentials before and after the establishment of the
Ethiopian Commodity Exchange
Abstract
This chapter aims to compare the integration of the Ethiopian export coffee markets with the
international coffee markets, both before and after the establishment of the Ethiopian
Commodity Exchange (ECX). The study examines price dynamics in the Ethiopian coffee
markets in relation to the international coffee market, taking origin and quality differences into
account. The empirical analysis applies a Pesaran et al. (2001) autoregressive distributed lag
(ARDL)cointegration framework using price data for export coffee from 1998-2008 and 2008-
2013, and applying a bounds test approach. For the pre-ECX era, the results indicate that
coffees from an origin known for higher and premium quality exhibit higher levels of integration
and price adjustment relative to Arabica-type coffees on the international markets. In contrast,
the findings from the post-ECX era showed that the highest speed of adjustment towards
equilibrium was observed for relatively lower quality Ethiopian coffees. In addition, premium
Ethiopian coffee does not seem to cointegrate with any of the Arabica coffees. In both time
periods, market distortions in the price of Colombian Milds coffees strongly and directly affected
the prices for most of the Ethiopian coffees. Furthermore, we found evidence indicating that
relatively lower quality-rated Ethiopian coffees made the greatest price adjustments after price
shocks for Brazilian Natural coffee.
Keywords: Coffee price, Coffee quality, Cointegration, Ethiopian Commodity Exchange,
Autoregressive Distributed Lag model
Based on: Demise, T., Natanelov, V., D'Haese, M. Cointegration of Ethiopian export coffee with global markets under origin differentials before and after the establishment of the Ethiopian Commodity Exchange.

37
3.1 Introduction
Agriculture remains key to Ethiopia’s economy, contributing approximately 38.8% of gross
domestic product (GDP) in 2014/15 (Kibret et al., 2015). Coffee constitutes the bulk of Ethiopia’s
exports and the sector comprised of 25-30% of the foreign exchange earnings in 2014 (Tefera,
2015). The coffee sub-sector also provides income for a large number of households. It is
estimated that of the 91 million people who live in Ethiopia, more than 15 million rely on coffee
for a considerable proportion of their income. In addition, the sector provides jobs to many
Ethiopian people to carry out coffee-related activities such as coffee processing, transportation,
and marketing (ECEA, 2013). Furthermore, Ethiopia produces and exports one of the best
highland coffees in the world (see Chapter 2) (Gebreselassie and Ludi, 2008).
A good policy environment is crucial for the coffee sector in Ethiopia (Hanmer and
Nashold, 2000). As in other countries, the Ethiopian government has frequently intervened in
the coffee sector (as well as in other agricultural sectors). Findings from other developing
countries show that the objectives of such market policies were to protect the agricultural sector,
which acts as the main source of rural income and of government revenues from foreign
exchange (Akiyama et al., 2003; Todaro and Smith, 2006). In the 1970s and 1990s, many
developing countries, including Ethiopia, embarked on a liberalisation path induced by the
Structural Adjustment Programme (SAP). This path included the restructuring of the agricultural
marketing policies (Benedetto et al., 2013). The reforms, which included removal of price
controls, trade liberalisation, and privatisation of the government-owned agricultural enterprises,
were partly aimed at enhancing trade efficiency (White and Leavy, 2001). The impact of these
reforms on the integration of the local markets with international markets and the alignment of
local market prices with international prices have been crucial for those countries that rely
heavily on foreign income generated through coffee exports. However, as widely documented
in the literature, the measures implemented by the SAP during the economic reforms were not
all equally conducive to this market integration (Dercon, 1995; Ismet et al., 1998).
Despite the fact that Ethiopia has been through a number of structural market changes,
the performance of the coffee sub-sector has remained unsatisfactory. Therefore, recent
attempts have been made to enhance the productivity and competitiveness of the Ethiopian
coffee sector. One such attempt, in 2008, involved replacing the national auction by the Ethiopia
Commodity Exchange (ECX) (See Chapter 2). This new institution was established as an

38
organised marketplace, where buyers and sellers could come together to trade6, be assured of
quality, quantity, payment, and delivery, with the aim of organising efficient and transparent
market operations (ECX, 2008). The initiators of the ECX model suggested that key interventions
were needed to develop appropriate market institutions and to build the necessary infrastructure
(Minten et al., 2014).
Prior to the establishment of the ECX, the coffee sector was constrained at all levels of
the value chain. For instance, a highly-centralised coffee market was located far away from the
major production areas. Coffee quality inspection centres were centralised and inefficient,
resulting in frequent and significant adulteration of the coffees. Suppliers manipulated trading
activities by relying on the inconsistent sampling techniques used at the quality inspection
centre. Furthermore, the relatively high transaction costs for trading, lack of an adequate
international standard quality supply, inconsistency in coffee quality, and a lack of understanding
of international market demands were among the major challenges that the coffee sector was
facing in the export arena (ECX, 2008). The ECX was intended to overcome many of these
challenges and to stimulate the production of quality coffee.
However, a particular concern is whether the ECX has been successful in achieving a
better cointegration of Ethiopian coffee prices with those on the world market. This relates to the
question as to whether different Ethiopian coffee prices evolve, come together, or react strongly
to changes in the international coffee prices and show similar effects when confronted with
external shocks. If a single market for coffee were to exist, this would imply that a price change
in a certain coffee quality range would result in similar changes in the prices of the other coffees.
When different coffees are traded in the same market, all prices should cointegrate in pairs,
since any two prices show uniformity when they share a common trend (Asche et al., 1999). In
addition, if all prices cointegrate in pairs, a single common stochastic trend exists (Stock and
Watson, 1996). Yet, prices may also deviate if coffee is traded in niche markets.
Since world coffee markets are quite competitive and relatively free from trade
restrictions, price or market distortions in any of the major coffee exporting countries are
observed in the other coffee exporting nations as well. For example, Brazilian coffee production
decreased in 2014 due to bad weather, which resulted in a price spike in the international coffee
market (ICO, 2014a). Furthermore, it is widely believed that there is intense competition between
6 Exchange under the ECX is currently only performing a spot contract, however, attempts are being made to launch trading in
the near future.

39
countries exporting Arabica and Robusta coffees, as well as between Arabica coffee-exporting
countries in the international market.
The Ethiopian Arabica coffees are labelled by their place of production or origin. Harar,
Yirgacheffe, Sidama, Jimma, and Wollega are the major denominations of origin. Apart from the
difference in place of production, these coffees exhibit quality variations. Of all the coffee origins,
Harar and Yirgacheffe coffees are perceived to be premium coffee types, while Jimma coffee is
considered to be a relatively lower quality of coffee. Quality and origin have become increasingly
important in the coffee market, which is shifting from a quantity-oriented agricultural market to a
consumer-driven market. Hence, origin and quality differences could drive the price relationships
and their adjustments to changes in local or international prices.
For this study, we were particularly interested in the dynamic price relationships between
Ethiopian export coffee prices and global coffee prices. The present study takes the
establishment of the ECX as a turning point and aims to investigate the cointegration of Ethiopian
coffee prices7 with prices in the other coffee-exporting countries for the periods 1999-2008 (pre-
ECX) and 2008-2015 (post-ECX). Therefore, prices on the international market for the following
coffee types are considered: Colombian Milds (Colombian), Other Milds (Costa Rica,
Guatemala, Honduras, Mexico), Brazilian Natural (Brazil), and Robustas (Indonesia, Uganda,
Vietnam). The price behaviour and relationships between the Ethiopian export coffee prices and
the international market prices were examined before and after the establishment of the ECX in
an attempt to explore its influence. Studying the effects of market policies, as measured by their
impact on cointegration, was also proposed by Kilima (2006), who argued that the success of
market reforms partly depends on how strongly domestic market prices are related to
international market prices.
The purpose of comparing the integration of the different types of Ethiopian coffee with
international coffee is not to measure the level of competitiveness of the Ethiopian coffees in the
international market, nor is it to compare their markets to those of other quality coffees. Rather,
it aims to examine the impact that the ECX has exerted on the extent of price integration of the
Ethiopian coffee prices with international coffee market prices. In addition, a comparison is made
with the prices of Robusta coffee. While Ethiopian coffees are Arabicas, we also explore their
price integration with Robusta coffees since both coffee types may be used in blends.
7 For this chapter, Kaffa coffee has been dropped as it does not feature among the internationally known types of Ethiopian
coffee.

40
The following section provides a literature review of cointegration which is followed by a
description of the methodological approach used in this study. Subsequently, the results and
discussions are presented after the methodological section. Finally, conclusions are drawn in
the last section of this chapter.
3.2 Background
Most commodity prices rise and fall in harmony. Systematic paternal movements and
relationships between commodity prices arise as effects of shared macroeconomic shocks, or
due to the complementarity or substitutable nature of the commodities (Cashin et al., 1999).
Several studies have used time series analysis to investigate price relationships between
various spot prices for coffee. A study conducted by Ghoshray (2009), explored the impact of
coffee quality on the dynamics of coffee prices. The present study examined the price
relationships for different qualities of coffee and how prices adjust over time in relation to each
other. It confirmed that the coffee market is highly integrated and that prices adjust to any
deviation, either increasing or decreasing. Furthermore, a rise in the price of a high-quality coffee
resulted in an increase, however slow, in the price of a relatively lower quality coffee, while a
decrease in price for higher quality coffees triggered a relatively rapid fall in the price of lower
quality coffees.
Similarly, Milas et al. (2004) examined the price relationships between the different types
of coffees on the international market (Unwashed Arabicas, Colombian Milds Arabicas, Other
Milds Arabicas, and Robusta coffee). Their study found two cointegrating relationships in the
short-run dynamics of the four coffee prices. Moreover, the estimates of the asymmetric and
polynomial error correction models provided evidence indicating that when the coffee prices are
relatively high, they returned to equilibrium slower than when prices were relatively low. The
study also showed that price adjustments are quicker when deviations from the equilibrium level
increase.
A further study by Fry et al. (2011), explored the causality and effects of external shocks
(adverse harvests and changes in future contract specifications) on the interaction between spot
and future markets. The results of the study found a bi-directional causal relationship between
spot and future markets. However, the way in which spot and future markets interacted was not
static and changed over time in response to exogenous shocks. The study also presented

41
evidence of higher price volatility on spot markets. This volatility may be due to climatic effects
which influences the supply on the world market. This was further investigated by Ubilava (2012)
who studied the impact of the El Nino Southern Oscillation (ENSO) on world coffee price
dynamics for the four major coffee types. Results suggested that ENSO did have an impact on
coffee prices. As the production of the different coffee varieties is geographically clustered, a
positive ENSO shock had a positive effect on the price of Robusta, but a negative effect on the
price of Arabica coffee.
While the above account is merely a snapshot taken from all the studies on coffee price
cointegration, it shows that coffee prices on different markets cointegrate, but that the level and
speed of price adjustments depends on factors determined by coffee type and on the importance
of exogenous shocks. However, the Ethiopian export coffee market has been largely under-
researched and under-represented in the literature. This is surprising since the Ethiopian case
is particularly interesting from a research point of view. On the one hand, coffee production is
crucial for the economy and for the livelihoods of many smallholder coffee farmers. On the other
hand, the local coffee market, and hence the income that these smallholder farmers receive,
has changed since the establishment of the ECX. Thus, this study contributes towards the field
of agricultural literature in two ways. Firstly, the present study investigates how the prices of
different Ethiopian origin coffees integrate within the global coffee market. Previous studies
investigating export coffee price integration have considered quality differences between the
exporting countries (Milas et al., 2004, Ghoshray, 2009). However, this study takes the price of
Ethiopian coffees with different origins into consideration. Secondly, as far as we understand,
no other study has been previously conducted on the changes in the cointegration of the
Ethiopian coffee market with the international coffee market since the establishment of the ECX.
3.3 Data sources and econometric methods
3.3.1 Data and sources
The data used for the present study consists of average monthly Free on Board (FOB) coffee
price series for Ethiopian and major coffee types in the international market, for the period
between January 1999 and March 2015. The major Ethiopian coffees considered for this study
are Sidama, Yirgacheffe, Jimma, and Harar, whereas Brazilian Naturals, Colombian Milds, Other
Milds, and Robusta are considered for the global coffee market. The Ethiopian export prices
were obtained from the Ethiopian Revenue and Customs Authority’s unpublished annual price
42
report, while coffee prices on the international market were obtained from the International
Coffee Organisation (www.ico.org). All Ethiopian coffee prices wet converted into US dollar/kg8.
Furthermore, all prices were indexed based on the price in January 1999 for each type of coffee
in order to overcome problems of comparing distant price data. The observations from January
1999 to November 2008 were considered pre-ECX, while the post-ECX subseries ran from
December 2008 to March 2015.
Figures 3.1 to 3.4 present the price evolutions between Ethiopian and international coffee
prices. The figures suggest that most of the Ethiopian coffees have a close relationship with
international coffee prices. The global coffee price boom in 2011 and 2012 was also observed
in the Ethiopian coffee prices. Moreover, Ethiopian coffee prices were characterised by frequent
short price spikes. In early 2012, the international coffee prices, including Ethiopian coffee
prices, started to decline. However, the price of Harar coffee only started to decrease in 2013.
Columbian Milds, which are considered to be the highest quality coffee, command a
premium on the world market. Other Milds coffees and Brazilian Naturals are considered
intermediate to low-quality Arabica coffee (see ICO, 2014a), and the price differences between
Other Milds and Brazilian Naturals is small (see ICO, 2014b). The Robusta coffee group is
considered as inferior quality, which is also reflected in its lower price compared to the price of
other coffees. Although, the international demand for Robusta coffee has increased during the
last decade (ICO, 2014c).
Ethiopian coffees are in high demand on the world market. This is due to the country’s
favourable environmental conditions, such as suitable altitude, ample rainfall, optimum
temperatures, appropriate planting materials, and fertile soil. Ethiopian coffee is known for its
unique aroma and flavour. Ethiopia also has a broad genetic diversity amongst its coffee
varieties, including the indigenous variety of Arabica coffee (ECX, 2008).
8 Prices were converted to USD/kg for the tables and figures for easier interpretation by the reader.

43
Figure 3.1 Comparison of the price of Harar coffee to the international prices (1999 to 2014) (USD/kg)
Source: ICO
Figure 3.2 Comparison of the price of Sidama coffee to the international prices (1999 to 2014) (USD/kg)
Source: ICO
0.00
1.00
2.00
3.00
4.00
5.00
6.00
7.00
8.00
9.00
Jan
-99
Au
g-9
9
Mar
-00
Oct
-00
May
-01
Dec
-01
Jul-
02
Feb
-03
Sep
-03
Ap
r-0
4
No
v-0
4
Jun
-05
Jan
-06
Au
g-0
6
Mar
-07
Oct
-07
May
-08
Dec
-08
Jul-
09
Feb
-10
Sep
-10
Ap
r-1
1
No
v-1
1
Jun
-12
Jan
-13
Au
g-1
3
Mar
-14
Oct
-14
USD
/kg
Year and months
COLOMBIAN_MILDS BRAZILIAN_NATURALS ROBUSTAS OTHER_MILDS HARAR
0.00
1.00
2.00
3.00
4.00
5.00
6.00
7.00
8.00
Jan
-99
Au
g-9
9
Mar
-00
Oct
-00
May
-01
Dec
-01
Jul-
02
Feb
-03
Sep
-03
Ap
r-0
4
No
v-0
4
Jun
-05
Jan
-06
Au
g-0
6
Mar
-07
Oct
-07
May
-08
Dec
-08
Jul-
09
Feb
-10
Sep
-10
Ap
r-1
1
No
v-1
1
Jun
-12
Jan
-13
Au
g-1
3
Mar
-14
Oct
-14
USD
/kg
Year and months
COLOMBIAN_MILDS BRAZILIAN_NATURALS ROBUSTAS OTHER_MILDS SIDAMA

44
Figure 3.3 Comparison of the price of Yirgacheffe coffee to the international prices (1999 to 2014) (USD/kg)
Source: ICO
Figure 3.4 Comparison of the price of Jimma coffee to the international prices (1999 to 2014) (USD/kg)
Source: ICO
3.4 Econometrics methodology
To investigate the stationarity issue (the possible presence of unit roots in the price series), the
study performed a univariate analysis of each of the price series. Furthermore, the existence of
cointegration between the price series was tested using an Autoregressive Distributed Lag
(ARDL) model. This model has a number of advantages over the other linear cointegration
0.00
2.00
4.00
6.00
8.00
10.00
Jan
-99
Au
g-9
9
Mar
-00
Oct
-00
May
-01
Dec
-01
Jul-
02
Feb
-03
Sep
-03
Ap
r-0
4
No
v-0
4
Jun
-05
Jan
-06
Au
g-0
6
Mar
-07
Oct
-07
May
-08
Dec
-08
Jul-
09
Feb
-10
Sep
-10
Ap
r-1
1
No
v-1
1
Jun
-12
Jan
-13
Au
g-1
3
Mar
-14
Oct
-14
USD
/kg
Year and months
COLOMBIAN_MILDS BRAZILIAN_NATURALS ROBUSTAS OTHER_MILDS YIRGACHEFE
0.00
1.00
2.00
3.00
4.00
5.00
6.00
7.00
8.00
Jan
-99
Au
g-9
9
Mar
-00
Oct
-00
May
-01
Dec
-01
Jul-
02
Feb
-03
Sep
-03
Ap
r-0
4
No
v-0
4
Jun
-05
Jan
-06
Au
g-0
6
Mar
-07
Oct
-07
May
-08
Dec
-08
Jul-
09
Feb
-10
Sep
-10
Ap
r-1
1
No
v-1
1
Jun
-12
Jan
-13
Au
g-1
3
Mar
-14
Oct
-14
USD
/kg
Year and months
COLOMBIAN_MILDS BRAZILIAN_NATURALS ROBUSTAS OTHER_MILDS JIMMA

45
models. We also introduced a Nonlinear Autoregressive Distributed Lag model (NARDL). This
model allows for the investigation of short- and long-run asymmetries between time series.
3.4.1 Stationarity test
Since most macroeconomic time series seem to be non-stationary, most of the cointegration
techniques require testing the stationarity of the individual variables (Nelson and Plosser, 1982).
Stationarity tests are a necessary pre-condition, since modelling with non-stationary variables
can result in spurious relationships. In some time-series analysis, a combination of non-
stationary variables may result in cointegration, while they are actually not cointegrating. In such
cases, the standard assumptions for asymptotic analysis are not valid and the usual t-ratios will
not follow a t-distribution (Nielsen, 2005). In cases where the time-series are non-stationary,
alternative modelling approaches need to be considered.
The Augmented Dickey–Fuller (ADF) test is frequently used to test stationarity. It tests the null
hypothesis that a series (Xt) is non-stationary by calculating t-statistics for = 0. Based on
Dickey and Fuller (1981), the formula is written as follows:
𝛥 𝑋𝑡 = 𝜆 + 𝑋𝑡 − 1 + 𝑡 + ∑𝑗
𝑚
𝑗=2
∆𝑋𝑡−𝑗 + 𝑡 Eq. 1
Where Δ Xt = Xt - Xt-1, Δ Xt-j = Xt-j - Xt-j-1 and j= 2,..n, and where Xt, Xt-1, Xt-j andXt-j-1 are the
prices at time t, t-1, t-j and t-j-1 respectively. Whereas, λ, , , and are the parameters to be
estimated and t is the white noise error term. If the value of the ADF statistics is less than the
critical value, the price series (Xt) are said to be stationary. If Xt is found to be non-stationary, it
needs to be determined if Xt is stationary at the first difference. If the first difference of the series
(ΔXt) is stationary, the price series (Xt) is considered to be integrated to the order of one. The
lag length calculated for each of the price series considers that the residuals possess a white
noise character.
3.4.2 The bounds test approach to cointegration (ARDL model)
We used a bound testing approach to cointegration in an ARDL framework developed by
Pesaran et al. (2001). This model has various interesting characteristics compared to other
approaches for testing cointegration. Firstly, the ARDL procedure can be applied when the
regressors are I(1) or I(0), except for the order of integration two (I(2)) (e.g. see Wolde-Rufael,
2005 and Emran et al., 2007). This means that the ARDL procedure does not require any

46
knowledge of the order of integration and thus avoids the inherent limitations involved in testing
for unit roots prior to testing for cointegration. Secondly, the ARDL procedure is a statistically
significant approach for determining cointegration relationships in studies with a small sample
size (Narayan, 2005). Thirdly, the different variables can have different optimal lags when using
the ARDL procedure. A fourth advantage is that the ARDL procedure employs a single reduced
form equation, while the conventional cointegration procedures estimate the long-run
relationships with system equations. Finally, the approach is based on the estimation of a
dynamic error correction model and tests if the lagged levels of the variables are statistically
significant. In addition, the short- and the long-run relationships can be estimated simultaneously
(Emran et al., 2007). Regardless of the above-mentioned advantages, ARDL results can be
inconclusive in certain instances.
For example, as proposed by Pesaran et al. (2001), the standard ARDL (g, q)
cointegration model can take the following form:
∆𝑃𝑛𝑡 = 𝛽0 + ∑ 1𝑖
𝑔−1
𝑖=1
∆𝑃𝑛𝑡−𝑖 + ∑ 2𝑖
𝑞−1
𝑖=0
∆𝑃𝑚𝑡−𝑖 + 3𝑃𝑛𝑡−1 + 4𝑃𝑚𝑡−1 + 𝜆𝑙𝑡 Eq. 2
where 𝛲𝑛 is the coffee price in market n and Ρm is the coffee price in market m. The
parameters 1i and 2i with 𝑖 = 1, 2 are the corresponding long-run multipliers, while the
parameters 3 and 4 are the short-run dynamic coefficients of the underlying ARDL model. The
first step in the ARDL bound approach is to estimate the equation using ordinary least squares.
With Eq.2, the model tests the joint significance of the lagged price levels in markets n and m.
Under the null hypothesis, no cointegration is defined as H0: 3 = 4 = 0 against the alternative
hypothesis H1: 3 ≠ 4 ≠ 0.
The basis for the ARDL bound test is the Wald-test or F-statistics. Two sets of critical
values, a lower critical bound and an upper critical bound, for the cointegration test were first
developed by Pesaran et al. (2001), and later modified by Narayan (2005) in order to
accommodate small sample sizes. A lower critical bound is used when all the variables are I(0)
or when the variables are not cointegrated. The upper bound assumes that all the variables are
I(1) and are cointegrated. F-statistics larger than the upper critical bound suggests to reject the
hypothesis that markets are not cointegrated irrespective of the series being I(0) or I(1). When
the F-statistics are lower than the lower critical bound, the hypothesis of no cointegration cannot

47
be rejected. However, when the F-statistics calculated fall between the two critical values, the
result is inconclusive (Pesaran et al., 2001).
If a cointegration relationship is established between 𝛲𝑛 and Ρm(Eq. 2), the next step would
be to estimate the ARDL model with the optimal lag. To determine the optimal lags for each
price series, the ARDL method estimates (R + 1)a number of regressions, where R+1 is the
maximum lag to be used and superscript a represents the number of variables in the equation
(Shrestha and Chowdhury, 2005; Li and Lin, 2015). According to Pesaran et al. (2001), the
optimisation process is performed using the Akaike information criterion(AIC):
𝛺(𝐿, 𝑅0)𝑃𝑛 = ℬ0 + ∁(𝐿, 𝑆1)𝑃𝑚 + ℧𝑡 Eq. 3
where
𝛺(𝐿, 𝑅0) = 1 − 𝛺1𝐿 − 𝛺2𝐿2 − … … … … . −𝛺𝑅0𝐿𝑅0
∁(𝐿, 𝑆1) = ∁0 + ∁1𝐿 + ∁2𝐿2 + … … … … . . +∁𝑆1𝐿𝑆1
L denotes the lag operator with 𝐿iPm=Pmt-i , i = 0, + 1, + 2, etc. In the long run, we have Pnt =
Pnt-1 =…=Pnt-R0; Pmt = Pmt-I = Pmt-S1.
Furthermore, equation 4 estimates the long-run equation as follows:
𝑃𝑛 = 𝛾 + ∁𝑃𝑚 + ℰ𝑡 Eq. 4
Where 𝛾 = ℬ0
𝛺(1, 𝑅0)⁄
∁ = ∁ (1, 𝑆1) 𝛺(1,⁄ 𝑅0);
ℰ𝑡 = ℧𝑡 𝛺(1, 𝑅0)⁄
∁ in equation 4 represents the long-run coefficient which explains the degree of market
integration. If two markets establish a long-run integration, ∁ explains the extent to which a price
change (increase or decrease) in one of the markets is a result of a price change in the other
market. However, the long-run cointegration coefficient does not indicate which variable induced
the integration. If we were to discover evidence of long-run relationships between coffee price
series, then we could estimate the short-run coefficients according to the following model:

48
∆𝑃𝑛𝑡 = 𝛾 + ∑ ∁𝑅0
𝑅0−1
𝑖=1
∆𝑃𝑛𝑡−𝑖 + ∑ ∁𝑆𝑖
𝑆1−1
𝑖=0
∆𝑃𝑚𝑡−𝑖 + ∁𝑒𝑒𝑐𝑚−1 + 𝜇𝑡 Eq. 5
where 𝑒𝑐𝑚t = Pnt – γ – ∁Pmt. In the error-correction term model, the residuals obtained
from the estimated cointegration model of Eq.2 are incorporated in the estimation of Eq. 5. The
model explains the speed of adjustment needed to restore long-run equilibrium following a short-
run shock. Moreover, the value of the error-correction term should be negative and statistically
significant.
For the robustness of the ARDL model, it is necessary to perform a diagnosis test. The
Breusch-Godfrey Lagrange Multiplier test for serial correlation and the Autoregressive
Conditional Heteroscedasticity (ARCH) test (Engle, 1982) for heteroscedasity are the two most
commonly used tools. These tests are performed on the residuals of the estimated variables.
3.4.3 Nonlinear Autoregressive Distributed Lag model (NARDL)
Many recent studies on cointegration have considerd the existence of nonlinear relationships
between different macroeconomic variables (Atil et al., 2014; Jammazi et al., 2015; Fousekis et
al., 2016). Since we were particularly interested in price adjustments, we also estimated an
extension of the ARDL model, as recently developed by Shin et al. (2014), that accommodates
asymmetric price dynamics. The novelty of this technique is its ability to detect both short- and
long-run asymmetries between the time series, using positive and negative partial sum
decomposition. The asymmetric ARDL9 specification allows for the analysis of non-stationarity
and nonlinearity jointly in the context of an unrestricted error correction model (e.g. see
Katrakilidis and Trachanas (2012) and Atil et al. (2014)).
Following Shin et al. (2014), we estimated the following nonlinear asymmetric
cointegrating regression:
𝑡 = +𝑄𝑡++ −𝑄𝑡
− + 𝑡 Eq. 6
Where +and − are the long-run cointegration parameters, 𝑡 is the error term and 𝑄𝑡 is a N
x 1 vector of regressors (price) decomposed as:
𝑄𝑡 = 𝑄0 + 𝑄𝑡+ + 𝑄𝑡
− Eq. 7
9 Both ARDL and NARDL models were analysed using Eviews.
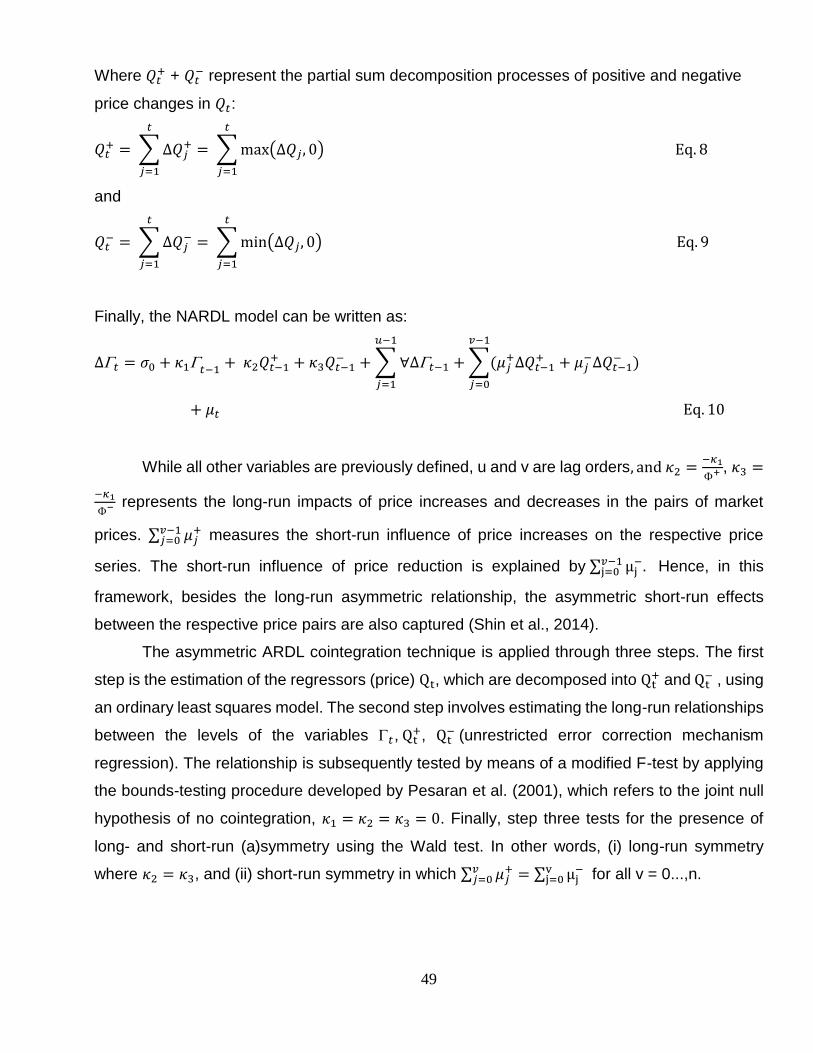
49
Where 𝑄𝑡+ + 𝑄𝑡
− represent the partial sum decomposition processes of positive and negative
price changes in 𝑄𝑡:
𝑄𝑡+ = ∑ ∆𝑄𝑗
+
𝑡
𝑗=1
= ∑ max(∆𝑄𝑗, 0) Eq. 8
𝑡
𝑗=1
and
𝑄𝑡− = ∑ ∆𝑄𝑗
−
𝑡
𝑗=1
= ∑ min(∆𝑄𝑗, 0) Eq. 9
𝑡
𝑗=1
Finally, the NARDL model can be written as:
∆𝑡 = 𝜎0 + 𝜅1𝑡−1+ 𝜅2𝑄𝑡−1
+ + 𝜅3𝑄𝑡−1− + ∑ ∀∆𝑡−1
𝑢−1
𝑗=1
+ ∑(𝜇𝑗+∆𝑄𝑡−1
+
𝑣−1
𝑗=0
+ 𝜇𝑗−∆𝑄𝑡−1
− )
+ 𝜇𝑡 Eq. 10
While all other variables are previously defined, u and v are lag orders, and 𝜅2 =−𝜅1
+ , 𝜅3 =
−𝜅1
− represents the long-run impacts of price increases and decreases in the pairs of market
prices. ∑ 𝜇𝑗+𝑣−1
𝑗=0 measures the short-run influence of price increases on the respective price
series. The short-run influence of price reduction is explained by ∑ μj−𝑣−1
j=0 . Hence, in this
framework, besides the long-run asymmetric relationship, the asymmetric short-run effects
between the respective price pairs are also captured (Shin et al., 2014).
The asymmetric ARDL cointegration technique is applied through three steps. The first
step is the estimation of the regressors (price) Qt, which are decomposed into Qt+ and Qt
− , using
an ordinary least squares model. The second step involves estimating the long-run relationships
between the levels of the variables 𝑡, Qt+, Qt
− (unrestricted error correction mechanism
regression). The relationship is subsequently tested by means of a modified F-test by applying
the bounds-testing procedure developed by Pesaran et al. (2001), which refers to the joint null
hypothesis of no cointegration, 𝜅1 = 𝜅2 = 𝜅3 = 0. Finally, step three tests for the presence of
long- and short-run (a)symmetry using the Wald test. In other words, (i) long-run symmetry
where 𝜅2 = 𝜅3, and (ii) short-run symmetry in which ∑ 𝜇𝑗+𝑣
𝑗=0 = ∑ μj−v
j=0 for all v = 0...,n.

50
3.5 Results
3.5.1 Stationary test
Production and supply of agricultural commodities tend to have a seasonal variation which gears
prices into non-stationary patterns (Sorensen, 2002). Table 3.1 displays the results of the
Augmented Dickey-Fuller (ADF) test which is used to determine whether or not the series are
stationary. As can be seen from table 3.1, all prices in both the pre- and post-ECX periods were
stationary at the first difference. Hence, the null hypothesis of unit root is rejected and it is safe
to conclude that all the variables become stationary at the first difference and they are integrated
in order one I(1).
Table 3.1 Result of the unit root tests using Augmented Dickey–Fuller test for Ethiopian and international traded coffee prices
Augmented Dickey–Fuller statistics
Type of coffee series At level/ First difference
Pre-ECX Post-ECX
Drift Trend Drift Trend
Brazilian Naturals Level -1.93 -0.92 -1.66 -1.31
First difference -9.25*** -9.29*** -6.95*** -7.11***
Colombian Milds Level -0.99 -1.85 -1.94 -2.23
First difference -8.90*** -8.97*** -5.59*** -5.73***
Other Milds Level -1.37 -2.47 -1.84 -2.09
First difference -8.84*** -8.86*** -5.28*** -5.35***
Robustas Level -0.82 -2.59 -1.66 -1.72
First difference -8.18*** -8.45*** -6.42*** -6.40***
Harar Level -1.32 -2.53 -1.87 -1.17 First difference -9.53*** -9.88*** -11.62*** -11.83***
Yirgacheffe Level -2.41 -2.97 -1.41 -1.57
First difference -15.22*** -15.15* -11.76*** -11.70***
Sidama Level -1.96 -2.73 -1.45 -1.48
First difference -10.91*** -11.81* -8.07*** -8.01**8
Jimma Level -1.25 -2.48 -1.70 -1.75
First difference -11.54*** -11.63* -12.00*** -11.93***
Note: ***, **, *, indicate statistical significance at 1%, 5% and 10% respectively.

51
3.5.2 Cointegration tests between prices of Ethiopian and internationally traded coffees
The NARDL estimates for this study indicate that the null hypothesis of no cointegration of all
market pairs cannot be rejected in both pre- and post-ECX periods (see Appendix I). This
suggests that the assumptions made by NARDL to capture the nonlinear cointegration between
Ethiopian and international coffee prices were not met and the NARDL model failed to explain
the asymmetric price relationships of the four Ethiopian coffees with the international coffees.
Since we failed to find long-run cointegration using the nonlinear cointegration models, linear
models were tested using an ARDL model.
As previously mentioned, the ARDL model is preceded by a test of optimal lag length
(Table 3.2). In search of the optimal lag lengths, a general-to-specific testing approach is used,
considering a maximum lag of 4. In order to identify the cointegration between the different types
of Ethiopian coffee, the price series for each type of coffee was paired with the price series for
each of the four international coffee groups (Robusta, Other Milds, Colombian Milds, and
Brazilian Naturals). All price series in the two time-periods were integrated in the same order of
integration, which is a precondition for the cointegration analysis.
The results of the ARDL models in Table 3.2 show that during the pre-ECX period, the
prices of the four Ethiopian coffee types established a long-run cointegration with the prices of
the Arabica coffee types (Other Milds, Colombian Milds and Brazilian Naturals) fetched on the
international market. The lack of price cointegration for Yirgacheffe and Harar coffee with
Robusta was not a surprise due to their premium Arabica nature. Furthermore, Jimma and
Sidama coffee prices cointegrated with Robusta coffee in the long run. Table 3.3 provides a
summary of the results comparing all four types of Ethiopian coffee with coffee types from the
international market.
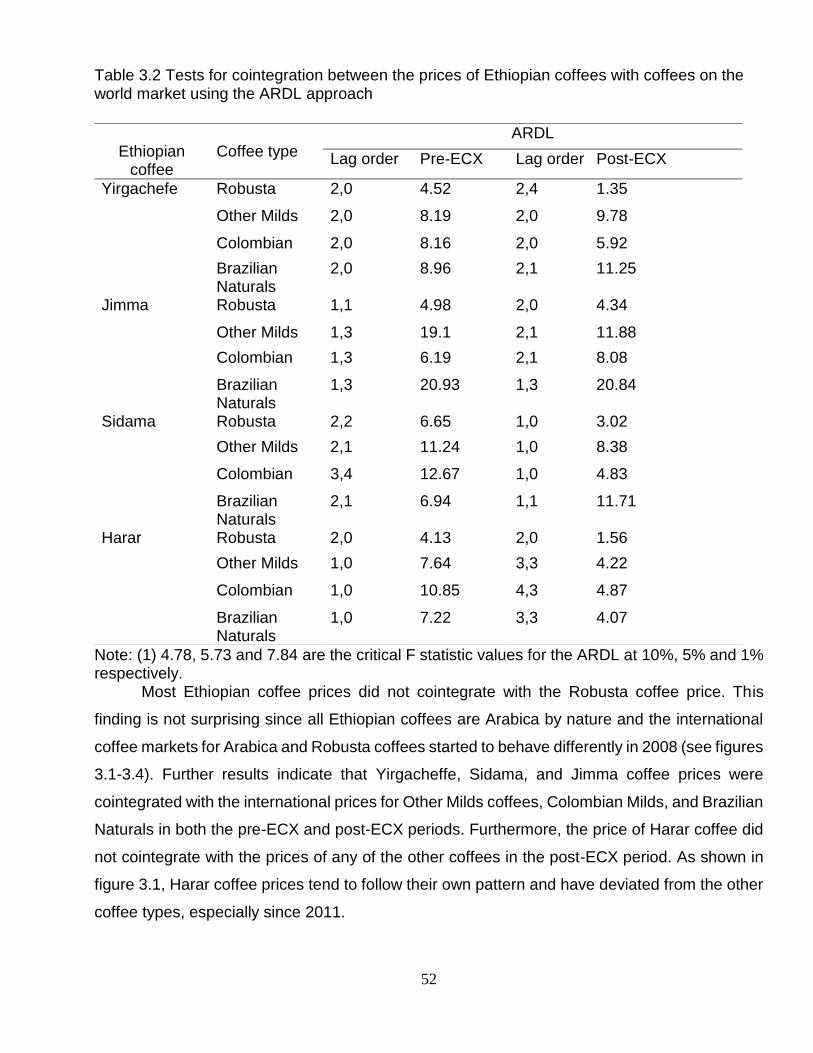
52
Table 3.2 Tests for cointegration between the prices of Ethiopian coffees with coffees on the world market using the ARDL approach
Note: (1) 4.78, 5.73 and 7.84 are the critical F statistic values for the ARDL at 10%, 5% and 1% respectively.
Most Ethiopian coffee prices did not cointegrate with the Robusta coffee price. This
finding is not surprising since all Ethiopian coffees are Arabica by nature and the international
coffee markets for Arabica and Robusta coffees started to behave differently in 2008 (see figures
3.1-3.4). Further results indicate that Yirgacheffe, Sidama, and Jimma coffee prices were
cointegrated with the international prices for Other Milds coffees, Colombian Milds, and Brazilian
Naturals in both the pre-ECX and post-ECX periods. Furthermore, the price of Harar coffee did
not cointegrate with the prices of any of the other coffees in the post-ECX period. As shown in
figure 3.1, Harar coffee prices tend to follow their own pattern and have deviated from the other
coffee types, especially since 2011.
Ethiopian
coffee
Coffee type
ARDL
Lag order Pre-ECX Lag order Post-ECX
Yirgachefe Robusta 2,0 4.52 2,4 1.35
Other Milds 2,0 8.19 2,0 9.78
Colombian 2,0 8.16 2,0 5.92
Brazilian Naturals
2,0 8.96 2,1 11.25
Jimma Robusta 1,1 4.98 2,0 4.34
Other Milds 1,3 19.1 2,1 11.88
Colombian 1,3 6.19 2,1 8.08
Brazilian Naturals
1,3 20.93 1,3 20.84
Sidama Robusta 2,2 6.65 1,0 3.02
Other Milds 2,1 11.24 1,0 8.38
Colombian 3,4 12.67 1,0 4.83
Brazilian Naturals
2,1 6.94 1,1 11.71
Harar Robusta 2,0 4.13 2,0 1.56
Other Milds 1,0 7.64 3,3 4.22
Colombian 1,0 10.85 4,3 4.87
Brazilian Naturals
1,0 7.22 3,3 4.07
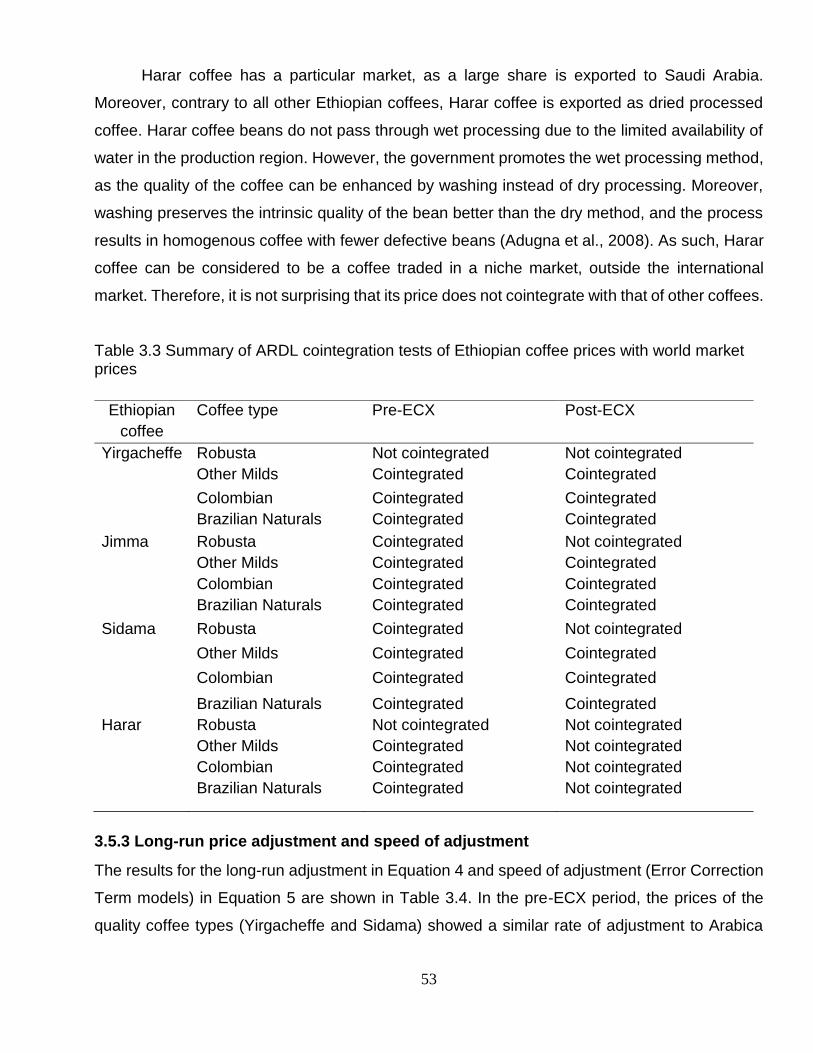
53
Harar coffee has a particular market, as a large share is exported to Saudi Arabia.
Moreover, contrary to all other Ethiopian coffees, Harar coffee is exported as dried processed
coffee. Harar coffee beans do not pass through wet processing due to the limited availability of
water in the production region. However, the government promotes the wet processing method,
as the quality of the coffee can be enhanced by washing instead of dry processing. Moreover,
washing preserves the intrinsic quality of the bean better than the dry method, and the process
results in homogenous coffee with fewer defective beans (Adugna et al., 2008). As such, Harar
coffee can be considered to be a coffee traded in a niche market, outside the international
market. Therefore, it is not surprising that its price does not cointegrate with that of other coffees.
Table 3.3 Summary of ARDL cointegration tests of Ethiopian coffee prices with world market prices
3.5.3 Long-run price adjustment and speed of adjustment
The results for the long-run adjustment in Equation 4 and speed of adjustment (Error Correction
Term models) in Equation 5 are shown in Table 3.4. In the pre-ECX period, the prices of the
quality coffee types (Yirgacheffe and Sidama) showed a similar rate of adjustment to Arabica
Ethiopian
coffee
Coffee type Pre-ECX Post-ECX
Yirgacheffe Robusta Not cointegrated Not cointegrated
Other Milds Cointegrated Cointegrated
Colombian Cointegrated Cointegrated
Brazilian Naturals Cointegrated Cointegrated
Jimma Robusta Cointegrated Not cointegrated
Other Milds Cointegrated Cointegrated
Colombian Cointegrated Cointegrated
Brazilian Naturals Cointegrated Cointegrated
Sidama Robusta Cointegrated Not cointegrated
Other Milds Cointegrated Cointegrated
Colombian Cointegrated Cointegrated
Brazilian Naturals Cointegrated Cointegrated
Harar Robusta Not cointegrated Not cointegrated
Other Milds Cointegrated Not cointegrated
Colombian Cointegrated Not cointegrated
Brazilian Naturals Cointegrated Not cointegrated

54
coffee price changes in the long-run. The price of Jimma coffee, which is considered a relatively
lower quality coffee among the four Ethiopian coffees, showed a slightly higher rate of price
adjustment towards Arabica coffee prices. Sidama coffee prices adjusted to price deviations for
Robusta coffee. However, the rate of price adjustment was not as high as for price deviations
for Other Milds coffees, Colombian Milds coffees, and Brazilian Naturals. Furthermore, the
adjustment rates of the prices for the Ethiopian coffee were relatively closer to the Other Milds
and Colombian Milds coffees as compared to Brazilian Naturals and Robusta coffee. This
implies that during the pre-ECX period, most of the price adjustments in the Ethiopian coffee
prices emanated from price changes of Other Milds and Colombian Milds coffee.
During the post-ECX period, the price of Harar coffee did not cointegrate with the prices of
the other types of Arabica coffee. Figure 3.1 confirms that the Harar coffee price did not follow
the prices of other coffee types during this period. The price of Jimma coffee had a higher rate
of price adjustment to the international price of Brazilian Naturals coffee as compared to the
prices for the other Ethiopian coffees. The price cointegration of Sidama coffee with Robusta
coffee in the pre-ECX period diminished in the post-ECX period. Prices for Yirgacheffe and
Sidama coffee adjusted to prices for Other Milds and Colombian Milds coffee.
The price adjustment rate for most Ethiopian coffee prices in the post-ECX period was
highest relative to the prices of Colombian Milds rather than Other Milds coffee, Brazilian
Naturals, and Robusta coffee. Even though Ethiopian coffees are being labelled under Brazilian
Naturals in the international coffee market, which is considered as an intermediate quality type
in between Colombia and Other Milds coffee, the results suggest that the prices of the Ethiopian
coffees are most responsive to those of the Colombian Milds type. These results imply that
changes in prices of Colombian Milds coffee strongly and directly affect the price adjustments
for all of the Ethiopian coffee types except for Harar coffee.
In addition, the estimates of the Error Correction Term (ECT) models are consistent with
what would be expected based on the order of coffee quality (Table 3.4). The ECT was the
lowest for the price of Jimma coffee relative to the prices of Arabica coffees. In the pre-ECX
period, we observed that the speed of adjustment towards equilibrium between the prices for
Harar and Yirgacheffe coffee and the price of Arabica coffee was the highest. The Harar coffee
price returned to its equilibrium price after two months. The Sidama coffee price had a weak
relationship with the Robusta coffee price, as shown by a smaller ECT. Moreover, it took four
months for the Sidama coffee price to return to equilibrium.

55
Table 3.4 Long-run price adjustment of Ethiopian coffee prices with prices on the international markets and speed of adjustment coefficients
Ethiopian coffee
Coffee type Pre-ECX Post-ECX
Ω ECT Ω ECT
Yirgacheffe Robustas - - - -
Other Milds 0.92*** -0.39 0.90*** -0.14
Colombian Milds 0.97*** -0.42 1.14** -0.10
Brazilian
Naturals
0.77*** -0.39 0.67*** -0.29
Jimma Robustas - - - -
Other Milds 1.34*** -0.32 0.73*** -0.31
Colombian Milds 1.34*** -0.22 0.90*** -0.22
Brazilian
Naturals
1.10*** -0.34 0.70*** -0.65
Sidama Robustas 0.66*** -0.26 - -
Other Milds 1.06*** -0.32 0.74*** -0.15
Colombian Milds 1.10*** -0.39 0.81*** -0.12
Brazilian
Naturals
0.84*** -0.31 0.69*** -0.27
Harar Robustas - - - -
Other Milds 0.62*** -0.42 - -
Colombian Milds 0.63*** -0.52 - -
Brazilian
Naturals
0.51*** -0.45 - -
Note: *** and ** indicates the significance at 1% and 5% level;
Furthermore, the speed of adjustment towards equilibrium in the post-ECX period was the
highest for the price of Jimma coffee. The ECTs for Yirgacheffe and Sidama coffee prices were
relatively small, which implies a weak adjustment power for the two coffees to price
disequilibrium. Since Harar coffee did not establish a price cointegration, it was not possible to
estimate the speed of price adjustment. This is consistent with the fact that, in the post-ECX
period, the prices of quality coffees started to deviate instead of being closely determined by the
prices of the other Arabica-type coffees in the world market.
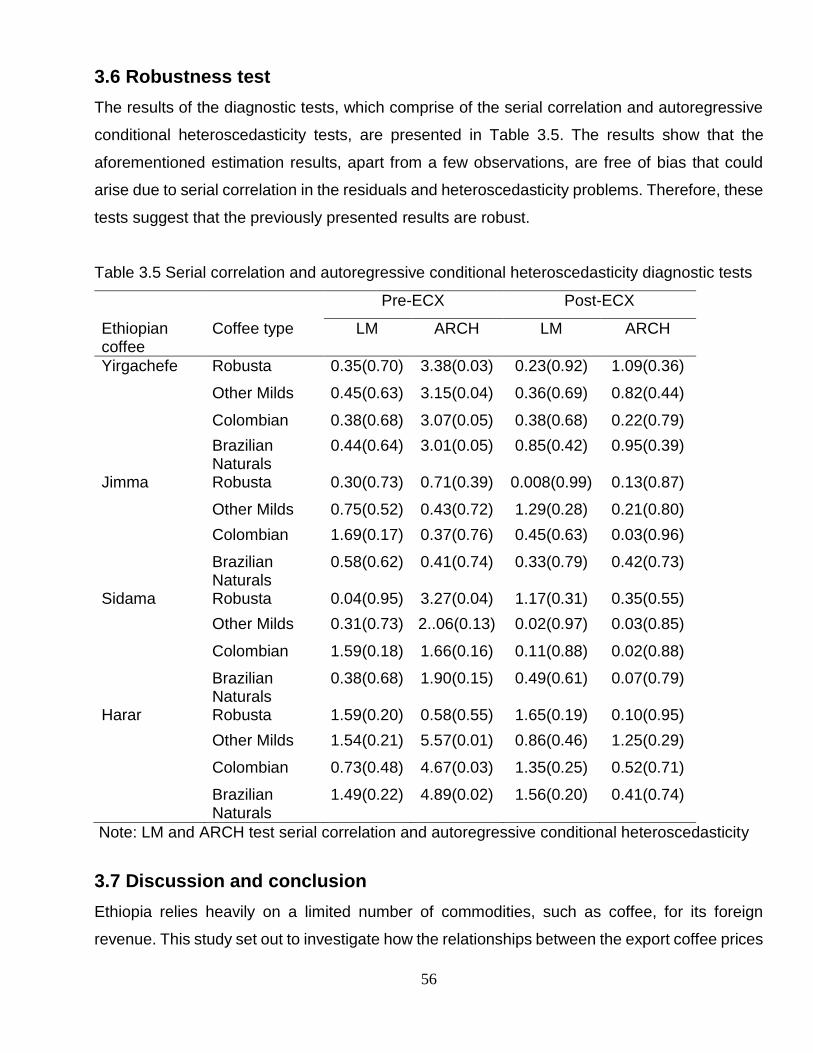
56
3.6 Robustness test
The results of the diagnostic tests, which comprise of the serial correlation and autoregressive
conditional heteroscedasticity tests, are presented in Table 3.5. The results show that the
aforementioned estimation results, apart from a few observations, are free of bias that could
arise due to serial correlation in the residuals and heteroscedasticity problems. Therefore, these
tests suggest that the previously presented results are robust.
Table 3.5 Serial correlation and autoregressive conditional heteroscedasticity diagnostic tests
Pre-ECX Post-ECX
Ethiopian coffee
Coffee type LM ARCH LM ARCH
Yirgachefe Robusta 0.35(0.70) 3.38(0.03) 0.23(0.92) 1.09(0.36)
Other Milds 0.45(0.63) 3.15(0.04) 0.36(0.69) 0.82(0.44)
Colombian 0.38(0.68) 3.07(0.05) 0.38(0.68) 0.22(0.79)
Brazilian Naturals
0.44(0.64) 3.01(0.05) 0.85(0.42) 0.95(0.39)
Jimma Robusta 0.30(0.73) 0.71(0.39) 0.008(0.99) 0.13(0.87)
Other Milds 0.75(0.52) 0.43(0.72) 1.29(0.28) 0.21(0.80)
Colombian 1.69(0.17) 0.37(0.76) 0.45(0.63) 0.03(0.96)
Brazilian Naturals
0.58(0.62) 0.41(0.74) 0.33(0.79) 0.42(0.73)
Sidama Robusta 0.04(0.95) 3.27(0.04) 1.17(0.31) 0.35(0.55)
Other Milds 0.31(0.73) 2..06(0.13) 0.02(0.97) 0.03(0.85)
Colombian 1.59(0.18) 1.66(0.16) 0.11(0.88) 0.02(0.88)
Brazilian Naturals
0.38(0.68) 1.90(0.15) 0.49(0.61) 0.07(0.79)
Harar Robusta 1.59(0.20) 0.58(0.55) 1.65(0.19) 0.10(0.95)
Other Milds 1.54(0.21) 5.57(0.01) 0.86(0.46) 1.25(0.29)
Colombian 0.73(0.48) 4.67(0.03) 1.35(0.25) 0.52(0.71)
Brazilian Naturals
1.49(0.22) 4.89(0.02) 1.56(0.20) 0.41(0.74)
Note: LM and ARCH test serial correlation and autoregressive conditional heteroscedasticity
3.7 Discussion and conclusion
Ethiopia relies heavily on a limited number of commodities, such as coffee, for its foreign
revenue. This study set out to investigate how the relationships between the export coffee prices

57
in Ethiopia and other coffee-exporting countries changed between 1998-2008 and 2008-2013
as a result of the establishment of the ECX. This was achieved by examining the cointegration
between four Ethiopian export coffees (Harar, Yirgacheffe, Sidama, and Jimma) and four
international coffees (Robusta, Other Milds, Colombian Milds, and Brazilian Naturals).
Autoregressive distributed lag models were used to capture these patterns of cointegration using
monthly price data for both the 1998-2008 (pre-ECX) and 2008-2013 (post-ECX) periods.
The establishment of the ECX could solely influence the integration of the various
Ethiopian coffee prices with the international coffee prices. However, while it is difficult to isolate
the influence of the ECX on the level of integration, other factors, which were not taken into
account in this study, could also contribute to the degree of price integration. Thus, the present
study attempts to achieve its aims by considering the establishment of the ECX as a point of
reference, and by comparing the cointegration levels of prices between the two time-periods.
The ARDL test results showed that during the pre-ECX period, the prices of all types of
Ethiopian coffees established a long-run cointegration with the price of Arabica coffees on the
international markets. Similarly, Jimma and Sidama coffee prices cointegrated in the long-run
with prices for Robusta coffee in the pre-ECX period. Furthermore, Yirgacheffe, Sidama, and
Jimma coffee prices were cointegrated with the international prices for Other Milds, Colombian
Milds, and Brazilian Naturals during the post-ECX period. Finally, the price of Harar coffee did
not cointegrate with the prices of any of the Arabica coffee types in the post-ECX period.
Ethiopian coffee prices in the pre-ECX period adjusted more to prices of Other Milds and
Colombian Milds coffee. Similarly, during the post-ECX period, market distortions in the prices
of Colombian Milds strongly and directly affected the price adjustments for most of the Ethiopian
coffee types. The highest price distortion signals for the Ethiopian coffee market originated from
the Colombian coffee market. Distortions in the prices of the Brazilian coffees also had an
important impact on the prices in the Ethiopian coffee markets. Brazil is the world’s largest coffee
producer and distortions in its market can easily extend to other exporting countries.
Turning to the estimated speed of adjustment, prices for lower quality Ethiopian coffee
adjusted slowly to changes in the price of all Arabica coffees in the pre-ECX period. Better quality
coffees seemed to adjust faster. This phenomenon changed in the post-ECX period as the
reaction time taken to correct the disequilibrium error was shorter for prices of relatively lower
quality Ethiopian coffees and longer for prices of premium and high quality Ethiopian coffees.
For example, the price of Jimma coffee adjusted quickly to changes in the price of Brazilian

58
Naturals. Hence, the results imply that, during the post-ECX period, the pricing of higher and
premium quality coffees began to diverge from the previously established strong linkages with
other Arabica-type coffees. The prices have also become more volatile when a shock in the
international commodity markets occurs.
This study proposes that the commoditization of the ECX has not limited the possibility of
trademarking of the high-quality Ethiopian coffee. This can be concluded because despite online
trade platforms we now observe independent behavior of prices of Ethiopian quality coffee from
the international coffee markets. As highlighted by Arslan and Reicher (2010), and Leung (2014),
the trademarking of the three Ethiopian coffees (Yirgacheffe, Sidama, and Harar) enabled them
to increase their export price. Moreover, the trademarking and the possibility of separately
marketing in the ECX commoditization program of coffee has led to a widening of price
distribution and has created a parallel market for high quality coffee, which is governed by
different marketing mechanisms.
The deviation of the prices for Ethiopian quality coffees, especially Harar coffee, may also
be explained by the export destination of the coffees. Most Ethiopian coffee is exported to
Germany, the USA, and Saudi Arabia. In particular, Harar and Wollega coffee is predominantly
exported to the Saudi market. An estimated 90% of Harar coffee is exported to Saudi Arabia
(unpublished raw data), which explains much of why we do not find a clear price relationship
between the price of Harar coffee and that of prices in the international market. Therefore, the
dominance of Ethiopian coffee in Saudi Arabian markets has created a stable and segmented
market for Harar coffee. Such niche markets may be beneficial for the actors in the market, and
may generate income for the producers, if the higher prices and positive price changes are
transmitted all the way down to the producer markets.
Furthermore, support strategies could clearly contribute to a further differentiation of the
different coffee types. Supporting and incentivising the active participation of premium and high
quality coffees in the flourishing niche coffee markets could enhance the sector and its actors.
In addition, the production and trade of lower quality coffee could be supported in order to
achieve further integration with the international markets if this were to generate positive effects.

59
Chapter 4
Empirical Investigation into Spatial Integration Without Direct Trade: Comparative Analysis
Before and After the Establishment of the Ethiopian Commodity Exchange
Abstract
This chapter presents a comparative analysis of the spatial price cointegration of coffee markets in Ethiopia
in the pre and post Ethiopian Commodity Exchange (ECX) era using the autoregressive distributed lag
(ARDL) cointegration framework. The study takes into consideration a market condition in which
government policy restricts arbitrage coffee trade between coffee producing areas. Using coffee price data
from 1998-2013 and applying a bounds test approach and Toda–Yamamoto Granger causality test, the
study finds that the establishment of the ECX has strengthened regional integration rather than a national
harmony between producer markets. We also find evidence that, since the establishment of the ECX, an
opportunity was created for high quality coffee to dominate price formation while also allowing lower
quality coffee producing areas to establish themselves. The study underlines the importance of market
transparency and exchange of price information between producer markets.
Key words: Coffee price; Autoregressive distributed Lag; Spatial integration; Ethiopian
Commodity Exchange
Based on: Demise, T., Natanelov, V., Verbeke W., & D’Haese, M., 2016. Empirical Investigation into Spatial
Integration Without Direct Trade: Comparative Analysis Before and After the Establishment of the Ethiopian
Commodity Exchange, The Journal of Development Studies, DOI: 10.1080/00220388.2 016.1187722
60
4.1 Introduction
During the period from the 1970s to the 1990s, many developing nations liberalized their
agricultural marketing policies (Krueger et al., 1988; Benedetto et al., 2013). In line with this, the
Ethiopian government has enacted comprehensive economic policy reforms over the
early 1990s that have involved market liberalization, price policy and reform of parastatal
organizations (Getnet, 2007). Most of the measures taken since the 1990s have mainly aimed
to encourage the private sector to become actively involved in the liberalized market. The main
reforms included the devaluation of the Ethiopian Birr from 2.07 to 5.1 Birr/USD in October 1992,
foreign exchange auctioning, and the reduction of entry barriers. More specifically in the coffee
sector, liberalization included the consolidation of all the taxes and duties formerly levied on
coffee exports into a single tax family, no restrictions on the participation of private traders at
auctions, (finally enabling traders to trade in washed coffee), and allowing suppliers and
exporters to sell coffee domestically at market-determined prices (Gemech and Struthers, 2007).
Prior to 1991, coffee markets in Ethiopia were highly regulated and coffee producers
faced implicit and explicit taxation (Worako et al., 2008). Farmers in the main coffee growing
areas of Ethiopia had to supply a predetermined quota to the government (through the Ethiopian
Coffee Marketing Corporation) at a fixed price (Gemech and Struthers, 2007). Coffees from the
different production areas were transported to the central market in Addis Ababa or Dire Dawa
for sorting, inspection and grading. In 1992 policy changes were initiated that affected coffee
production and marketing. They aimed at creating a smooth playing arena for all participants in
the coffee market. It was hoped that this would increase the share of the final export value,
retained by coffee producers, which would give incentives to increasing the volume of production
and hence of exports, eventually resulting in an increase in the total exchange earnings from
coffee export (Gemech, 2007; Worako et al., 2008). The intervention was also intended to induce
more market transparency between actors in the coffee supply chain and to create an integrated
coffee market (Love, 2001).
Despite these structural market reforms, the coffee sector remained inefficient. More
recent attempts to enhance the performance of the Ethiopian coffee market have been
introduced, aimed at offering coffee producers with a reasonable price in order to stimulate
productivity and growth. A study by Gabre-Madhin and Goggin (2005) suggested that
development agendas should move beyond policy incentives mostly geared towards market
reforms and focus more on developing markets by developing institutions to support the
61
marketing process, upgrade infrastructure and provide policy support. This led to a restructuring
of the organizations working in the Ethiopian coffee sector and soon after, in 2008, the auction
markets were replaced by the Ethiopia Commodity Exchange (ECX). The ECX was established
as “an organized marketplace, where buyers and sellers would come together to trade, while
being assured of quality, quantity, payment, and delivery, with the aim of organizing efficient and
transparent market operations” (ECX, 2008).
In spatially integrated markets, policy interventions in one market would be transmitted to
other markets (Baulch, 1997a). The transmission of price signals occurs far less in spatially
separated markets (Goodwin and Piggott, 2001; Ghoshray and Ghosh, 2011). This inspired the
government to establish centrally linked commodity markets in all the major coffee growing areas
of Ethiopia. These ECX markets were given the responsibility for sorting, inspecting and grading
coffee. In addition, the warehouses and communication services started transmitting coffee
prices on a daily basis in an attempt to enhance spatial market integration (ECX, 2008). The
ECX also had to overcome the risks and transaction costs associated with much Ethiopian
coffee being grown in geographically remote areas. Gabre-Madhin and Goggin (2005) attributed
the high transaction costs to a lack of market coordination between marketing agents, a lack of
trust between different market actors and the high costs of acquiring market information. As a
result of these factors, and often geographic remoteness, buyers and sellers operated within
narrow market channels where they trusted the other market actors and could get access to
market information. Under these conditions, market actors were obliged to conduct business
across short distances, with few partners, in few markets, and the weakness of these markets
starkly affected the welfare of rural households (Gabre-Madhin and Goggin, 2005). In order to
create a self-coordinating market among spatially dispersed producer markets and to minimize
transaction costs, the ECX has integrated warehousing and receipt systems with quality
standards, mechanisms to disseminate market information to all market actors, and created a
trading platform that can guarantee payment through banks (Meijerink et al., 2010).
The Ethiopian government strictly prohibited spatial arbitrage in the coffee market
between production areas, even though studies such as Goodwin and Piggott (2001), Barrett
and Li (2002) Lohano and Mari (2006) have shown the importance of both spatial trade and
arbitrage as mechanisms for ensuring spatial integration to signal the transfer of excess demand
and supply across potential markets. The motivation for the Ethiopian government prohibiting
the spatial trade of coffee between different coffee producing regions was mainly informed by

62
the desire to protect coffee quality and prevent adulteration between different coffee types. This
restriction has been in practice since 1990s. Yet, one can ask the extent these different coffee
markets are integrated, without any direct trade between them. Jensen (2007) stressed the
significance of information flows in promoting price cointegration in spatially separated markets.
Stephens et al. (2012) have also provided evidence that information flows across markets and
traders’ networks can lead to the transmission of price signals between markets even in the
absence of direct trade between them. This present study tests the degree of integration
between the country’s six spatially separated coffee producer markets during 1998-2008 (pre-
ECX) and 2008-2013 (post-ECX). We hypothesize that in the uncoordinated, and fragmented
Ethiopian coffee markets, market prices in the different producer areas were not integrating
before the start of the ECX, and were integrating after the establishment of the ECX due to its
activities in transferring price data to the different regional units and warehouses.
The degree of market integration is important in relation to market policies since the
effectiveness of the policies depend on the degree of market integration. A greater degree of
integration leads to better transmission of price signals, which, in turn, encourages producers to
specialize, according to comparative advantage (Baulch, 1997b). Market integration measures
also served as a tool to assess the degree in which markets are vulnerable to disruptive shocks
(Ravallion, 1986).
The present study attempts to measure the degree of market integration between the
major coffee producer areas of Ethiopia and whether and how this changed after the
establishment of the ECX. It also measures the reaction time of each long-run equilibrium
relation to absorb a system-wide shock. We use a persistence profile that is robust to any
ordering of the variables in the system. This method, developed by Pesaran and Shin (1996), is
characterized by the response of a cointegrating relation to a system-wide, rather than to an
individual, shock. Persistence profiles are unique functions that allow us to quantify the degree
of integration of all locations participating in the same economic market (González-Rivera and
Helfand, 2001).
The remainder of the paper is organized as follows. The next section will provide briefing
on the establishment of the ECX and how it operates. Section 3 describes the methodological
approach used. Section 4 reports on the data sources and econometric methods. Section 5
presents the results and discussions and the last section contains the conclusions.

63
4.2 Background and research approach
Studies on the integration of agricultural commodity markets have either investigated the
integration between central and local agricultural commodity markets or the integration of a set
of regional markets and tested their integration strength (e.g. Awokuse, 2007; Gemech and
Struthers, 2007; Worako et al., 2008; Ghoshray and Ghosh, 2011; Alam et al., 2012). Most
studies on this topic understand the degree of market integration as the degree of integration
between locations that belong to the same market and as the reaction time needed to remove
disequilibria. The measures of reaction time that are most commonly used in the integration
literature are the impulse response functions. An important limitation of these impulse response
functions is that they are not able to differentiate or uniquely identify the relative effects of each
shock when shocks to the system are correlated or occur simultaneously. When differential
spatial prices occur, it is reasonable to expect correlated errors because the time series of prices
are usually highly correlated (González-Rivera and Helfand, 2001). Bivariate correlations have
often been used to test for spatial market integration between different markets (e.g. Jones 1973;
Lele 1972; Stigler and Sherwin, 1985). However, this bivariate approach has been criticized for
having methodological flaws; as it fails to recognize non-stationarity, seasonality, autocorrelation
and heteroscedasticity in price data (Blyn, 1973; Granger and Newbold, 1974; Harriss, 1979;
Ravallion, 1986). To overcome these shortcomings, Delgado (1986) when analyzing grain
market integration, considered the seasonality of the market by controlling the problem of
heteroscedasticity. Following on from Delgado’s work Ravallion (1986) made a significant
progress in the study of spatial market integration by using an error correction model which
allowed him to distinguish between long and short run dynamics and identify seasonal
components within spatial price differentials.
The methodology of Ravaillon (1986) was extended by Palaskas and Harriss (1993) and
Alexander and Wyeth (1994) who developed on the non-stationarity of price series within the
cointegration framework. These studies tested the degree of market integration between central
and local agricultural markets using cointegration and Granger causality ordinary least squares
techniques. This study uses Pesaran et al.’s (2001) cointegration approach and the Toda and
Yamamoto (1995) causality testing procedure. The most widely used approaches as developed
by Engle and Granger (1987), and by Johansen and Juselius (1988), need the variables under
investigation to be integrated of order one. The Johansen and Julius approach cannot easily be
applied to small samples and requires a certain degree of pre-testing which introduces yet

64
another degree of uncertainty into the analysis (Pesaran et al., 2001). The Pesaran cointegrating
test procedure overcomes these problems.
The integration of the markets studied in this paper is particular in that the different spatial
markets do not directly trade with each other. This is different from searching for integration
based on the transaction costs associated with the movement of goods between markets (see
e.g. Stephens et al., 2012). If all locations are isolated at time t then the prices established in
the markets are autarkic. Yet, markets are unlikely to be isolated. Fackler and Goodwin (2001)
described spatial price determination using a point-location model. In this approach,
geographically separated locations are represented by points and these locations are connected
by a set of transportation routes. With constant per unit costs of commerce, any price change in
one market attributable to a local demand or supply shock should generate an equal price
change in the other market through a third common market, even if the two markets are not
trading with one another. This led Fackler and Tastan (2008) to argue that two produce markets
could integrate without direct trade if both markets were trading with a third market. Since
spatially separated producer markets incur transaction costs (mainly transport costs) the core
element in establishing their spatial integration is the performance of the central market which
the two producer markets trade with in transmitting the demand from the export market through
the dissemination of market information and marketing facilities. On the supply side, the central
market needs to be able to link the coffee supply from the respective production areas with
market demand. As such, the performance of the third market in regulating the supply and
demand of the spatial producer markets’ prices is the key to establishing spatial integration.
The Ethiopian Commodity Exchange is structured in a way that prevents spatially
separated markets from engaging in direct trade. The restriction also existed between 1998 and
2008. Ethiopia is one of the largest coffee exporting countries in the world and known for its
coffees of origin, so keeping these coffee types separate is an important strategic choice
(Ethiopian coffee is exported and sold as several different types including Harar, Yirgacheffe,
Sidama, Wollega, Jimma and Kaffa). The regional ECX coffee markets established in the major
coffee production areas are equipped with a basic marketing infrastructure (e.g. warehouses
and notice boards announcing price information) and these regional coffee markets are centrally
integrated with the Addis Ababa market, the common market for all the regional markets. The
central market also disseminates information on the prices the coffees fetch on the export
markets. In this manner information exchange among suppliers, can lead to price adjustments

65
even if there is no direct trade between the markets. This inspired us to investigate how important
integration between these markets was between 1998 and 2008 (pre-ECX) and between 2008
and 2013 (post ECX).
The Ethiopian coffee market was studied by Dercon (1995) who analyzed the impact of
liberalization on market integration and argued that market liberalization should not be solely
evaluated on the basis of what happens to the price levels for consumers and producers, but
should also consider the functioning of markets. He also stressed that a market integration
analysis should assess the speed of price transmission changes from the main market to the
peripheral markets. Negassa (1998) showed that Ethiopian grain markets exhibited a high
degree of vertical and spatial integration. Tamru (2006) tested the impact of infrastructural
improvements on the degree of market integration in selected regional grain markets and
concluded that areas with a grain deficit were isolated from the central market while those with
a surplus were well integrated, both before and after the infrastructural improvements. The issue
of market integration in Ethiopia was also investigated by Getnet et al. (2005) and Getnet (2008)
using the ARDL approach. In their 2005 paper, they studied spatial price transmission in
Ethiopian grain markets, and found a non-spurious long-run relationship between producer and
wholesale prices. They also found that the producer price is determined by the wholesale price
in both the short and long term. In the 2008 paper Getnet used an ARDL approach to analyze
the spatial equilibrium of Ethiopian wheat markets in the post liberalization period. The
relationship they found between the central wholesale and local market provided evidence of
market integration. The study also suggested that interventions at the central (Addis Ababa)
market would be more effective in shaping price dynamics as interventions at the local level are
costly.
More recently, Worako et al. (2008) worked on cointegration and tested the non-linearity
in the coffee markets. They measured whether the deregulation of the Ethiopian coffee industry
since 1992 has improved long and short-run price relationships and price transmission between
spatially integrated markets. The study evaluated the spatial integration between five selected
pairs of producer coffee markets and found that three of these pairs (closely located to each
other) showed clear short-run price dynamics and integration, while the other, more distant pairs
showed a weak interrelationship. The study also showed that transport, information, and other
transaction costs were the major limiting factors for the integration of distant producer coffee
markets.

66
The present study extends the literature on this topic, making at least two contributions.
First the study investigates how spatially distant producer markets are integrated, even in the
absence of direct trade between regional coffee markets. In this regard, all the studies that have
investigated spatial integration without direct trade considered transaction costs as the reason
for the lack of trade between spatial markets (Fackler and Goodwin, 2001; Stephens et al.,
2012). This study is the first of its kind to explore price integration between markets that do not
trade with each other due to a policy restriction imposed by the government. Secondly, the
studies on the integration of Ethiopian coffee markets (Negewo, 1993; IFPRI, 2003; Worako et
al., 2010) investigated the impact of market reform in the 1990s. To our knowledge there have
been no comprehensive studies examining the impact of the establishment of the ECX on
market integration.
4.3 Data sources
The data used for the study are the average monthly producer coffee prices series from the
period between January 1998 and May 2013. Monthly price data for producers were collected
from Central Statistical Agency (CSA) through the monthly Ethiopian Rural Agricultural Price
Survey reports. The series are divided into two subseries; December 2008 is taken as the
dividing point as this is when coffee trade through the ECX started. The observations from
January 1998 to November 2008 are considered pre-ECX, while the post-ECX sub-series runs
from December 2008 to June 2013. The price data in both periods are nominal values and are
measured in Birr per kg (the local currency). The major coffee producing areas considered for
this study are Kaffa, Wollega, Sidama, Yirgacheffe, Jimma, and Harar (Figure 1.2).
4.4 Econometric analysis
4.4.1 The bounds test approach to cointegration
We use the bounds testing approach to cointegration in the Autoregressive Distributed Lag
(ARDL) framework developed by Pesaran et al. (2001). This approach is explained in chapter
three section 3.4.2.
4.4.2 The Toda–Yamamoto approach to the Granger causality test
To further examine the role of the ECX in the domestic coffee market, we use Toda and
Yamamoto’s (TY) (1995) methodology of bivariate systems to test the causality relationship of

67
one coffee producer market price predicting the other coffee producer market prices. The TY
approach has the advantage of avoiding problems related to the non-stationary of the price
series while testing for price causality and fitting a standard Vector Autoregression (VAR) model
in the levels of the variables, which reduces the possibilities of incorrectly identifying the orders
of integration of the series, or the presence of cointegration (Giles and Mizra, 1998; Mavrotas
and Kelly, 2001). Toda and Yamamoto (1995) have shown that the conventional F-statistics of
the Granger non-causality test are not valid as the test does not have a standard distribution.
Accordingly, our study employs a Modified Wald (MWALD) procedure to test for restrictions on
the parameters of the VAR(p) model. Under this approach the test follows an asymptotic chi-
squared distribution with p degrees of freedom to estimate the VAR [w + dmax] with dmax being
the maximum order of integration.
The empirical implementation of the TY approach involves three steps. The first step
consists of determining the maximum order of integration (dmax). The second step is to
determine the optimal lag length (w). Since this not known in the time series, it has to be obtained
by using the different lag length criteria in the levels. In the third stage, a VAR (w) model for
causality is estimated using the modified Wald-technique. In the present study, TY Granger non-
causality test is performed using the following VAR model:
𝑃𝑛𝑡 = 𝜕0 + ∑ 𝜕1𝑗
𝑤
𝑗=1
𝑃𝑛𝑡−𝑗 + ∑ 𝜕2𝑖
𝑑𝑚𝑎𝑥
𝑖=𝑤+1
𝑃𝑛𝑡−𝑖 + ∑ 𝜑1𝑗
𝑤
𝑗=1
𝑃𝑚𝑡−𝑗 + ∑ 𝜑2𝑗
𝑑𝑚𝑎𝑥
𝑖=𝑤+1
𝑃𝑚𝑡−𝑖 + ℧𝑙𝑡 Eq. 1
Where from Eq. 1, Granger causality from market m to n implies φ1j≠0 ∀j.
4.5 Persistence profile
The persistence profile technique developed by Pesaran and Shin (1996) is employed to model
the time profile of the response of the cointegrating relation 𝑉𝑥 = β’Yx to system-wide shocks. A
system-wide shock is analyzed via a draw from a multivariate distribution of the vector. The
study analyzes the propagation through time (x+1, x+2) of the variance of the shock, based on
information available at time x-1. Hence, with the market policy reform in the spatial coffee
market at time x, observing the market information at time x-1, the persistence profile analysis
emphasizes the additional variance of the disequilibrium error from time x+1 to x+p. Pesaran
and Shin (1996) define a persistence profile as:

68
𝐻𝑣(𝑝) = Var(𝑉𝑥+𝑝|𝑥−1) − Var(𝑉𝑥+𝑝−1|𝑥−1) 𝑝 = 0, 1, 2, … Eq. 2
Where, x-1 is the information set at time x-1, Var(𝑉𝑥+𝑝−1|𝑥−1) is the variance of Vx+p conditioned
by the information set, Vx+p is the time profile of the response, and p is the time limit. The
persistence profile is the change in the variance of the 𝑉𝑥+𝑝forecast, compared to the variance
of 𝑉𝑥+𝑝−1 forecast, based on the information set x-1. In a stationary equilibrium, a shock will
eventually diminish. This suggests that its additional variance becomes smaller over time and
nears zero as time goes towards infinity. The examination of the speed with which the
incremental variance approaches zero indicates how long it will take the system to return to the
long-run equilibrium after a shock (Pesaran and Shin, 1996). This is defined as
ℎ𝑣(𝑝) = 𝐺𝐻𝑣(𝑝)𝐺 = {ℎ𝑖𝑗(𝑝)} 𝑝 = 0, 1, 2 … .. Eq. 3
Upon impact, at time p = 0, the matrix G represents a suitable scaling matrix, the profile ℎ𝑖𝑗(𝑝) =
1 for 𝑖 = 1, 2 … . . , p − 1.
4.6 Empirical results
This paper attempts to establish the long-run relationship, the causal relationship and the degree
of integration between the spatial coffee producer markets and does this in four steps. First, the
ARDL approach (Pesaran et al. 2001) is used to test cointegration. Second, the study compares
the cointegration of the price series before and after the ECX was established, defining two price
series (before and after ECX). Third, the Toda and Yamamoto (1995) Granger non-causality
technique is used to observe the price causality between the six producer markets. Unlike other
causality tests, this procedure is valid irrespective of the level of integration. Fourth, to test the
time profile of the response of the cointegrating relation to system-wide shocks, the study uses
the persistence profile technique developed by Pesaran and Shin (1996).
4.6.1 Stationary analysis
Figures 4.1 and 4.2 show the price evolution of the distinct coffee producers’ market prices,
before (1998-2008) and after (2008-2013) the establishment of the ECX. Harar coffee, which is
considered to be of the superior quality, commands a premium on the Ethiopia coffee market.
The figures show that coffee prices became more volatile after 2006.
Before proceeding with the ARDL bounds tests, we had to ensure that none of the
variables under consideration were integrated to an order higher than one. In case of an higher

69
order of integration (I(2) or higher), the computed statistics provided by Pesaran et al. (2001)
and Narayan (2005) are not valid (Ang, 2007). Hence, it is necessary to test for unit roots to
make sure that the variables included in the study obey the assumptions of the ARDL bounds
testing approach of cointegration. Table 4.1 shows the results of an Augmented Dickey-Fuller
(ADF) test for the two price series. The unit root test was performed at level and at first difference
with the intercept, and with the intercept and trend term. The optimum lag was selected using
the Schwartz Information Criterion (SIC). Based on the critical values reported, some price
series appear to be non-stationary in the levels, while others are stationary in the levels both pre
and post ECX. No series had an integration order of I(2) or more.
Figure 4.1 Price paid to producers for coffee 1998-2008 (USD/kg)
0.00
0.50
1.00
1.50
2.00
2.50
3.00
3.50
4.00
Jan
-98
Jun
-98
No
v-9
8
Ap
r-9
9
Sep
-99
Feb
-00
Jul-
00
Dec
-00
May
-01
Oct
-01
Mar
-02
Au
g-0
2
Jan
-03
Jun
-03
No
v-0
3
Ap
r-0
4
Sep
-04
Feb
-05
Jul-
05
Dec
-05
May
-06
Oct
-06
Mar
-07
Au
g-0
7
Jan
-08
Jun
-08
No
v-0
8
USD
/kg
Year and months
HARAR JIMMA KAFFA SIDAMA WELLEGA YIRGACHEFE

70
Figure 4.2 Price paid to producers for coffee 2008-2013 (USD/kg)
Table 4.1 Unit root test result
Notes: ***, **, and *, indicate statistical significance at 1%, 5% and 10% respectively
4.6.2 ARDL bounds tests for cointegration
The first step in the ARDL bounds test is to estimate the presence of a long-run relation among
coffee price series, yet before that it is important to ascertain the appropriate lag length is chosen
0.00
0.50
1.00
1.50
2.00
2.50
3.00
3.50
4.00
No
v-0
8
Jan
-09
Mar
-09
May
-09
Jul-
09
Sep
-09
No
v-0
9
Jan
-10
Mar
-10
May
-10
Jul-
10
Sep
-10
No
v-1
0
Jan
-11
Mar
-11
May
-11
Jul-
11
Sep
-11
No
v-1
1
Jan
-12
Mar
-12
May
-12
Jul-
12
Sep
-12
No
v-1
2
Jan
-13
Mar
-13
May
-13
USD
/kg
Year and months
HARAR JIMMA KAFFA SIDAMA WELLEGA YIRGACHEFE
Period 1998 – 2008 Period 2008 -2013
Variable (Price)
At level/ First difference
ADF statistics Order of integration
ADF statistics Order of integration
τc τc,t τc τc,t
Harar Level -1.84 -4.42*** I(1) -4.83*** -4.84*** I(0)
Difference -9.8*** -9.96*** - -
Kaffa Level -3.25** -3.73** I(0) -3.74*** -4.39*** I(0)
Difference - - - -
Sidama Level -4.17*** -5.48*** I(0) -2.1 -3.44* I(1)
Difference - - -7.28*** -7.21***
Wollega Level -3.65*** -5.58*** I(0) -2.53 -3.48* I(1) Difference - - -7.8*** -7.73***
Yirgacheffe Level -1.02 -3.08 I(1) -2.0 -3.4* I(1)
Difference -9.56*** -9.58*** -7.86*** -7.79***
Jimma Level -1.20 -2.64 I(1) -2.30 -3.31* I(1)
Difference -9.82*** -9.85*** -6.3*** -6.24***

71
as the model is sensitive to any variations in lag order. The lag order should be high enough to
reduce the consequences of residual serial correlation but low enough for the conditional Error
Correction Model to not be subject to problems with over-parameterization (Pesaran et al., 2001;
Narayan, 2005; Ang, 2007). We used the Akaike Information Criterion (AIC) and Schwarz’s
Bayesian Criterion (SBC) to select the optimal lag order and carried out misspecification tests
including tests for autocorrelation and stability. Based on selection criteria results the optimal
lag lengths were different for most market pairs. The absence of any residual serial correlation
suggests that we selected the correct lag order. Since there were thirty pairs of producer
markets, the optimal lag lengths are not presented here but can be provided upon request.
The hypothesis of the ARDL bounds testing is the null of no long-run relationship between
a pair of coffee producer market prices against the alternative of the existence of cointegration.
Table 4.2 shows the cointegration results. Pesaran et al. (2001) critical bounds are used to take
decisions as to whether cointegration exists or not. For both 1998-2008 and 2008- 2013 periods,
twenty one out of the thirty pairs of producer markets were found to be cointegrated in the long
run. Of the pairs in the post ECX period Harar and Sidama tended to move together with all the
markets. While in the pre ECX period Wollega and Sidama established a cointegration with all
the markets.
While interpreting the results on cointegration before 2008 it is important to keep in mind
that prior to the establishment of the ECX, the government sought to trade different coffee types,
each with its assured quality. Almost all the coffees from all the production areas were supplied
to the central market for auction. However, a significant volume of coffee was adulterated by
mixing high quality coffees with low quality ones. Coffee markets that were located close to each
other received similar prices even if they had different quality coffees. Furthermore, the locations
of the warehouses in the central market made it possible for suppliers to manipulate the trading
activities of the auction center by reaching informal agreements with the exporters (ECX, 2008).
For all these reasons, the coffee markets were easily manipulated and artificially integrated
markets were created. After 2008 (with the ECX) we explain possible market integration through
all regional coffee markets trading with the common central market and a more intensive
dissemination of price information throughout the different producer regions. Table 4.2 gives the
long-run coefficients of the market pairs that established a long-run relationship. The results for
both pre and post-ECX periods are based on significance levels of up to 10%.

72
Generally, the south-western producer markets, Jimma, Kaffa and Wollega show a similar
degree of market integration in the pre and post-ECX periods. Looking in more detail at these
markets, the one in Jimma possessed a higher degree of market integration in the pre-ECX
period than Wollega and Kaffa and the market in Wollega was more integrated in the post-ECX
period. Another interesting observation is the market at Sidama is integrated with those at
Wollega and Kaffa. The degree of market integration stimulated in the Sidama producer market
declined in post-ECX period. Overall however, these results provide evidence of higher levels
of regional integration in the post-ECX period.
Despite a similar degree of market integration between Sidama and Yirgacheffe in the
two periods, a slight difference between the two periods can be observed. The degree of market
integration initiated by Sidama coffee was higher in the pre-ECX than in the post-ECX period.
By contrast, the market integration of Yirgacheffe was higher in the post-ECX period. Unit price
changes in the Yirgacheffe, Sidama and Jimma producer markets had more effect on prices in
the Harar producer market in the pre-ECX period than in the post-ECX period. Finally, a unit
price change in the Harar producer market price led to a small positive change on the Sidama
and Kaffa producer markets in the pre-ECX period but small negative change in the post-ECX
period. These results more or less testify that higher quality coffee markets initiate higher degree
of market integration to their respective producer markets.
While looking at the market integration for the period between 2008 and 2013, producer
prices at Sidama and Yirgacheffe seem to respond to price changes at each other and tend to
move in tandem. The long run coefficients (0.88 & 0.98) show, a price change in one of the
market stimulates the other to a similar extent. However, neither of these markets is price
leaders: rather
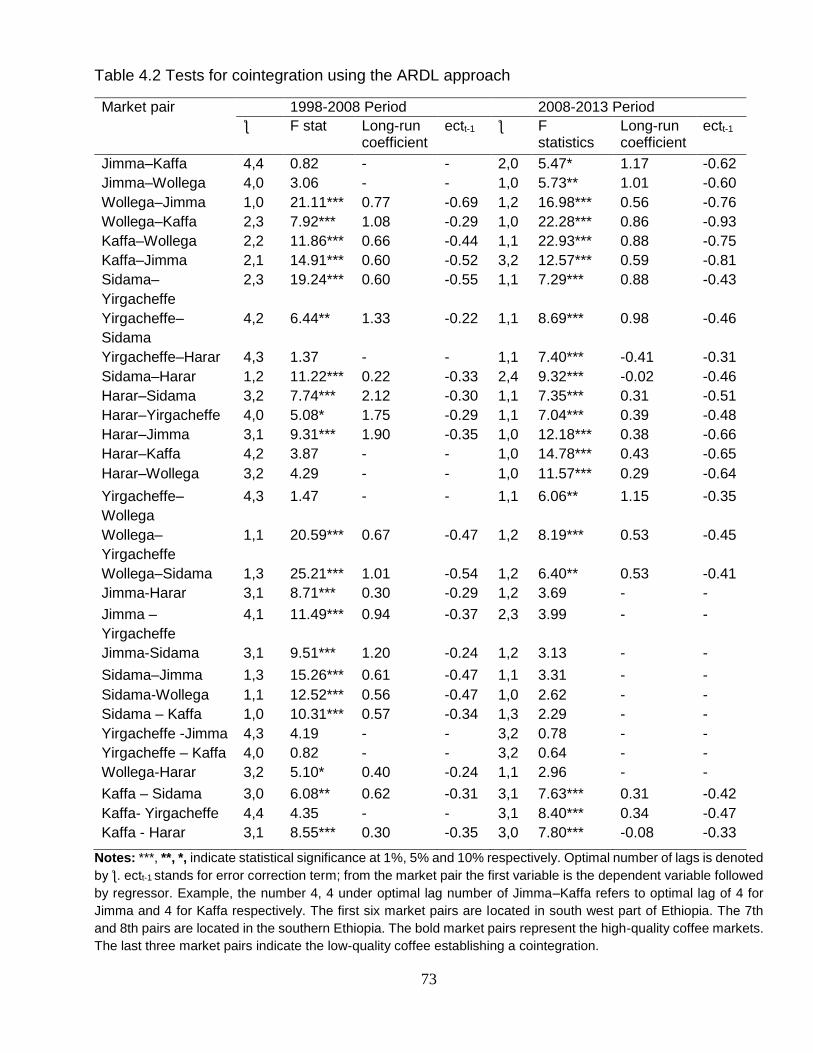
73
Table 4.2 Tests for cointegration using the ARDL approach
Notes: ***, **, *, indicate statistical significance at 1%, 5% and 10% respectively. Optimal number of lags is denoted
by ƪ. ectt-1 stands for error correction term; from the market pair the first variable is the dependent variable followed
by regressor. Example, the number 4, 4 under optimal lag number of Jimma–Kaffa refers to optimal lag of 4 for
Jimma and 4 for Kaffa respectively. The first six market pairs are located in south west part of Ethiopia. The 7th
and 8th pairs are located in the southern Ethiopia. The bold market pairs represent the high-quality coffee markets.
The last three market pairs indicate the low-quality coffee establishing a cointegration.
Market pair 1998-2008 Period 2008-2013 Period
ƪ F stat
Long-run coefficient
ectt-1 ƪ F statistics
Long-run coefficient
ectt-1
Jimma–Kaffa 4,4 0.82 - - 2,0 5.47* 1.17 -0.62
Jimma–Wollega 4,0 3.06 - - 1,0 5.73** 1.01 -0.60
Wollega–Jimma 1,0 21.11*** 0.77 -0.69 1,2 16.98*** 0.56 -0.76
Wollega–Kaffa 2,3 7.92*** 1.08 -0.29 1,0 22.28*** 0.86 -0.93
Kaffa–Wollega 2,2 11.86*** 0.66 -0.44 1,1 22.93*** 0.88 -0.75
Kaffa–Jimma 2,1 14.91*** 0.60 -0.52 3,2 12.57*** 0.59 -0.81
Sidama–
Yirgacheffe
2,3 19.24*** 0.60 -0.55 1,1 7.29*** 0.88 -0.43
Yirgacheffe–
Sidama
4,2 6.44** 1.33 -0.22 1,1 8.69*** 0.98 -0.46
Yirgacheffe–Harar 4,3 1.37 - - 1,1 7.40*** -0.41 -0.31
Sidama–Harar 1,2 11.22*** 0.22 -0.33 2,4 9.32*** -0.02 -0.46
Harar–Sidama 3,2 7.74*** 2.12 -0.30 1,1 7.35*** 0.31 -0.51
Harar–Yirgacheffe 4,0 5.08* 1.75 -0.29 1,1 7.04*** 0.39 -0.48
Harar–Jimma 3,1 9.31*** 1.90 -0.35 1,0 12.18*** 0.38 -0.66
Harar–Kaffa 4,2 3.87 - - 1,0 14.78*** 0.43 -0.65
Harar–Wollega 3,2 4.29 - - 1,0 11.57*** 0.29 -0.64
Yirgacheffe–
Wollega
4,3 1.47 - - 1,1 6.06** 1.15 -0.35
Wollega–
Yirgacheffe
1,1 20.59*** 0.67 -0.47 1,2 8.19*** 0.53 -0.45
Wollega–Sidama 1,3 25.21*** 1.01 -0.54 1,2 6.40** 0.53 -0.41
Jimma-Harar 3,1 8.71*** 0.30 -0.29 1,2 3.69 - -
Jimma –
Yirgacheffe
4,1 11.49*** 0.94 -0.37 2,3 3.99 - -
Jimma-Sidama 3,1 9.51*** 1.20 -0.24 1,2 3.13 - -
Sidama–Jimma 1,3 15.26*** 0.61 -0.47 1,1 3.31 - -
Sidama-Wollega 1,1 12.52*** 0.56 -0.47 1,0 2.62 - -
Sidama – Kaffa 1,0 10.31*** 0.57 -0.34 1,3 2.29 - -
Yirgacheffe -Jimma 4,3 4.19 - - 3,2 0.78 - -
Yirgacheffe – Kaffa 4,0 0.82 - - 3,2 0.64 - -
Wollega-Harar 3,2 5.10* 0.40 -0.24 1,1 2.96 - -
Kaffa – Sidama 3,0 6.08** 0.62 -0.31 3,1 7.63*** 0.31 -0.42
Kaffa- Yirgacheffe 4,4 4.35 - - 3,1 8.40*** 0.34 -0.47
Kaffa - Harar 3,1 8.55*** 0.30 -0.35 3,0 7.80*** -0.08 -0.33

74
they exhibit bi-directional causality. This is because both are premium coffees grown in
neighboring areas. This finding suggests that there is a good exchange of information about
prices between them. They also have access to relatively good road networks and
communications services. The speed of adjustment of Sidama coffee prices to changes in
Yirgacheffe (43%) and of Yirgacheffe to changes in the price at Sidama (46%), to deviations
from the long-run price levels occurred in less than three months.
The Jimma and Wollega coffee production areas are located next to each other in the
southwestern part of the country. One would expect a strong flow of information between the
two markets and this would contribute for the quick adjustment of prices on both market prices
to deviations from their long-run equilibrium. The long run estimate coefficient between Jimma
and Wollega shows that a 1 birr increase in the Wollega price leads to a 1.01 birr increase in the
Jimma coffee price, but the same change in Wollega stimulates a lower increase (0.56 birr) in
Jimma. This is consistent with Wollega coffee having a substantially higher quality than Jimma
coffee. The speeds of adjustment in regaining equilibrium between these two markets are fast
and significant (60% and 76%). Kaffa is also located in the same area as Jimma and Wollega.
Because there are strong flows of information between these districts, they have established
long-run price movements with each other and act as a regional market.
The cointegration test results show that producer markets with low coffee quality were
able to establish a long-run relationship with the markets of high-quality coffee between 2008
and 2013. For example, Kaffa and Jimma induced a long-run relationship with the Harar coffee
market. Most importantly, during this period Harar coffee producing areas were more
differentiated than before, with some more noticeably establishing themselves as price leaders
and establishing a long-run relationship in the market. After the establishment of the ECX low-
quality coffee areas clearly became price followers.
4.6.3 Toda and Yamamoto causality test results
Toda-Yamamoto causality tests were employed in order to determine whether there are any
causal relationships in prices among cointegrated markets and to explore the direction of
causality in bivariate systems. This test uses a modified Wald (MWALD) test which can be
applied irrespective of whether the underlying variables are I(0) or I(1). The first step towards
determining the maximum order of integration for a price series is to apply MWALD tests. As
depicted in Table 4.1, the unit root test results for the price series show that the maximum order

75
of integration is one I(1) therefore dmax is one for both the time series analyzed. The Akaike
Information Criterion and Schwarz Bayesian Criterion were used to select the optimal lag length.
The sum of the optimal lag length (p) and maximum of integration (dmax) was used by Toda and
Yamamoto (1995) to determine the order of the estimated VAR system (k) to empirically specify
the Var (k = p + dmax) model. After estimating the model the MWALD test was conducted to
examine the causality of the relationships among the producer market prices.
Table 4.3 reports the chi-squared test statistic results together with the estimated p-
values for the periods under consideration. The p-values of the MWALD statistics suggest that
there was causality for all the market pairs in the both periods (1998-2008 and 2008-2013). In
the pre- ECX period, thirteen market pairs (out of the fifteen we studied) exhibited a uni-
directional price relationship, and just two established a bi-directional price relationship. During
this period, Yirgacheffe, Harar and Wollega were the main price leaders influencing prices on
most of the producer markets.
One of the main reasons for establishing the ECX was to create a transparent market
between the producers’ markets located in different areas so that they would all be integrated
with each other. To achieve this, the ECX established infrastructure and means of
communications in the major producing area to provide daily information on domestic and world
coffee prices. This has enabled all the producer markets to have daily access to coffee prices in
the hope that they would follow a similar price setting strategy. There was a bidirectional
feedback relationship between the Wollega market price and those at Jimma and Kaffa. This
indicates that the price in either market (Wollega or the other two) reacts to simultaneous shocks
from its long-run equilibrium path in the others. While the southwestern coffee markets (Jimma,
Wollega and Kaffa) are located far away from Harar (on average 840 km), a price feedback
relationship was also established between these markets in both periods.

76
Table 4.3 Granger non –causality test results
Hypothesis 1998-2008 Period 2008-2013 Period causality causality
Kaffa -Wollega 4.89 13.64 27.7 26.7 (0.17) (0.00) W →K (0.00) (0.00) K↔W Jimma- Wollega 0.91 8.63 37.0 12.6 (0.33) (0.00) W→J (0.00) (0.08) J↔W Jimma-Kaffa 2.75 0.59 2.18 4.41 (0.09) (0.43) J→K (0.13) (0.03) K→J Sidama- Yirgacheffe 3.12 7.2 0.005 5.02 (0.2) (0.02) Y→S (0.93) (0.02) Y→S Harar-Sidama 5.59 2.66 8.4 0.87 (0.06) (0.26) H→S (0.00) (0.34) H→S Harar -Yirgacheffe 2.07 2.72 9.27 0.96 (0.14) (0.09) Y →H (0.00) (0.32) H→Y Harar-Jimma 3.73 0.80 2.40 9.62 (0.05) (0.36) H→J (0.49) (0.02) J→H Harar-Kaffa 5.42 1.81 2.46 9.67 (0.01) (0.71) H→K (0.29) (0.00) K→H Harar-Wollega 7.25 2.40 6.4 1.0 (0.00) (0.12) H→W (0.09) (0.8) H→W Wollega -Yirgacheffe 10.3 15.1
0.88 4.53
(0.00) (0.00) W→Y (0.3) (0.03) Y→ W Jimma -Yirgacheffe 5.78 6.33 0.43 2.72 (0.01) (0.01) Y↔J (0.50) (0.09) Y→ J Jimma -Sidama 0.47 8.17 0.05 3.34 (0.49) (0.00) S→J (0.8) (0.06) S→J Sidama- Wollega 5.05 3.36 7.80 0.17 (0.02) (0.06) W↔S (0.00) (0.67) S→W Kaffa -Sidama 3.92 0.27 8.24 2.05 (0.04) (0.59) K→S (0.01) (0.35) K→S Kaffa -Yirgacheffe 2.28 3.38 11.29 1.04 (0.13) (0.06) Y→ K (0.01) (0.78) K→Y
Note: The value reported is Chi-sq.stat and p-value is represented in parentheses. The first three market pairs are located in south west part of Ethiopia. The 4th pair is located in the southern Ethiopia. The bold market pairs represent the high-quality coffee markets. The last two market pairs indicate the low-quality coffee.
4.7 The persistence profiles test
Figure 4.4 shows the persistence profiles for the selected pairs of markets. These graphs show
the estimated reaction time for each of the eight long-run equilibrium relations to absorb system
wide-shocks. The figure shows the profiles over a 55 months’ horizon for: Harar-Jimma; Jimma–
Wollega; Kaffa-Wollega; Kaffa–Harar; Sidama-Yirgacheffe; Sidama–Wollega; Wollega–Harar.

77
The results indicate that disequilibria between most market pairs regained equilibrium quite
quickly, usually in less than 5 months. The only market pair which took six months to reestablish
after a long-run disequilibrium was Sidama and Yirgacheffe.
Sidama – Wollega: 5 months
Wollega – Harar: 4 months
Jimma –Wollega: 3 months
Kaffa-Wollega: 4 months
S
yst
em w
ide
shock
S
yst
em w
ide
shock
S
yst
em w
ide
shock
S
yst
em w
ide
shock
Months Months
Months Months
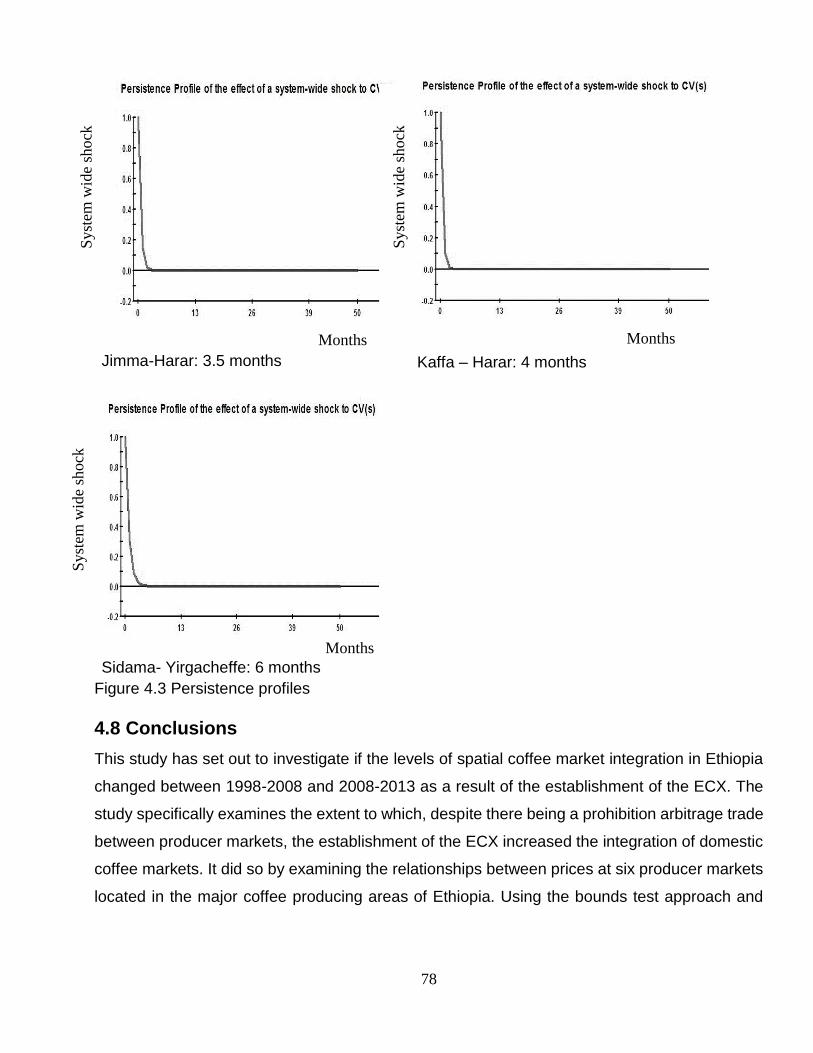
78
Jimma-Harar: 3.5 months
Kaffa – Harar: 4 months
Sidama- Yirgacheffe: 6 months
Figure 4.3 Persistence profiles
4.8 Conclusions
This study has set out to investigate if the levels of spatial coffee market integration in Ethiopia
changed between 1998-2008 and 2008-2013 as a result of the establishment of the ECX. The
study specifically examines the extent to which, despite there being a prohibition arbitrage trade
between producer markets, the establishment of the ECX increased the integration of domestic
coffee markets. It did so by examining the relationships between prices at six producer markets
located in the major coffee producing areas of Ethiopia. Using the bounds test approach and
S
yst
em w
ide
shock
S
yst
em w
ide
shock
Syst
em w
ide
shock
Months Months
Months

79
Toda–Yamamoto Granger non-causality test, the study estimated the long-run cointegration and
granger causality between the six major coffee markets.
The results from the ARDL model show that we cannot reject the null hypothesis that
there is no long-run relationship for 21 (out of 30) pairs of price series. Further, the results
suggest that between 2008 and 2013, the trend was more to the regional integration of producer
markets rather than to national harmonization, with the producer markets in southern and
southwestern Ethiopia generally being the more integrated. The second finding is that an
opportunity has been created for Kaffa coffee producing markets to establish themselves in the
market. They have established a long-run but limited integration with the higher coffee quality
markets. However, the market is dominated by the high-quality coffee producing markets which
are traded in internationally reputable brand names. The acquisition of brand names in the
international coffee market can have a causality on the dominance of the coffees at the domestic
coffee market. As such, this study suggests that efforts to enhance the quality of the coffee
produced in different regions of the country would not only enhance spatial market integration
but also foster national market integration. There was no visible difference in the price causality
results over the two periods. During the first period (1998-2008), all fifteen pairs of producer
markets established a causality with their respective markets. Whereas during the second period
(2008-2013), there is also for most market pairs a unidirectional granger causality and for some
a bidirectional Granger causality. The direct of the unidirectional causality is not stable over the
periods suggesting that the causality could also be bidirectional.
It is important to acknowledge that the study did not account for other factors that may
have influenced price cointegration during the periods under study. The improved flows of
information may also have resulted from an increased use of mobile phones. It is likely that such
improved lines of communication amplified the impact of the ECX information services, however
it was not possible to quantify this effect because of a lack of data. This may be an area for
future research.
The major policy implication of this chapter is that, from 2008 onwards, quality started to
take over the market and now increasingly commands the integration of markets. To strengthen
the price causality between distant producer markets, it is crucial to enhance the supply of quality
coffee from producers. We argue that it will more crucial to reinforce the ECX and its supporting
institutions to engage in quality improvement programmes to harmonize the coffee producer
markets.

80
Chapter 5
Market integration and price transmission under institutionalised
Ethiopian coffee market: Evidence from nonlinear ARDL model
Abstract
In this chapter, market integration and price transmission along the Ethiopian coffee value chain
after the introduction of the ECX is investigated. The empirical analysis applies a nonlinear
ARDL cointegration methodology as developed by Shin, Yu, and Greenwood-Nimmo (2011).
This model allows for more flexible prices and the establishment of asymmetric relationships
both in the long- and short-run. The study aims to examine price dynamics for five Ethiopian
coffee varieties at three levels, namely producer-ECX, producer-exporter, and ECX-exporter.
The overall results for all three levels illustrate the limited capability of the ECX in creating an
integrated and transparent market along the Ethiopian coffee value chain. The results also
confirm that exporters enjoy an advantage over coffee producers. Furthermore, the evidence of
price asymmetry between the producer-exporter prices for quality Ethiopian coffees could be
explained by the different markets in which these coffees are traded.
Keywords: Ethiopian coffee, NARDL Cointegration, Asymmetric price transmission, Ethiopian
Commodity Exchange
Based on: Demise, T., Natanelov, V., D'Haese, M. Empirical Investigation into Spatial Integration Without
Direct Trade. Market integration and price transmission under institutionalized Ethiopian coffee market:
Evidence from Nonlinear ARDL model. (Under review)

81
5.1 Introduction
Most developing countries have been through several economic reforms over the past three to
four decades. These reforms have sought to remove price controls at all levels of the commodity
market by liberalising trade, and privatising the government-owned agricultural enterprises. The
reforms in the agricultural sector have aimed to empower producers and subsequently, enhance
trade efficiency (White and Leavy, 2001). These reforms were often geared towards markets of
primary agricultural commodities such as coffee, cocoa, and cotton, due to the crucial role that
these commodities play in the economies of the producing countries. For example, in Ethiopia,
more than 15 million people have a direct or indirect link to coffee production (ECEA, 2013).
In the early 1990s, the Ethiopian government, under pressure from the World Bank and
the international monetary fund (IMF), implemented a Structural Adjustment Programme (SAP).
This programme was geared towards market liberalisation, with the objectives of reducing
producer price variability, protecting producers from exploitation by private middlemen and
possible monopolistic practices, abolishing marketing boards, and allowing private agents to
operate as traders and exporters (Worako et al., 2008). Moreover, it was hypothesised that the
integration of the producers with the auction and the export market would improve the
transmission of international coffee prices to domestic coffee markets, and subsequently to
domestic growers. In turn, this was expected to improve coffee supply and quality. However,
various studies (Gabre-Madhin and Goggin, 2005; ECX, 2008; Alemu and Worako, 2011) have
shown that, like most developing countries, policy interventions in the Ethiopian agriculture
sector did not deliver on what was expected of them.
Market integration studies have been particularly useful in forecasting the impact of
interventions on price changes within and between markets (Abdulai, 2007). In theory, when
price adjustments are not efficiently conveyed to producers, market intermediaries benefit from
imperfections and from reduced market transparency (Le Goulven, 2001). More specifically, the
ever-widening gap between coffee retail prices in the high-income countries and producer prices
in the coffee-growing countries means that either the producers are not benefiting from
consumer price increases or the consumers are not benefiting from producer price reductions.
Despite the major disappointment in the policy measures for agricultural sectors in most
developing countries, there is previous evidence (Krivonos, 2004; Subervie, 2011; Mofya-
Mukuka and Abdulai, 2013) which suggests that in countries where interventions and reforms
have been implemented successfully, producers have benefited from better price transmission

82
and received a larger share of export prices. As such, market reforms could improve the
bargaining power of producers which would allow them to benefit more from price changes in
the trader and/ or export market. Peltzman (2000), extensively investigated the asymmetric price
transmission in agricultural and food product markets and criticised the standard economic
market theory for ignoring the existence of asymmetric price adjustment. This criticism was too
highlighted by other researchers such as Katrakilidis and Trachanas (2012), Simioni et al.
(2013), and Greenwood-Nimmo and Shin (2013). Furthermore, price asymmetries in agricultural
markets are mostly driven by information asymmetry, market power, adjustment cost, collusion,
and consumer response to changing commodity prices (Jaffry, 2005).
Poor price signals within the different sections of the markets indicate how agricultural
commodity markets are poorly integrated. High transfer costs may also arise as a result of poor
market infrastructure (Rapsomanikis et al., 2003). Particularly in developing countries, poor
infrastructure and communication services contribute towards larger marketing margins. This is
essentially due to the high cost of delivering the locally produced commodity to the export ports,
hindering the transmission of price signals, and thus, preventing arbitrage. The ECX was
established as a means to overcome these marketing challenges for agricultural commodities
and to revolutionise Ethiopian agriculture by creating a dynamic, forward-looking, efficient, and
integrated marketing system.
The ECX was established in 2008 by the Ethiopian government as a market place where
buyers and sellers could meet to trade, while being assured of quality, delivery, and payment.
The ECX aims to facilitate transparency and efficiency through an innovative marketing system,
which should protect the interests of all actors, including farmers, farmer groups, processors,
traders, exporters, aid agencies, input suppliers, industrial buyers, and consumers. Furthermore,
the ECX is particularly unique as its end-to-end integrated marketing system aims to integrate
central trading, warehousing, product grade certification, clearance, delivery, and market
information dissemination (ECX, 2009; Alemu and Meijerink, 2010). It also operates as a trading
platform, using a combination of open outcry (floor) trading and electronic platforms (Paul, 2011).
Although the ECX was established with the aim of creating transparency and
competitiveness at all levels of the coffee market, the expected level of competitiveness at the
local level has not yet been achieved (Minten et al., 2014). This may be due to the structure of
the Ethiopian coffee market, which, like many other agricultural markets, is composed of a large
number of small-scale coffee producers and only a few traders. However, an improved level of

83
competition has been observed on the exporter market. According to Minten et al. (2014), the
number of exporters has increased to 175 in 2012 from 100 in 2008. In addition, the shares of
the largest four (CR4) and eight (CR8) exporters in the coffee market have decreased
significantly during the past year. These findings were, however, refuted by the World Bank
(2014) which showed that the largest exporters (selling more than 5 million USD per annum)
accounted for nearly 80% of coffee exports. The World Bank (2014) argued that the Ethiopian
coffee market is difficult for new entrants to penetrate and now has all the features of an
oligopsonistic10 market.
Price on international markets
Price information
Price information
Price information
Figure 5.1 Critical price information transfers between actors in the coffee supply chain
Note: The arrows refer to price information transfers and not to physical flows of coffee or money
10 A Market characterized by a small number of large buyers who control all purchases
Central ECX market
Price information dissemination
Coffee variety
Harar, Sidama, Yirgacheffe, Wollega,
Jimma
Export market
Concentrated market (CR4 and CR8)
Local ECX market
Located in production
area
Trader
Producer price
Price takers Cooperative
Disseminate daily
coffee price

84
The ECX plays a central role in controlling and directing the Ethiopian coffee market (Figure
5.1; see Chapter 2 for a more detailed review of the coffee chain). Furthermore, the local
producer markets are organised under regional ECX markets in which coffee producers supply
their coffee through cooperatives or traders. The prices offered in the ECX markets influence
the price setting in the producer market. However, the ECX does not have the mandate to set
export prices. Since the ECX follows the international coffee price for price setting, it most likely
influences the price-setting strategy of the exporters.
The Ethiopian coffee production and different coffee markets are highly heterogeneous.
Part of the heterogeneity emanates from the coffee varieties grown in the different regions of
the country (see Chapter 2). Moreover, not only are there differences in the quality of the various
coffee types, there are also differences in infrastructure. Some local producer markets barely
receive any market information. Furthermore, while some markets are connected to all weather
roads, other markets barely have access to any type of road. Therefore, unlike the regular
commodity exchange, the ECX also has the responsibility of improving the basic market
infrastructure at every level of the coffee market where problems result in weak price integration
and transmission between the different market actors (Gabre-Madhin and Goggin, 2005). One
particular area of interest is the flow of price information throughout the chain (Figure 5.1), and
its impact on actual price transmission. Imperfect price integration and transmission results in a
price reduction at the farm level that is only slowly, and possibly not fully, transmitted through
the supply chain (Subrvie, 2011; Mofya-Mukuaa and Abdulai, 2013; Fousekis, 2015). However,
price integration and transmission studies seldom take into account different types and qualities
of coffee, while studies on quality (Otero and Milas, 2001; Ghoshray, 2009) argue that quality is
important in price relationships. This chapter addresses this gap in the literature as it investigates
market integration and price transmission for the five Ethiopian coffee types along the coffee
value chain. Moreover, coffee is Ethiopia’s most important agricultural export product, and the
sector has been subject to frequent policy reform. For this chapter, we consider three different
groups of actors in the chain together with their price relationships for the five coffee varieties.
These three groups include the producer–ECX market, the producer-export market, and ECX-
export markets.

85
5.2 Empirical Literature
Various studies have examined the market integration and price transmission between the
domestic market and the international coffee markets. These studies either compared coffee-
producing countries or focused on a country that had undergone a market reform. Fafchamps
and Hill (2007), used cross-sectional data to examine the transmission of international coffee
prices through the domestic value chain in Uganda. They found that producer price fluctuations
were inconsistent with constant transaction costs, which they assumed to be the result of
significant storage and contango marketing costs. They also found that the heightened price
was due to the entry of new traders which increased search time for quality coffee. Their
empirical tests rejected the storage and marketing costs explanation, but they did find some
evidence of trader entry in response to a rise in export price.
Using an Error Correction Model, Xavier (2011) analysed the impact of policy reforms on
the market integration between international and domestic coffee prices in Colombia, Ghana,
and the Ivory Coast. The findings indicated that the reforms induced stronger relationships
between domestic and international prices in Colombia, but not in Ghana nor in the Ivory Coast.
The researcher explained that these differences between the countries arose as a result of
different domestic institutional arrangements. Li and Saghaian (2013) also used an Error
Correction Model to examine the price relationships between producer and world coffee prices
for Colombian Milds and Vietnamese Robusta coffee, focusing on the long-run integration and
short-run adjustments. They found evidence of long-run relationships between the world price
and the grower price for both Colombian Milds and Vietnamese Robusta. Moreover, they found
an asymmetric short-run price adjustment towards equilibrium for both types of coffee. In
addition, their research results showed a slightly higher degree of market integration for
Colombian Milds than for the Vietnamese Robusta coffee.
Furthermore, the impact of coffee sector reforms on the speed of transmission of price
shocks in the producer prices was studied by Subervie (2011), using a Threshold Cointegration
model. The study investigated the cases of El Salvador, Colombia, and India, and showed that
producer and world prices were closely cointegrated after policy reforms, with an increased
impact of monthly variations in world prices on producer price variations. The results also pointed
to asymmetric price adjustments. The pre-reform period was favourable to producers, since,
after the reform, the positive price adjustments were no longer transferred to the producer level,
subsequently disadvantaging the producers. Moreover, there were only transmissions of

86
decreasing prices during a short period of time. Subervie (2011) also highlighted cases in which
deviations resulting from reductions in world prices were eliminated relatively quickly in the post-
reform period. The Threshold Autoregression Model, as applied by Mofya-Mukuka and Abdulai
(2013) to examine the effects of market liberalisation on coffee price transmission from world
prices to grower prices in Zambia and Tanzania, showed several structural breaks. The results
confirmed that price transmission improved in the case of Zambia where coffee marketing was
fully liberalised, although transmission was asymmetric. This implied that price reductions were
affecting producers to a greater extent than price increases over an identified threshold. In
comparison, the Tanzanian coffee marketing system was not completely liberalised. Negative
shocks from the long-run price equilibrium receded faster before the reform, while positive
shocks receded faster after the reform.
Amongst the studies on Ethiopian coffee market integration and price transmission,
Worako et al. (2008) applied an Error Correction Model to test the impact of liberalisation on
price transmission for Ethiopian coffee between 1993 and 2006. The findings indicated that
market liberalisation induced a long-run relationship between prices at grower, wholesaler, and
exporter levels. The estimation of the models showed that only short-run transmissions from
prices on the world market to the domestic markets improved. In addition, the transmission has
remained weak in the prices between producer-to-auction and auction-to-world markets. The
researchers attributed this to the weak domestic institutional framework coordinating the coffee
market. The study concluded by proposing that negative price changes were transmitted much
faster than positive ones. Alemu and Worako (2009) applied a three-regime Threshold Vector
Error Correction Model to estimate asymmetric transmissions in coffee prices between 1998 and
2006. Their results revealed a unidirectional transmission of shocks from the world price to
auction price, and then to producer price. The results also indicated that producer prices were
less responsive to changes in world prices (positive or negative) than auction prices. They
suggested that the lower responsiveness could be attributed to the increased use of the
domestic market as a major outlet by coffee suppliers at times of lower world prices.
Seyoum (2010) sought to explain the price transmission between the international,
auction, and producer prices in the Ethiopian coffee market between 1991 and 2009 using a
Vector Error Correction model. Similar to Worako et al. (2008), the study found a long-run
cointegration between these three markets. The long-run analysis further showed an equivalent
change in producer prices, following a change in the auction market. Furthermore, only half of

87
the changes from the international price were passed on to the auction and producer markets in
the long run. The model results indicated that the producer and the international markets were
poorly integrated and had very weak relationships to one another as compared to the auction
and the international market. The researcher linked the weak relationship to the lack of market
infrastructure, information asymmetry, and poor transportation systems. More recently,
Hernandez et al. (2015) aimed to investigate whether the ECX has had an impact on the
international-domestic coffee price relationships. Using Multivariate Generalised Autoregressive
Conditional Heteroscedasticity (MGARCH), Dynamic Conditional Correlation (DCC), and Baba-
Engle-Kraft-Kroner (BEKK) models, the researchers concluded that the ECX has had only
limited success in terms of having a positive impact on price dynamics.
The present study expands on the aforementioned literature through two contributions.
Firstly, the study aims to investigate market integration and price transmission along the coffee
value chain for the five types of Ethiopian coffee. All previously mentioned studies (Worako et
al. 2008; Alemu and Worako, 2009; Seyoum, 2010), except for Hernandez et al. (2015), have
examined price transmission against the impact of the 1990’s market reform. However, as far
as can be detected, no previous research has comprehensively studied the integration of and
price transmission for the different Ethiopian coffees by taking the establishment of the ECX as
a point of reference. Secondly, the present study is the first of its kind to implement the Nonlinear
Autoregressive Distributed Lag model (NARDL), as recently developed by Shin et al. (2014), in
studying price symmetry in African agriculture and food markets. The model has the advantage
of examining both nonlinearity and asymmetry simultaneously in the short- and long-run.
5.3 Data Sources and Econometric Methods
5.3.1 Data and sources
The data used for the study consisted of the average monthly coffee producer price series for
the period December 2008 to May 2013. The period between December 2008 and March 2015
was considered for ECX and export coffee prices. The price data for producers were collected
from the Central Statistical Agency (CSA) through the monthly Ethiopian Rural Agricultural Price
Survey reports (also used in chapter 4). The monthly ECX coffee prices were collected from the
Ethiopian Commodity Exchange headquarters in Addis Ababa, while the export coffee prices
were gathered from the Ethiopian customs office (also used in chapter 3). Furthermore, the
monthly exchange rate was obtained from the National Bank of Ethiopia (NBE). For this study,

88
the price data collected from the producer markets located in the different regions of the country
were taken as the producer price. The price data collected from the traders selling their coffee
at the ECX were considered as the ECX price. In addition, the export price is the price received
by the exporters (traders) after selling their coffee. For all three price types, the researcher
collected the data in accordance with the type of coffee, which adds an extra dimension for
further analysis. Finally, the study attempted to collect long-run data for cooperative prices for
the different types of Ethiopian coffees. The data was solicited from the Oromia cooperative
union, however, only data for the period of January 2012 to August 2012 was made available
by the cooperative union. Thus, due to the lack of adequate data, the study made comparisons
between the cooperative and conventional coffee markets for that period only.
All price data were converted into USD per pound (USD/lb), which serves as a standard
unit of price measurement in the international commodity markets. The USD per kg unit of price
measurement is used in the figures to follow in order to aid interpretation. The official monthly
average exchange rate was used to convert producer, ECX, and export prices that were
documented in the local currency (Birr). Finally, all price series were indexed taking the period
December 2008 as a base.
The major coffee types considered for this study were Wollega, Sidama, Yirgacheffe,
Jimma, and Harar (Figure 5.1). As also explained in the previous chapters, coffees produced in
the different regions in Ethiopia are characterised by vast differences in quality amongst the
production areas. The majority of coffee-producing areas are located in the Southern,
Southwestern, and Eastern highlands of Ethiopia. Harar coffee, which comes from Eastern
Ethiopia, is the premium type out of the five coffees considered in this study and thus, it fetches
the highest price in both the domestic and export markets. Yirgacheffe and Sidama coffees,
which are produced in the south of Ethiopia, are the second-best quality and brand coffees.
Jimma and Wollega, which are relatively low quality coffees, are located close to each other in
the south-western part of Ethiopia. However, Wollega coffee is said to be superior to Jimma
coffee.
Kufa (2012) distinguishes between the origins and tastes of the different types of coffee
in the following way: spicy for Sidama, fruity for Wollega, floral for Yirgacheffe, winey for Jimma,
and mocha for Harar. All coffees coming from Harar are unwashed, which is a typical production
method for dry environments. Despite these quality differences, all coffees produced in the
country are quite homogenous and are perfectly substitutable (Worako et al., 2008).
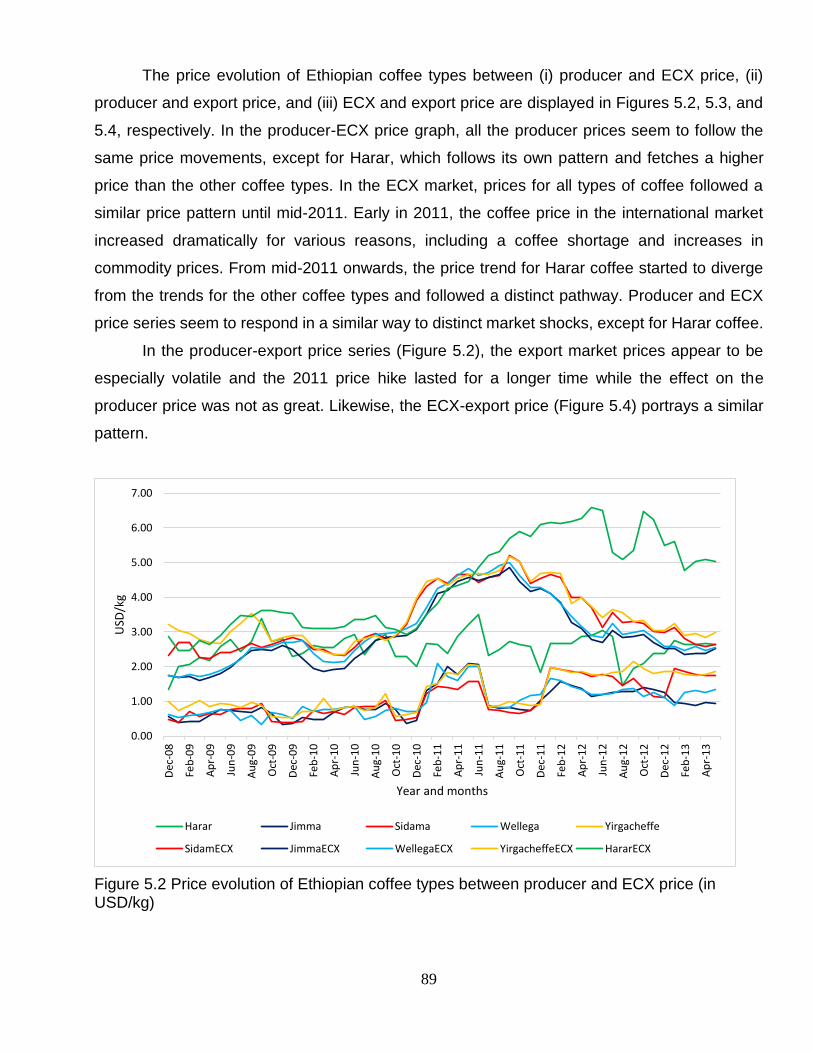
89
The price evolution of Ethiopian coffee types between (i) producer and ECX price, (ii)
producer and export price, and (iii) ECX and export price are displayed in Figures 5.2, 5.3, and
5.4, respectively. In the producer-ECX price graph, all the producer prices seem to follow the
same price movements, except for Harar, which follows its own pattern and fetches a higher
price than the other coffee types. In the ECX market, prices for all types of coffee followed a
similar price pattern until mid-2011. Early in 2011, the coffee price in the international market
increased dramatically for various reasons, including a coffee shortage and increases in
commodity prices. From mid-2011 onwards, the price trend for Harar coffee started to diverge
from the trends for the other coffee types and followed a distinct pathway. Producer and ECX
price series seem to respond in a similar way to distinct market shocks, except for Harar coffee.
In the producer-export price series (Figure 5.2), the export market prices appear to be
especially volatile and the 2011 price hike lasted for a longer time while the effect on the
producer price was not as great. Likewise, the ECX-export price (Figure 5.4) portrays a similar
pattern.
Figure 5.2 Price evolution of Ethiopian coffee types between producer and ECX price (in USD/kg)
0.00
1.00
2.00
3.00
4.00
5.00
6.00
7.00
Dec
-08
Feb
-09
Ap
r-0
9
Jun
-09
Au
g-0
9
Oct
-09
Dec
-09
Feb
-10
Ap
r-1
0
Jun
-10
Au
g-1
0
Oct
-10
Dec
-10
Feb
-11
Ap
r-1
1
Jun
-11
Au
g-1
1
Oct
-11
Dec
-11
Feb
-12
Ap
r-1
2
Jun
-12
Au
g-1
2
Oct
-12
Dec
-12
Feb
-13
Ap
r-1
3
USD
/kg
Year and months
Harar Jimma Sidama Wellega Yirgacheffe
SidamECX JimmaECX WellegaECX YirgacheffeECX HararECX

90
Figure 5.3 Price evolution of Ethiopian coffee types between producer and export price (in USD/kg)
Figure 5.4 Price evolution of Ethiopian coffee types between ECX and export price (in USD/kg)
0.00
1.00
2.00
3.00
4.00
5.00
6.00
7.00
8.00
9.00
Dec
-08
Feb
-09
Ap
r-0
9
Jun
-09
Au
g-0
9
Oct
-09
Dec
-09
Feb
-10
Ap
r-1
0
Jun
-10
Au
g-1
0
Oct
-10
Dec
-10
Feb
-11
Ap
r-1
1
Jun
-11
Au
g-1
1
Oct
-11
Dec
-11
Feb
-12
Ap
r-1
2
Jun
-12
Au
g-1
2
Oct
-12
Dec
-12
Feb
-13
Ap
r-1
3
USD
/kg
Year and months
Harar Jimma Sidama Wellega Yirgacheffe
SidamaEXP JimmaEXP HararEXP YirgacheffeEXP WellegaEXP
0.00
1.00
2.00
3.00
4.00
5.00
6.00
7.00
8.00
9.00
Dec
-08
Mar
-09
Jun
-09
Sep
-09
Dec
-09
Mar
-10
Jun
-10
Sep
-10
Dec
-10
Mar
-11
Jun
-11
Sep
-11
Dec
-11
Mar
-12
Jun
-12
Sep
-12
Dec
-12
Mar
-13
Jun
-13
Sep
-13
Dec
-13
Mar
-14
Jun
-14
Sep
-14
Dec
-14
Mar
-15
USD
/kg
Year and months
SidamaEXP JimmaEXP HararEXP YirgacheffeEXP WellegaEXP
SidamECX JimmaECX WellegaECX YirgacheffeECX HararECX

91
5.3.2 Econometric analysis: Nonlinear Autoregressive Distributed Lag model (NARDL)
This study applies a Nonlinear Autoregressive Distributed Lag model (NARDL), the asymmetric
continuation of the ARDL model, recently developed by Shin et al. (2014). The novelty of this
technique is its ability to detect both short- and long-run asymmetries between price series using
positive and negative partial sum decomposition. Moreover, the asymmetric ARDL specification
allows the analysis of non-stationarity and nonlinearity jointly in the context of an unrestricted
error correction model (e.g. see Katrakilidis and Trachanas (2012) and Atil et al. (2014). A
detailed explanation of this model is given in chapter 3 (see section 3.4.3).
In addition, the present study tested the statistical relevance of a downward power
relationship (the bargaining power goes downwards from exporter to ECX trader, then to
producer) along the Ethiopian coffee value chain within three NARDL models, namely, exporter
to producer, exporter to ECX, and ECX to producer. As proposed by Shin et al. (2014), the
NARDL model specification is written as follows:
Changes in ECX price (pext) to changes in the producer price (ppt)
∆𝑝𝑝𝑡 = 𝜎0 + ℎ1𝑝𝑝𝑡−1 + ℎ2+𝑝𝑒𝑥𝑡−1
+ + ℎ3−𝑝𝑒𝑥𝑡−1
− + ∑ ∀𝑗∆𝑝𝑝𝑡−𝑗
𝑢−1
𝑗=1
+ ∑ 𝜇𝑗+∆𝑝𝑒𝑥𝑡−𝑗
+
𝑣−1
𝑗=0
+ ∑ 𝜇𝑗−∆𝑝𝑒𝑥𝑡−𝑗
−
𝑣−1
𝑗=0
+ 𝜇𝑡 Eq. 1
Change in Export price (pEt) to changes in the producer price (ppt)
∆𝑝𝑝𝑡 = 𝜎0 + ℎ1𝑝𝑝𝑡−1 + ℎ2+𝑝𝐸𝑡−1
+ + ℎ3−𝑝𝐸𝑡−1
− + ∑ ∀𝑗∆𝑝𝑝𝑡−𝑗
𝑢−1
𝑗=1
+ ∑ 𝜇𝑗+∆𝑝𝐸𝑡−𝑗
+
𝑣−1
𝑗=0
+ ∑ 𝜇𝑗−∆𝑝𝐸𝑡−𝑗
−
𝑣−1
𝑗=0
+ 𝜇𝑡 Eq. 2
Changes in Export price (pEt) to changes in the ECX price (pext)
∆𝑝𝑒𝑥𝑡 = 𝜎0 + ℎ1𝑝𝑒𝑥𝑡−1 + ℎ2+𝑝𝐸𝑡−1
+ + ℎ3−𝑝𝐸𝑡−1
− + ∑ ∀𝑗∆𝑝𝑒𝑥𝑡−𝑗
𝑢−1
𝑗=1
+ ∑ 𝜇𝑗+∆𝑝𝐸𝑡−𝑗
+
𝑣−1
𝑗=0
+ ∑ 𝜇𝑗−∆𝑝𝐸𝑡−𝑗
−
𝑣−1
𝑗=0
+ 𝜇𝑡 Eq. 3
Where, 𝑝𝐸𝑡, 𝑝𝑒𝑥𝑡, 𝑝𝑝𝑡, denote the export, ECX, and producer prices; 𝑝𝐸𝑡−1+ , 𝑝𝐸𝑡−1
− , 𝑝𝑒𝑥𝑡−1+ ,
𝑝𝑒𝑥𝑡−1− represents the partial sums of positive and negative changes in export and ECX prices;
u, and v are lag orders; ℎ2 =−ℎ1
𝜕+ , ℎ3 =−ℎ1
𝜕− are the long-run impacts of price increases and
reductions between the pairs of market prices; and ℎ1 represents the price elasticity. The short-
run adjustment to positive and negative in one of the pair prices is denoted by 𝜇𝑗+ and 𝜇𝑗
− ; 𝜎0 is
the constant.

92
Following Greenwood-Nimmo et al. (2013), equations 1, 2, and 3 are also re-estimated
by imposing short-run symmetry. Such restrictions improve the estimation of the long-run price
dynamics. The modified equations are as follows (Greenwood-Nimmo et al., 2013):
∆𝑝𝑝
𝑡= 𝜎0 + ℎ1𝑝𝑝𝑡−1 + ℎ2
+𝑝𝑒𝑥𝑡−1+ + ℎ3
−𝑝𝑒𝑥𝑡−1− + ∑ ∀𝑗∆𝑝𝑝𝑡−𝑗
𝑢−1
𝑗=1
+ ∑ 𝜇𝑗∆𝑝𝑒𝑥𝑡−𝑗
𝑣−1
𝑗=0
+ 𝜇𝑡 Eq. 4
∆𝑝𝑝𝑡 = 𝜎0 + ℎ1𝑝𝑝𝑡−1 + ℎ2+𝑝𝐸𝑡−1
+ + ℎ3−𝑝𝐸𝑡−1
− + ∑ ∀𝑗∆𝑝𝑝𝑡−𝑗
𝑢−1
𝑗=1
+ ∑ 𝜇𝑗∆𝑝𝐸𝑡−𝑗
𝑣−1
𝑗=0
+ 𝜇𝑡 Eq. 5
∆𝑝𝑒𝑥𝑡 = 𝜎0 + ℎ1𝑝𝑒𝑥𝑡−1 + ℎ2+𝑝𝐸𝑡−1
+ + ℎ3−𝑝𝐸𝑡−1
− + ∑ ∀𝑗∆𝑝𝑒𝑥𝑡−𝑗
𝑢−1
𝑗=1
+ ∑ 𝜇𝑗∆𝑝𝐸𝑡−𝑗
𝑣−1
𝑗=0
+ 𝜇𝑡 Eq. 6
This study attempts to test market integration and price transmission for five types of
Ethiopian coffee along the market chain through three steps. Firstly, the Shin et al. NARDL
approach is used to test cointegration along the market chain. Secondly, the study investigates
the existence of price asymmetry for the different types of coffee. Thirdly, following the
asymmetric test, the extent of a short- and long-run asymmetric price change is tested.
In addition, the robustness of the NARDL model was tested using two common tools as
diagnosis tests. These included the Breusch-Godfrey Lagrange Multiplier test for serial
correlation, and the Autoregressive Conditional Heteroscedasticity (ARCH) test for
heteroscedasticity, as developed by Engle (1982). These tests are performed on the residuals
of the estimated variables. The subsequent results are presented in the following section.
5.4 Results and discussion
5.4.1 Stationary analysis
Before proceeding with the NARDL bounds tests, we had to ensure that none of the variables
under consideration were integrated to an order higher than one. In such an order of integration
(I(2) or higher), the computed statistics provided by Pesaran et al. (2001) and Narayan (2005)
are not valid (Ang, 2007). In the presence of I(2) variables, the joint computed F-statistics would
not be valid.
Table 5.1 shows the Augmented Dickey-Fuller (ADF) test results for price series after the
establishment of the ECX. The unit root test was performed at level and at first difference with
the intercept, and with the intercept and trend term. The optimum lag was selected by using the

93
Akaike information criterion (AIC). Based on the critical values reported, only the Harar producer price appeared to be stationary
at the level, while all other price series became stationary after the first difference. Table 5.1 also shows that none of the series
have an integration order of I(2) or higher, which satisfies the precondition to undertake a cointegration analysis using ARDL.
Table 5.1 Unit root test of producer, ECX and export prices of Ethiopian coffee
Coffee type
At level/ First difference
Producer price
Order of integration
ECX price
Order of integration
Export price
Order of integration
τc τc,t τc τc,t τc τc,t
Harar At level -4.83*** -4.84*** I(0) -1.48 -1.09 I(1) -1.58 -1.0 I(1)
First difference
- - -7.16*** -7.33*** -12.75***
-12.88***
Yirgacheffe At level -2.0 -3.4* I(1) -1.48 -1.62 I(1) -1.25 -1.46 I(1)
First difference
-7.86*** -7.79*** -7.57*** -7.52*** -14.13*** -13.97***
Sidama At level -2.1 -3.4* I(1) -1.66 -1.44 I(1) -1.26 -1.32 I(1)
First difference
-7.28*** -7.21*** -7.20*** -7.19*** -8.18*** -8.11***
Wollega At level -2.53 -3.4* I(1) -2.13 -1.83 I(1) -2.02 -1.83 I(1)
First difference
-7.8*** -7.73*** -5.68*** -5.86***
-2.84*** -15.32***
Jimma At level -2.30 -3.3* I(1) -2.08 -1.82 I(1) -1.64 -1.69 I(1)
First difference
-6.3*** -6.24*** -5.57*** -5.69***
-11.99***
-11.9***
Note: ***, * indicate statistical significance at 1% and 10% respectively
94
5.4.2 Coffee market channel
As previously mentioned, coffee is marketed through two alternative channels (Figure 2.2). Most
the coffee trade takes place through a conventional coffee channel, which consist of collectors,
traders, and exporters. Only a small share of the coffee is traded through the cooperative
channel, which encompasses primary cooperatives and unions that collect coffee from their
member farmers.
Figures 5.5 and 5.6 compare the price evolutions in the cooperative and conventional
coffee markets between January 2012 and August 2012. The evolution of the coffee prices for
the producer, cooperative, ECX, and export chains were computed for each type of coffee.
Results suggest that the cooperative channel earns a higher export price. The availability of
alternative niche markets (for example, fair trade and organic markets) allows cooperatives to
take advantage of a price premium. A comparison of the ECX price and cooperative prices
shows mixed results for the different types of coffee with neither the ECX nor the cooperative
price fetching consistently higher prices.
Furthermore, price gaps between producer-ECX and producer-cooperative are similar for
all of the coffee types. Regardless of the coffee type, the coffee price at the ECX level is double
that of the producer price. Turning to the price patterns between producer and export prices, the
export price received by the union in the cooperative channel is much higher than the producer
price. This particular price gap is observed for all the coffee types and is larger for premium
coffee types such as Harar and Yirgacheffe. Moreover, the same pattern is observed in the
conventional coffee market, but the gap is not as large as with the cooperative channel. This
pattern was also observed by Minten et al. (2014), who investigated the impact of the
management change with the establishment of the ECX on the promotion of quality premiums.
They found that after the introduction of the ECX, the price premiums for the cooperatives, as
compared to traders, increased by 9%.
Harar coffee is the premium coffee out of the five coffees considered in this study and it
fetches the highest price in both the domestic and export markets. The second-best quality
coffee is Yirgacheffe coffee, which sometimes exceeds the quality expectations of the Harar
coffee in the international market. Interestingly, in the cooperative market channel, Yirgacheffe
coffee fetches a higher price than Harar coffee. Minten et al. (2014) relates the higher coffee
price to options for coffee certification which are more relevant for Yirgacheffe coffee. As
previously discussed in chapter 2, much of the Harar coffee is exported to the Saudi market.

95
Figure 5.5 Average producer, cooperative, and cooperative union prices (USD/kg)
Figure 5.6 Average producer, ECX, and export coffee prices (USD/kg)
To understand the vast price gap between export-ECX and export-producer prices, one
needs to understand the costs incurred by the producers, traders, and exporters in the Ethiopian
coffee value chain. In a USAID (2010) study in 2008, the estimated average cost at the farm
gate was 1.06 USD per kg, whereas the average farm gate price per kg of green coffee was
2.16 USD. The cost of collecting and processing by traders was estimated at 0.33 USD per kg,
0.00 1.00 2.00 3.00 4.00 5.00 6.00 7.00 8.00 9.00
Yirgachefe
Sidama
Wellega
Jimma
Harar
USD/kg
Co
ffe
e t
ype
Union (exp)
Cooperative
Producer
0.00 1.00 2.00 3.00 4.00 5.00 6.00 7.00 8.00
Yirgachefe
Sidama
Wellega
Jimma
Harar
USD/kg
Co
ffe
e t
ype
Export
ECX
Producer

96
and they charged a margin of 0.386 USD per kg. The export cost for the traders (exporters) was
calculated at 0.58 USD per kg, with an exporters’ margin of 0.49 USD. In addition to the long
and costly value chain, the productivity of the Ethiopian coffee industry is rather low, with rather
high production costs (Van Der Vossen, 2005). The average Ethiopian coffee yield is 300kg/ ha,
which is equal to a third of Colombia’s yield (900kg/ ha), half of El Salvador’s yield, and a quarter
of Costa Rica’s and Brazil’s yields of 1.2MT/ ha and 2MT/ ha, respectively (Van Der Vossen,
2005; MARO et al., 2014). Worako et al. (2014) included cost items in their study that had been
ignored by previous studies, such as impurity and weight losses during cleaning. The study
calculated the average value chain cost of the farm gate-ECX and ECX-export and found that
0.42 USD per kg was incurred by the trader (farm gate-ECX), while 0.46 USD per kg was
incurred by the exporter.
5.4.3 NARDL bounds tests for cointegration
Model (1) represents the price transmission from the ECX to the producer, while model (2)
portrays the price transmission between exporter and producer. Furthermore, model (3) portrays
the price transmission between exporter and the ECX. A general-to-specific approach was used
to determine the lag order (Shin et al., 2014). For each of the three models (table 5.2), a
maximum lag order of 4 was set as a starting point for iteration and dropping insignificant
regressors.
The results displayed in Table 5.2 confirm that the producer and ECX markets have
established a significant level of cointegration. The continuous adjustment of the producer price
with the ECX price was expected from the establishment of the ECX, since it aimed to create
transparency in the Ethiopian commodity market. The establishment of a long-run cointegration
between the prices on the producer and export markets for all coffee types also suggests that
market information is accessible at producer level. Similarly, the results of the model testing the
integration between Export and ECX prices, suggest that prices are integrated in the long run.
Thus, the ECX does not have to follow the international coffee price when setting a price. Rather,
it sets a range of prices for a trader to make a bidding. The price setting takes the previous day’s
price as a reference point to protect traders from incurring a loss while exporting the coffee.

97
Table 5.2 Tests for cointegration using the NARDL approach
Price pairs ECX – Producer Export - Producer Export - ECX
NARDL model (1) with LR and SR
asymmetry
NARDL model (2) with LR and SR
asymmetry
NARDL model (3) with LR and SR asymmetry
FPSS FPSS FPSS
Harar 16.07*** 11.46*** 12.19***
Jimma 9.73*** 15.72*** 74.98***
Sidama 9.50** 23.58*** 13.54***
Wollega 38.06*** 19.7*** 17.21***
Yirgacheffe 34.8*** 33.9*** 26.9***
Notes: ***, ** indicate statistical significance at 1% and 5% respectively. By taking a maximum lag of 4, a general to specific approach is used to reach the optimal lag length.
5.4.4 Asymmetric price transmission
Table 5.3 displays the results of the symmetry tests for producer-ECX, producer-export, and
ECX-export prices as presented in equations 1, 2, and 3. The long-run test results fail to reject
the null hypothesis of symmetry between producer and ECX price changes for all types of coffee.
This implies that the prices of the different coffee types were transmitted symmetrically between
producers to the ECX in the long-run. The Wald test for the short-run symmetric test was only
significant for the prices of Harar coffee. Harar coffee showed both positive (SP+ = 1.21) and
negative (SP- = 0.94) price transmission between producer and ECX prices (Table 5.4). In
addition, the price transmission was larger for positive price changes than for negative changes.
Such positive cumulative effects are fortunate for Harar coffee producers, even though they only
last for a short time. The short-run price transmission for both Jimma (SP- = 1.58) and Sidama
(SP- = 7.11) was detected only from the negative component. The coefficients indicate that a
negative change in export price of 1%, resulted in a decrease of 1.58% and 7.11% in producer
price of Jimma and Sidama coffee, respectively. The change in the price of Sidama coffee might
appear relatively large, however, the effect in absolute value is rather small due to the low price
that producers receive. As such, price changes are more sensitive when the changes occur at
higher levels of the market.

98
Furthermore, the results of the Wald test rejected the null hypothesis of long-run price
symmetry between producer-exporters for the price of Harar, Sidama, and Yirgacheffe coffees.
The results also show an interesting interaction between the positive and negative price changes
for the three types of coffee (Table 5.4). The Harar coffee price showed a significant transmission
of negative price changes (Lp- = 0.43) between export and producer prices in the long-run, which
suggests that only price decreases are transmitted in the long-run. Price transmission between
export and producer prices for Yirgacheffe coffee were significant for both positive and negative
price changes (Lp+ = 0.90, Lp- = 1.37). The magnitude of the negative price change is larger
than that of positive price changes, which is unfavourable for Yirgacheffe coffee producers. The
only type of coffee for which a positive price change transmission was found between export
and producer prices in the long-run was Sidama coffee (Lp+ = 5.98). The common characteristic
of the coffees (Harar, Sidama, and Yirgacheffe) that show a long-run price asymmetry between
export and producer prices is that they are coffees that are better known for their quality and
that are branded. The Wald test for the short-run symmetric test also revealed a significant
transmission for the prices of Jimma and Sidama coffee.
Therefore, the long-run test results fail to reject the null hypothesis of symmetry between
Exporter and ECX price changes for all five types of coffee. However, a negative price
transmission between export and ECX prices for Harar coffee was found in the short-run (SP-
=0.22. Moreover, a decrease of 1% in the export price for Harar coffee lowers the price on the
ECX by 0.22%. Although the effect is small, it is to the disadvantage of the traders in the ECX
market as only negative price changes are transmitted. Furthermore, evidence of short-run
asymmetric price transmission for the prices of Jimma and Sidama coffees was not found.

99
Table 5.3 Long run and short run asymmetry test
Producer – ECX Producer- Export ECX-Export
Price pair NARDL model (eq. 6) with LR
and SR asymmetry
NARDL model (eq. 9) with
restricted SR
NARDL model (eq. 7) with LR
and SR asymmetry
NARDL model (eq. 10) with restricted SR
NARDL model (eq.8) with LR and SR asymmetry
NARDL model (eq.11) with
restricted SR
Harar WLR -0.34 (0.45) 0.16 (0.77) 0.69 (0.04) 0.69 (0.04) -0.003 (0.98) -0.25 (0.30)
WSR 2.15 (0.01) - 0.22 (0.04)
Jimma WLR 1.76 (0.49) 1.76 (0.49) 0.84 (0.50) -0.32 (0.77) -0.31 (0.24) -0.32 (0.22)
WSR - 1.58 (0.00) -
Sidama WLR 0.41 (0.81) 0.41 (0.81) 6.60 (0.00) 2.39 (0.13) -0.30 (0.54) 0.08 (0.86)
WSR - 5.43 (0.00) 0.26 (0.31)
Wollega WLR 1.43 (0.36) 1.43 (0.36) 0.66 (0.58) 0.66 (0.58) -0.55 (0.22) -0.61 (0.26)
WSR - - -
Yirgacheffe
WLR -0.052 (0.96) -0.05 (0.96) 2.28 (0.02) 2.28 (0.02) -0.009 (0.97) -3.44 (0.67)
WSR - - -
Notes: WLR denotes the Wald test for long run symmetry defined by−h2
+
h1⁄ =
−h3−
h1⁄ ; WSR denotes the Wald test for short run
symmetry defined by ∑ 𝜇𝑗+𝑣
𝑗=0 = ∑ μj−v
j=0 ; ( ) represents the p-values.

100
Table 5.4 The long run and short run positive and negative price coefficients
Note: Lp+, Lp- , SP+, and SP- indicate the positive and negative long-run and short run
coefficients, respectively.
Price pair Type of relationship
Producer - ECX Producer- Export ECX-Export
Coefficient Prob.
Coefficient Prob. Coefficient
Prob.
Harar Lp+ - - 0.26 0.23 0.09 0.59
Lp-
- - -0.43 0.03 0.09 0.53
SP+
1.21 0.02 - -
SP-
0.94 0.04 0.22 0.04
Jimma Lp+ 1.86 0.23 1.42 0.12 -0.27 0.13
Lp-
0.092 0.94 0.58 0.33 0.04 0.75
SP+
- - - -
SP-
1.58 0.00 - -
Sidama Lp+ 0.90 0.35 5.98 0.00 0.079 0.76
Lp-
0.48 0.63 -0.62 0.52 0.37 0.25
SP+
- - - - 1.19 0.00
SP-
- - 7.11 0.00 0.91 0.00
Wollega Lp+ 0.64 0.53 0.60 0.55 -0.36 0.33
Lp-
-0.79 0.35 -0.062 0.87 0.19 0.21
SP+
- - - - -- -
SP-
- - - - - -
Yirgacheffe Lp+ 0.39 0.58 0.90 0.07 0.15 0.35
Lp-
0.44 0.58 -1.37 0.02 0.16 0.39
SP+
- - - - - -
SP-
- - - - - -

101
5.5 Robustness tests
Table 5.5 presents the results of serial correlation and autoregressive conditional
heteroscedasticity tests as robustness checks. In all cases, the LM statistics were
insignificant and therefore, no evidence of autocorrelation problems was found. The ARCH
test was performed at the 5% confidence level and the results revealed that all price series
are free from heteroscedasticity. Appendix II shows the results of the stability tests
performed using the cumulative sum (CUSUM) test. Thus, the diagnostic results show that
the above estimation results are free from model specification errors and are stable.
Table 5.5 Diagnostic tests: LM and ARCH tests for serial correlation and autoregressive conditional heteroscedasticity
5.6 Conclusions
The link between market policy reforms and price transmission has been at the centre of
debate within the commodity marketing literature due to its economic and welfare
implications. Ethiopia, like other developing countries, relies heavily on a limited number of
primary commodities, which makes policy interventions in these markets very sensitive to
welfare effects. More specifically, the Ethiopian coffee sector, which accounts for the lion's
share of the country’s exports, is a source of livelihood for more than 15% of the population.
As the coffee sector is based on a long value chain, any policy implemented within the sector
will have major repercussions.
Producer- ECX Producer-export ECX-export
Harar LM 4.89 (0.08) 4.22 (0.12) 1.28 (0.52)
ARCH 21.30 (0.67) 4.50 (0.80) 30.18 (0.26)
Jimma LM 1.62 (0.44) 1.09 (0.57) 0.61 (0.73)
ARCH 2.78 (0.94) 16.15 (0.24) 1.80 (0.98)
Sidama LM 0.004 (0.99) 1.26 (0.53) 0.97 (0.61)
ARCH 6.00 (0.64) 0.94 (0.33) 9.07 (0.33)
Wollega LM 1.47 (0.47) 1.18 (0.55) 0.17 (0.91)
ARCH 0.001 (0.97) 3.32 (0.91) 9.77 (0.28)
Yirgacheffe LM 0.66 (0.71) 1.83 (0.39) 0.89 (0.63)
ARCH 4.57 (0.80) 0.43 (0.50) 11.11 (0.19)

102
Thus, the objective of this study has been to empirically investigate the market
integration and price transmission symmetry for the five major types of Ethiopian coffee
along the coffee value chain after the implementation of the ECX. The ECX aimed to
establish an institutionalised Ethiopian coffee market. The introduction of the ECX was
intended to overcome the major constraints observed in the coffee market, such as lack of
adequate market information, lack of integration, lack of transparency, high marketing and
transaction costs, lack of trust between buyers and sellers, collusion, and dominance of
exporters. This study applied nonlinear autoregressive distributed lag models to capture the
asymmetric responses in the prices at producer level from price changes at the ECX and
export level, as well as the prices at the ECX level from price changes at the export level.
Using monthly price data for the period 2008-2013, responses to both negative and positive
price changes, as well as in the short- and long-run, were considered.
The results suggest that the prices of different coffee types are integrated between
producers and the export and ECX level, and between the ECX and the export level.
Furthermore, the results showed a symmetric price transmission between producer and
ECX, except for Harar coffee, for which evidence of short-run price asymmetry was found.
The models of price transmission between producer and exporter prices further suggest the
presence of both asymmetric and symmetric price transmission in the long- and short-run
for Harar, Sidama, and Yirgacheffe coffee. The current results also indicate that the
magnitude with which negative price changes between exporter and producer were
transmitted is greater than that of positive price changes. Notably, the presence of price
asymmetry for quality and branded Ethiopian coffees (Harar, Sidama, and Yirgacheffe)
between the producer-exporter suggests that the number of traders for quality is lower
leading to a higher risk of concentrated market power. Another important finding is the lack
of asymmetric price relationships between the ECX and export markets for all types of
Ethiopian coffee, except Harar coffee, for which a negative price transmission was found.
In general, there are various reasons for why exporters are more powerful in the
Ethiopian coffee value chain. A first factor could be the increased market power of the
existing coffee exporters. While the ECX increased competition at the level of the export, a
World Bank (2014) study revealed that the largest exporters (selling more than 5 million
USD per annum) carry out nearly 80% of coffee exports. The study further criticised that
new exporters entering the market seem to face difficulties in terms of establishing trade,
understanding the coffee markets, and accessing credit. These entry barriers allow existing
exporters to collude and to create an oligopsonistic market. Secondly, the asymmetric price
103
transmission coming from the exporter to the producer market could indicate a higher
adjustment cost incurred by the exporters. When exporters have limited time to meet the
import requests, they make adjustments at the expense of the producers.
Overall, the results suggest that exporters enjoy an absolute advantage over the
coffee producers who experience a reduction in the price they receive when market prices
go down, yet they do not receive a higher price when the market prices go up. The current
results also highlight the limited capability of the ECX in achieving the goals it had set for
creating an integrated and transparent market along the Ethiopian coffee value chain.
However, considering the length of time that the ECX has been operating in the Ethiopian
coffee market, and the disorganised and uncoordinated Ethiopian coffee market prior to the
establishment of the ECX, it may be too early to conclude that the institutionalisation process
is a failure. Policy measures aimed at empowering the coffee producers, and at the same
time creating a competitive market both at ECX and export level, could further contribute
towards an integrated and transparent coffee market in Ethiopia.
Improving the effectiveness of a commodity exchange remains a challenge in a
dysfunctional producers’ and traders’ market. Improvements may be needed for better
knowledge on quality and grading at the producer level. Since the number of traders and
cooperatives operating at the producer level are few in number, establishing grading and
inspection centres at the farm gate level would encourage producers to know the quality of
the coffee that they supply and to use this information when bargaining with the traders.
Establishing such grading labs have been shown to have successful results in cooperatives
supported by USAID in southern Ethiopia.
Furthermore, lowering the entry barriers to members at ECX could also improve
transparency in the market. The high price to be paid for a membership seat in ECX is
serving as a filtering mechanism for creating financially strong exporters which paves the
way for collusion. Again, increasing the number of the exporters by itself does not guarantee
the competitiveness of the export market. Therefore, ECX needs to set up an effective
pricing scheme as a means for considering the capacity of the different exporters.
104
Chapter 6
De-commoditising Ethiopian coffees after the establishment of the ECX: An empirical investigation of smallholder
coffee producers in Ethiopia Abstract
The repercussions of reforming an agricultural market are mainly observed at the most
vulnerable segment of the value chain, namely, the producers. In the current commodity
market created with trade through the ECX, coffee is less traceable to its producers. Only
cooperatives that sell certified coffee through the unions they belong to, are allowed to
bypass the more commodified ECX market. This study aims to investigate if small-scale
coffee producers in Southwestern Ethiopia that sell coffee through the certified cooperative
are better off. It is assumed that the coffee sales through, and membership of, a
cooperative, allows farmers to improve their coffee production as well as to improve other
aspects of their livelihood. A sustainable livelihood approach was used as the inspiration
for the welfare indicators that needed to be considered, data collected amongst members
and non-members of certified cooperatives, and a propensity score model to investigate
the impact of cooperative membership on the livelihood indicators. Results suggest that
members of certified cooperatives indeed receive, on average, better prices. Yet, no
evidence was found that indicates that the higher price is translated into better household
income. Furthermore, coffee plantation productivity of those members who were
interviewed was lower than that of the non-members. This finding could explain the failure
to find an overall effect.
Keywords: Commoditization, Cooperative membership, Certification, Propensity score matching Based on: Demise, T., D’Haese, M. Does de-commoditization matters for Ethiopian coffee
producers: An empirical investigation smallholder coffee producers in Ethiopia (Under
review)

105
6.1 Introduction
As part of a policy to revitalise the agricultural sector, and the coffee sector in particular, the
Ethiopian government abolished its national auction in 2008 and established the Ethiopia
Commodity Exchange (ECX) (FDRE Proclamation no. 602/2008 and Marketing Proclamation
and its Directives 159/2009 and 161/2009). The ECX was intended to function as an
organised marketplace, where buyers and sellers could meet to trade, while being assured of
quality, quantity, payment, and delivery. This contributes towards more efficient and
transparent market operations (ECX, 2008). Some commodities, such as oil seeds and
pulses, benefit from the homogenisation of trade. However, coffee is not a homogeneous
product since quality (as measured by cup tasting), production method, and origin all play a
role. In addition, homogenisation results in a loss of traceability11.
Traceability gained much importance for almost all agricultural products with the shift
from quantity-oriented agriculture to one where quality, safety, functionality, and sustainability
are pertinent. Assuring the traceability of farm produce from farm to fork, implementing
authenticity and diagnostic tests that detect and prevent farm-produce safety hazards, and
preserving the identity and freshness of food products have become essential elements of
agricultural supply chain management systems (Opara, 2003). Over recent decades, a set of
voluntary and regulative laws and initiatives have attempted to bridge the information gaps
between farmers, retailers, and consumers (Opara and Mazaud, 2001). Such traceability
systems aim to reduce production uncertainty, opportunism, and incidences of moral hazards
for products where quality monitoring costs are high and the product traits are difficult to
identify (Buhr, 2003). Hence, in supply chains of different food products alike, traceability
systems increases transparency in the supply chain, reduces the risk of liability claims,
improves the effectiveness of recalls, enhances logistics, improves control of livestock
epidemics, simplifies product licensing, reduces information asymmetry, decreases
transaction costs, increases trust levels, and facilitates contracting for a price premium
(Gellynck and Verbeke, 2001; Meuwissen et al., 2003).
For coffee specifically, traceability systems could add value, especially by transmitting
information on quality and coffee-production type that is obtained through certification,
11 In this study, traceability is perceived as the ability to identify the origin of the coffee to the most relevant level of
aggregation along the supply chain. Essentially, traceability refers to information that is transferred between actors
throughout the whole supply chain, from the single plot within a farmer’s landholding to a single farm household, the
collective of farmers, the processing station, the supplier, and the national market; and which can be traced backwards
(ECX, 2010).
106
production system, and origin (for example, single origin coffee and rainforest alliance).
However, critics argue that the way in which the ECX handles its coffee trade operations is
reducing traceability more than it is enhancing it. The main ECX coffee trade is said to result
in commoditisation, whereby coffees with considerable diversity in cup taste, and that are
spatially grown, are merged towards homogenisation. Thus, coffee that passes through the
ECX is said to become less distinct in cup taste and to become non-traceable, either in terms
of quality or grower origin. As such, the ECX-sourced coffee is a less differentiated product,
although it may be of different quality at the farm level (Leung, 2014). According to Leung
(2014), monetary losses can be substantial when origin labelling disappears, especially for
well-known and reputable coffee varieties. Moreover, the Ethiopian government essentially
endorsed commoditisation, as indicated in a 2011 directive that all export coffee should be
shipped in bulk containers. Previously, the industry practice was to store coffee in 60kg jute
bags, with the advantage of having different coffee lots being transported in a single container
while maintaining lot separation. Shipment in bulk containers would require large overseas
wholesalers to repackage coffee beans, forcing many medium-sized distributors and specialty
coffee roasters, who used to buy small volumes, out of the market (Mezlekia, 2011).
The ECX established the Direct Specialty Trade (DST) that traded fully traceable
coffee. Prior to a monthly DST auction, the ECX posted information on individual lots on its
website, including the grower, geographic origin, and cup profile. With the resulting quality
certificate in hand, producers and local traders were able to sell at the Specialty Trade
platform. In addition, international buyers could pre-register for the session and were invited
to participate in a cupping session prior to the bidding (ECX, 2010; Leung, 2014). The platform
was initiated in February 2010, but it did not meet expectations. The ECX held only 15
auctions on the platform and ceased the operation thereof in 2011. As a result, exporters were
unable to process their own specialty coffees (Mezui et al., 2013).
In the aftermath of market reform, including the demise of the DST, most of the
smallholder coffee producers were left with no other options but to market their coffee through
non-traceable channels. Some found an alternative chain which was put in place with the help
of donor institutions and cooperative unions. Only a limited segment of coffee producers could
market through fully traceable market channels. The peculiarity of this alternative channel is
that it is the cooperatives with certifications that allow traceable trade. The certification
includes fair-trade, organic, rainforest alliance, and/ or fair-trade-organic. The coupling of
certification with traceability enables the cooperative members to widen their outlet options.
Thus, the operation has the intention of shifting the coupling of certification with traceability

107
from an alternative market channel to the mainstream market. It is however noteworthy to
mention that this ‘de-commodified’ channel is still of minor importance compared to the ECX.
The majority of the coffee production in the study area is traded through the ECX.
The current research was motivated by an earlier study by Jena et al. (2012), who
conducted similar research in the Jimma zone. For the present study, gaining further insight
into the outcomes that small-scale coffee producers may observe from being members of,
and selling through certified cooperatives, is of particular interest. The study by Jena et al.
(2012) is limited to the impact of certification and does not consider the impact of the market
reform as a result of the establishment of the ECX. Therefore, the current study aims to
investigate whether producer marketing through the alternative chain leads to more economic
benefits than producer marketing through the ECX chain. Furthermore, the study also aims to
compare different cooperatives.
Previous empirical research conducted by Allison (2009), Frenette (2010), Bjerga and
Patton (2011), and Leung (2014), that studied the impact of traceability in the coffee sector is
limited to macroeconomic perspectives. However, over the past decade, studies on coffee-
producing households have explored issues relating to the impact of coffee certification on
sustainable development, asset endowments, sustainability of certified coffee production, and
poverty (Valkila, 2009, Barham and Weber, 2012, Donovan and Poole, 2014; Chiputwa et al.,
2015). These studies predominantly highlighted the impact of different types of certification
on the financial capital, productivity, natural resources, poverty, and sustainability of the farm
household.
This study makes use of a propensity score matching approach to compare data from
small-scale coffee producers who are members or non-members of cooperatives in South-
West Ethiopia. The analysis aims to test whether membership has a direct effect on the coffee
production outcomes, including production, productivity, and price at which the coffee is sold,
as well as on livelihood outcomes. These livelihood indicators are inspired by the sustainable
livelihood approach.
6.2 Empirical challenges
Potential biases are expected in the selection of certified and traceable cooperatives as
well as the selection of farmers to be interviewed. There are various reasons for the
presence of biases. One such reason is that farmers marketing through a certified and
traceable value chain, compared to the ECX market, might vary in several community and
household-level characteristics, which may have a direct impact on producer welfare. For

108
example, farmers selling through the certified and traceable value chain might experience
differences in the average size of coffee holdings, climactic working conditions, market
access, practices, and the distances to input markets than farmers selling to the ECX.
Therefore, the differences observed between the two groups of producers (members of
cooperatives and non-members) may, either completely or partially, show basic
differences explaining their willingness to be members of a cooperative, rather than the
effects of certification and coffee sales through the alternative channel (Bernard et al.,
2008).
A second reason for expected biases is that self-selection bias could arise from
unobservable community or household characteristics. For instance, the existence of such
certified cooperatives might be initiated by active community leaders in the area where the
cooperative is established. At the farmer level, entrepreneurial spirit, motivation to prosper,
a household’s risk preference, or its relationship to other certified and traceable
cooperative members may correlate with self-selection (McKenzie, and Yang, 2010).
Thirdly, the externalities or spill-overs that arise from certified cooperatives on the
decisions and participation of both the members and non-members may be important. For
instance, certified and traceable cooperatives could influence the coffee price offered by
other buyers to non-members and members of non-certified cooperatives (Bernard et al.,
2008).
To overcome these potential biases, this study uses a propensity score matching
approach. Data were collected from member of certified cooperatives as well as non-
members. The non-members who were interviewed were selected from areas where no
certified cooperatives are present. The areas with and without certified and traceable
cooperatives were matched by accounting for important determinants such as market
access, agro-ecological potential, population density, and remoteness. The researcher
then matched certified and traceable cooperative members to similar households in other
areas without cooperatives. The potential bias for self-selection in a certified cooperative
was minimised by selecting cooperatives which were only initiated by external partners (in
this case, the NGO Technoserve). In this regard, the establishment of the certified and
traceable cooperatives was exogenous to the communities’ decision-making processes.
Furthermore, in order to control the spill-over effects of sharing the same market, the
researcher ensured that the treated and control groups did not share the same local
market.

109
The sustainable livelihood approach (Ellis, 2001) inspired the choice of livelihood
indicators on which the impact of the cooperative membership was measured. The
livelihood approach assumes that households own a certain amount of capital/ assets
which they invest in a livelihood strategy. Ellis (2001) distinguishes between natural,
human, physical, financial, and social capital. Livelihood strategies may exist of one or
more sources of income. A household will typically invest in a livelihood portfolio that,
depending on the level of capital and personal preference, and mediated by the
institutional/ market/ natural environment, is diversified across agricultural, non-farm, and
migration activities. This livelihood portfolio allows the household to earn an income,
access food, and secure a livelihood. Moreover, surplus ‘income’ can be saved or invested
in the accumulation of household capitals (Ellis, 2001).
It is assumed that small-scale coffee producers consider coffee farming as part of
their livelihood. Therefore, they will allocate land to coffee and invest time and money into
it in order to make coffee part of their livelihood portfolio. Membership of a certified
cooperative and sales of certified coffee may enhance the coffee production if it allows the
farmers to gain benefits in terms of price at which coffee is sold, sales volumes, as well as
net and gross revenues from coffee. This involves de-commodifying the coffee, in other
words, creating a conducive institutional environment. In turn, this may feed back into the
household livelihood if the gains are invested in the household capital. Furthermore, the
impact on human capital is measured by the possible difference in women empowerment
of cooperative membership. The indicators for physical capital include values of asset
levels; impact on financial assets is tested through measuring the impact on income levels
from other crops, nonfarm income, savings. The number of trees planted is an indicator of
natural capital and finally social capital may be enhanced in terms of the membership to
associations.
6.3 Methodology
6.3.1 Study area, data collection and sampling
6.3.1.1 Study area
This study focuses on the Jimma and Kaffa zones in Southwestern Ethiopia (Figure 1.3).
The two zones were selected for their potential and long experience in coffee production.
The Jimma zone is composed of 13 woredas, with a population of over 2.8 million (CSA,
2014). The elevation ranges from 880m to 3360m above sea level. The zonal agro-

110
ecological setting is stratified as highlands (15%), mid-lands (67%), and lowlands (18%).
The zonal rainfall coverage ranges from 1200–2800mm per annum. In normal years, the
rainy season extends from February to October. Maize, teff, sorghum, barley, pulses, root
crops, and fruit are other major crops in addition to coffee.
The Kaffa zone has a total area of 10602 km2 and lies at an altitude of 500m to
3500m above sea level. In 2014, this zone had a total population of 858 600 with a
population density of 90 people per km2. Most of the land consists of mid-land (59%),
followed by lowland (29%), with 11% being classified as highlands. The mean annual
temperature of the zone ranges from 10.1 to 27.5°C with a mean annual rainfall of 1001-
2200mm. Of the total area of land in the zone, 23% is cultivated, 32% is forestland, 6% is
grazing land, 25% is cultivable land, and the remaining proportion is uncultivable land.
6.3.1.2 Data collection and sampling
In southwestern Ethiopia, the major coffee growing areas are the districts of Jimma and
Kaffa, where farmers allocate most the cultivable land to coffee production. In these
districts, certified coffee cooperatives participating in the traceable coffee market were
identified. From the two zones, five traceable and certified cooperatives from Kaffa, and a
further 22 from the Jimma zone, trading in the traceable market, were identified.
Cooperatives participating in the certified traceable coffee market for less than two years
and cooperatives which did not pay dividends to their members were excluded from the
treatment group. The remaining cooperatives were then categorised according to their
certification system (organic, fair trade, organic and fair trade, rainforest alliance, and forest
coffee). Rainforest alliance certification began during the survey year. Once the certified
cooperatives in the two zones were classified into the different types, these cooperatives
were further classified by size.
From the identified set of certified cooperatives, three cooperatives from Kaffa and
six cooperatives from Jimma were selected. Thereafter, totally, 292 household heads were
selected according to the sample size determination table at alpha 0.05 (Bartlett et al.,
2001. While selecting members, their affiliation with the cooperatives with consistent sales
of a reasonable quantity (30-40%) of their coffee production through the certified and
traceable routes over the past two years was considered. Thus, the populations under
study included coffee producers and their families whose productive units were small and
who were producing coffee at a small scale under rather homogeneous environmental and
social conditions. After minimising the possible sampling biases, the propensity scores that

111
were used to match the 292 household members in the certified cooperatives with 332
households among the comparison group were estimated. Producers under the
comparison group were selected based on certain similarities to the producers under the
treatment group. These included areas with similar altitude, population density, distance to the
closest market, and moisture reliability. Finally, each household’s propensity score (explained
as the probability that a household would participate in a certified and traceable
cooperative, given a set of observable characteristics) for joining a certified and traceable
cooperative was estimated.
6.3.2 The propensity score matching method
For this study, a semi-parametric matching estimation technique was applied to evaluate
the impact of certification and traceability on the producers’ welfare. Matching estimations
are often used to evaluate the aftermath of policy reforms at different stages. Here, it is
assumed that the difference in outcomes between the treatment and the control group may
be attributed to the certification of the coffee at sales which makes it traceable through a
cooperative setting (Stuart, 2010).
If ZJ(0) is the welfare of producer J if he had not participated in certified and
traceable channels and ZJ(1) is the welfare of the same producer if he had participated in
certified and traceable channels, and both welfare levels were simultaneously observed,
the impact of certification and traceability on the welfare of producer J, ZJ (1) - ZJ (0), would
be directly observable. However, a primary issue with this measure is that ZJ (1) and ZJ (0)
are not simultaneously observable. In other words, as Wooldridge (2002) explains, an
individual cannot be in both conditions and thus, a counterfactual cannot be measured.
Essentially, it is difficult to observe the outcome variables for producers marketing
through certified cooperatives in case they market their coffee through the conventional
channel. Likewise, it is not possible to observe the outcome variables for producers who
market through the conventional channel if they market their coffee through cooperatives.
Therefore, the propensity score matching (PSM) model, as developed by Rosenbaum and
Rubin (1983, 1985), was used to create counterfactuals for the set of producers marketing
through certified cooperatives. PSM constructs a statistical comparison group by matching
producers marketing coffee through certified cooperatives with producers with similar
characteristics marketing through the ECX. Following Heckman et al. (1997), Z1 is the
value of a producer’s welfare when the producer J is subject to treatment. More specifically,

112
a certified cooperative (Q = 1) and Z0 would be the same variable when they do not market
through a certified cooperative (Q = 0). The observed producer’s welfare is
Z = Q Z1 + (1 − Q) Z0 Eq. 1
When Q = 1 we observe Z1; when Q = 0 we observe Z0. The average effect of treatment
on the treated (ATT) is defined as
ATT = E (Z1 − Z0 | Q = 1) = E (Z1 | Q = 1) − E (Z0 | Q = 1) Eq. 2
Hence, we can only observe the outcome variable for producers marketing through
certified cooperatives E (Z1 | Q = 1); however, we cannot observe the counterfactual E (Z0
| Q = 1). Therefore, PSM matches the treatment and control based on counterfactual
analysis.
The three primary assumptions underlying matching estimators are i) the balance
property of the propensity scores, ii) the conditional independence assumption, and iii) the
common support requirement. Therefore, the conditional independence assumption (CIA),
common support condition (CSC), and overlap assumption need to be tested. CIA implies
that, based on a set of covariates that are not affected by certification, disparity in
outcomes between participants and non-participants result from selling coffee through
certified cooperative. Hence, the selection of the set of covariates is crucial in the process
of matching estimators (Wooldridge, 2002). Caliendo and Kopeinig (2008) further
suggested that covariates included in the estimation process should simultaneously
determine the treatment and the outcome variable, which can be written as:
(Y0, Y1) ⊥Q | X Eq. 3
CSC is the second important requirement for conducting the matching between the
treatment and control groups. Heckman et al. (1997) stated that only comparable
observations X can be matched on the overlapping subset of the participant and non-
participant groups. The overlap condition is defined as follows:
0 < P (D = 1|X) < 1 Eq. 4
The overlap assumption explains that individuals with the same X values have a
probability for being considered as a member and a non-member (Caliendo and Kopeinig,
2008). Thus, the balancing property of the propensity score assumption relies on the fact
that the matching property is genuine and states that treated (0=1) and control (0=0)
groups with the same propensity score e(y) have the same distribution as the observed
covariates “x” (Rosenbaum and Rubin, 1983).
Pr {y|Q = 1, e(y)} = Pr (x|Q = 0, e(x)} Eq. 5

113
The phrase “balancing property” means that, while we make a comparison between
two groups, it is necessary to control the propensity score. This allows us to effectively turn
the observational study into groups of subjects with the same propensities. Equation 3
stipulates that the treatment Q has to be independent of all observations y, conditional on
the probabilities e(y) when they would receive the treatment. Failure to satisfy the condition
of CSC is a primary source of bias due to incomparable individuals (Heckman et al., 1997).
Furthermore, to check the robustness of the results, the study makes use of three matching
techniques, namely kernel matching (KM), nearest neighbour matching (NNM), and radius
caliper (RC).
6.3.3 Treatment heterogeneity
It is a major challenge to address self-selection bias in impact studies. The bias is induced
by producers’ self-selection in the certified channels for reasons that are unobservable,
such as risk-taking capacity or the social relationships with other coffee producers. As a
result of the unobserved household heterogeneity, one cannot guarantee that the
treatment will have a homogeneous impact on the producers. To avoid self-selection bias
at the producer level, Xie et al. (2011) propose two methods, namely (a) the stratification
multilevel-heterogeneous treatment effect (SM-HTE), and (b) the matching smoothing-
heterogeneous treatment effect (MS-HTE).
The SM-HTE estimation method firstly calculates the propensity scores based on the
given covariates and then splits the whole range of propensity scores obtained into
different strata and assumes homogeneity within these strata. The effects of the treatment
are interpreted through the comparison of outcome variables between the treatment and
control groups across each of the strata. After the estimations in each of the strata are
calculated, a linearity trend is estimated to show whether the treatment has established a
positive or negative functional effect over the propensity scores (Xie et al., 2011).
The MS-HTE addresses some of the weaknesses of the SM-HTE method. One
weakness being that the SM-HTE considers homogeneity within the strata and uses the
treated and the control variables interchangeably as it assumes there is no heterogeneity
within the strata. Another weakness involves the linearity assumption between the ranges
of strata to detect the treatment heterogeneity. In contrast, the MS-HTE estimation method
firstly estimates the propensity scores for the treatment and matches the treated with the
control observations. Thereafter, individual level treatment control comparisons are

114
constructed. The heterogeneity pattern is revealed through a nonparametric model by
estimating the treatment effect as a function of the propensity score (Brand and Thomas,
2013). This study made use of local polynomial regression to estimate a pattern of
treatment-effect heterogeneity.
6.4 Result and discussion
6.4.1 Farm characteristics and matching coffee producers
As shown in Table 6.1, the farm area allotted to coffee production was larger for the
members of the certified cooperatives, while they had less land covered by other crops.
Members of the certified cooperatives had larger numbers of productive and regenerating
coffee trees, as well as a higher proportion of coffee-related income. They were relatively
better educated and had more years of experience in coffee farming, whereas producers
in the control group had more family members actively helping them on the farm.
As previously mentioned, a matching algorithm proposed by Rosenbaum and Rubin
(1983) was used to identify a set of producers in the control group who are similar to treated
producers in terms of relevant household and farm characteristics, except for participation
in the cooperative, and hence participation in the certified and traceable market chain. A
test to validate the matching procedure was conducted by comparing the household
characteristics for farmers in the treatment group (i.e. members of, and selling their coffee
through, certified cooperatives) with similar characteristics for the control group.
Table 6.2 portrays the results of the Probit model that was used to match members
of the certified cooperative to those that were most comparable in the control group. It was
deduced that certain personal characteristics played a role in the likelihood to be a member
of a certified cooperative. Male, elderly, and better educated producers, with larger
families, were likely to be a member of a cooperative. Similarly, producers with more land
dedicated to coffee production and less to the production of other crops, were more likely
to be members. In contrast, producers located at further distances from credit institutions
had a higher tendency to market their coffee through certified cooperative channels.

115
Table 6.1 Mean difference in household and farm characteristics between treated and control group
Variable Treated Control t-statistics Mean Std. Dev Mean Std. Dev
Sex of the household head (0=male,1= female)
0.07 0.05 1.28
Age of the household head (number)
45.01 11.68 43.85 11.34 1.56
Education level of the household head (number)
4.67 3.21 3.11 2.67 6.61***
Family size (number) 5.67 2.19 5.09 2.04 3.31*** Dependency ratio (number) 0.37 0.22 0.36 0.22 0.45 Years of experience in coffee farming (number)
17.73 10.03 16.57 8.35 1.52
Radio ownership (1= yes, 0= no)
0.83 0.68 4.12***
Asset value up to 2009 (birr) 53147 80307.63 36748 42693.85 3.23*** Coffee share of total income 0.78 0.22 0.76 0.22 1.23 Wet-processed coffee price (birr) in 2010
9.71 1.22 9.27 1.67 3.71***
Coffee area (ha) in 2010 1.05 0.91 0.77 0.68 4.40*** Other crop area (ha) in 2010 0.83 0.75 0.95 0.76 -2.07*** Total regenerating coffee trees (number) in 2010
818.02 3079.89 583.55 1919.36 1.03
Total productive coffee trees (number) in 2010
3281 2540.35 2282 1879.72 4.59***
Total coffee production in 2009 (in kg)
1813 2247.05 1445 1761.75 2.29**
Wet-processed coffee production in 2009 (in kg)
683.69 1107.95 441.39 903.01 2.99***
Distance to the market (in minutes)
4.10 6.57 4.44 3.82 -0.94
Distance to the credit institution (in minutes)
22.90 39.18 12.43 8.03 4.77***
Extension contact (in number) 3.56 1.91 3.38 1.96 1.13 District (0 = Jimma, 1= Kaffa) 0.61 0.77 -4.45***
***, **, represent 1%, 5%, levels of significance

116
Table 6.2 Probit estimates of determinants of participation in certified coffee cooperatives
Coefficient P-value
Sex of the household head 0.638*** 0.005
Age of the household head 0.019*** 0.001
Education level of the household head (years of schooling)
0.129*** 0.000
Family size (number) 0.078** 0.012
Dependency ratio (number) -0.043 0.877
Years of experience in coffee farming 0.001 0.923
Asset value until 2009 0.000 0.124
Radio ownership (1= yes, 0= no) 0.312** 0.020
Extension contact (in number) 0.005 0.864
Distance to the credit institution (in km) 0.012*** 0.000
Distance to the market (in km) -0.002 0.865
Coffee area (ha) in 2010 0.271*** 0.001
Other crop area (ha) in 2010 -0.376*** 0.000
_cons -2.300*** 0.000
LR chi2(12) 136.4 Prob > chi2 0.00 Observation 621
Pseudo R2 0.159
Note: ***, **, indicate statistical significance at 1%, 5% respectively
The current study limits the samples to the common support region. These common
regions were constructed after removing the observations in the control group with a p-
score value of less than the minimum p-score value in the treated group. Likewise,
observations for the treated group with a p-score higher than the maximum p-score in the
control group were removed. As shown in figure 6.1, 17 observations for the treated group
fell outside the common region., whereas all of the control group observations fell within
the common region.
A. Full range area
0
.5
1
1.5
2
2.5
0 .2 .4 .6 .8 1
0
.5
1
1.5
2
2.5
kd
en
sity P
score
0 .2 .4 .6 .8 1 Propensity Score
Producer under conventional channels Certified and traceable producer channels

117
B. Common support area
Figure 6.1 Propensity scores distribution for traceable and non-traceable coffee producers before and after matching
6.4.2 Average impact of certification and traceability on producer’s welfare
The results of the average impact of certification and traceability on coffee producers’
welfare are displayed in Table 6.3. The overall benefits of marketing through certified and
traceable channels was given for variables of coffee production, and selected indicators
for human, physical, financial, natural, and social capital.
The negative impact of certification on coffee yield was found in the KM model.
Yields of non-cooperative producers were found to be significantly higher with an ATT of
1350.63kg. This may be as a result of the requirements of sustainable production and
harvesting procedures commanded by the coffee cooperatives (Ruben and Fort, 2012),
or, as mentioned during the fieldwork, caused by older plantations with limited regenerating
trees.
Members of certified cooperatives tend to sell more wet-processed coffee and less
dry-processed coffee. This is explained by the negative causality between certification and
traceability with dry-processed coffee production (van Rijsbergen et al., 2016). Moreover,
the price of wet-processed coffee was found to be generally higher for members of the
certified cooperatives. Figures 6.2 and 6.3 compare the price variance between member
producers and non-members. Most of the producers marketing though certified and
traceable channels were trading in a narrow price range, while there were more price
differences amongst that received by the conventional producers.
It is however of interest to note that the higher price that producers received for their
wet-processed coffee did not enable them to increase their gross coffee income above the
0
.5
1
1.5
2
2.5
kd
en
sity P
score
0 .2 .4 .6 .8 1 Propensity Score
Producer under conventional channels Certified and traceable producer channels

118
levels reached by non-members. This finding was also noted by, amongst others, Valkila
(2009) and Ruben and Fort (2012). In addition, the impact of cooperative membership on
net cash return was not significant. Coffee price, yield, and cost per hectare were taken
into consideration to calculate net cash returns from coffee. Thus, the impact of the
relatively higher price that the certified and traceable coffee producers received was not
sufficient to overcome lower yields and higher costs (Barham and Weber, 2012).
Figure 6.2 Price variance of wet-processed coffee between treated and control producers (Birr/kg)
Figure 6.3 Price variance of dry-processed coffee between treated and control producers (Birr/kg)
0
.2
.4
.6
kd
ensi
ty w
et c
off
ee p
rice
5 10 15 20 Average wet coffee price (Birr/kg)
Producer under certified and traceable channels Producer under conventional channels
0
.1
.2
.3
kd
ensi
ty d
ry c
off
ee p
rice
10 20 30 40 Average dry coffee price (Birr/kg)
Producer under certified and traceable channels Producers under conventional channels

119
The sales of coffee through the certified cooperatives did not impact on the gender
division of the decision-making within the household. Due to the slow behavioural change
in a farming household, investment in human capital is relatively low for coffee producers
(Donovan and Poole, 2014). The results on the impact of certification and traceability on
the physical capital of the coffee producers were more conclusive. The estimated asset
value of producer households since 2010 (after they started selling through a certified
channel) was found to be significantly higher for treated producers. Producers who were
members of the cooperatives seem to have owned more durable assets, as was also
shown by Kamau et al. (2010). However, the results were inconclusive in terms of how
certification and traceability increases agricultural assets.
The matching estimation results show that producers who are member of certified
cooperatives had significantly lower incomes from other crops as compared to non-
members. Participation in certified and traceable market channels appeared to have no
statistically significant differences in non-farm income. Interestingly, cooperative members
had more savings as compared to the non-members.
In addition, members of the certified cooperatives engaged more in land
conservation practices, tree planting, and organic fertiliser application as compared to non-
members. Furthermore, training and awareness creation provided by the certified coffee
cooperatives to members also enabled them to follow sustainable coffee production
practices. This finding was also highlighted by Donovan and Poole (2014). Finally, another
important effect was producers’ participation in social groups.

120
Table 6.3 Average impact of certification and traceability on coffee producer’s welfare
Variable Kernel Five nearest neighbors matching
Radius caliper
Difference S.E. t-stat Difference S.E. t-stat Difference S.E. t-stat
Coffee production outcomes
Coffee yield (kg/ha) -1350.63** (480.51)
590.06 -2.29 -633.04 (632.76)
603.95 -1.05 -957.69 (469.41)
642.44 -1.49
Wet-processed coffee production (Kg)
202.27* (90.40)
107.42 1.88 255.28** (112.55)
107.61 2.37 190.96* (102.90)
114.16 1.67
Dry-processed coffee production (Kg)
-601.77*** (272.40)
123.05 -4.89 -169.65* (113.48)
101.40 -1.67 -558.91*** (217.89)
135.95 -4.11
Average wet-processed coffee price(Birr/kg)
0.28* (0.15)
0.15 1.79 0.41** (0.22)
0.17 2.32 0.34* (0.15)
0.17 1.95
Average dry-processed coffee price(Birr/kg)
0.68 (0.52)
0.50 1.35 0.82 (0.72)
0.59 1.38 0.74 (0.47)
0.56 1.32
Gross coffee income per hectare(Birr/hectare)
-9563.31** (6450.54)
4302.59 -2.22 3243.51 (4343.55)
3883.52 0.84 -8277.83* (4806.97)
4673.56 -1.77
Cash cost per hectare(Birr/hectare)
14.40 (65.15)
10083.88
0.22 16.13 (105.15)
84.43 0.19 16.13 (57.90)
71.81 0.71
Net cash revenue per hectare(Birr/hectare)
-12172.80 (5929.92)
66.22 -1.21 -3588.07 (7874.72)
7516.62 -0.48 -7810.93 (4980.04)
11199.12 -0.70
Livelihood outcomes
Human capital
Decisions made by male(number)
-0.01 (0.04)
0.04 -0.24 -0.02 (0.05)
0.04 -0.58 -0.03 (0.04)
0.04 -0.75
Decisions made by female(number)
0.014 (0.02)
0.02 0.51 0.05* (0.02)
0.02 1.81 0.04 (0.018)
0.02 1.51
Physical capital
Asset value since 2010(Birr) 13263.96*** (2667.14)
2872.47 4.62 12724.60*** (5264.91)
3660.28 3.48 12672.93*** (2525.78)
3031.86 4.18
Durable asset since 2010(Birr)
13183.79*** (3039.56)
2873.21 4.59 12632.76*** (5675.43)
3661.37 3.45 12581.71*** (3234.84)
3032.64 4.15

121
Agricultural asset since 2010(Birr)
18.53 (14.66)
20.13
0.92 26.87 (22.16)
19.28 1.39 15.26 (15.13)
22.06 0.69
Financial capital
Income from other crops(Birr)
-4520.76*** (1989.03)
1609.90 -2.81 -4766.29** (2269.54)
2210.65 -2.16 -5084.42*** (2189.71)
1816.39 -2.80
Nonfarm income(Birr) -159.02 (880.48)
830.55 -0.19 348.070 (905.47)
764.49 0.46 -533.89 (837.35)
907.76 -0.59
Saving amounts(Birr) 3349.21*** (724.43)
747.80 4.48 2791.28*** (905.78)
791.00 3.53 3211.35*** (752.28)
748.51 4.29
Total gross income(Birr) -49750.00 (26879.07)
64457.01
-0.77 -78016.70 (110310)
93704.41 -0.83 -52166.20 (32074.03)
72990.40 -0.71
Natural capital
Practice land conservation practices(Yes/No)
0.14*** (0.03)
0.03 4.47 0.17*** (0.03)
0.03 4.64 0.15*** (0.03)
0.03 4.28
Number of trees planted(number)
46.08*** (13.62)
14.04 3.28 47.41** (23.86)
19.26 2.46 48.17*** (15.14)
14.69 3.28
Use organic fertilizer(Yes/No)
0.08* (0.05)
0.05 1.76 0.06 (0.06)
0.05 1.03 0.11** (0 .05)
0.05 2.04
Social capital
Satisfaction in social organizations(level)
0.20 (0.03)
0.15 1.34 0.08 (0.19)
0.18 0.45 0.15 (0.17)
0.16 0.93
Association membership(number)
0.11*** (0.01)
0.01 6.20 0.13*** (0.02)
0.02 5.78 0.12*** (0 .01)
0.02 5.92
Note: ***, **, * represent 1%, 5%, and 10% levels of significance
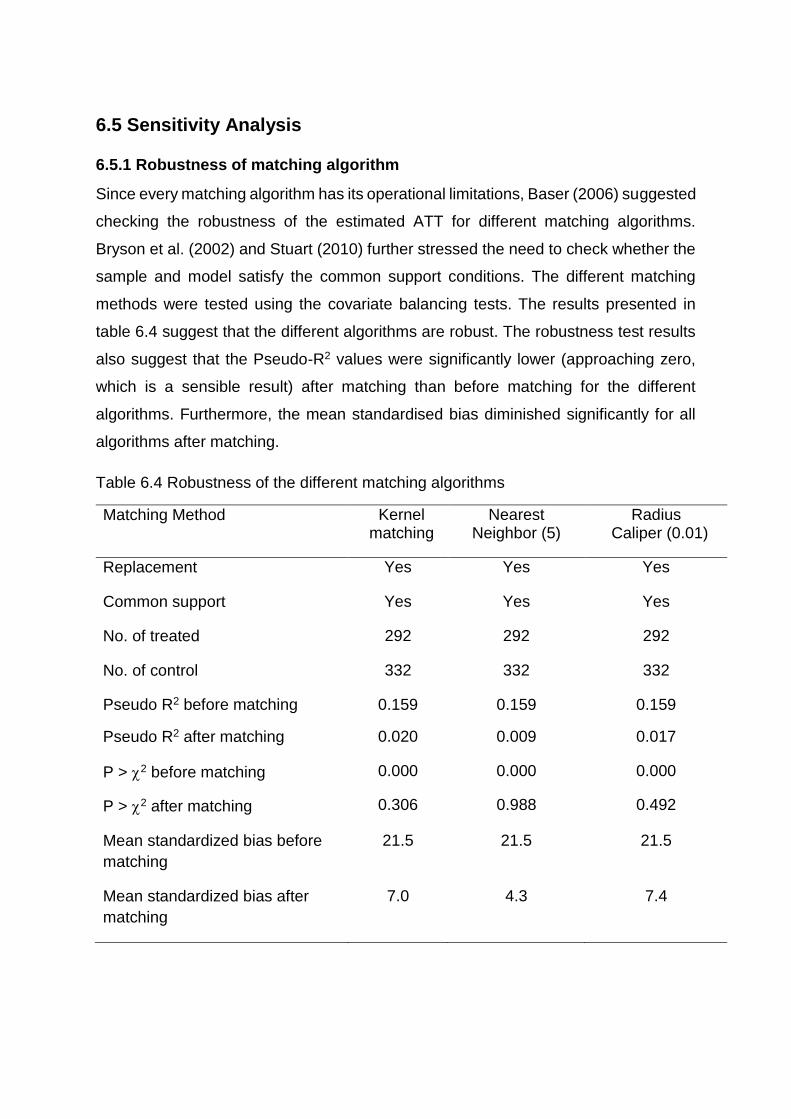
6.5 Sensitivity Analysis
6.5.1 Robustness of matching algorithm
Since every matching algorithm has its operational limitations, Baser (2006) suggested
checking the robustness of the estimated ATT for different matching algorithms.
Bryson et al. (2002) and Stuart (2010) further stressed the need to check whether the
sample and model satisfy the common support conditions. The different matching
methods were tested using the covariate balancing tests. The results presented in
table 6.4 suggest that the different algorithms are robust. The robustness test results
also suggest that the Pseudo-R2 values were significantly lower (approaching zero,
which is a sensible result) after matching than before matching for the different
algorithms. Furthermore, the mean standardised bias diminished significantly for all
algorithms after matching.
Table 6.4 Robustness of the different matching algorithms
Matching Method Kernel matching
Nearest Neighbor (5)
Radius Caliper (0.01)
Replacement Yes Yes Yes
Common support Yes Yes Yes
No. of treated 292 292 292
No. of control 332 332 332
Pseudo R2 before matching 0.159 0.159 0.159
Pseudo R2 after matching 0.020 0.009 0.017
P > 2 before matching 0.000 0.000 0.000
P > 2 after matching 0.306 0.988 0.492
Mean standardized bias before
matching
21.5 21.5 21.5
Mean standardized bias after
matching
7.0 4.3 7.4

123
6.5.2 Sensitivity of ATT to hidden bias
The aforementioned matching models may be biased as a result of unobservable farm
and household characteristics in which the two groups might differ. This may cast
doubt on the true impact of certification and traceability on the welfare of the coffee
producers (Caliendo and Kopeinig, 2008). Therefore, the Rosenbaum (2002) bounds
sensitivity tests were performed to check if the measured certification and traceability
impacts are distorted by hidden factors not observed in the dataset (Table 6.5).
Table 6.5 Sensitivity of ATT to unobserved bias
Rosenbaum bounds (rbounds) test estimates the gamma level to test the
hypothesis that the treatment impact is not affected by unobserved selection biases.
Gamma level is explained as the odds ratio of differential treatment assignment due
to an unobserved covariate. The critical levels of gamma () are shown in the last
column for the different welfare indicators that show significant differences between
the two groups. As shown in table 6.5 the lowest critical value of sensitivity analysis is
1.35–1.4, whereas the largest critical value is 10.6-10.75. The gamma level of 1.35–
1.4 shows that producers that have similar covariates must differ in their odds of
Variable Producers under certified and
traceable channels
Producers under
conventional channels
ATT Critical value of gamma
Coffee yield 2936.31 4361.43 -1425.12 (537.62)
4.8-4.85
Dry-processed coffee production
595.54 1000.82 -405.27 (233.79)
5.1-5.15
Asset value since 2010 22164.44 7589.30 14575.13 (3000.006)
1.4-1.45
Durable asset since 2010
22077.82 7607.74 15.96 (15.91)
1.35-1.4
Income from other crops
1375.08 5747.07 -4371.99 (1373.46)
10.6-10.7
Saving amount 3258.94 71.58 3187.35 (813.13)
1.35-1.4
Membership in social organizations
0.30 0.17 0.12 (0.017)
4.95-5
Practice land conservation practices
0.47 0.30 0.17 (0.02)
3.1-.3.15
Number of trees planted
126.19 83.34 42.85 (13.37)
1.7-1.75
124
certification and traceability by a factor of 35-40% to offset the positive significant effect
of certification and traceability on durable assets and savings. To this study, the critical
levels appear sufficiently high. Hence, as suggested by the sensitivity tests, the ATT
estimates for the welfare indicators seem robust to unobservable covariates.
6.6 Heterogeneous impact of certification and traceability
While computing the aforementioned ATT, it was assumed that certification and
traceability have a homogeneous effect on the coffee producers. However, previous
studies (Bernard, 2007; Abebaw and Haile, 2011; Brand and Davis, 2011; Mutuc,
2013; Verhofstadt and Maertens, 2014) have shown that even farm households in the
same treatment group, differ in their responses to the same interventions. To critically
evaluate the heterogeneity effect of the treatment, the current study applied the
heterogeneity models as developed by Xie et al. (2011), which include the SM-THE
and MS-THE as previously discussed.
6.6.1 Stratification Multilevel- Heterogeneous treatment effect
Following the SME-HTE method, the certification and traceability effect on the
producers’ welfare across the strata was estimated by the following the ordinary least
square (OLS) estimation equation:
Oab = Db + OaTi, Eq. 6
Where Oab is the expected value for an outcome variable, O, for the ath coffee
producer in the bth propensity score strata. Db is the Level-1 intercept and T represents
a variable for producers under certification and traceable channels. After calculating
equation six, the slope is used to estimate the heterogeneity pattern across the
different strata:
Oa =0 + i + εi, Eq. 7
Where Oa are the estimated level-1 slopes, 0 is the level-2 intercept, i is the level-2
slope, and εi represents an error term.
As shown in table 6.6 and appendix III, the wet-processed coffee production
increased significantly with increasing propensity to engage in certification and
traceability. Those producers between strata 3 and 6 increased their wet-processed
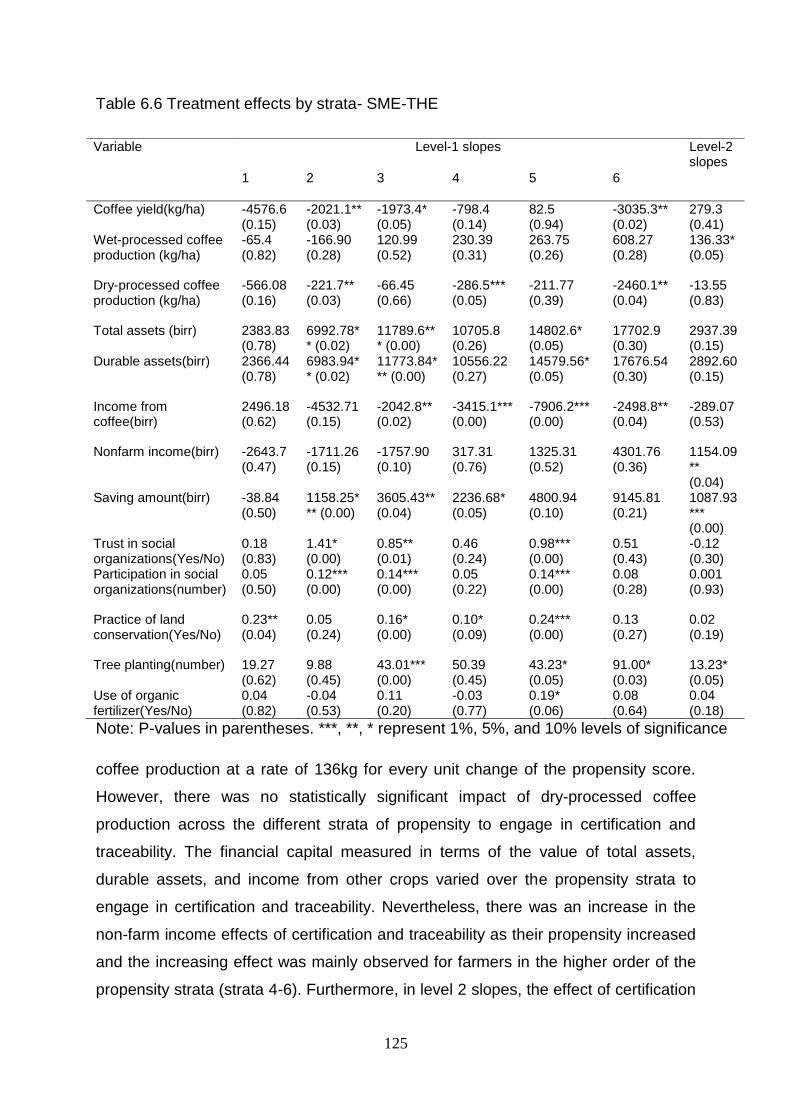
125
Table 6.6 Treatment effects by strata- SME-THE
Note: P-values in parentheses. ***, **, * represent 1%, 5%, and 10% levels of significance
coffee production at a rate of 136kg for every unit change of the propensity score.
However, there was no statistically significant impact of dry-processed coffee
production across the different strata of propensity to engage in certification and
traceability. The financial capital measured in terms of the value of total assets,
durable assets, and income from other crops varied over the propensity strata to
engage in certification and traceability. Nevertheless, there was an increase in the
non-farm income effects of certification and traceability as their propensity increased
and the increasing effect was mainly observed for farmers in the higher order of the
propensity strata (strata 4-6). Furthermore, in level 2 slopes, the effect of certification
Variable
Level-1 slopes Level-2 slopes
1 2 3 4 5 6
Coffee yield(kg/ha) -4576.6 (0.15)
-2021.1** (0.03)
-1973.4* (0.05)
-798.4 (0.14)
82.5 (0.94)
-3035.3** (0.02)
279.3 (0.41)
Wet-processed coffee production (kg/ha)
-65.4 (0.82)
-166.90 (0.28)
120.99 (0.52)
230.39 (0.31)
263.75 (0.26)
608.27 (0.28)
136.33* (0.05)
Dry-processed coffee production (kg/ha)
-566.08 (0.16)
-221.7** (0.03)
-66.45 (0.66)
-286.5*** (0.05)
-211.77 (0.39)
-2460.1** (0.04)
-13.55 (0.83)
Total assets (birr) 2383.83 (0.78)
6992.78** (0.02)
11789.6*** (0.00)
10705.8 (0.26)
14802.6* (0.05)
17702.9 (0.30)
2937.39 (0.15)
Durable assets(birr) 2366.44 (0.78)
6983.94** (0.02)
11773.84*** (0.00)
10556.22 (0.27)
14579.56* (0.05)
17676.54 (0.30)
2892.60 (0.15)
Income from coffee(birr)
2496.18 (0.62)
-4532.71 (0.15)
-2042.8** (0.02)
-3415.1*** (0.00)
-7906.2*** (0.00)
-2498.8** (0.04)
-289.07 (0.53)
Nonfarm income(birr) -2643.7 (0.47)
-1711.26 (0.15)
-1757.90 (0.10)
317.31 (0.76)
1325.31 (0.52)
4301.76 (0.36)
1154.09** (0.04)
Saving amount(birr) -38.84 (0.50)
1158.25*** (0.00)
3605.43** (0.04)
2236.68* (0.05)
4800.94 (0.10)
9145.81 (0.21)
1087.93*** (0.00)
Trust in social organizations(Yes/No)
0.18 (0.83)
1.41* (0.00)
0.85** (0.01)
0.46 (0.24)
0.98*** (0.00)
0.51 (0.43)
-0.12 (0.30)
Participation in social organizations(number)
0.05 (0.50)
0.12*** (0.00)
0.14*** (0.00)
0.05 (0.22)
0.14*** (0.00)
0.08 (0.28)
0.001 (0.93)
Practice of land conservation(Yes/No)
0.23** (0.04)
0.05 (0.24)
0.16* (0.00)
0.10* (0.09)
0.24*** (0.00)
0.13 (0.27)
0.02 (0.19)
Tree planting(number) 19.27 (0.62)
9.88 (0.45)
43.01*** (0.00)
50.39 (0.45)
43.23* (0.05)
91.00* (0.03)
13.23* (0.05)
Use of organic fertilizer(Yes/No)
0.04 (0.82)
-0.04 (0.53)
0.11 (0.20)
-0.03 (0.77)
0.19* (0.06)
0.08 (0.64)
0.04 (0.18)

126
and traceability on non-farm income increased by 1154 birr for every unit change in
the propensity strata.
The strongest significant effect of certification and traceability was observed on
producers’ savings level. Under level 1, the effect on savings was significant in all the
propensity strata except strata 1. The level 2 slope for producers’ savings significantly
increased at a rate of 1088 for every unit change in propensity strata (rank).
Furthermore, the level 2 slope for the certification and traceability suggested that also
tree planting increased, and it reached a maximum level in strata 6.
6.6.2 Matching Smoothing Heterogeneous Treatment Effects estimation
MS-HTE method has certain advantages over the SM-THE method. Unlike SME-HTE
that assumes different strata, MS-HTE assumes homogenous strata and makes
continues propensity score lines (Xie et al., 2011). In this study, coffee yield, dry-
processed coffee production, total assets, durable assets, income from other crops,
organisational membership, and practices of land conservation were not significant
under the SM-HTE approach, but they became significant in the MS-HTE model
(Appendix IV).
The negative effect of membership of certified cooperatives and traceability on
coffee yield was more important for farmers with the higher propensity scores.
Cooperative membership seems to have reduced dry-processed coffee production
significantly for those farmers with the highest propensity scores. This finding is
consistent with the SM-HTE results. The estimated value of total and durable assets
was higher amongst producers with certification and traceability. Moreover, farmers
with high propensity scores to participate in certification and traceability were less
affected in their income. In addition, membership of social organisations increased as
the propensity increased. Finally, certification and traceability had a positive effect on
participation in land conservation practices, yet this effect was lower for farmers with
high propensity levels.
6.7 Discussion and Conclusion
Certification and traceability are becoming mainstream in the global coffee industry.
Interventions involving certification and traceability to enhance the livelihood of the
coffee producers have a multidimensional impact. For this study, a matching model

127
was used to estimate how participation in certified and traceable coffee chains through
cooperative membership affected the producers’ livelihoods in different aspects.
Membership of certified cooperatives is believed to be strongly conducive to
increase human capital as a linking bridge for the sustainable partnership between the
producers and international buyers. Basic production knowledge (weed control,
pruning, stumping, mulching, soil and water conservation, and other related skills) are
needed for attaining the minimum quality standards set by the international buyers.
Most producers are reluctant to adopt production techniques that require high
operational costs (mostly labour), while others prefer to avoid risk and might not be
willing to reinvest their coffee income into coffee production. Hence, training and
strengthening human capital is of great importance. The Probit model indicated that
producers with higher levels of education are more likely to be members of a certified
cooperative. Yet, the propensity score model did not show any significant effects
Despite the sustainable production activities intensively adopted by the certified
and traceable producers, the coffee yield was much lower amongst cooperative
members as compared to the farmers in the control group. The older age
(approximately older than 20 years) of the coffee trees remains a challenge. The old
coffee trees are characterised by their high production volatility. Moreover, an effort to
replace the old and unproductive coffee trees with improved varieties is lagging. In
addition, the capacity of the farm households to invest in their coffee production was
limited since, on average, 70% of the households’ income comes from coffee
production.
Furthermore, the models suggest that cooperative members did not produce
more wet-processed coffee as compared to non-members. However, non-members
produced more dry-processed coffee. The focus and promotion of wet-processed
coffee production by the international coffee buyers made cooperatives gear their
resources towards wet processing. Thus, most of the cooperatives own washing
stations. Moreover, in the study area, the applicability of sustainable use of the water
and treating the waste water is becoming part of most traceable coffee cooperatives.
During the field visit, the researcher had the opportunity of viewing four cooperatives
that had installed a semi-washed processing plant with the help of Technoserve.
Regardless of the initial cost to purchase the pulper and demucilager unit, it is believed
that the semi-washed processing plant saves up to 80% of the water consumption.

128
In this study, coffee income accounts for, on average, more than 70% of
households’ income. Engagement in the certified and traceable coffee channels
enabled producers to fetch a better and more stable price for their wet-processed
coffee supply. Yet, this higher price was not sufficient to substantially increase coffee
income. In addition, the coffee income was not found to be significantly higher for
cooperative members. The lower income levels may partly be due to the low coffee
yield of certified and traceable producers. Furthermore, the quality requirements of the
cooperative may be more important, which may have affected the eventual amount of
coffee sold through the cooperative. To fully capture the financial position of the
households, the study also estimated the net cash returns from coffee and production
costs on inputs and labour. However, no significant differences were found.
Certification systems require coffee production to be sustainable. The current
study found differences between the farmers selling through the cooperatives, and
those who did not, in terms of their involvement in selective tree planting and land
conservation practices. Cooperative members were more inclined to perform activities
that could contribute to sustainable production. However, the lack of market-based
approaches to promote environmental conservation create the notion that the
sustainable coffee farming is not contributing to the well-being and economic
prosperity of the coffee farmers. Thus, the introduction of such ecosystem services
payment schemes could enhance the well-being of the coffee farmers and also protect
the ever-increasing threat posed by global climate change on the coffee growing
regions of Ethiopia.
The current results also indicate that farmers who are members of certified
cooperatives were on average the wealthier farmers. They had higher levels of saving,
and the estimated value of their assets was ultimately higher. As a final result, the
study also showed that the impact of being a member of a certified cooperative differed
greatly between the treated producers. The heterogeneity was analysed by comparing
the different outcome variables across the producers’ propensity to engage in
certification and traceability. The heterogeneity tests revealed that farmers with a high
propensity to engage in certified and traceable markets were more likely to supply
larger volumes of wet-processed coffee. Moreover, farmers with high propensity to
engage in certified markets were saving more, and possessed more assets.
In conclusion, the results from this study suggest that certification and
traceability of the coffee sold increased the price that the farmers received. Yet, the
129
impact of income was limited due to lower productivity levels. Cooperative members
sold wet-processed coffee instead of dry coffee, as was required by the cooperative.
Members were more inclined to employ sustainability measures which may become
beneficial for the producers in the long term. Hence, it cannot be concluded that trade
through traceability channels improves the welfare levels of the farmers involved as
compared to trade through ECX when measured by economic parameters. However,
the welfare effect of more stable prices of the wet-processed coffee should not be
underestimated, as well as the beneficial effects of increased involvement in
sustainable practices.

130
Chapter 7
Conclusion
131
7.1 Revisiting and answering research questions
This doctoral study aimed to assess the impact of the establishment of the Ethiopian
Commodity Exchange (ECX) on the price integration of Ethiopian coffees with the
international market, as well as the price integration across the regional Ethiopian
markets and across the main actors in the coffee chain. Furthermore, it aimed to
investigate how small-scale farmers might benefit from selling their coffee through
certified cooperatives, being the alternative market chain to the ECX. This section
revisits the research questions that were subsequently answered in the previous
chapters.
1. Analysis of the cointegration of Ethiopian coffee prices with the major
coffee exporting countries under origin differentials, before and after the
establishment of the ECX
Firstly, the researcher sought to investigate the price relationships of the different
Ethiopian export coffees in relation to the prices at which coffees are internationally
traded. Of particular interest was how these price relations may have changed with
the establishment of the ECX. Thus, the cointegration of the prices of four Ethiopian
export coffees (Harar, Yirgachefe, Sidama, and Jimma) and four international coffees
(Robusta, Other milds, Colombian milds, and Brazilian naturals) was analysed. An
autoregressive distributed lags model was used to conduct this analysis on the
monthly price data.
Q1. Did the cointegration of the prices on the Ethiopian coffee market with international
coffee prices change after the establishment of the ECX?
The results from the models for the pre-ECX period indicate that markets of all types
of Ethiopian coffee established a long-run cointegration with the prices of Arabica
coffees on the international markets. Despite the variety difference, Ethiopian coffees
like Jimma and Sidama were integrated with Robusta coffee in the pre-ECX period.
During the post-ECX period, all Ethiopian coffees, except Harar coffee, cointegrated
only with Arabica types of coffees (other milds, Colombian milds, and Brazilian
naturals). The price of Harar coffee did not integrate with the prices of any of the
Arabica coffee types on the international market. Moreover, Harar coffee is traded in
a different market and follows its own price trend. It is a premium and high quality

132
coffee that is in high demand at the Saudi market, which can explain the high prices it
fetches and its lack of cointegration with other international coffee markets.
The general expectation that most Ethiopian coffees would have adjusted to the
Brazilian coffee price on the international market could not be determined for the pre-
ECX period. However, Ethiopian coffee prices adjusted more to prices of other milds
coffees and Colombian milds. Similarly, in the post-ECX period, market distortions of
the prices for Colombian milds coffee directly triggered price adjustments for most of
the Ethiopian coffee types. This does not, however, indicate that price changes in the
Brazilian coffee market did not affect Ethiopian coffee prices.
Furthermore, one particular limitation of this study is that other macroeconomic
factors or trends, which could also have influenced the price integration, were not
taken into consideration. Moreover, the price integration study did not account for the
competitiveness of Ethiopian coffees in the international market versus other high
quality, branded specialty coffees. As such, the prices of Ethiopian coffees were
compared with those on the international market and, to a lesser extent, those of other
specialty coffees.
Q2. What kind of price behaviour and relationship exists between coffees of different
Ethiopian origin in the international coffee market?
Unlike most previous research, this study aimed to compare the prices of coffees from
different Ethiopian origins to the international market price. The results suggest that
prices of coffees from an origin known as lower quality adjusted more slowly to
international price changes of the different Arabica coffees in the pre-ECX period. In
contrast, coffees with origins known to produce better quality coffees seem to adjust
faster. However, the establishment of the ECX appears to have changed the levels of
cointegration. Thus, prices of coffees from areas known for their lower quality
corrected faster to price changes in the international market, while prices of origins
known for better quality coffee corrected slower. As previously mentioned, the price of
Harar coffee began to deviate from the international price trends since it was traded in
its particular niche market.
In sum, these findings showed how the Ethiopian coffees of different origin and
quality integrated in the international coffee market. Furthermore, the results suggest

133
that the prices of most of the Ethiopian coffees were able to establish a price
relationship with the international prices of Arabica type coffees. However, Harar
coffee, which is considered as the Ethiopian premium coffee type, did not establish a
price relationship with the international coffee market as it was able to establish its
own market.
2. Examine the extent of spatial price integration of major coffee-grower
markets in Ethiopia, before and after the establishment of the ECX
Q3. Does restriction of direct trade between coffee-growing regions affect the level of
price integration?
This study set out to investigate if the levels of spatial coffee market integration in
Ethiopia changed between 1998-2008 and 2008-2013 as a result of the establishment
of the ECX. The extent to which prices of different markets integrated, despite there
being a prohibition arbitrage trade between producer markets, was examined. The
relationships between prices at six producer markets located in the major coffee
producing areas of Ethiopia were studied using the bounds test approach. While most
of the literature on cointegration denotes arbitrage trade as a necessary condition for
a market to integrate (Goodwin and Piggott, 2001; Ghoshray and Ghosh, 2011), the
results of the models confirm that regional cointegration is possible. This is as a result
of the trade of these regional markets with a common central market that also
dispatches regular price information. The cointegration estimation shows that the
direct trade restriction after the establishment of the ECX has affected the
cointegration levels between the different regional coffee markets. However, the
restriction has strengthened regional coffee market integration.
Q4. Has the establishment of the ECX created a harmonised cointegration of prices
at regional coffee producers’ markets?
The results of the ARDL model indicate that 21 of the 30 pairs of price series
established a long-run cointegration relationship. Furthermore, the results suggest that
between 2008 and 2013, the regional integration of producer markets appeared to be
larger than national harmonisation. In addition, prices of the producer markets in
134
southern and south-western Ethiopia were more integrated. Another finding showed
that an opportunity has been created for relatively lower quality coffee producing
markets to establish a long-run, but limited, integration with higher quality coffee
markets. Premium quality coffee markets, like those for Harar coffee, dominated the
producer coffee market on establishing a long-run cointegration with coffees of other
regions.
Since the direct trade restriction between the coffee growing areas became more
stringent in the post-ECX period, it was hypothesised that price causality would be
limited. However, no difference was found in the levels of price causality results
between the two periods. In both of the analysed periods (before and after the
establishment of the ECX), all 15 pairs of producer markets established a causality
with their respective markets.
In sum, it was shown that spatially dispersed coffee markets integrate with each
other, without direct trade between them, through trading on a central market. The
ECX intended to create a single integrated Ethiopian coffee market, keeping the origin
variation. However, the attempt was not enough to create a complete integration,
rather an integration at the regional level was established.
The establishment of regional market integration was not surprising since coffee
traders may serve coffee markets in the different regions. In other words, coffee of one
region may be traded across the region’s borders or, in some cases, may even change
‘origin’. Such identification by origin is difficult to establish based on visual inspection
of the coffee beans. Thus, the intensity and effects of cross-regional-border trade of
coffee or by traders on price integration may be a subject for further investigation and
research.
3. Examine the dynamic relationship between the world and the domestic
markets for Ethiopian coffee after the introduction of the ECX
Q5. Has the price transmission along the coffee value chain changed for the different types
of Ethiopian coffees?
This section of the doctoral thesis aimed to investigate how the establishment of the
ECX impacted on the market integration and price transmission asymmetry between

135
different actors in the coffee value chain. The analysis was conducted for the five major
types of Ethiopian coffee. Theoretically, the establishment of the ECX is considered a
cornerstone in the creation of an institutionalised Ethiopian coffee market. The
institutionalisation was put in place to overcome the major constraints observed in the
coffee market, such as a lack of adequate market information, a lack of integration, a
lack of transparency, high marketing costs and transaction costs, a lack of trust
between buyers and sellers, collusion, and the dominance of exporters. Therefore, this
study examined whether or not the ECX had succeeded in improving price
transmission across the actors in the chain. A Nonlinear Autoregressive Distributed
Lag model (NARDL), as proposed by Shin et al. (2014), was used to capture the
asymmetric responses of the coffee producers, traders, and exporters to negative and
positive price changes on the coffee markets, both in the short- and the long-run.
Monthly price data at the producer, ECX, and export levels were analysed.
The findings suggest that there is a symmetric long- and short-run price
transmission between producers and the ECX price, excluding Harar coffee. The tests
further show asymmetric price relationships between producers and exporters of
higher quality coffees (Harar, Sidama, and Yirgacheffe). This may be due to the market
power of a small number of large companies at the export level. In addition, the ECX
aimed to increase the number of exporters in order to enhance the competitiveness of
the export market, yet the effects thereof are not yet visible in the studied prices.
Overall, the results show that there is a limited transmission of price increases at
the ECX and export level to the producer level. However, frequent transmission
towards producers is observed when there is a price decrease in the export market.
Hence, producers continue to be price takers in the Ethiopian coffee market, and
alternative measures to support them should guarantee that they could increase their
bargaining power and benefit from the price information that is increasingly
disseminated by the regional ECX offices.
Such measures to increase the bargaining power of producers could be
subjects for further research. It may also be interesting to investigate the role that the
ECX would play. The following section explains how de-commoditisation, as an
alternative to the ECX market channel, could improve the small-scale farmers’ welfare.
However, the potential of other market support measures, within the ECX channel, to
support farm gate prices should be investigated further.

136
4. Investigate the welfare impact of de-commoditisation on coffee producers
marketing through membership of traceable coffee cooperatives
Q6. How well do farmers fare if they sell their coffee through certified-traceable
cooperatives that are the alternative market channels to the ECX?
This research objective aimed to analyse the impact for farmers to market their coffee
through certified cooperatives. This chain is an alternative to the ECX and makes the
coffee traceable. Welfare and production data were compared between a group of
farmers who were members of certified cooperatives and those who sold coffee
through the ECX channel. Engagement in the certified and traceable coffee channels
enabled producers to fetch a better and more stable price for their wet-processed
coffee supply. However, this higher price was not sufficient to substantially increase
coffee income. Furthermore, coffee yield was lower for members of certified
cooperatives as compared to producers who sold to the ECX. One possible
explanation for this finding is the relatively older age of the coffee trees on the farms
of cooperative members.
The current study investigated if the variations in the intensity of participation in
a traceable and certified coffee market made any difference. The subsequent results
indicate that producers who are highly engaged in such markets are more inclined to
provide cherries for wet processing to the cooperatives, which is ultimately demanded
by the cooperative. These producers showed a tendency of specialising in coffee
production by allocating most of their resources to coffee production. They also
appeared to be less likely to be involved in the production of other crops. Generally,
producers who were highly likely to be members of cooperatives tended to focus on
achieving the criteria set by traceability and certification.
Two major challenges emerged from these findings. Firstly, while coffee sales
through a certified cooperative seems to benefit farmers in terms of price stability, the
impact on income is limited. Thus, the returns to investment in cooperative
membership are questioned. Secondly, the volume of coffee traded through this
alternative coffee chain is limited. Moreover, the share of coffee traded through the
certified cooperatives is low compared to the trade on the ECX.

137
A further limitation of this research is that it was not possible to determine
whether producers who sell coffee through a niche channel within the ECX would be
better off as compared to the cooperative members. It may be beneficial for small-
scale farmers to sell through the ECX channel to a particular exporter, as an alternative
to the cooperative channel. Thus, this may be areas of interest for future research.
7.2 Major research contributions
Cointegration literature proposes a nonlinear cointegration framework to check market
integration (Katrakilidis and Trachanas, 2012; Atil et al., 2014). However, the coffee
price data used in this study did not fit the model specifications. Therefore, an
appropriate linear cointegration model (Autoregressive Distributed Lag model) was
used instead to test the integration of Ethiopian coffees with the international coffee
market. This model confirms that data suitability needs to be tested for its fitness
before jumping into complex modelling, which could lead to spurious results.
Previous studies (Milas et al., 2004, Ghoshray, 2009) on the export coffee price
integration have considered the origin/ quality differences between the exporting
countries and forwarded possible explanations for the levels of cointegration. This
study explored the origin variation within Ethiopian coffees and examined the
integration with the international coffee market prices. Thus, this study contributes to
the existing literature by identifying how prices of different origin coffees from the same
country integrate in the international coffee market.
Furthermore, the spatial integration section of this study investigated how
spatially distant producer markets are integrated, even in the absence of direct trade
between regional coffee markets. Previous studies that have investigated spatial
integration without direct trade attributed the lack of trade between spatial markets to
transaction costs (Fackler and Goodwin, 2001; Stephens et al., 2012). This study,
however, is the first of its kind to explore price integration between coffee markets that
do not trade with each other due to a policy restriction. Therefore, this study contributes
towards filling a research gap by explaining that the establishment of spatial integration
is possible, even in the absence of direct trade, if the regional markets are connected
with the central market.
In addition, the price symmetry along the Ethiopian coffee value chain was
explored in this study. Nonlinearity and asymmetry in the short- and long-run was
examined with the use of the Nonlinear Autoregressive Distributed Lag model

138
(NARDL), as recently developed by Shin et al. (2014). As far as could be determined,
this is the first study to apply the NARDL model in investigating price symmetry in
African agriculture and food markets. Moreover, the current results explicitly portray
the power of the NARDL model in explaining the dynamics of price symmetry in African
markets.
Finally, the available literature on impact studies has been through continuous
changes in order to accommodate identified limitations. The heterogeneity model, as
developed by Xie et al. (2011), is one of the more recent impact analysis models to
address the gap in knowledge with regards to self-selection bias. Currently, it is the
first study in African agricultural markets to apply the model to investigate the
heterogeneity impact of policy intervention at the farmer’s level.
7.3 Policy recommendation
This doctoral study investigated the role of the ECX in the Ethiopian coffee market. It
also assessed how the establishment of the ECX influenced price relationships
between the Ethiopian and the international markets, between markets in coffee
producing areas, and between different stakeholders in the coffee market.
Furthermore, it analysed the impact of trading in an alternative market to the ECX.
Based on the research findings, the following policies and strategies can be
recommended.
The commoditisation at the ECX level remains a true challenge in order to fully
grasp the benefits of possible niche market (high end) coffee. Even though, the
commoditisation has a great advantage for low-value markets, the ECX could create
a separate platform that would serve as a gateway for high quality coffees that, in turn,
would warrant a better integration between producers and exporters. Furthermore,
premium Ethiopian coffee did not cointegrate with Arabica coffee. This finding,
however, does not pose a problem and may even be an advantage if the coffee is
traded in high rewarding niche markets, and as long as the price changes at the export
market transmits all the way down to the producer market. Thus, it is recommended
that the ECX, the Ethiopian government, and sector strategies focus on supporting
and incentivising stakeholders to actively participate in the increasingly important
niche coffee markets.
The high-quality nature of most of the Ethiopian coffee is an advantage to exploit
the higher-end markets. Yet, it is important to have more price differentiation and

139
quality premiums should be paid at the producer level. Producers should be able to
benefit from their efforts to produce good quality coffee, which would ultimately
motivate them to do so. In addition, traders should accept a differentiated supply from
the producers, and should not buy in bulk.
Moreover, the ECX could play an important role by facilitating quality
enhancement programmes focusing on both high-end and lower quality coffee types.
Such an endeavour may attract the support of international institutions who wish to
invest in quality improvements in a unilateral or multilateral manner.
In addition, addressing the lack of proper and functional grades and standards
for coffees transacted at the producer level is critical if the sector intends to increase
prices at the producer level. Producers are price takers as they sell their coffee to a
limited number of traders and cooperatives operating at the producer level, who
usually are the ones determining the quality and the price. Establishing a grading and
inspection centre closer to the farm gate level would encourage producers to
differentiate coffee quality and enhance the market transparency along the value
chain. The establishment of such grading labs has previously been successful in
cooperatives supported by USAID in southern Ethiopia.
Furthermore, it may be suggested that efforts to enhance the quality of the coffee
produced in different growing areas of Ethiopia may foster the harmonisation of the
national market integration (creating a single Ethiopian coffee market) alongside
capturing the benefits of origin-based coffee trade. Most of the coffee growing regions
are located in the Ethiopian highlands and are relatively close to each other. Thus, it
may be more difficult to strengthen price causalities between the more distant
producer markets. However, this may only be beneficial if a sufficiently reliable system
is in place that improves price cointegration between markets as well as enables origin
labelling.
The high price to be paid for a membership seat in the ECX also serves as a
filtering mechanism, in which only financially strong exporters enter the ECX, which
paves the way for collusion. Again, solely increasing the number of exporters does not
guarantee competitiveness at the export market, nor does it improve the transmission
of prices to the local markets. Therefore, it could be suggested that the ECX develops
and implements an effective pricing scheme so that competitiveness at the level of the
exporters within the ECX could be enhanced.

140
Previously, the ECX had made two attempts at improving the traceability of
coffee through the establishment of Direct Specialty Trade (DST) in 2010 and the
tagging system, both of which failed. The tagging system failed in 2015 due to a lack
of trust between the coffee traders and the government. This is an indication that the
ECX is not the most convenient institution to execute traceability. Furthermore, the
availability of donor supported traceable systems for a small segment of the coffee
producers that are marketing through cooperatives cannot guarantee a sustainable
supply of traceable coffee to the international market. Thus, the cooperative
traceability system should be internalised in the government cooperative system and
not should depend on the certification systems only. In addition, since the
commoditisation process along the coffee value chain influences the predictability of
the price movement and widens the price gap between producers and traders, policy
instruments that promote de-commoditisation have the power to mitigate such
problems.
Furthermore, market transparency through the provision of market information at
the producer level alone is not sufficient to empower the coffee producers. The
financial bargaining position of producers could thus be enhanced through supporting
producers’ associations, which are subsequently serving as a market outlet. Moreover,
supporting individual coffee producers at the farm level was not and is still not a cost-
effective way for an agrarian based economy.
The relatively higher coffee price received by producers marketing through
traceable and certified cooperatives could also not secure a higher income. This leads
us towards the root problem of lower yields per hectare. Since replacing the aging tree
stock with a new and improved variety takes time, during which no harvest is possible,
stakeholders could grant producers a long-term loan to smooth out the financial gap
until the new trees mature. In this regard, the recent work of root capital rehabilitation
and renovations in Nicaragua, Peru, Mexico, and Honduras serves as a successful
example for replacing the aging coffee trees. Moreover, the Colombian government,
in partnership with the Federación Nacional de Cafeteros de Colombia renovation
programme, is another success story that could be adopted (Rootcapital, 2016).
Another particularly important issue that still deserves our attention is the
sustainable use of water during wet processing of coffee. Wet-processed coffee is high
in demand in the international coffee market, which forces cooperatives and private
suppliers to expand their washing stations. Thus, the issue of sustainable use of the

141
water and treating the waste water deserves due attention. Alternative washing
stations could drastically reduce the need for water. Therefore, internalising the
sustainability issue in the licensing procedure of cooperatives and private washing
stations could be a feasible recommendation. In addition, the introduction of
ecosystem services payment schemes could enhance the well-being of the coffee
farmers, and subsequently protect the ever-increasing threat posed by global climate
changes on the coffee growing regions of Ethiopia.
7.4 Limitation and further study
Even though this doctoral study provided insights into the dynamics of the Ethiopian
coffee market after the establishment of the ECX, there is a need for further research.
For example, this study relies on the time series data obtained to explain the dynamics
of the Ethiopian coffee market. However, the current situation could not be determined
since the most recent data were not used.
It is also important to acknowledge that other factors that may have influenced
price cointegration during the time periods under study were not accounted for. For
instance, the improved flow of information may have resulted from an increased use
of mobile phones. It is likely that such improved lines of communication amplified the
impact of the ECX information services, however, it was not possible to quantify this
effect due to a lack of data.
Furthermore, the current results show a complete lack of long- and short-run
price transmission between the producer and the ECX, except for Harar coffee which
appears to have short-run price asymmetry. Such a lack of transmission could
emanate from the increased market power of the coffee traders, but this still needs to
be further investigated. The lack of price transmission may also be due to operational
inefficiency in the value chain, which was not investigated in the current study.
Moreover, the amount of data used to study price transmission and cointegration was
relatively small. It is therefore believed that a longer period of price data could provide
even more insights into the Ethiopian coffee market.
Finally, the score of this doctoral thesis was to enlighten the impact of the 2008
Ethiopian market policy reform on the performance of the coffee sector and more
specifically the contribution of ECX towards achieving the anticipated goals. Further

142
studies focusing on longer period of price data and taking the different macroeconomic
variables into consideration are recommended.

143
Appendices
Appendix I: Nonlinear cointegration test results (NARDL) of prices of Ethiopian coffees with prices of coffees on the international market
Ethiopian coffee
Coffee type
NARDL
Pre-ECX Post-ECX
Yirgachefe Robusta 3.23 2.35
Other Milds 3.10 1.14
Colombian 3.18 2.37
Brazilian 2.73 2.29
Jimma Robusta 1.70 6.60
Other Milds 0.80 0.63
Colombian 0.99 2.09
Brazilian 0.92 0.97
Sidama Robusta 1.58 2.36
Other Milds 1.58 1.62
Colombian 1.29 1.36
Brazilian 2.99 1.16
Harar Robusta 0.25 1.34
Other Milds 0.95 2.33
Colombian 1.04 0.33
Brazilian 0.97 0.32
Note: 7.84, 5.73, and 4.78 are the critical F statistic values for NARDL at the 1%, 5%,
and 10% levels, respectively.
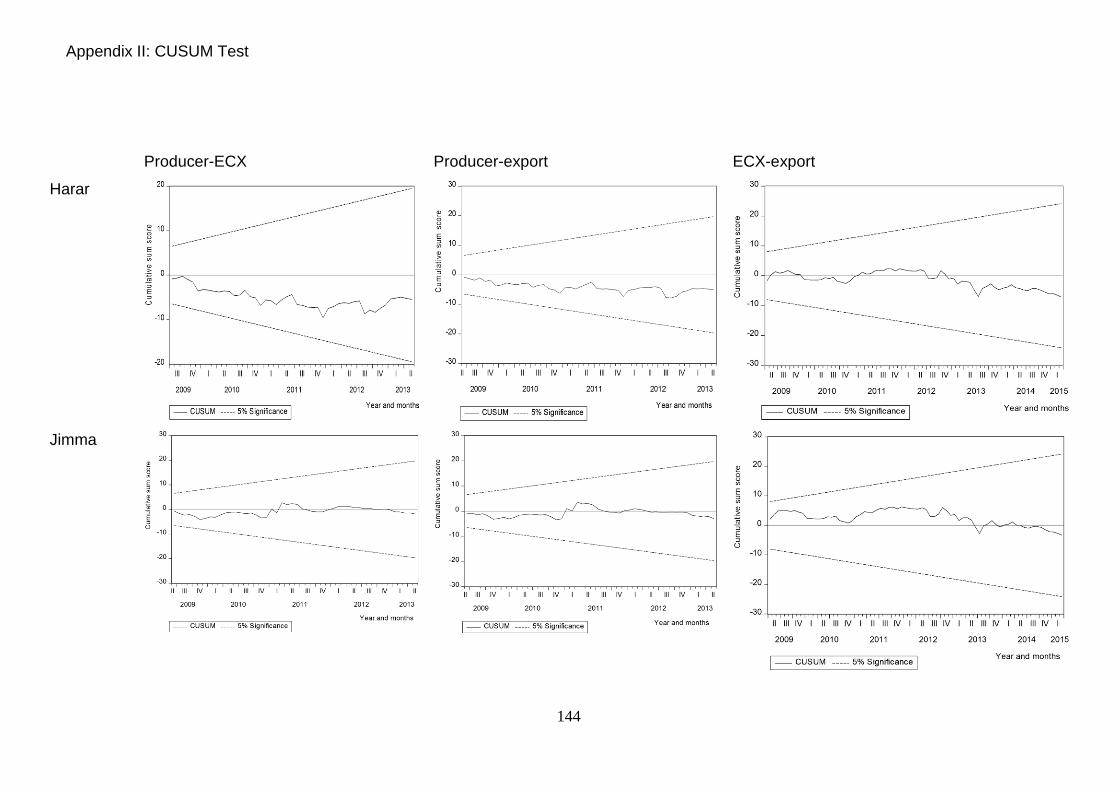
144
Appendix II: CUSUM Test
Producer-ECX Producer-export ECX-export
Harar
Jimma

145
Sidama
Wollega
~~----------------------------------------,
20
ä 10 ---------------------------------------------------------
E ii ~ iii
] :: ------------------------------------------------.JO
30
!!! §
20
E 10 :> .. -~ .12 :>
0 E :> 0
-10
-20
111 IV 111 IV 111 IV 111 IV
2009 2010 2011 2012 2013
1 -CUSUM - ---· 5% Significanee I Year and months
~--------------
------------------------------------------------------
111 N
2009
111 N
2010
111 IV
2011
1- - CUSUM - ---- 5% Significanee I
111 IV
2012
Year and r
20 ,_----------------------------------------~~
-----------------------·
~ 0 +"---..----~-
~
":: ---- ---~------ ---------
~ E ~
~ ~
111 IV 111 IV 111 IV 111 IV
2009 2010 2011 2012 2013
1- CUSUM ----- 5% Signifocance l Year and months
~~------------------,
20
10 -----------------------------------------------------
0 :: ----------------------------------------------------------
111 IV 111 IV 111 IV 111 IV
2009 2010 2011 20 12 2013
1- CUSUM ----· 5% Significanee I Year and months
~ -~ iii ~ :>
30 ~----------------------.
: --------------------------------------------------------
0 -10 -------
-20 ----------------------------------------------------------------------
11 111 IV 11 111 IV I 11 111 IV I 11 111 IV I 11 111 IV I 11 111 IV I
2009 2010 2011 2012 2013 2014 201 5
I -- CUSUM ----· 5% S ignificanee I Year and months
~
20 ! ~ E 10 ~
-----------------------------------------------------------------
î iii
~ 0
-10
-20 --------------------------------------
rJI II IIIIV I II III N I IIIIINIIIIIIrJIII IIIIV I
2010 2011 20 12 2013 2014 2015
1- CUSUM ----· 5% Significanee i Year and months

146
Yirgacheffe
30
20 !! §
~ 10
" ~ lij 0
~ "' u -10
-20
-30
-----------------------------------
~
------------------------------ § E i! -~ ;;
~
30 ~-------------------------------------,
20
0
u -10 ----~------------------------------------------------------------------------------20
111 IV 111 IV 111 IV 111 IV
111 IV 111 IV 111 IV 111 IV 2009 2010 2011 2012 2013
2009 2010 20 11 2012 1-CUSUM ----- 5% Significanee I Year and months
1-CUSUM ----- 5% Significanee j Year and me
30 ~-----------------------------------,
----------------------------------------------------
-20
-----------------------------------------
-~~~~~~~~~~~~~~~~~ IIIIIIVIII IIIIVIIIIIIIVIIIIIIIV I IIIIIIV I IIIII IV I
2009 2010 2011 2012 2013 2014 2015
1-- CUSUM ----- 5% Slgniftcance l Year and months
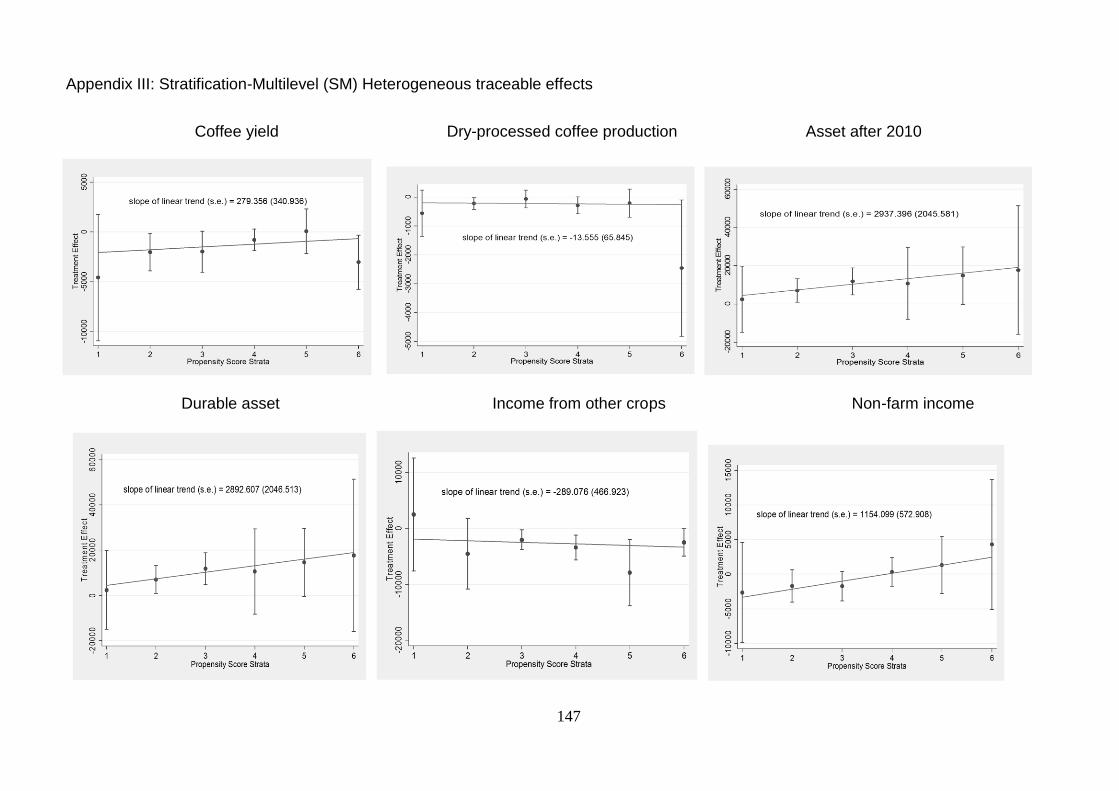
147
Appendix III: Stratification-Multilevel (SM) Heterogeneous traceable effects
Coffee yield Dry-processed coffee production Asset after 2010
Durable asset Income from other crops Non-farm income
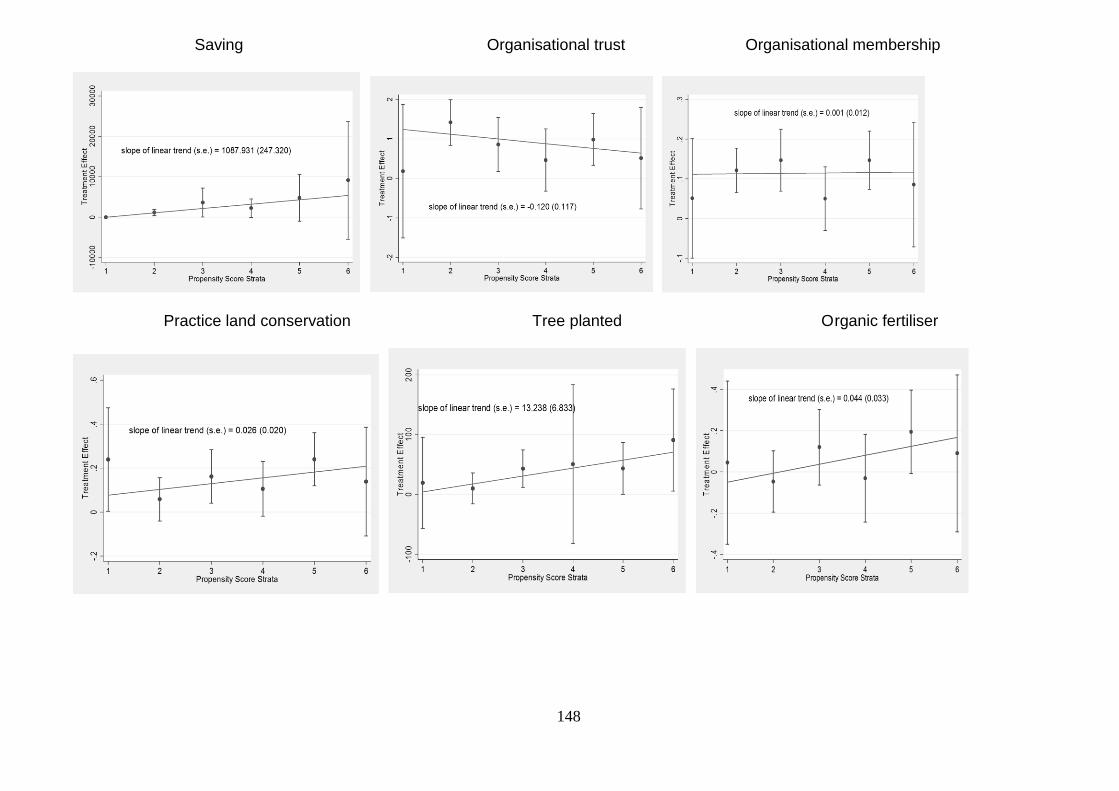
148
Saving Organisational trust Organisational membership
Practice land conservation Tree planted Organic fertiliser

149
Appendix IV: Matching-Smoothing (MS) Heterogeneous certification and traceability effect
0 coffee yield dry coffee 0 0 Total asset 0
0 0 0
<0 0 0 0 0 0 0
"" 0 0 0 0 0 0 0 ..,. 0
0 N
ÜO _ o .,o ~0 =g <.>0
(1)0 w,...
UJ ::=o
;: wo
"' ;: ;:~
E "' "' roo E E
~ n; n;o (1)0 "' >-- -o ,= >-o
0 0 0
0 "7 0
0 0
0 0
<:' 0
"7
0 0 0
0 0 0 0 0 0 0 0 0
'"r 0 <:' 0 .2 .4 .6 .8 <:'
0 .2 .4 .6 .8 .2 .4 .6 .8 Propensity Score Propensity Score Propensity Score
0 Durable asset = lncome trom other crops organizational trust 0 = 0 = 0 0 0 = M
0 0 0 0 0 = N
_o oe> u u Q>O 2 ~ ::::o w;: ;:;J= UJ _o c:: c::= ~0 Cl> Q)C>
E E;: § -;;;o -' ('0 ('0
~ ~ ~ I- I-= I-
0 0 0 = 0 0 0 = 0
<"':" "":" 0 0 0 0 0 = 0
0 ~
<"':" = = 0 .2 .4 .6 .8 c; 0 .2 .4 .6 .8 0 .2 .4 .6 .8
Propensity Score Propensity Score Propensity Score

150
organizational membership
~-------------------~
~ ,_------.-------,------,-------.-------. 0 .2 .4 .6
Propensity Score .8 0 .2
practice land conservalion
.4 .6 Propensity Score
.8

Appendix V: Balancing tests of matched samples
Variable Unmatched Matched
Mean % bias
%reduction bias
p>t
Treated Control
Sex of the household head (0=male,1= female)
Unmatched 0.076 0.051 10.2 0.202
Matched 0.077 0.084 -2.8 72.6 0.776
Age of the household head (number)
Unmatched 45.01 43.85 10.1 0.210
Matched 44.919 45.44 -4.6 54.6 0.607
Education level of the household head (number)
Unmatched 4.674 3.11 52.5 0.000*
Matched 4.48 4.66 -6.0 88.6 0.515
Asset value until 2009 (number)
Unmatched 53147 36748 25.4 0.001*
Matched 47466 50114 -4.1 83.8 0.585
Dependency ratio (number) Unmatched 0.377 0.366 4.6 0.572
Matched 0.380 0.369 4.6 -0.2 0.602
Years of experience in coffee farming (number)
Unmatched 17.73 16.57 12.6 0.116
Matched 17.47 17.94 -5.0 60.1 0.566
Family size (number) Unmatched 5.67 5.09 27.1 0.001*
Matched 5.55 5.62 -3.3 88.0 0.720
Radio ownership (1= yes, 0= no)
Unmatched 0.830 0.68 33.4 0.000*
Matched 0.818 0.822 -1.0 97.0 0.899
Coffee area (ha) in 2010 Unmatched 1.056 0.77 35.2 0.000*
Matched 0.941 0.970 -3.6 89.9 0.664
Other crop area (ha) in 2010 Unmatched 0.833 0.959 -16.6 0.040** Matched 0.810 0.839 -3.7 77.5 0.617
Distance to the market (in km)
Unmatched 4.10 4.44 -6.3 0.425
Matched 4.10 4.26 -3.1 51.4 0.719
Distance to the credit institution (in km)
Unmatched 22.90 12.43 37.0 0.000*
Matched 14.91 12.62 8.1 78.1 0.162 Extension contact (in number)
Unmatched 3.56 3.388 9.1 0.261
Matched 3.43 3.389 2.4 73.5 0.783
District (0 = Jimma, 1= Kaffa)
Unmatched 0.61 0.77 -35.4 0.00
Matched 0.59 0.59 -10.8 98.0 0.94

152
Reference
Abasanbi, A., 2010. Assessment of Coffee Quality and Its Related Problems in Jimma Zone of Oromia Regional State. Master Thesis Submitted to the School of Graduate Studies of Jimma University, College of Agriculture and Veterinary Medicines, Jimma University, Jimma.
Abdulai, A., 2007. Spatial and Vertical price transmission in food staples market chains in Eastern and Southern Africa: What is the evidence? Paper presented at the FAO Trade and Markets Division Workshop on Staple Food Trade and Market Policy Options for Promoting Development in Eastern and Southern Africa, Rome.
Abebaw, D., Haile, M.G., 2013. The impact of cooperatives on agricultural technology adoption: empirical evidence from Ethiopia. Food Policy, 38, 82–91.
Adinew, G., 2011. The Impact of the Ethiopian Commodity Exchange on Coffee Marketing: A Case of Eastern Ethiopia. A Case Study Report. Haramaya University School and Agricultural Economics and Agribusiness.
Adugna, G., Bellachew, B., Shimber, T., Taye, E., Kufa, T., 2008. Coffee diversity & knowledge, Ethiopian Institute of Agricultural Research, Addis Ababa, Ethiopia: 317-227.
Akiyama, T., Baffes, J., Larson, D.F., Varangis, P., 2003. Commodity Market Reform in Africa: Some Recent Experience. Economic Systems, 27(1), 83-115.
Alam, M.J., McKenzie, A.M., Buysse, J., Begum, I.A., Wailes, E.J., Van Huylenbroeck, G., 2012. Measuring Market Integration in the Presence of Threshold Effect: The Case of Bangladesh Rice Markets. Selected Paper prepared for presentation at the Agricultural & Applied Economics Association`s 2012 AAEA Conference, Seattle, Washington, USA.
Alemu, D., Meijerink, G., 2010. The Ethiopian Commodity Exchange: An Overview. Ethiopian Pulses, Oilseeds and Spices Processors Exporters Association and Wageningen University.
Alemu, M., 2015. Coffee Seed Production and Supply at Research Centre in Ethiopia. World Journal of Biology and Medical Sciences, Volume 2, Issue- 4, 82-88.
Alemu, Z.G., Worako, T.K., 2011. Producer price and price transmission in a deregulated Ethiopian coffee market. Agrekon, 50(2), 27-40.
Alexander, C., Wyeth, J., 1994. Cointegration and market integration: an application to the Indonesian rice market. Journal of Development Studies, 30 (2), 303–328.
Allison, M., 2009. Coffee-trade Switch in Ethiopia Disappoints Importers. The Seattle Times, 3 April. Available from: http://seattletimes.com/html/business technology /2008976281 _ ethi opia 03.html.
Amsalu, A., Ludi, E., 2010. The Effect of Global Coffee Price Changes on Rural Livelihoods and Natural Resource Management in Ethiopia A Case Study from Jimma Area. Retrieved from http://www.north-south.unibe.ch/content.
Ang, J., 2007. CO2 emissions, energy consumption, and output in France. Energy Policy, 35(10), 4772– 4778.
Arslan, A., Reicher, C., 2010. The Effect of the Coffee Trademarking Initiative and Starbucks Publicity on Export Prices of Ethiopian Coffee. Working paper No. 1606, Kiel Institute, March. Available from: http://www.ifw-members.ifw-kiel.de/ publications/the-effects-of-the-coffee-trademarking-initiative-and-starbucks-publicity-on-export-prices-of-ethiopian -coffee-1/kwp-1606.pdf
Asche, F., Bremnes, H., Wessells, C. R., 1999. Product aggregation, market integration and relationships between prices: an application to world salmon markets. American Journal of Agricultural Economics, 81(3), 568–581.

153
Atil, A., Lahiani, A., Nguyen, D.K., 2014. Asymmetric and nonlinear pass-through of crude oil prices to gasoline and natural gas prices. Energy Policy, 65, 567–573.
Awokuse, T.O., 2007. Market reforms, spatial price dynamics, and China's rice market integration: A causal analysis with directed acyclic graphs. Journal of Agricultural and Resource Economics, 32(1), 58–76.
Barham, B.L., Weber, J.G., 2012. The economic sustainability of certified coffee: Recent evidence from Mexico and Peru. World Development, 40 (6), 1269–1279.
Barrett, C.B., Li, J. R., 2002. Distinguishing between equilibrium and integration in spatial price analysis. American Journal of Agricultural Economics, 84(2), 292-307.
Bartlett, J.E., Kotrlik, J.W., Higgins, C.C., 2001. Organizational Research: Determining Appropriate Sample Size in Survey Research. Information Technology, Learning, and Performance Journal, Vol 19(1): 43-50.
Baser, O., 2006. Too much ado about propensity score models? Comparing methods of propensity score matching. Value in Health. 9:377–385.
Baulch, B., 1997a. Transfer cost, spatial arbitrage, and testing for food market integration. American Journal of Agricultural Economics, 79(2), 477-487.
Baulch, B., 1997b. Testing for Food Market Integration Revisited. Journal of Development Studies, 33, 512–34.
Benedetto, R., Romano, D., Raid, H., 2013. Agriculture reform and food crisis in Syria: Impacts on poverty and inequality. Food policy, 43, 190-203.
Bernard, T., Gabre-Madhin, E., Tafesse, A.S., 2007. Smallholders’ commercialization through cooperatives: A diagnostic for Ethiopia. IFPRI Discussion Paper 722. IFPRI (International Food Policy Research Institute), Washington, DC, USA.
Bernard, T., Taffesse, A.S., Gabre-Madhin, E., 2008. Impact of cooperatives on smallholders’ commercialization behavior: evidence from Ethiopia. Agric. Econ., 39, 147–161.
Bjerga, A., Patton, L., 2011. Ethiopia’s Starbucks Rivals Avoid Ethiopian Coffee as Beans Lose Cachet. Bloomberg, 1 Sept. Available at: http://www.bloomberg.com/ news/2011-09-01/starbucks-rivals-reject-ethiopian-coffee-as-bean-cachet-withers.html.
Blyn, G., 1973. Price Series Correlation as a Measure of Market Integration. Indian Journal of Agricultural Economy, 28(2), 56-90.
Boot, J.W., 2011. Ethiopian Coffee Buying Manual. Practical Guidelines for the Purchasing and Importing of Ethiopian Specialty Coffee Beans.
Brand, J.E., Davis, D., 2011. The Impact of College Education on Fertility: Evidence for Heterogeneous Effects. Demography, 48(3), 863-887.
Brand, J.E., Simon, Thomas J., 2013. “Causal Effect Heterogeneity”. Pp. 189–214 in Handbook of Causal Analysis for Social Research, edited by Stephen L. Morgan. New York: Springer.
Bryson, J.M., Cunningham, G.L., Lokkesmoe, K.J., 2002. What to do when stakeholders matter: the case of problem formulation for the African American men project of Hennepin county, Minnesota. Public Administration Review 62, 568-584.
Buhr, B.L., 2003. Traceability and information technology in the meat supply chain. Journal of Food Distribution Research, 34 (3), 13–26.
Caliendo, M., Kopeinig, S., 2008. Some practical guidance for the implementation of propensity score matching. Journal of Economic Surveys, 22 (1), 31–72.
Cashin, P., McDermott, C.J., Scott, A., 1999. The myth of co-moving commodity price. IMF Working paper 99/169. Washington DC: International Monetary Fund.
154
Celeste Aida, M. F., 2010. Trading Coffee through the Ethiopia Commodity Exchange: Social Embeddedness and Performativity of markets; Partial Fulfillment of the Requirements for the Masters of Arts in Development Study, Netherlands, 2010.
Central Statistics Agency, 2014. Population and housing census, statistical abstract, Addis Ababa, Ethiopia.
Chernet, T., 2008. Land Resources and socio-economic report of Bonga, Boginda, Mankira and the surrounding areas in Kaffa zone, SNNPRS, Ethiopia. Report for PPP project on the establishment of a Coffee Biosphere Reserve in Bonga Region. Addis Ababa, Ethiopia.
Chiputwa, B., Spielman, D.J., Qaim, M., 2015. Food standards, certification, and poverty among coffee farmers in Uganda. World Development, 66 (1), 400–412.
Delgado, C.L., 1986. A variance components approach to food grain market integration in Northern Nigeria. American Journal of Agricultural Economics, 68(4), 970–979.
Dennis, R., 2007. Literature Survey on biological data Bonga, Boginda and Mankira Forest, Kafa, Ethiopia. and research carried out in Bonga area, Kafa, Addis Ababa, Submitted to PPP Project, pp: 9-10. Ethiopia, pp: 5-8.
Dercon, S., 1995. On Market Integration and Liberalization: Method and Application to Ethiopia. Journal of Development Studies, 32(1), 112-43.
Dickey, D.A., Fuller, W.A., 1981. Distribution of the estimators for autoregressive time series with a unit root. Econometrica, 49, 1057-72.
Donovan, J., Poole, N., 2014. Changing asset endowments and smallholder participation in higher value markets: Evidence from certified coffee producers in Nicaragua. Food Policy, 44, 1–13.
Ellis, F., 1992. Agricultural policies in developing countries, Cambridge, Cambridge University Press.
Ellis, F., 2000. Rural Livelihoods and Diversity in Developing Countries, Oxford: Oxford University Press.
Emran, M.H., Shilip, F., Alam, M.I., 2007. Economic liberalization and price response of aggregate private investment, time series evidence from India. Canadian Journal of Economics, 40(3), 914–934.
Engle, R.F.,1982. Autoregressive conditional hetero skedasticity with estimates of the variance of United Kingdom inflation. Econometrica 50, 987–1007.
Engle, R.F., Granger, C.W.J., 1987. Cointegration and Error Correction: Representation , Estimation and Testing. Econometrica, 55(2), 251-276.
Ethiopian Coffee Exporters Association (ECEA), 2013. Coffee export marketing in Ethiopia. Annual report. Addis Ababa.
Ethiopia Commodity Exchange (ECX), 2008. What is in A Bean? ECX and Specialty Coffee Market.
Ethiopia Commodity Exchange (ECX), 2009. Company profile. Retrieved from http://www.ecx.com.et/CompanyProfile.aspx
Ethiopia Commodity Exchange (ECX), 2010a. Retrieved from<http://www.ecx.com.et/>.
Ethiopian Commodity Exchange (ECX), 2010b. ECX Direct Specialty Trade (DST). Available at: http://www.ecx.com.et/downloads/contracts/Coffee/CoffeeContracts .pdf
Ethiopia Commodity Exchange (ECX), 2015. Ethiopia Commodity Exchange Coffee Contract. Retrieved from http://www.ecx.com.et/downloads/Contracts/Coffee/ CoffeeContracts.pdf
Fackler, P.L., Goodwin, B.K., 2001. Spatial price analysis. In Handbook of Agricultural Economics, vol. 1B, ed. B. Gardner and G. Rausser, 971-1024, Amsterdam: Elsevier Science.

155
Fackler, P.L., Tastan, H., 2008. Estimating the Degree of Market Integration. American Journal of Agricultural Economics, 90(1), 69-85.
Fafchamps, M., Hill, R.V., 2007. Price transmission and trader entry in domestic commodity markets. Economic Development and Cultural Change, 56(4), 729-766.
Fousekis, P., 2015. Spatial price transmission in major EU pig meat markets: An Empirical Investigation with a Non Parametric Approach. International Journal of Applied Economics, 12(1), 108-122.
Fousekis, P., Katrakilidis, C., Trachanas, E., 2016. Vertical price transmission in the US beef sector: Evidence from the nonlinear ARDL model. Economic Modelling, 52, 499-506.
Frenette, B., 2010. The Grind: Ethiopian Coffee Finds Its Way. National Post, 23 Sept. Available at: http://life.nationalpost.com/2010/09/23/the-grind-ethopian-coffee-finds-its-way/.
Fry, J.M., Lai, B., Rhodes, M., 2011. The interdependence of coffee spot and futures markets. International network for economic research Working Paper Series.1. Available at http://www.inferresearch.net/files_ publications fry%20et /%20al.%20
INFER% 20 WP% 202011.1.pdf. Gabre-Madhin, E., 2012. A market for Abdu: Creating a commodity exchange in
Ethiopia. Intl Food Policy Res Inst, 2012. Gabre-Madhin, E., Goggin, I., 2005. Does Ethiopia need a Commodity Exchange? An
integrated approach to market development. EDRI-ESSP Policy Working Papers (p.26), Washington D.C.: IFPRI.
Gebreselassie, S., Ludi, E., 2008. Agricultural Commercialization in Coffee Growing Areas of Ethiopia, Future Agriculture, University of Sussex, Brighton, UK, available at: http://r4d.dfid.gov.uk/PDF/ Outputs/Futureagriculture/coffee_paper.pdf.
Gellynck, X., Verbeke, W., 2001. Consumer perception of traceability in the meat chain. Agrarwirtschaft, 50 (6), 368–374.
Gemech, F., Struthers, J., 2007. Coffee Price Volatility in Ethiopia: Effects of Market Reform Programmes. Journal of International Development, 19(8), 1131–42.
Getnet, K., 2008. From market liberalization to market development: The need for market institutions in Ethiopia. Economic Systems, 32(3), 239–252.
Getnet, K., 2007. Spatial equilibrium of wheat markets in Ethiopia. African Development Review. 19(2), 281–303.
Getnet, K., Verbeke, W., Viaene, J. 2005. Modeling spatial price transmission in the grain markets of Ethiopia with an application of ARDL approach to white teff. Agricultural Economics, 33, 491–502. DOI: 10.1111/j.1574-0864.2005.00469.x
Ghoshray, A., 2009. On Price Dynamics for Different Qualities of Coffee. Review of Market Integration, 1 (1), 103-118.
Ghoshray, A., Ghosh, M., 2011. How Integrated is the Indian Wheat Market?, Journal of Development Studies, 47(10), 1574-1594.
Giles, J.A., Mizra, S., 1998. Some pretesting issues on testing for Granger non -causality. Econometric Working Papers, EWP9914, Department of Economics, University of Victoria, Canada.
Goletti, F., Ahmed, R., Farid, N., 1995. Structural Determinants of Market Integration: The Case of Rice Markets in Bangladesh. Developing Economies, 33, 185–202.
Gonzalez-Rivera, G., Helfand., S.M., 2001. The extent, pattern, and degree of market integration: a multivariate approach for the Brazilian rice market. American Journal of Agricultural Economics, 83(3), 576-92.
Goodwin, B.K., Piggot, N., 2001. Spatial market integration in the presence of threshold effects, American Journal of Agricultural Economics, 83(2), 302-317.

156
Granger, C.W.J., Newbold, P., 1974. Spurious Regression in Econometrics. Journal of Econometrics, 2(2), 111-20.
Greenwood-Nimmo, M.J., Shin, Y., 2013. Taxation and the Asymmetric Adjustment of Selected Retail Energy Prices in the UK. Economics Letters 121(3), 411-416.
Hamza, A., Azenaw, T., 1995. Structural adjustment policy and Ethiopian agriculture: an assessment of short- run response and structural problems. Proceedings of the fourth annual conference on the Ethiopian economy, Addis Ababa.
Hanmer, L., Nashold, F., 2000. Attaining the international development targets: Will growth be enough?' Development Policy Review, 18(1), 11-36.
Harriss, B., 1979. There is Method in My Madness: Or is it vice versa? Measuring Agricultural Market Performance. Food Research Institute Studies, 17(2), 197-218.
Heckman, J.J., Ichimura, H., Todd, P.E., 1997. Matching as an econometric evaluation estimator: Evidence from evaluating a job training program. Review of Economics Studies, 64(4), 605-654.
Hernandez, M.A., Rashid, S., Solomon, L., Kuma, T., 2015. Institutions and Market Integration: The Case of Coffee in the Ethiopian Commodity Exchange. IFPRI Discussion Paper 1464.
International Food Policy Research Institute (IFPRI), 2003. Getting markets right: an institutional and legal analysis of grain and coffee marketing in Ethiopia. New York: IFPRI.
International Coffee Organization (ICO), 2014a. World coffee trade (1963 – 2013): A review of the markets, challenges and opportunities facing the sector. International Coffee Council 112th Session 3 – 7 London, United Kingdom.
International Coffee Organization (ICO), 2014b. Monthly coffee report (March). Retrieved from http://dev.ico.org/documents/cy2013.
International Coffee Organization (ICO), 2014c. Coffee consumption in East and Southeast Asia: 1990 – 2012. Retrieved from http://www.ico.org/news/icc.
International Coffee Organization (ICO), 2016. Trade statstics table. Retrieved from http://www.ico.org/trade_statstics.asp.
Ismet, M., Barkley, A.P., Llewelyn, R.V., 1998. Government Intervention and Market Integration in Indonesian Rice Markets, Agricultural Economics, 19(3), 283-295.
International Organization for Standardization(ISO), 2000. International Standard ISO 9000: Quality management systems Fundamentals and vocabulary.
Jaffry, S., 2005. Asymmetric Price Transmission: A Case Study of the French Hake Value Chain. Marine Resource Economics 19(4), 511-523.
Jammazi, R., Lahiani, A., Nguyen, D., 2015. A wavelet-based nonlinear ARDL model for assessing the exchange rate pass-through to crude oil prices. Journal of International Financial Markets, Institutions and Money, 34, 173-187.
Jena, P.R., Stellmacher, T., Grote, U., 2012. The Impact of Coffee Certification on Small-Scale Producers Livelihoods: Evidence from Ethiopia. International Association of Agricultural Economists (IAAE) Conference, Foz do Iguaçu, Brazil, August, 2012. Available at: http://tinyurl.com/kwal37d.
Jensen, R., 2007. The Digital Provide: Information, Market Performance, and Welfare in the South Indian Fisheries Sector. The Quarterly Journal of Economics, 122(3), 879-924.
Johansen, S., Juselius, K., 1988. Hypothesis Testing for Cointegration Vectors-With an Application to the Demand for Money in Denmark and Finland, Preprint University of Copenhagen.
Jones, W.O., 1973. Marketing Staple Food Crops in Tropical Africa. The Economic Journal, 83 (332), 1326-1328.

157
Kamau, M.W., Mose, L., Fort, R., Ruben, R., 2010. The impact of certification on smallholder coffee farmers in Kenya: The case of “UTZ” certification program. Paper presented at African Association of Agricultural Economists (AAAE). Cape Town, South Africa.
Karanja, A., Kuyvenhoven, A., Moll, H., 2003. Economic Reforms and Evolution of
Producer Prices in Kenya: An ARCH‐M Approach’, African Development Review, 15: 2–3, 271–96.
Katrakilidis, C., Trachanas, E., 2012. What drives housing price dynamics in Greece: New evidence from asymmetric ARDL cointegration. Economic Modelling, 29(4), 1064-1069.
Kibret, H., Wakiaga, J., Admit, W.Z., 2015. “Ethiopia 2015”, in African Econmic Outlook Country Notes, retrieved from http://www.africaneconomicoutlook.org/en/country-notes/ethiopia.
Kilima, F.T.M., 2006. Are price changes in the World Market transmitted to markets in less developed countries? A case study of sugar, cotton, wheat and rice in Tanzania. IIIS Discussion paper 160, institute for international integration studies.
Krivonos, E., 2004. The Impact of Coffee Market Reforms on Producers' Prices and Price Transmission. Policy Research Working Paper No. 3358. Washington, DC: World Bank.
Krueger, A.O., Schiff, M., Valdes, A., 1988. Agricultural invectives in developing countries: Measuring the effect of sectoral and economy wide policies, World Bank Economic Review, 2:255-271.
Kufa, T., 2012. Recent coffee research development in Ethiopia, Presentation at the “Ethiopian Coffee Export Conference: Strengthening the Legacy of Our Coffee, Addis Ababa.
Lazzarini, S.G., Chaddad, F.R., Cook, M.L., 2001. Integrating Supply Chain and Network Analysis: The Study of Netchains. Journal on Chain and Network Science 1(1), 7-22.
Le Goulven, K., 2001. Institutions and price transmission in the Vietnamese hog market. International Food and Agribusiness Management Review, 2(¾), 375–390.
Lele, U.J., 1972. Food Grain Marketing in India: Private Performance and Public Policy. Indian Economic Review, New Series, 7(2), 224-226.
Lemessa, D., 2000. Field Assessment Report: Jimma Zone of Oromia Region. UN-Emergencies Unit for Ethiopia.
Leung, L., 2014. Eroded Coffee Traceability and Its Impact on Export Coffee Prices for Ethiopia (No. 2014-04). JDI Executive Programs.
Li, J.F., Lin, Z.X., 2015. The impact of sales tax on economic growth in the United States: an ARDL bounds testing approach, Applied Economics Letters, 22:15, 1262-1266. DOI:10.1080/13504851.2015.1023933
Li, X., Saghaian, S., 2013. The Dynamics of Price Transmission in the Presence of a Major Quality Differential: The Case of Colombian Milds and Vietnamese Robusta Coffee Beans. Journal of Agribusiness, 1(31), 181-192.
Lohano, H.D., Mari, F.M., 2006. Testing Market Integration in Regional Onion Markets of Pakistan: Application of Error Correction Model in the Presence of Stationarity, International Research Journal of Finance and Economics, 1: 89-97.
Love, R., 2001. The Ethiopian Coffee Filière and Its Institutions. Cui Bono? Review of African Political Economy, 28(88), 225–40.
Maro, G., Mrema, J., Msanya, B., Teri, J., 2014. Farmers’ perception of soil fertility problems and their attitude towards integrated soil fertility management for coffee in

158
northern Tanzania. Tropical and Subtropical Agroecosystems, North America, 17, apr. 2014. Available at: <http://www.ccba.uady.mx/ojs/index.php/TSA/article/view/
1485>. Mavrotas, G., Kelly, R., 2001. Old Wine in New Bottles: Testing Causality Between
Savings and Growth. The Manchester School, 69: 97–105. doi: 10.1111/1467-9957.69.s1.6
McKenzie, D., Yang, D., 2010. “Experimental Approaches in Migration Studies.” Policy Research Working Paper Series No. 5395.Washington, DC:World Bank Migration Policy Institute, MPI Data Hub. Retrieved from http://www.migrationinformation.Org /datahub /re mittances.cfm.
Meijerink, G.W., Alemu, D., Van Der Mheen-Sluier, J., Wijnands, J., 2010. Institutional innovation in African markets: can commodity exchanges address sustainability issues? Paper prepared for presentation at the 119th EAAE seminar ‘Sustainability in the food sector: rethinking the relationship between the agro-food system and the natural, social, economic and institutional environments’, Capri, Italy.
Mengistie, G., 2011. Intellectual Property as a Policy Tool for Development the Ethiopian Fine Coffee Designations Trade Marking & Licensing Initiative Experience.
Meuwissen, M.P.M., Velthuis, A.G.J., Hogeveen, H., Huirne, R.B.M., 2003. Traceability and Certification in Meat Supply Chains. Journal of Agribusiness, 21, 167–81.
Mezlekia, W., 2011. Ethiopia: Operation “bulk coffee” busted. Poor Farmers. Web log post, 22 December. Available at: http://nazret.com/blog/index.php/2011/12/22 /ethiopia-operation-bulk-coffee-busted?blog=15.
Mezui, C.A.M., Rutten, L.S., Sekioua, J., Zhang, M.M., N’Diaye, N., Kabayane, Y., Arvantis, U. D., Nekati, B., 2013. Guidebook on African Commodity and Derivatives Exchanges. African Development Bank, Tunis.
Milas, C., Otero, J., Panagiotidis, T., 2004. Forecasting the spot prices of various coffee types using linear and nonlinear error correction models. International Journal of Finance and Economics, 9(3), 277–288.
Ministry of Finance and Economic Development (MoFED), 2009. Ethiopia: Building on Progress: A Plan for Accelerated and Sustained Development to End Poverty (PASDEP). Annual Progress Report 2007/08. MOFED Addis Ababa.
Minten, B., Tamru, S., Kuma, T., Nyarko, Y., 2014. Structure and performance of Ethiopia’s coffee export sector. EDRI-EFPRI Working Papers (66). IFPRI-Addis Ababa.
Mofya-Mukuka, R., Abdulai, A., 2013. Effects of Policy Reforms on Price Transmission in Coffee Markets: Evidence from Zambia and Tanzania, Food Security Collaborative Working Papers 171870, Michigan State University, Department of Agricultural, Food, and Resource Economics.
Mutuc, M., Rejesus, R.M., Yorobe, Jr.J.M., 2013. Which farmers benefit the most from Bt corn adoption? Estimating heterogeneity effects in the Philippines. Agricultural Economics, 44(2), 231–239.
Narayan, P., 2005. The saving and investment nexus for China: evidence from cointegration tests. Applied Economics, 37(17), 1979–1990.
Negassa, A., 1998. Vertical and spatial integration of grain markets in Ethiopia: Implications for Grain Market and Food Security Policies. Working paper presented at the grain market research project of the ministry of economic development and cooperation, Ethiopian, Addis Ababa.
Negewo, A., 1993. A review of coffee marketing structure in Ethiopia. Addis Ababa, Ethiopia (unpublished).

159
Nelson, C.R., Plosser, C., 1982. Trends and Random Walks in Macroeconomic Time Series, Journal of Monetary Economics, 10, 139-162.
Nielsen, H.B., 2005. Non-stationary time series, cointegration and spurious regression. Retrieved October 2011, from http://www. econ. ku.dk/metrics/Econometrics 2_05_II/ Slides/10cointegration_2pp. pdf
Nigussie, G., 2011. Marketing Information Operation in Ethiopia with special reference to the Ethiopia Commodity Exchange (ECX) Coffee Trading. Master Thesis Submitted to Swedish University of Agricultural Sciences.
Onis, Z., Senses, F., 2005. Rethinking the emerging post-Washington consensus. Development and Change, 36(2), 263-290.
Opara, L.U., 2003. Traceability in agriculture and food supply chain: a review of basic concepts, technological implications, and future prospects. Food Agriculture and Environment, 1 (1), 101–106.
Opara, L.U., Mazaud, F., 2001. Food traceability from field to plate. Outlook on Agric. 30(4), 239-247.
Otero, J., Milas, C., 2001. Modelling the spot prices of various coffee types. Economic Modelling, 18(4), 625–641.
Palaskas, T., Harris –White, B., 1993. Testing Market Integration: New Approach with Case Material for the West Bengal Economy. Journal of Development Studies, 30 (1), 1-57.
Paul, I., 2011. An assessment of the opportunities and challenges of the Ethiopian commodity exchange. Journal of Sustainable Development in Africa, 13(1), 1520-5509.
Peltzman, S., 2000. Prices Rise Faster than They Fall. Journal of Political Economy, 108(3), 466-502.
Pesaran, M.H., Shin, Y., 1996. Cointegration and speed of convergence to Equilibrium. Journal of Econometrics, 71(1-2), 117-143.
Pesaran, M.H., Shin, Y., Smith, S., 2001. Bounds testing approach to the analysis of level relationships. Journal of Applied Econometrics, 16(3), 289–326.
Petit, N., 2007. Ethiopia’s coffee sector: a better or bitter future? Journal of Agricultural Change 7(2), 225-263.
Rapsomanikis, G., David, H., Piero, C., 2003. Market Integration and Price Transmission in Selected Food and Cash Crop Markets of Developing Countries: Review and Applications In Commodity Market Review 2003-2004, FAO. Rome: Commodities and Trade Division.
Ravallion, M., 1986. Testing Market Integration. American Journal of Agricultural Economics, 68(1), 102-109.
Rootcapital, 2016. Financing farm renovation Learning report; the coffee farmer resilience initiative. Retrieved from https://www.rootcapital.org.
Rosenbaum, P.R., 2002. Observational Studies. 2nd ed. New York, NY: Springer. Rosenbaum, P.R., Rubin, D., 1985. Constructing a control group using multivariate
matched sampling methods that incorporate the propensity score. The American Statistician, 39(1), 33–38.
Ruben, R., Fort, R., 2012. The impact of fair trade certification for coffee farmers in Peru. World Development, 40 (3), 570–582.
Seyoum, E., 2010. Price transmission system in Ethiopian coffee Market. Master’s thesis, Department of Economics, Swedish University of Agricultural Sciences.
Shin, Y., Yu, B., Greenwood-Nimmo, M., 2011. Modelling Asymmetric Cointegration and Dynamic Multipliers in an ARDL Framework. Mimeo: University of Leeds.

160
Shin, Y., Yu, B., Greenwood-Nimmo, M., 2014. Modelling asymmetric cointegration and dynamic multipliers in a nonlinear ARDL framework. In Festschrift in honor of Peter Schmidt: Econometric methods and applications, edited by W. C. Horrace and R.C. Sickles. New York: Springer Science and Business Media, 281-314.
Shrestha, M.B., Chowdhury, K., 2005. ARDL Modelling Approach to Testing the Financial Liberalisation Hypothesis. Economics Working Paper Series, University of Wollongong.
Simioni, M., Gonzales, F., Guillotreau, P., Le Grel, L., 2013. Detecting Asymmetric Price Transmission with Consistent Threshold along the Fish Supply Chain. Canadian Journal of Agricultural Economics/Revue canadienne d'agroeconomie, 61(1), 37–60.
Sorensen, C., 2002. Modeling seasonality in agricultural commodity futures, The Journal of Futures Markets, 22, 393–426.
Stephens, E.C., Mabaya, E., Cramon-Taubadel, S.V., Barrett, C.B., 2012. Spatial Price Adjustment with and without Trade. Oxford Bulletin of Economics and Statistics, 74(3), 453–469.
Stigler, G., Sherwin, R., 1985. The extent of the market. Journal of Law and Economics, 28(3), 555–585.
Stock, J. H., Watson, M.W., 1996. Evidence on Structural Instability in Macroeconomic Time Series Relations, Journal of Business and Economic Statistics, 14:11-29.
Stuart, E., 2010. Matching Methods for Causal Inference: A Review and a Look Forward. Statistical Science, 25(1), 1-21.
Subervie, J., 2011. Producer price adjustment to commodity price shocks: An application of threshold cointegration. Economic Modelling, 28(5), 2239-2246.
Tamiru, S., 2006. Spatial Integration of White Wheat Markets in Ethiopia: Along with Improvements in Transport Infrastructure. Master Thesis Submitted to the School of Graduate Studies of Addis Ababa University, Addis Ababa.
Tamru, S., Minten B., 2016. Value Addition and Processing by Farmers in Developing Countries: Evidence from the Coffee Sector in Ethiopia. Invited poster presented at the 5th International Conference of the African Association of Agricultural Economists, September 23-26, 2016, Addis Ababa, Ethiopia.
Technoserve, 2013. The coffee initiative, phase one final report. Retrieved from http://www.technoserve.org/files/downloads/coffee-initiative-phase-one-final-report. pdf.
Tefera, A., 2015. Ethiopian coffee annual report. Global agricultural information network report.
Tefestewold, B., 1995. Studies on Colletotrichum population of Coffea arabica L. in Ethiopia and evaluation of the reactions of coffee germplasms. Doctoral Dissertation. Hohen Landwirtschaftlichen Fakultat der Rheinschen Friedrich- Wilelms-Universität Zu Bonn. p. 23.
Tilahun, D., 2011. The Effectiveness of Marketing Communication Channels: The Case of Ethiopia Commodity Exchange. Master Thesis Submitted to the School of Graduate Studies of Addis Ababa University, Addis Ababa.
Toda, H.Y., Yamamoto, T., 1995. Statistical inference in vector autoregressions with possibly integrated process. Journal of Econometrics, 66(1-2), 225–250.
Todaro, M.P., Smith, S.C., 2006. Economic development 5th edition, Pearson education limited, USA.
Tsegaye, Y., 2001. Coffee-Enset-livestock interaction for sustainable livelihood in the Sidama area of Southern Ethiopia. Agric. Tropics Subtropics, 102 (2), 119–1311.

161
Tullu, D., 2008. Coffee production and marketing in Oromia Regional State. In: Proceedings of a National Work Shop Four Decades of Coffee Research and Development in Ethiopia, EIAR, Addis Ababa, Ethiopia. pp.382-389.
Ubilava, D., 2012. El Niño, La Niña, and world coffee price dynamics. Agricultural Economics, 43(1), 17–26.
USAID, 2010. Ethiopian Coffee Industry Value Chain Analysis Profiling the Actors, Their Interactions Costs Constraints and Opportunities, Chemonics International.
Valkila, J., 2009. Fair trade organic coffee production in Nicaragua-sustainable development or a poverty trap? Ecological Economics, 68 (12), 3018–3025.
Van Der Vossen, H.A.M., 2005. A Critical Analysis of the Agronomic and Economic Sustainability of Organic Coffee Production. Experimental Agriculture, 41, 449-473.
van Rijsbergen, B., Elbers, W., Ruben, R., Njuguna, S.N., 2016. The ambivalent impact of coffee certification on farmers’ welfare: A matched panel approach for cooperatives in central Kenya. World Development, 77, 277–292, doi: 10.1016/j.worlddev.2015.08.021.
Verhofstadt, E., Maertens, M., 2014. Can agricultural cooperatives reduce poverty? Heterogeneous impact of cooperative membership on farmers’ welfare in Rwanda. Appl. Econ. Perspect. Policy, 1–21.
Weldesenbet, B., Sualeh, A., Mekonin, N., Indris S., 2008. Coffee Processing and Quality Research in Ethiopia. In: Proceedings of a National Work Shop Four Decades of Coffee Research and Development in Ethiopia, EIAR, Addis Ababa, Ethiopia. pp. 307-316.
White, H., Leavy, J., 2001. Economic Reforms and Economic Performance: Evidence from 20 Developing Countries. European Journal of Economic Research, 2 (13), 120-43.
WIPO, 2009. The Coffee War: Ethiopia and the Starbucks Story. Retrieved from http://www.wipo.int/ipadvantage/en/details.jsp?id=2621.
Woldemariam, T., 2015. Environment and Coffee Forest Forum Coffee : Ethiopia ’ s Gift to the World The traditional production. Retrieved from http://www.naturskyddsforen ingen
Wolde-Rufael, Y., 2005. Energy demand and economic growth. Journal of Policy Modeling, 27(8), 891–903.
Wooldridge, J.M., 2002. Econometric Analysis of Cross Section and Panel Data. MIT Press Cambridge, MA.
Worako, T.K., Alemu, Z.G., Goshu, G.A., 2010. Spatial Integration of Coffee-Growers Markets in Ethiopia. Proceedings of the Seventh International Conference on the Ethiopian Economy, Ethiopian Economic Association, 245-266.
Worako, T.K., Masaparisi, A., Lanos, B., 2014. Analysis of price incentives for coffee in Ethiopia. Technical notes series, MAFAP, FAO, Rome.
Worako, T.K., Van Schalkwyk, H.D., Alemu, Z.G., Ayele, G., 2008. Producer price and price transmission in a deregulated Ethiopian coffee market. Agrekon, 47(4), 492-508.
World Bank, 2014. Third Ethiopia Economic Update: Strengthening Export Performance through Improved Competitiveness. Washington, DC. Retrieved from https://openknowledge.worldbank.org/handle/10986/20026.
Xavier, A., 2011. Market Reform and Its Impact on the Price Transmission in the Coffee Supply Chain: A Case Study of Colombia, Ghana and Ivory Coast. Master’s thesis, Cornell. Retrieved from http://www.temoa.info/es/node/400565.

162
Xie, Y., Brand, J.E., Jann, B., 2011. Estimating heterogeneous treatment effects with observational data (PSC Research Report No. 10–729). Ann Arbor: Population Studies Center, University of Michigan.

163
Curriculum Vitae
164
Tinsae Demise Dept. Agricultural Economics, Ghent University, Coupure Links 653, 9000 Gent, Belgium, Email: [email protected], [email protected]
Tinsae Demise obtained his bachelor degree in Agricultural resource economics and
management from Hawassa University in Ethiopian (2003 to 2006), and master
degree in Agricultural Economics from Haramaya University in Ethiopian (2006 to
2008). He worked as a lecture in Jimma University in Ethiopia (2008 to 2012). In
February 2012, Tinsae Demise got a grant from NUFFIC-NICHE ETH-019 and started
his PhD study at the Department of Agricultural Economics, Faculty of Bioscience
Engineering, Ghent University, Belgium, under the guidance of Prof. Marijke.DHaese
and Prof. Wim Verbeke.
Teaching experience (Jimma University, 2008 to 2012)
Farm management
Agricultural marketing
Development Economics
Research methodology
Supervising seminar and senior project paper for undergraduate students Participation on symposium or conference
18th PhD Symposium Agricultural and Natural Resource Economics, organized by the Belgian Association of Agricultural Economists (BAAE).
Supervision of MSc student thesis
Teff value chain analysis in Becho and Dawo districts of south west Shewa, Ethiopia
Hedonic price analysis of indigenous goat traits in Afar region, north east Ethiopia
Value chain analysis of organic honey in Sheka zone of southwestern Ethiopia; case of Masha district

165
Reviewed contributed papers submitted for the XV EAAE Congress in Parma, Italy.
Rural income dynamics: Understanding poverty and inequality changes in rural Peru
The Competitiveness of South African Pears regarding with the main clients of European Union
Analysis of oligopolistic behavior of Kazakh and Russian exporters in the South Caucasus wheat market
Journal articles (Published) Demise, T., Natanelov, V., Verbeke W., & D’Haese, M., 2016. Empirical Investigation into Spatial Integration Without Direct Trade: Comparative Analysis Before and After the Establishment of the Ethiopian Commodity Exchange, The Journal of Development Studies, DOI: 10.1080/00220388.2 016.1187722 Gobena, E., Goshu, D., Demise, T., Kenea, 2016. Determinants of market participation and intensity of marketed surplus of teff producers in Bacho and Dawo districts of Oromia State, Ethiopia. Journal of Development and Agricultural Economics 5(2):020-032.