cognitive biases in data interpretation-2
TRANSCRIPT
Biases in Data Interpretation
Vijay Kotu
a)
b)
a)
b)
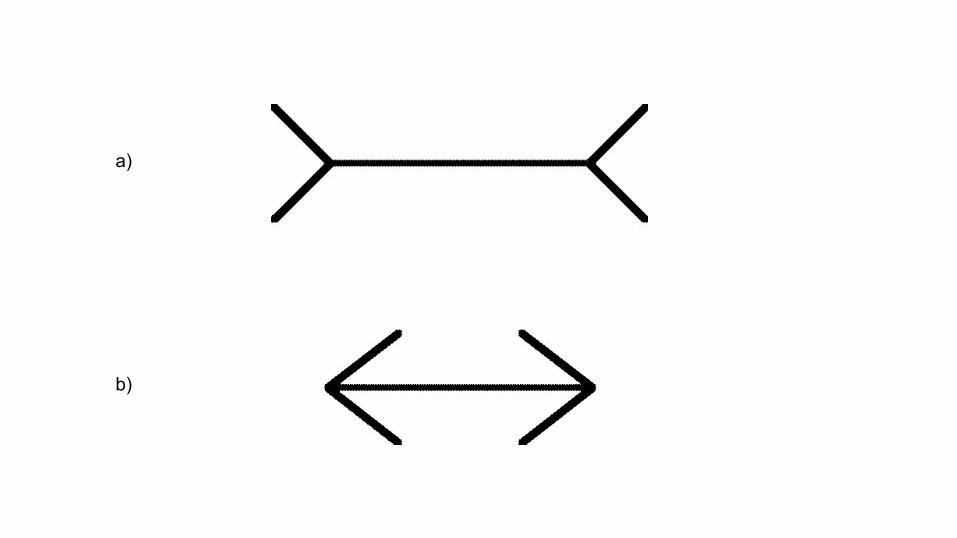
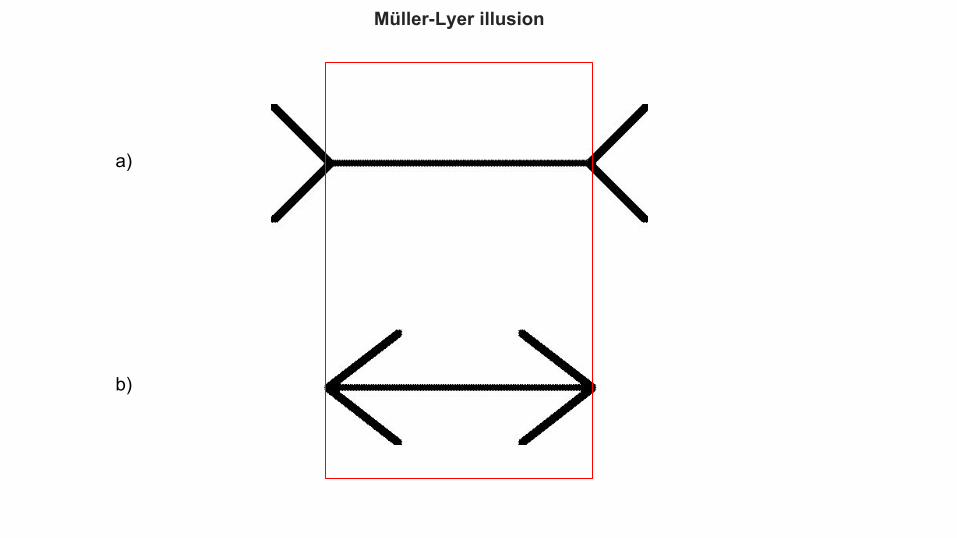
Müller-Lyer illusion
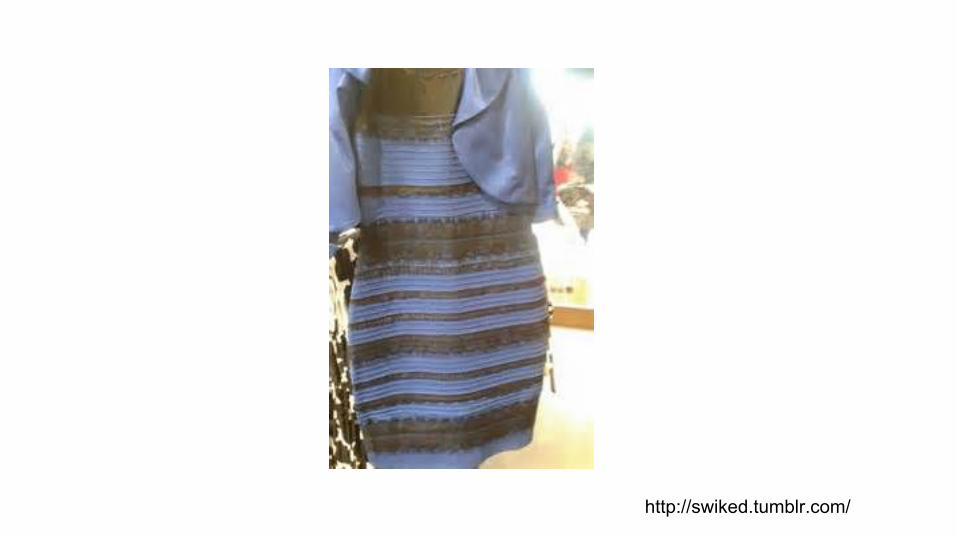
http://swiked.tumblr.com/
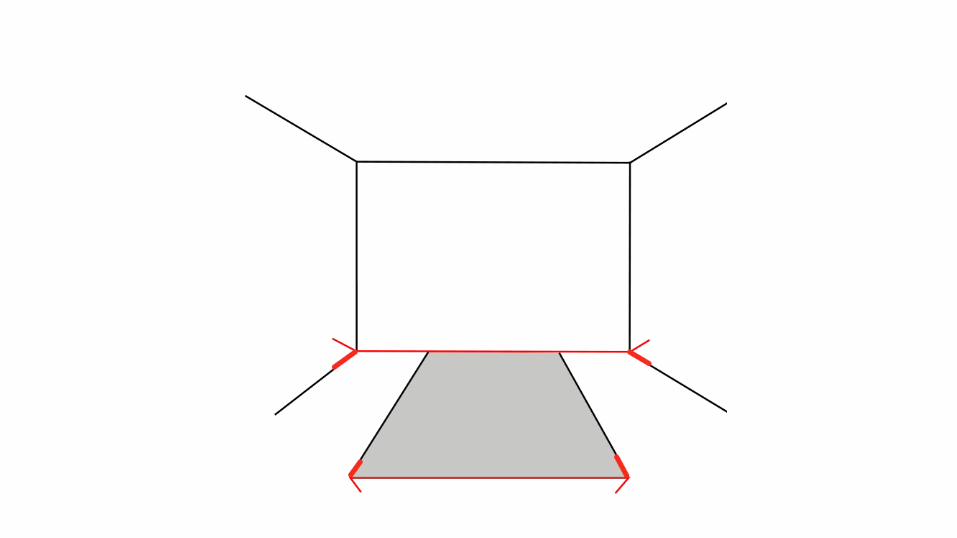
OPTICAL ILLUSIONS
Müller-Lyer illusion is one of hundreds of known Optical illusions
Optical illusion, vary significantly on it’s effects based on beholder’s interpretation
Most of the optical illusion is an effect of a (an advantageous) heuristic shortcut
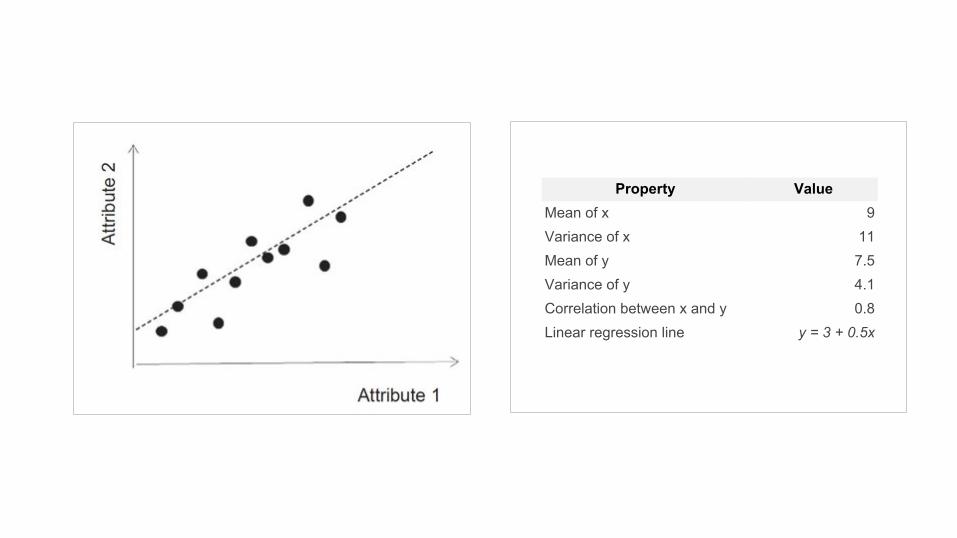
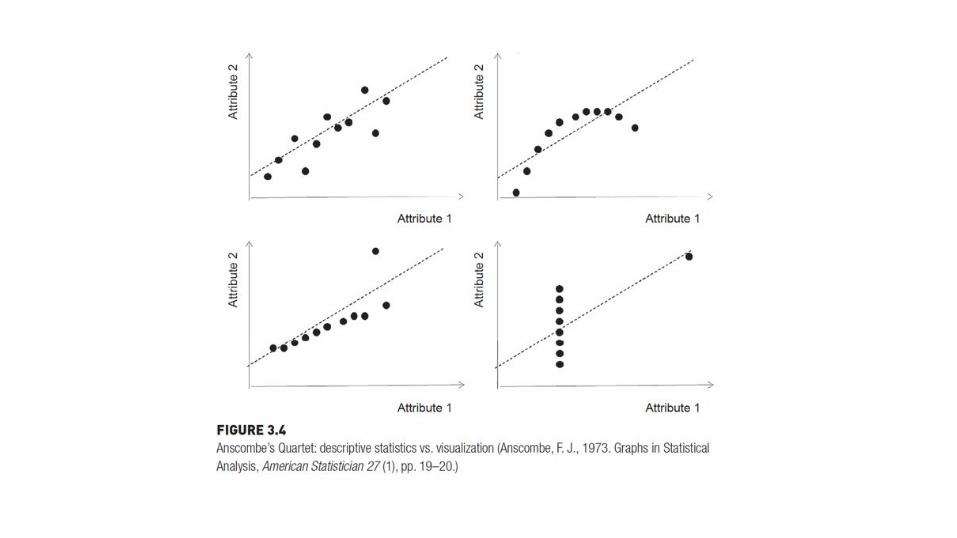
Property ValueMean of x 9Variance of x 11Mean of y 7.5Variance of y 4.1Correlation between x and y 0.8Linear regression line y = 3 + 0.5x
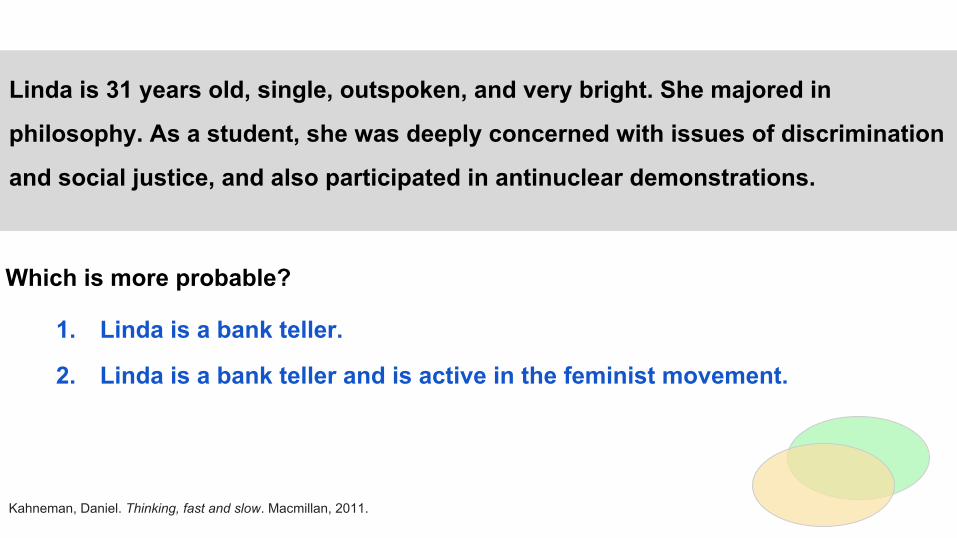
Linda is 31 years old, single, outspoken, and very bright. She majored in
philosophy. As a student, she was deeply concerned with issues of discrimination
and social justice, and also participated in antinuclear demonstrations.
Which is more probable?
1. Linda is a bank teller.
2. Linda is a bank teller and is active in the feminist movement.
Kahneman, Daniel. Thinking, fast and slow. Macmillan, 2011.
SEEING DATA
Our understanding of probability and statistics is
NOT intuitive or perfectly rational
Unconscious Conclusion
Kahneman, Daniel. Thinking, fast and slow. Macmillan, 2011.
OLAP
Structured Databases
Reporting
Tele
met
ry, I
nstr
umen
tatio
n an
d Po
int o
f tra
nsac
tion
Logs, Data Stores
Exploratory Data Analysis
Experimentation
Data Mining
Hypothesis Testing
Simulation
User / ProductQuery
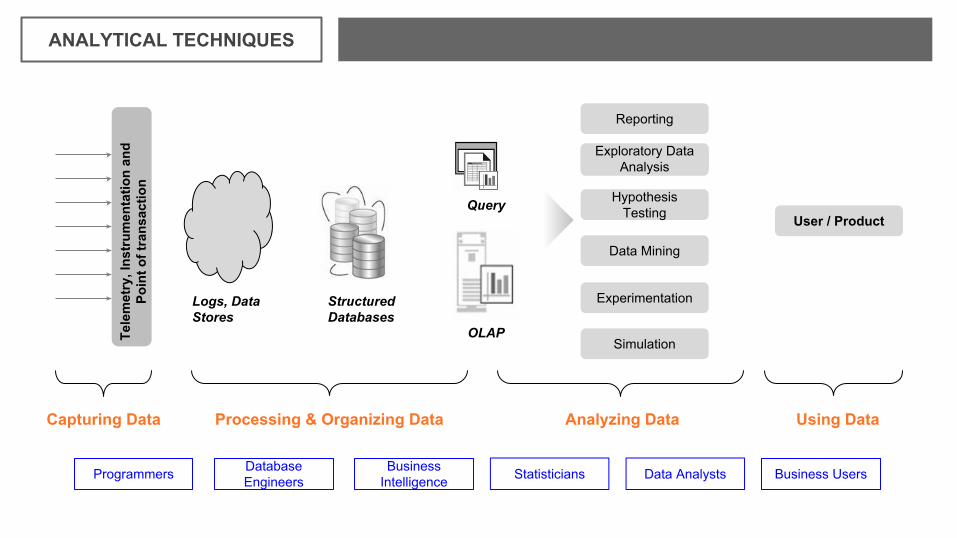
Capturing Data Processing & Organizing Data Analyzing Data Using Data
Programmers Database Engineers
Business Intelligence Statisticians Data Analysts Business Users
Reporting
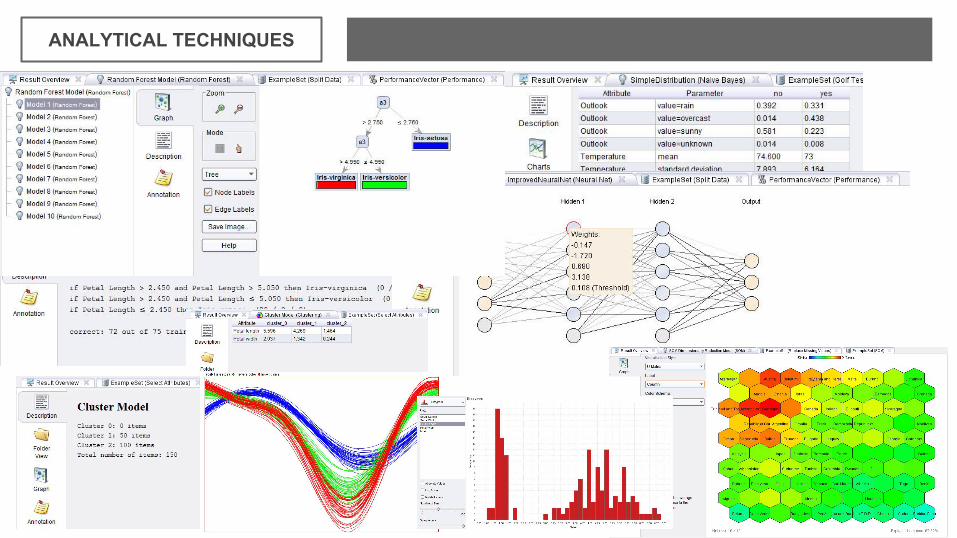
ANALYTICAL TECHNIQUES
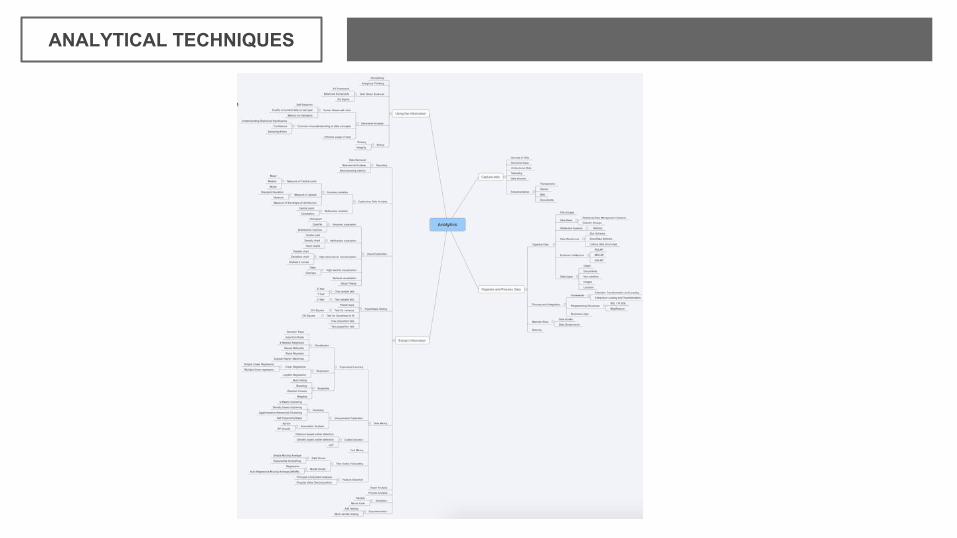
ANALYTICAL TECHNIQUES
-
ANALYTICAL TECHNIQUES
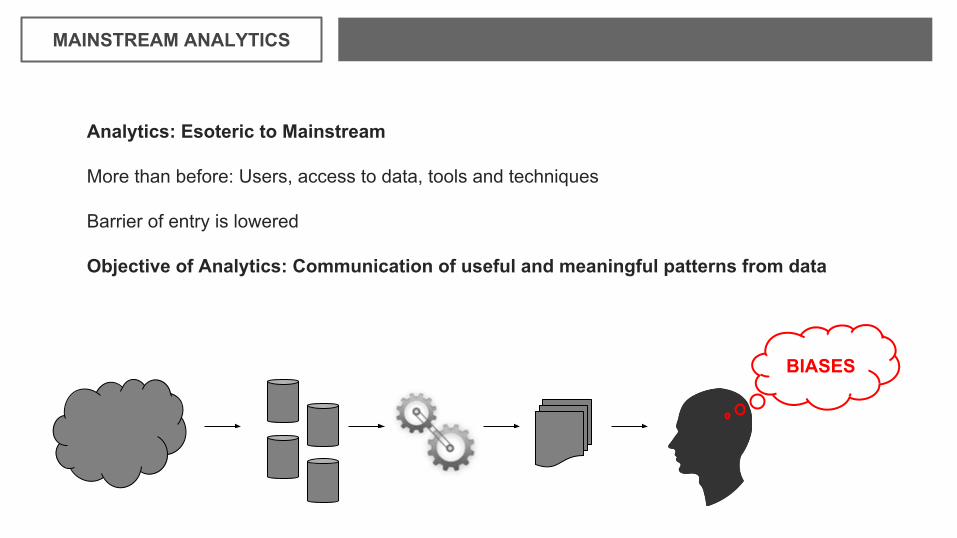
Analytics: Esoteric to Mainstream
More than before: Users, access to data, tools and techniques
Barrier of entry is lowered
Objective of Analytics: Communication of useful and meaningful patterns from data
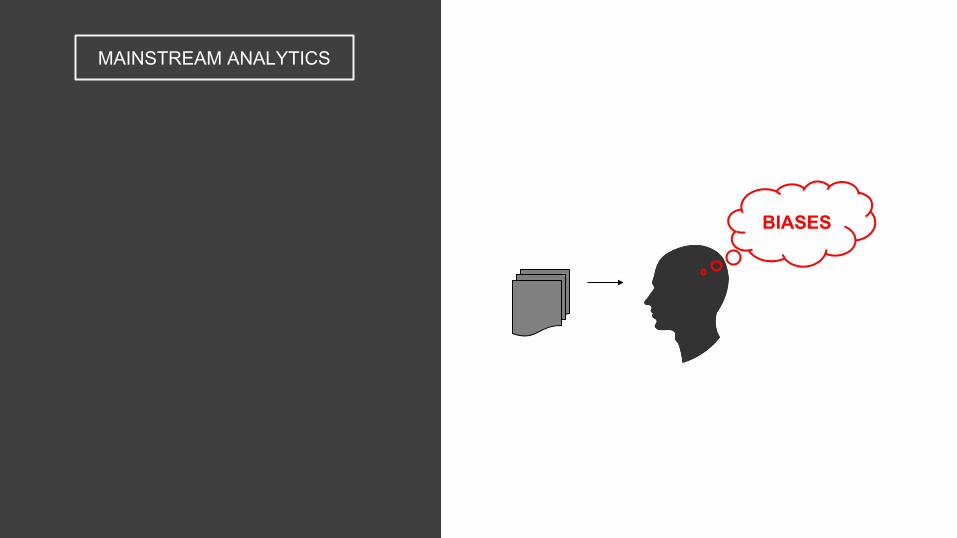
MAINSTREAM ANALYTICS
BIASES
MAINSTREAM ANALYTICS
BIASES
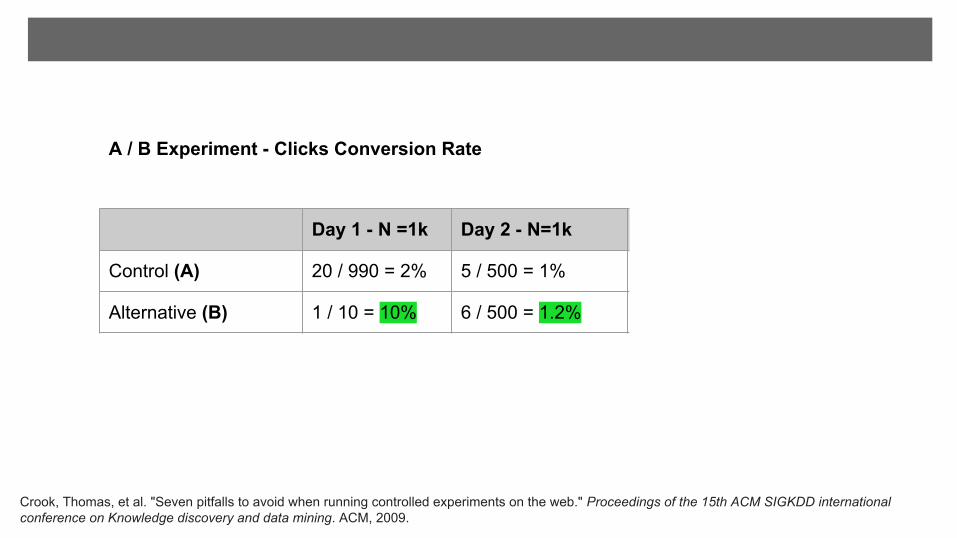
Day 1 - N =1k Day 2 - N=1k Total
Control (A) 20 / 990 = 2% 5 / 500 = 1% 25 / 1490 = 1.7%
Alternative (B) 1 / 10 = 10% 6 / 500 = 1.2% 7 / 510 = 1.4%
A / B Experiment - Clicks Conversion Rate
Crook, Thomas, et al. "Seven pitfalls to avoid when running controlled experiments on the web." Proceedings of the 15th ACM SIGKDD international conference on Knowledge discovery and data mining. ACM, 2009.
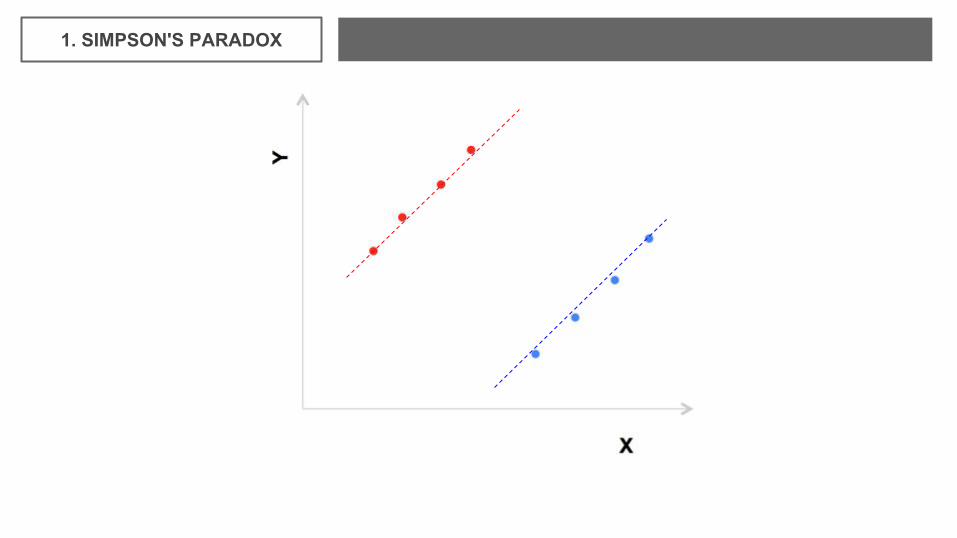
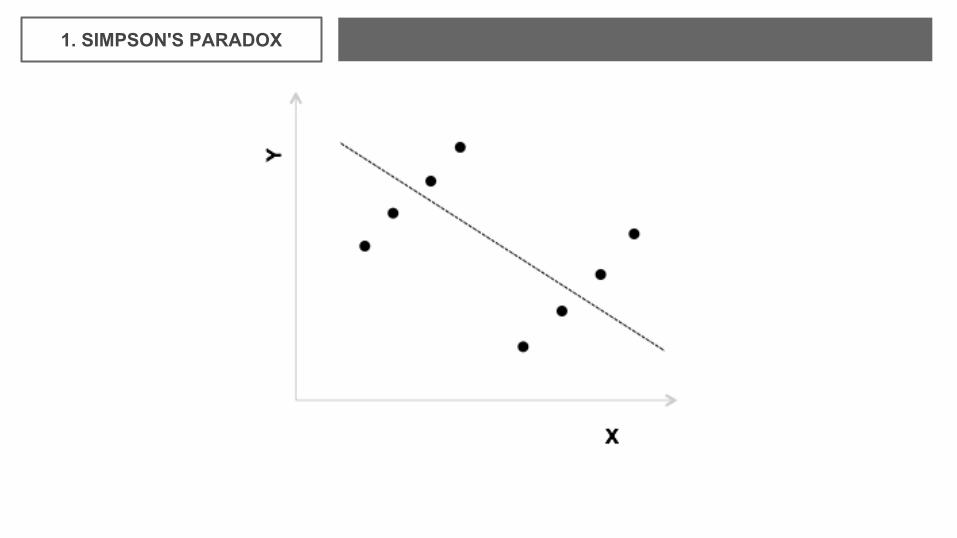
1. SIMPSON'S PARADOX
1. SIMPSON'S PARADOX
1. SIMPSON'S PARADOX
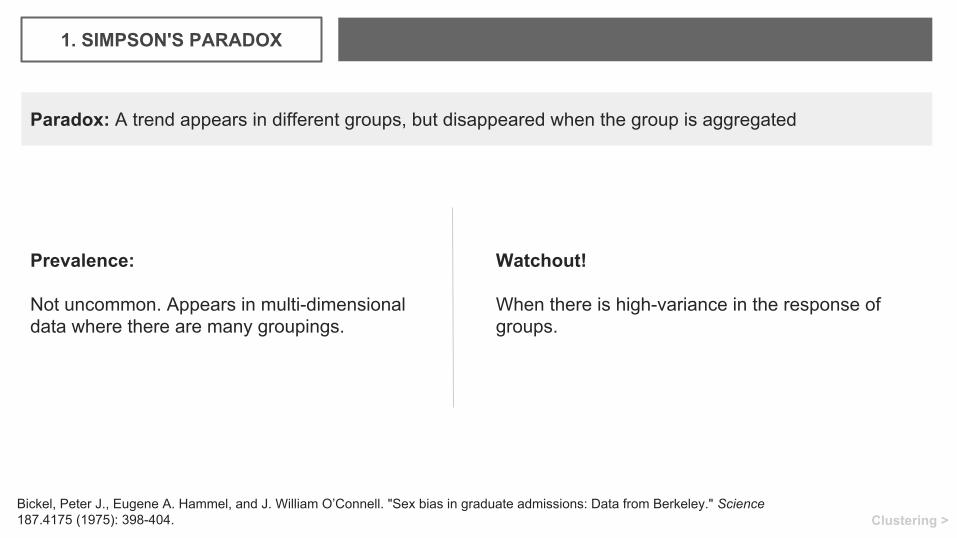
Paradox: A trend appears in different groups, but disappeared when the group is aggregated
Bickel, Peter J., Eugene A. Hammel, and J. William O’Connell. "Sex bias in graduate admissions: Data from Berkeley." Science 187.4175 (1975): 398-404.
Prevalence:
Not uncommon. Appears in multi-dimensional data where there are many groupings.
Watchout!
When there is high-variance in the response of groups.
Clustering >
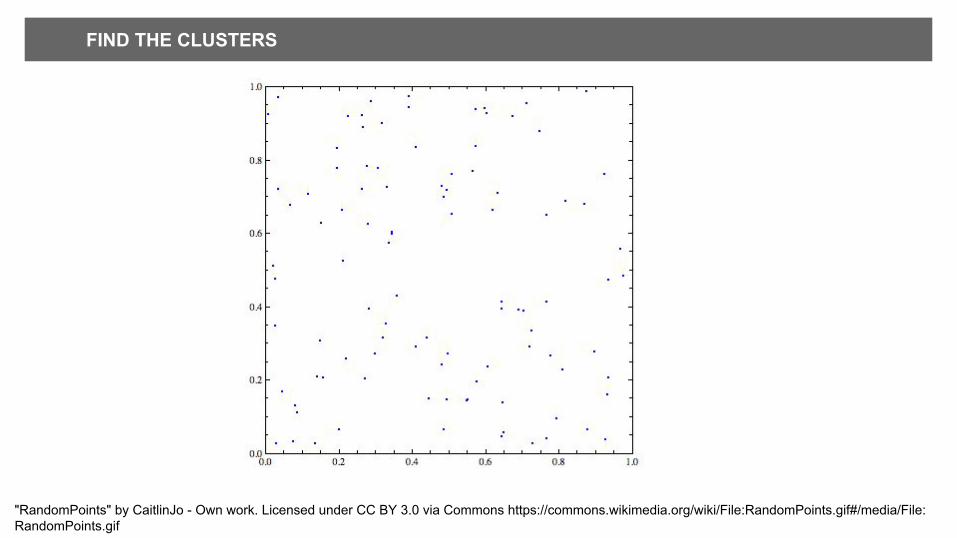
FIND THE CLUSTERS
"RandomPoints" by CaitlinJo - Own work. Licensed under CC BY 3.0 via Commons https://commons.wikimedia.org/wiki/File:RandomPoints.gif#/media/File:RandomPoints.gif
Human Tendency: Interpreting random streaks as clusters.
2. CLUSTERING ILLUSION
Driven by:
To underpredict the amount of variability likely to appear in a sample of random data.
Study >
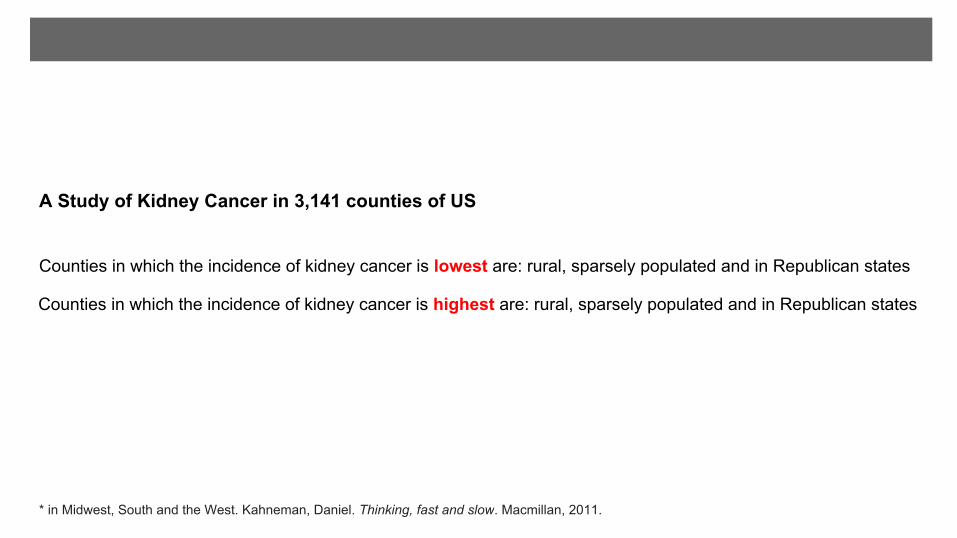
A Study of Kidney Cancer in 3,141 counties of US
Counties in which the incidence of kidney cancer is lowest are: rural, sparsely populated and in Republican states
* in Midwest, South and the West. Kahneman, Daniel. Thinking, fast and slow. Macmillan, 2011.
Counties in which the incidence of kidney cancer is highest are: rural, sparsely populated and in Republican states
Kahneman, Daniel. Thinking, fast and slow. Macmillan, 2011.
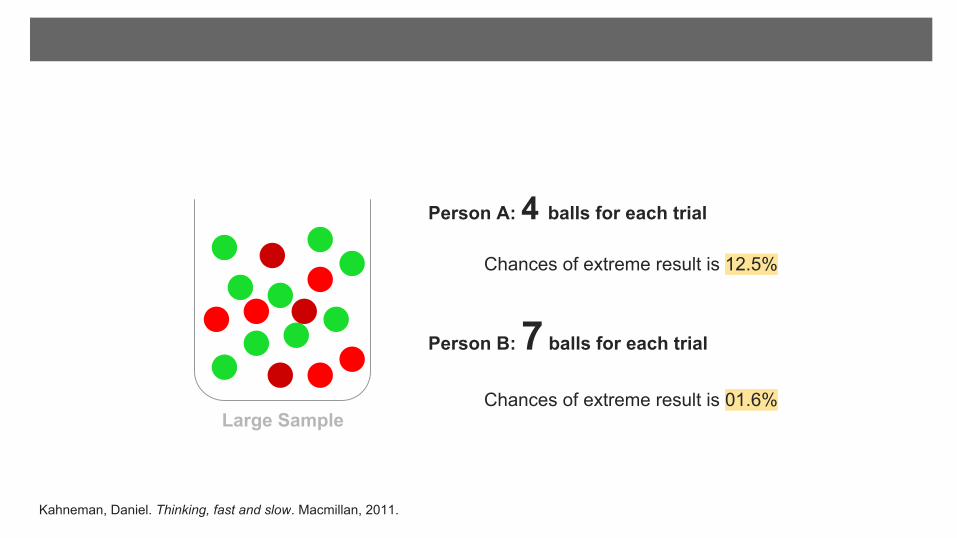
Person A: 4 balls for each trial
Person B: 7 balls for each trial
Chances of extreme result is 12.5%
Chances of extreme result is 01.6%Large Sample
3. LAW OF SMALL NUMBERS
Fact: Extreme outcomes are found in smaller sample. Ignoring this fact is a fallacy
Normal focus is on the statement and causality; not on reliability of the results. Statistics present the information but do not explain the causality
Prevalent in Surveys: e.g: Manager 360 Surveys. Best managers run small teams
Thought Experiment >
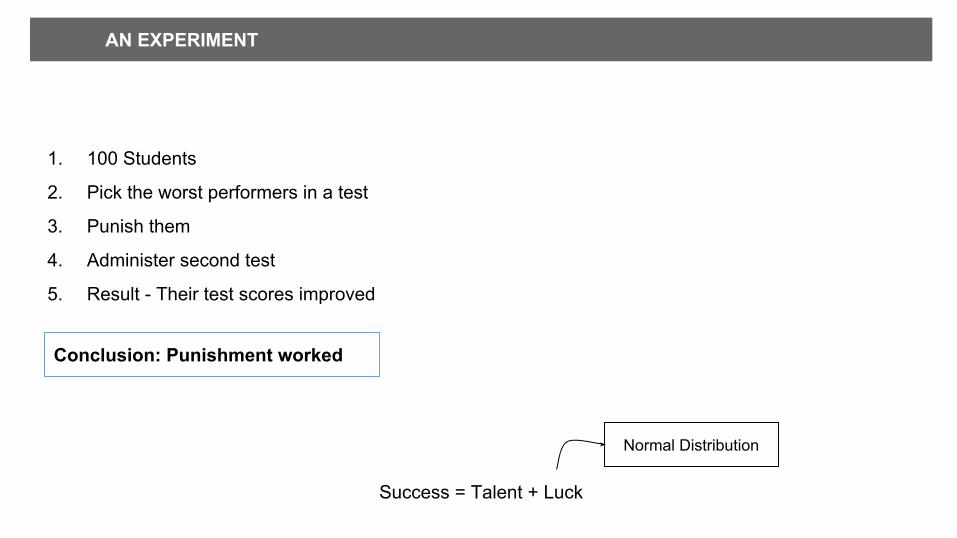
Success = Talent + Luck
Normal Distribution
1. 100 Students
2. Pick the worst performers in a test
3. Punish them
4. Administer second test
5. Result - Their test scores improved
Conclusion: Punishment worked
AN EXPERIMENT
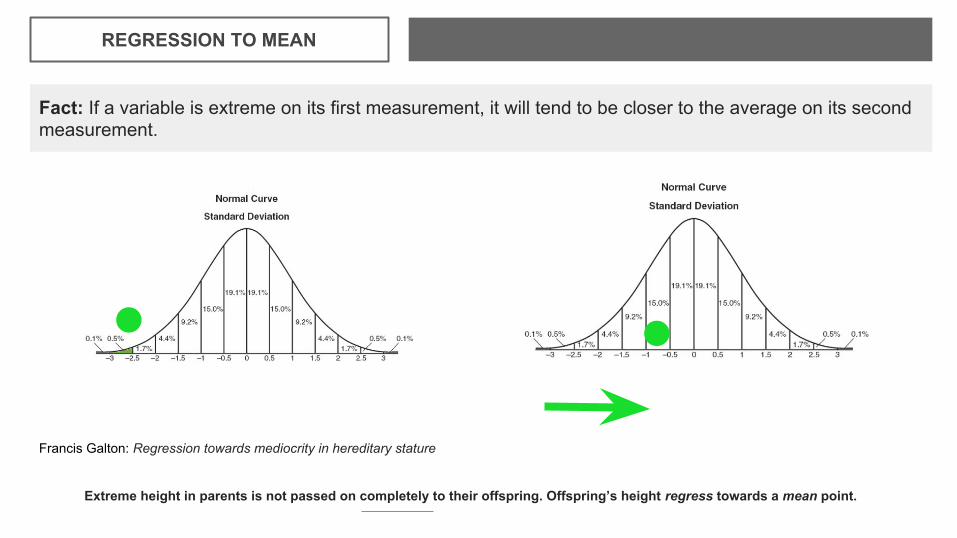
REGRESSION TO MEAN
Francis Galton: Regression towards mediocrity in hereditary stature
Extreme height in parents is not passed on completely to their offspring. Offspring’s height regress towards a mean point.
Fact: If a variable is extreme on its first measurement, it will tend to be closer to the average on its second measurement.
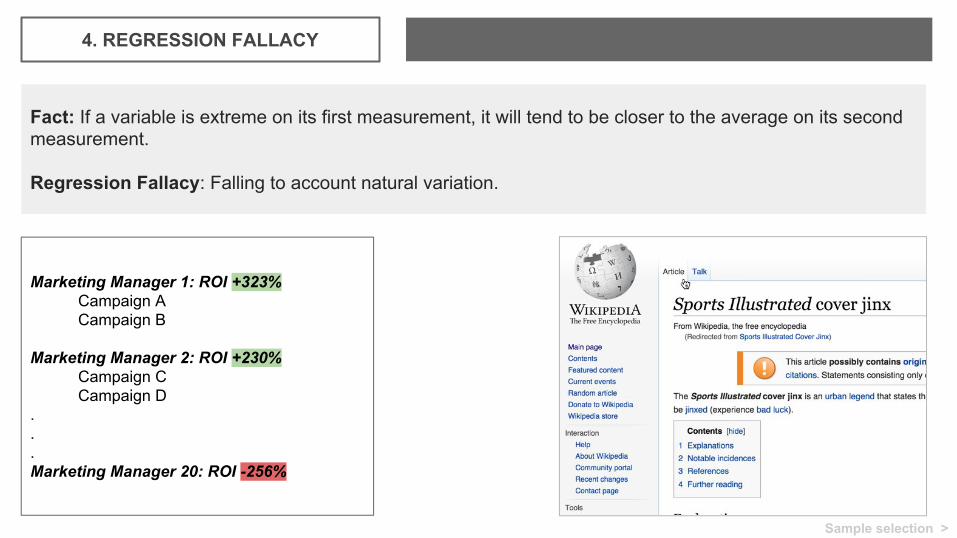
4. REGRESSION FALLACY
Fact: If a variable is extreme on its first measurement, it will tend to be closer to the average on its second measurement.
Regression Fallacy: Falling to account natural variation.
Marketing Manager 1: ROI +323%Campaign ACampaign B
Marketing Manager 2: ROI +230%Campaign CCampaign D
.
.
.Marketing Manager 20: ROI -256%
Sample selection >
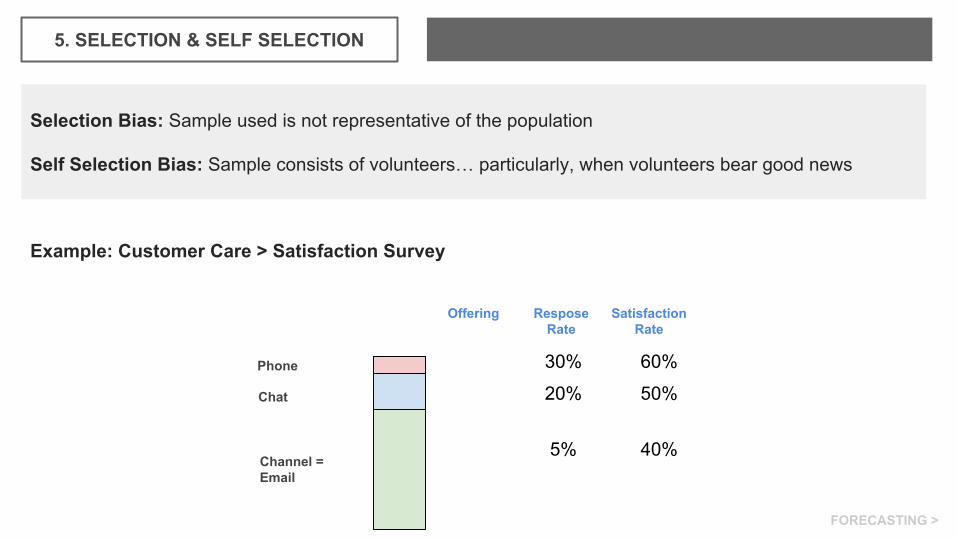
5. SELECTION & SELF SELECTION
Selection Bias: Sample used is not representative of the population
Self Selection Bias: Sample consists of volunteers… particularly, when volunteers bear good news
Example: Customer Care > Satisfaction Survey
5%
20%
30%
40%
50%
60%
Satisfaction Rate
ResposeRate
Offering
Channel = Email
Phone
Chat
FORECASTING >
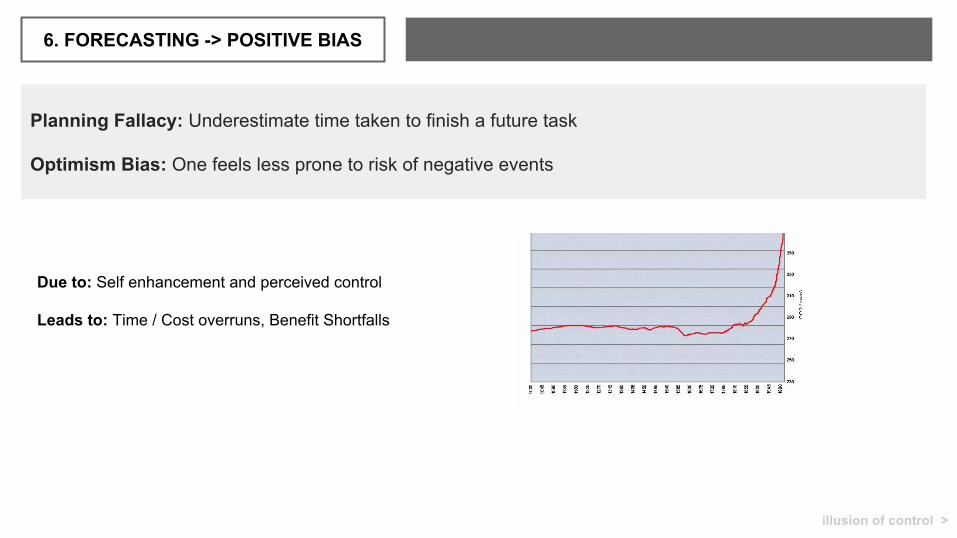
6. FORECASTING -> POSITIVE BIAS
Planning Fallacy: Underestimate time taken to finish a future task
Optimism Bias: One feels less prone to risk of negative events
Due to: Self enhancement and perceived control
Leads to: Time / Cost overruns, Benefit Shortfalls
illusion of control >
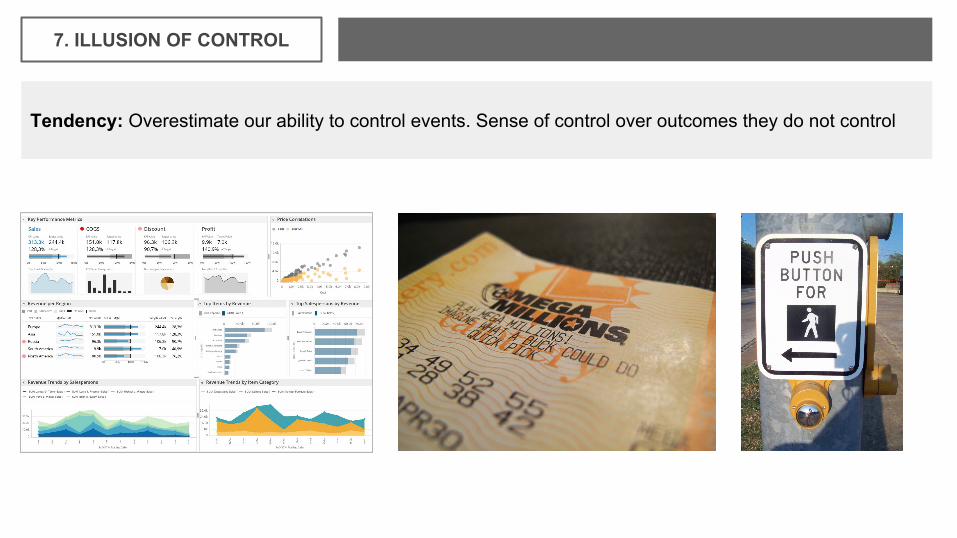
7. ILLUSION OF CONTROL
Tendency: Overestimate our ability to control events. Sense of control over outcomes they do not control

Meeting room Thermostats
Confirmation >
8. CONFIRMATION BIAS
Human Tendency: To search, process, interpret and favour data in a way that confirms to one’s hypothesis or beliefs.
1. Remember and present information selectively.
2. Cherry picking data
3. “Case Studies”
“Let’s find data to prove our point of view”
Snyder, M. and Cantor, N. (1979), "Testing Hypotheses about Other People: The Use of Historical Knowledge," Journal of Experimental Social
Psychology, 15, 330-342
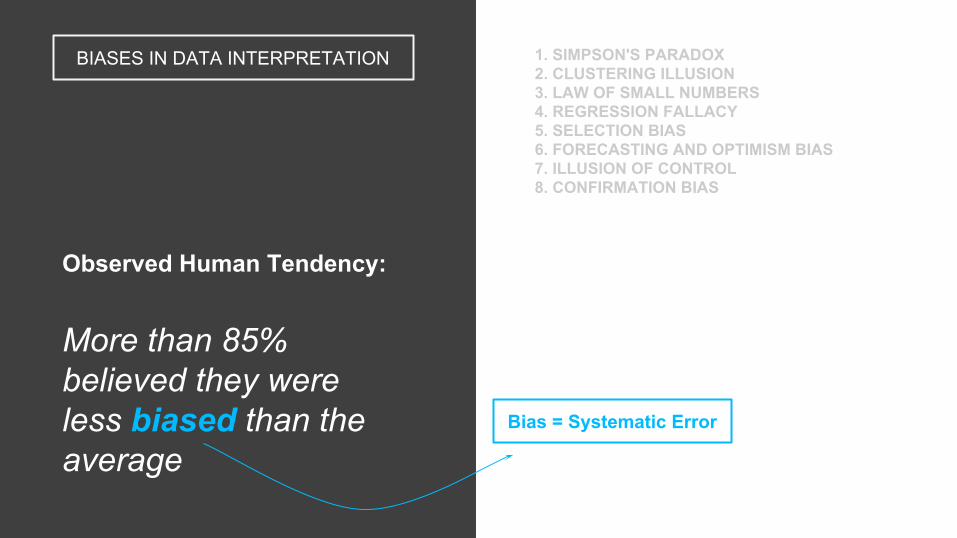
BIASES IN DATA INTERPRETATION
Observed Human Tendency:
More than 85% believed they were less biased than the average
Bias = Systematic Error
1. SIMPSON'S PARADOX2. CLUSTERING ILLUSION3. LAW OF SMALL NUMBERS4. REGRESSION FALLACY5. SELECTION BIAS6. FORECASTING AND OPTIMISM BIAS7. ILLUSION OF CONTROL8. CONFIRMATION BIAS
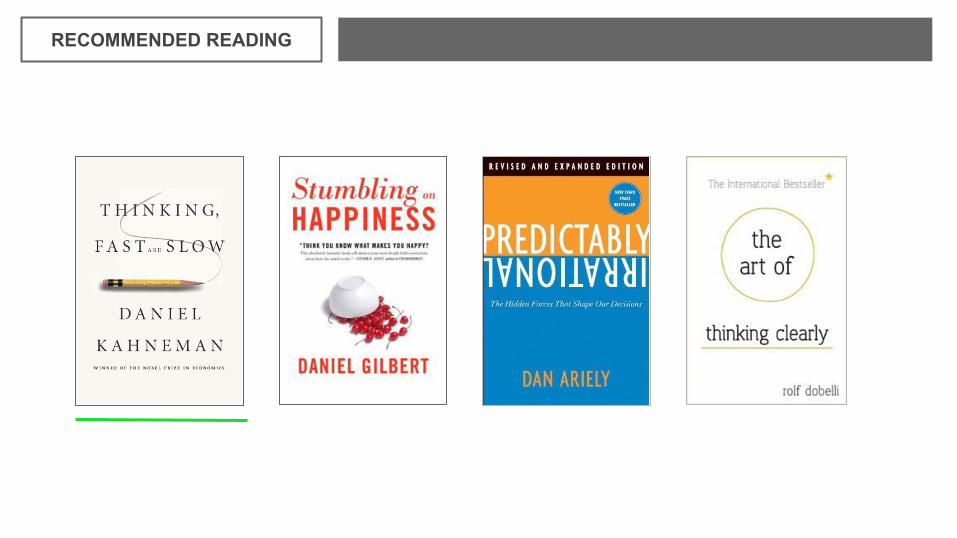
RECOMMENDED READING
BIASED OPINIONS BY...
Vijay Kotu
linkedin.com/in/vkotu
@VijayKotu
Appendix
9. DUNNING-KRUGER EFFECT
Tendency: Unskilled individuals to overestimate their own ability and the tendency for experts to underestimate their own ability. Corollary ture.
Kruger, Justin, and David Dunning. "Unskilled and unaware of it: how difficulties in recognizing one's own incompetence lead to inflated self-assessments." Journal of personality and social psychology 77.6 (1999): 1121.
Confirmation >
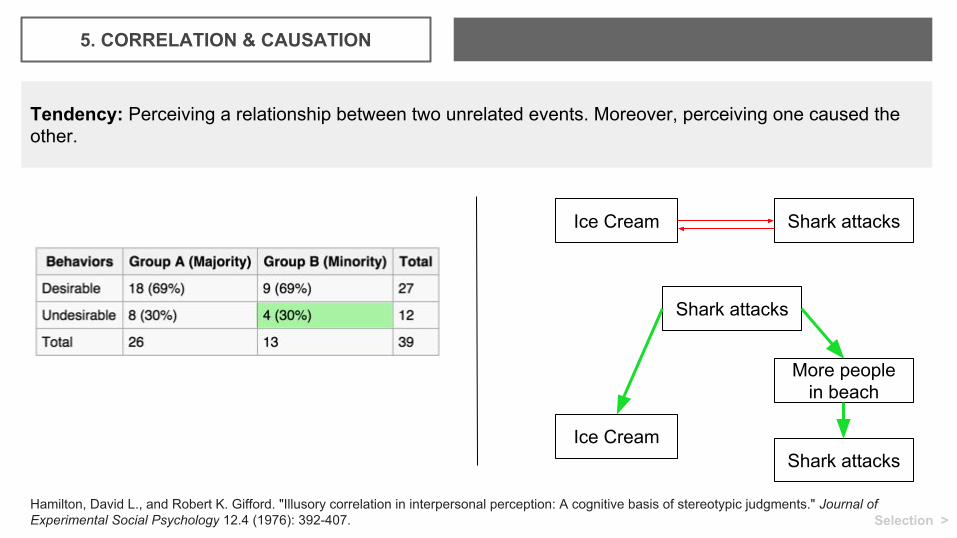
5. CORRELATION & CAUSATION
Tendency: Perceiving a relationship between two unrelated events. Moreover, perceiving one caused the other.
Hamilton, David L., and Robert K. Gifford. "Illusory correlation in interpersonal perception: A cognitive basis of stereotypic judgments." Journal of Experimental Social Psychology 12.4 (1976): 392-407.
Ice Cream Shark attacks
Ice CreamShark attacks
More people in beach
Shark attacks
Selection >