collaboration between mosa & moh republic of indonesia · micro statistics based on demographic...
TRANSCRIPT
FOLLOW UP OF THE 7TH HIGH LEVEL MEETING
“ To Wards an Inclusive Society”
1
DEVELOPING AN INTEGRATION SERVICES
TO CHILDREN WITH DISABILITIES (CWDs)
Collaboration between MOSA & MOH
Republic of Indonesia
Tokyo, Japan, 30 August-2 September 2010

Several activities had been done :
1. Coordination meeting : recommended Plan ofAction that have to be done by each sectors
2. MOSA (Demand Side) :
Building Centre of Integration
Services for CWDs (2010 – 2011)
Developing guideline book with SOP
Empowering CWDs Forum at the
district level

3. MOH (Supply Side) :
Strengthening Health Centre to deliver health
services for CWDs through School Health Program
Drafting CWDs guidelines hand book for parents
who has CWDs. It is going to discuss with JICA and
it will be developed as MCH-Hand Books
Providing Community Health Insurance
(Jamkesmas) for CWDs of poor people

CHALLENGE and GAP
1. MOH and MOSA have different programpriority
2. Decentralization aspects related to humanresources
3. Indicator of CWDs in The PresidentInstruction No.3 in 2010 that its will beevaluated regularly by President Team.

POVERTY ALLEVIATION
WITH A FOCUS ON VULNERABLE PEOPLE-
THROUGH STRENGTHENING COLLABORATION
BETWEEN
THE SOCIAL WELFARE AND HEALTH SERVICES
Presented to
The 8th ASEAN & Japan High Level officials Meeting on Caring Sociieties:
30 August-2 September 2010, Tokyo, Japan
Ministry of Social Affairs Indonesia
5
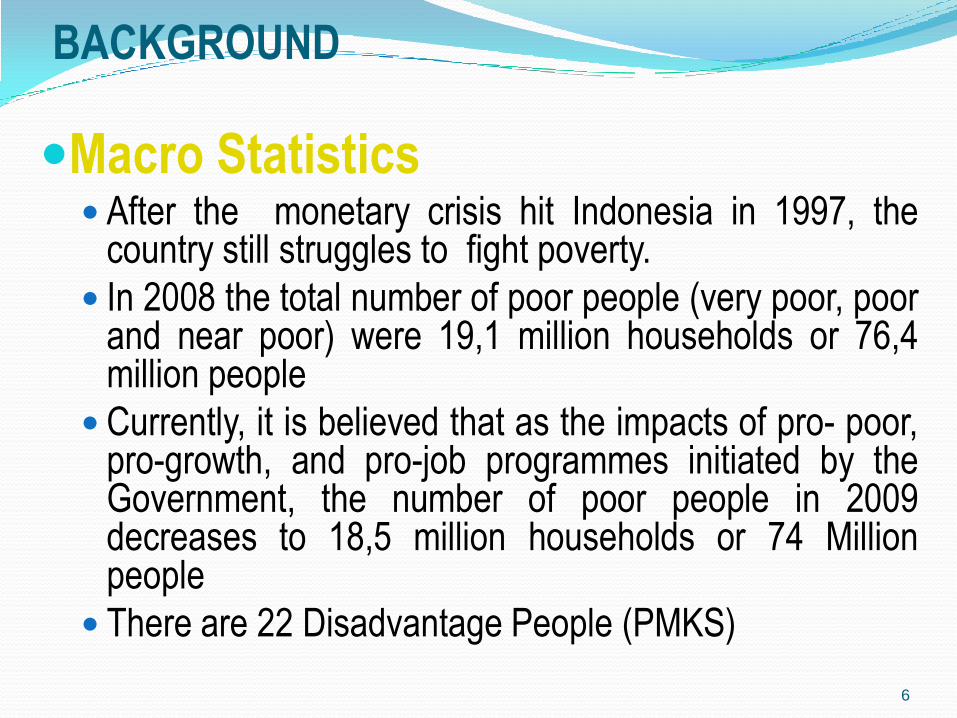
BACKGROUND
Macro Statistics After the monetary crisis hit Indonesia in 1997, the
country still struggles to fight poverty.
In 2008 the total number of poor people (very poor, poorand near poor) were 19,1 million households or 76,4million people
Currently, it is believed that as the impacts of pro- poor,pro-growth, and pro-job programmes initiated by theGovernment, the number of poor people in 2009decreases to 18,5 million households or 74 Millionpeople
There are 22 Disadvantage People (PMKS)
6

Micro StatisticsBased on Demographic Health Survey
in 2007, are :
Prevalence of Under-Five Children malnourishment :5.4% (BW/aged)
Under-Five Mortality Rate : 44/1000 life births
Infant Mortality Rate : 34/1000 life births
Maternal Mortality Rate: 228/100,000 motherdelivery)
7

24
35
44
51
73
23
36
43
65
67
Secondary +
Some
secondary
Primary
Some primary
No education
26
29
33
47
56
17
36
44
50
61
Highest
Upper middle
Middle
Lower middle
Lowest
IMR* DIFFERENTIALS
EDUCATION WEALTH INDEX QUINTILE
* IMR refers to 0-9 yrs preceding the survey
31
45
32
52
Urban
Rural
RESIDENCE
IMR (per 1000 live births)
IDHS 2002-3
IDHS 2007

68
57
46
35 34
91
81
58
46 44
32 3026
20 19 26
32
23
0
30
60
90
120
1991 1994 1997 2000 2003 2006 2009 2012 2015
DE
ATH
S P
ER
1000 L
IVE
BIR
TH
S
MDG
2015
INDICATOR MORTALITY RATE
Per year Per day Per hour
Neonatal Mortality (0-28 days) 19/1000 Live Births 86.000 236 10
Infant Mortality (0-12 months) 34/1000 Live Births 146.000 401 17
Under five mortality (0-60 bulan) 44/1000 Live
Births
193.000 531 22
GOAL 4: REDUCING CHILD MORTALITY RATE
?
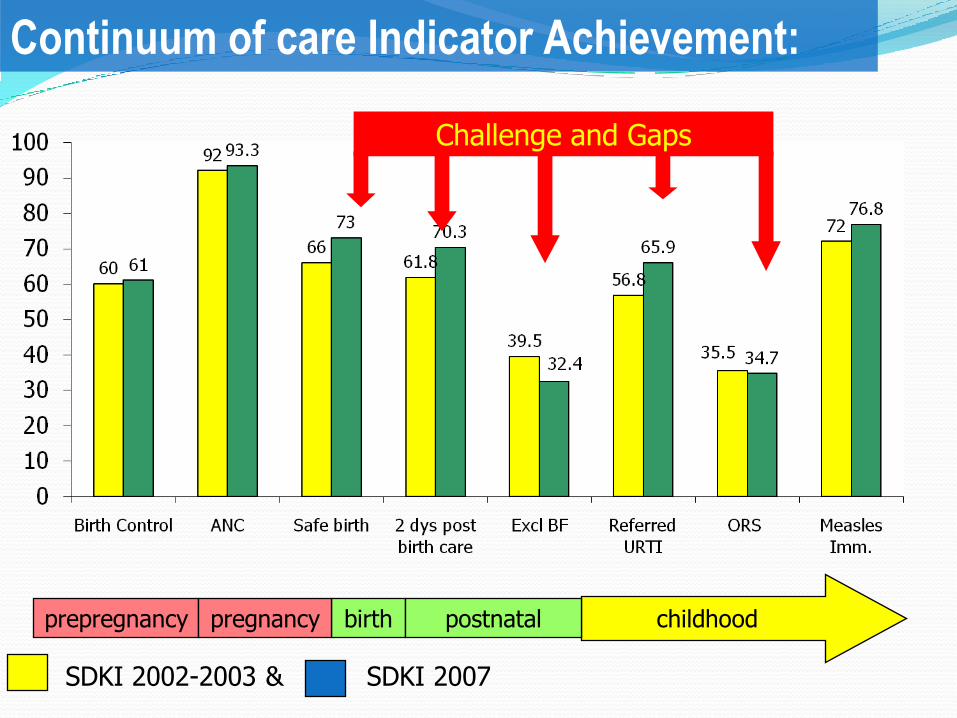
SDKI 2002-2003 & SDKI 2007
Challenge and Gaps
prepregnancy birth postnatalpregnancy childhood
Continuum of care Indicator Achievement:
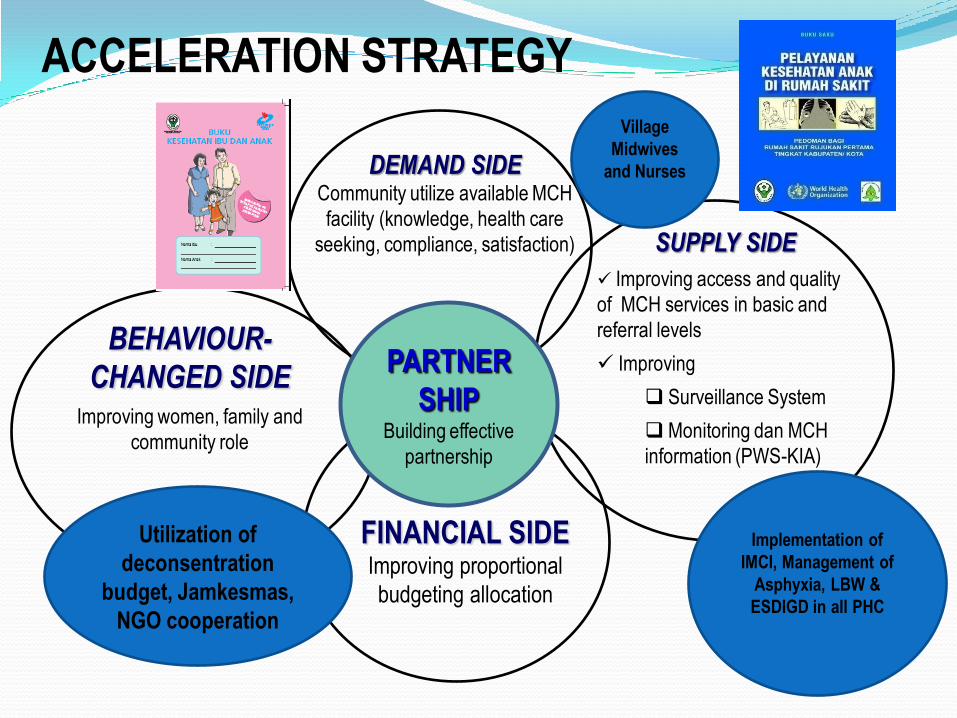
DEMAND SIDECommunity utilize available MCH
facility (knowledge, health care
seeking, compliance, satisfaction)
BEHAVIOUR-
CHANGED SIDEImproving women, family and
community role
SUPPLY SIDE
Improving access and quality
of MCH services in basic and
referral levels
Improving
Surveillance System
Monitoring dan MCH
information (PWS-KIA)
FINANCIAL SIDEImproving proportional
budgeting allocation
PARTNER
SHIPBuilding effective
partnership
Implementation of
IMCI, Management of
Asphyxia, LBW &
ESDIGD in all PHC
ACCELERATION STRATEGY
Utilization of
deconsentration
budget, Jamkesmas,
NGO cooperation
Village
Midwives
and Nurses

12
Distance
18%
High Transport Cost
16%
No Idea Where
to Go
6%
Afraid to Go By Self
12%
Usually No Staff
8%
No Money
34%
Not Permitted
(by Spouse)
6%
674.7
8.7
2.6
0.4
2.3
3.8
1.29.6 No money (67,0%)
Do not like/ashamed (4,7%)
Work (8,7%)
Married, take care of family (2,6%)
Not accepted/rejected by school (0,4%)
School is far (2,3%)
Feels his/her education is enough (3,8%)
Invalid (1,2%)
Others (9,6%)
Reasons of Children
7-18 Years Old Not to Pursue
Studies, 2003
Problems of Poor People to
Access Health Services
(Survey 2002-2003)

13

No DISADVANTAGED PEOPLE Total
1 NEGLECTED CHILDREN UNDER FIVE (TODDLERS) 1.186.941 PERSONS
2 NEGLECTED CHILDREN 3.176.462 PERSONS
3 NAUGHTY CHILDREN/CHILDREN CONFLICT WITH THE LAW 155.444 PERSONS
4 STREET CHILDREN 85.013 PERSONS
5 SOCIO ECONOMIC VULNERABLE WOMEN 1.263.449 PERSONS
6 VICTIMS OF VIOLENCE 123.738 PERSONS
7 NEGLECTED ELDERLY 2.994.330 PERSONS
8 PEOPLE WITH DISABILITY 1.541.942 PERSONS
9 PROSTITUTION 71.657 PERSONS
10 BEGGARS 33.041 PERSONS
11 HOMELESS 55.740 PERSONS
12 EX PRISONERS 135.140 PERSONS
13 EX DRUG ABUSE VICTIMS 49.989 PERSONS
14 POOR FAMILIES
14. A VERY POOR 2.930.005 HOUSEHOLDS
14. B POOR 6.842.947 HOUSEHOLDS
14. C NEAR POOR 7.518.496 HOUSEHOLDS
15 FAMILIES LIVING IN INAPPROPRIATE HOUSE 5.880.449 FAMILIES
16 FAMILIES WITH SOCIAL PSYCHOLOGICAL PROBLEMS 453.542 FAMILIES
17 REMOTE INDIGENOUS COMMUNITIES 518.906 PERSONS
18 VICTIMS OF NATURAL DISASTER 1.917.308 PERSONS
19 VICTIMS OF SOCIAL DISASTER 335.992 PERSONS
20 NEGLECTED MIGRANT WORKERS 118.526 PERSONS
21 PEOPLE LIVING WITH HIV/ AIDS 19.834 PERSONS
22 VULNERABLE FAMILIES 1.247.110 FAMILIES

Stages of Poverty Alleviation through Empowerment Program of Very Poor People by Ministry of Social Affairs, the Republic of
Indonesia
Preconditions throughDeconcentration fund
Target: Communityat a whole and very
poor people
KUBE formation(growth) throughDeconcentration fundTarget: very poor peoplein accordance withthe criteria
KUBE Development through Central budget and Local Budget
Target: Productive KUBE/Advanced according to the criteria
MFI through central fundand Local BudgetTarget: Independent KUBE according to the criteria
Borrowingthrough BANK
ACTIVITY1. Proposals submission2. Checking the BANK3.Utilising loan4.Facilitated by Independent Maskot5. Evaluation
ACTIVITY1. MFI formation 2. Implementation of
business in MFI3. Facilitation of
Independent Maskot 4. Evaluation
ACTIVITY1. Socialization2. Selection and recruitment of TKSK3. Training for Facilitators 4.Veri & pene productive KUBE
5. UEP Proposal6. BLPS Fund Withdrawal7. Facilitation of IndependentTKSK
ACTIVITY1 .. Selection of candidate members of KUBE2. Establishment of pre Groups3. Determination of business services4. Training of facilitators5. Skill Training for KUBE members6. Capital aid 7.Facilitation by Maskot
KT, PSM, Orsos8 Evaluation
ACTIVITY1.Orientation and Observation2. Registration &identification3. Planning Program4. General social extension5.Problem Ident.. Guidance6..Motivation Guidance7. Preparation of evaluation
ACTIVITY RESULTSIdentification of prospective site and households of KAT member
ACTIVITY RESULTSKUBE formationand implementation of social activities and UEP andselected Productive andnon productive KUBE
ACTIVITY RESULTSFund distribution for UEP development and Identification of KUBE MFI and KUBE revitalization
ACTIVITY RESULTSMFI formation along withinvestment funds andKUBE membership in MFI
ACTIVITY RESULTSIncreased activity of UEPKUBE (KUBE membersreleased of Poverty)
Year 0 Year I Year II Year III Year IV
15
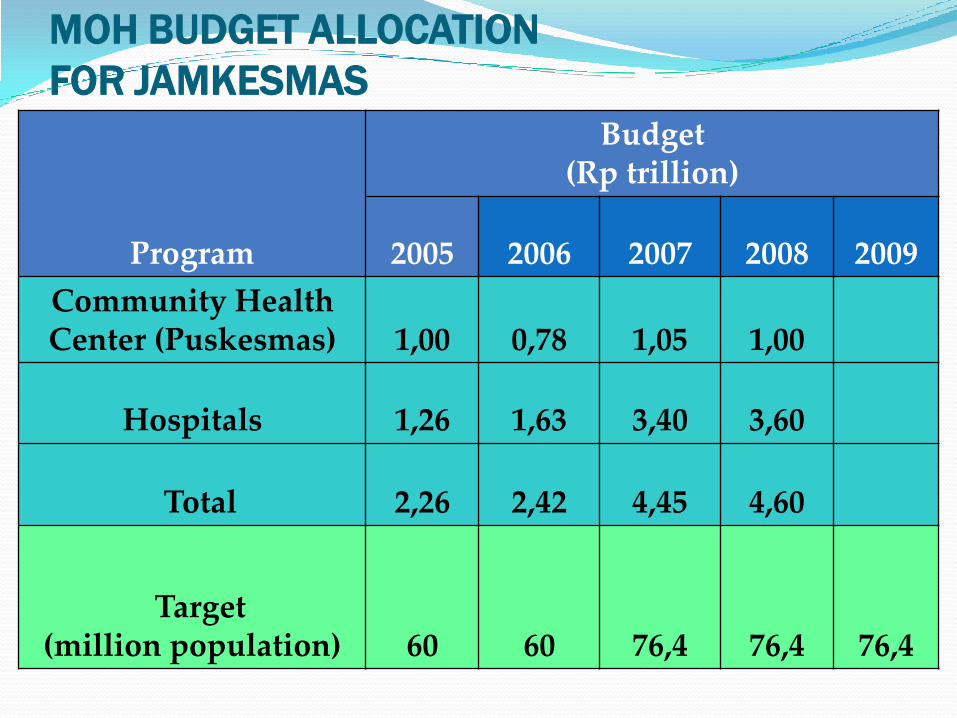
MOH BUDGET ALLOCATION
FOR JAMKESMAS
Program
Budget (Rp trillion)
2005 2006 2007 2008 2009
Community Health Center (Puskesmas) 1,00 0,78 1,05 1,00
Hospitals 1,26 1,63 3,40 3,60
Total 2,26 2,42 4,45 4,60
Target (million population) 60 60 76,4 76,4 76,4

ACCELERATION OF POVERTY REDUCTION
UNDERTAKEN BY THE MOSA, THROUGH:
I. Empowerment of very poor people (PPFM)
II. Empowerment of Remote Indigenous Communities (KAT)
III. Unconditional Cash Transfer (BLT)
IV. Conditional Cash Transfer/Family Hope Program (PKH)
V. Social Security for People with Severe Disability (PJSPC)
VI. Social Services and Security for Neglected Elderly (PJSLUT)
VII. Permanent Social Welfare Assistance (BKSP)
VIII. Social Welfare Insurance (ASKESOS)
17

The Usage of Cash Assistance
(food education health)
18

FREQUENCIES OF BENEFICIARIES VISITING
PRIMARY HEALTH INSTITUTIONS (MONTHLY )
19
Scale 1-4:
1 Never
2 Sometimes
3 Often
4 Always
Beneficiaries’ Commitment to send their
Children to School (Monthly)

THE IMPACT OF HEALTH EFFORTS
IN CCT PROGRAM
Since 2009, all CCT beneficiaries automatically being covered
by Community Health Insurance as known “Jamkesmas”.
It is reported that CCT beneficiaries are more easily accessed to
the basic health care, nutrition care, communicable disease
eradication, etc at the Health Centre (Puskesmas) and certain
referral at the Hospital
20

School Enrollment
of CCT Beneficiaries' Children
Have been enrolled in
school before CCT and regulalry present
(80.47%)
Enrolled in school after
CCT and regularly present (19.05%)
Enrolled in school but not
present(0.47%)
21
Schoool and not working99.18%
School while
working (0.82%)
The Comparison Between
Working & Not Working Students of
CCT Recipients

EDUCATION SIDE Average of monthly school presence of children are more
than 85%
Ministry of National Education has stipulated that Special
Stipend for Poor Children (Beasiswa Miskin) must be
prioritized to CCT beneficiaries.
But:
Some parents still expect their children to work.
In common, some state owned basic schools still maintain passing
grade mechanism for new students. Therefore more children of
poor households are not passed and have to study in private
schools or religious school institutions (e.g. Madrasah (MI/MTs).

PROBLEMSExclusion and inclusion error
Self-targeting
Lack of coordination among stakeholders, at centraland local level
Integrated CCT into National/Local CoordinatingTeam of Poverty Alleviation
Administration problems on reporting and recording
Simplify verification forms
23

Thank You
24
Terima kasih