collaboration. innovation. excellence
TRANSCRIPT

Collaboration.Innovation.Excellence.
Annual Report 2014
1
ABOUT US
PolyOne Corporation, with 2014 revenues of $3.8 billion, is a premier provider of specialized
polymer materials, services and solutions. We are dedicated to serving customers in diverse
industries around the globe, by creating value through collaboration, innovation and an unwavering
commitment to excellence. Guided by our Core Values, Sustainability Promise and No Surprises
PledgeSM, we are committed to our customers, employees, communities and shareholders through
ethical, sustainable and fiscally responsible principles.
By putting customers first and executing
our proven strategy, our global team of
associates delivered record-breaking
performances in 2014. We’re now building
on our momentum, collaborating and
innovating to make 2015 even better.
—Robert M. Patterson, President and Chief Executive Officer
ON THE COVER
Color treatment and selection
of this publication’s imagery
and content utilized PolyOne’s
InVisiOSM Color and Design
Services, including application
of our “Building Blocks” 2015
Color Inspiration palette.
Collaboration. Innovation. Excellence.Annual Report 2014
2
In this annual report, statements that are not reported financial results or other historical information are “forward-looking statements” within the meaning of the Private Securities Litigation Reform Act of 1995. Factors that could cause our actual results to differ materially from those implied by forward-looking statements are described in detail in Part l of the Form 10-K.
OUR VISION
To be the world’s premier
provider of specialized
polymer materials, services
and solutions.
OUR VALUES
Collaboration. Innovation.
Excellence.
These core values, which begin
with our individual decisions
and actions, focus our attention
on putting the customer first by
creating genuine value through
collaboration, innovation and
an unwavering commitment to
excellence. We will uphold these
values with the utmost integrity
in all that we do.OUR STRATEGY
SPECIALIZATION:
Differentiates us through unique
value-creating offerings to our
customers.
GLOBALIZATION:
Positions us to serve our
customers consistently,
everywhere in the world.
OPERATIONAL EXCELLENCE:
Empowers us to respond to the
voice of the customer with relentless
continuous improvement.
COMMERCIAL EXCELLENCE:
Governs our activities in the
marketplace to deliver extraordinary
value to our customers.
SPECIALIZATION:
GLOBALIZATION:
OPERATIONAL EXCELLENCE:
COMMERCIAL EXCELLENCE:
333
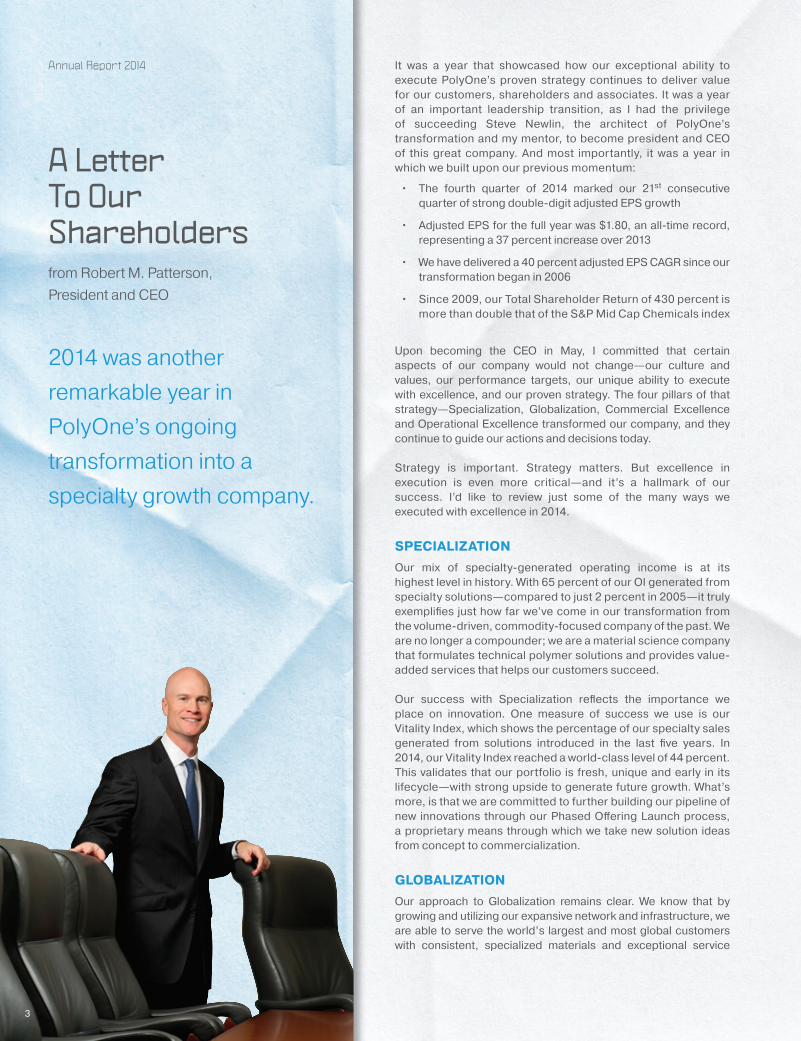
It was a year that showcased how our exceptional ability to execute PolyOne’s proven strategy continues to deliver value for our customers, shareholders and associates. It was a year of an important leadership transition, as I had the privilege of succeeding Steve Newlin, the architect of PolyOne’s transformation and my mentor, to become president and CEO of this great company. And most importantly, it was a year in which we built upon our previous momentum:
• The fourth quarter of 2014 marked our 21st consecutive quarter of strong double-digit adjusted EPS growth
• Adjusted EPS for the full year was $1.80, an all-time record, representing a 37 percent increase over 2013
• We have delivered a 40 percent adjusted EPS CAGR since our transformation began in 2006
• Since 2009, our Total Shareholder Return of 430 percent is more than double that of the S&P Mid Cap Chemicals index
Upon becoming the CEO in May, I committed that certain aspects of our company would not change—our culture and values, our performance targets, our unique ability to execute with excellence, and our proven strategy. The four pillars of that strategy—Specialization, Globalization, Commercial Excellence and Operational Excellence transformed our company, and they continue to guide our actions and decisions today.
Strategy is important. Strategy matters. But excellence in execution is even more critical—and it’s a hallmark of our success. I’d like to review just some of the many ways we executed with excellence in 2014.
SPECIALIZATION
Our mix of specialty-generated operating income is at its highest level in history. With 65 percent of our OI generated from specialty solutions—compared to just 2 percent in 2005—it truly exemplifies just how far we’ve come in our transformation from the volume-driven, commodity-focused company of the past. We are no longer a compounder; we are a material science company that formulates technical polymer solutions and provides value-added services that helps our customers succeed.
Our success with Specialization reflects the importance we place on innovation. One measure of success we use is our Vitality Index, which shows the percentage of our specialty sales generated from solutions introduced in the last five years. In 2014, our Vitality Index reached a world-class level of 44 percent. This validates that our portfolio is fresh, unique and early in its lifecycle—with strong upside to generate future growth. What’s more, is that we are committed to further building our pipeline of new innovations through our Phased Offering Launch process, a proprietary means through which we take new solution ideas from concept to commercialization.
GLOBALIZATION
Our approach to Globalization remains clear. We know that by growing and utilizing our expansive network and infrastructure, we are able to serve the world’s largest and most global customers with consistent, specialized materials and exceptional service
A Letter To Our Shareholdersfrom Robert M. Patterson,
President and CEO
2014 was another
remarkable year in
PolyOne’s ongoing
transformation into a
specialty growth company.
Annual Report 2014

44
wherever they need us to. A great example is in Pune, India, where we celebrated the opening of a new state-of-the-art facility that includes laboratories and manufacturing dedicated to color and additive solutions. In Shanghai, China we announced plans for a new Innovation Center to facilitate collaboration, accelerate application development and increase speed-to-market for specialty solutions in the Asia Pacific region. We continue to grow in this important market, where last year we achieved record revenue and profitability. In Europe, we delivered 34 percent adjusted operating income growth, despite challenging and pervasive macro-economic headwinds. While the challenges in Europe and the situation in Russia and Ukraine may persist, we will continue to monitor and take precautionary measures, minimize our exposure, and perform despite the uncertainties.
COMMERCIAL EXCELLENCE
Nothing pleases us more than helping our customers succeed, and when it comes to serving them, we always expect to be number one. Second place isn’t good enough. In 2014, we received many awards and recognitions in a wide range of topics from M&A to community relations. Yet the awards we cherish the most are those granted to us by our customers. For example, last year we were honored to receive the “Product Innovation—Global Supplier of the Year” award from Becton, Dickinson and Company; the inaugural “Supplier Excellence Award” from Quality Synthetic Rubber (QSR) and Qure Medical; and the “Supplier of the Year” award from AMA Plastics.
Our approach to Commercial Excellence is now well engrained in our businesses, and we are making strong progress as we transform the commercial organization of the legacy Spartech as well. We’ve trained our sales force in customer centric selling, EVE tools, and utilization of our CRM resources—and we continue to leverage our internal expertise to cross-train and cross-sell as our integration efforts continue.
OPERATIONAL EXCELLENCE
In another key milestone in our integration of Spartech, we completed the previously announced North American asset realignment and continue to focus on making improvements in quality, service and delivery at the impacted facilities. Lean Six Sigma is the lifeblood of formal process improvement at PolyOne. More than 2,700 of our associates are trained on the methodology, and our approach to process improvement pervades our global organization.
Our “safety first” mindset and culture were reflected in an incident rate of 0.84, an improvement of 13 percent compared to 2013. Our safety performance is five times better than the Plastics and Rubber Manufacturing Industry average of 4.4, and as new members of the American Chemistry Council, we are implementing its Responsible Care Management System® to further drive continual improvement in workplace safety. Our working capital performance improved to 9.9 percent of sales, and we were recognized for the fourth year in a row in the CFO/REL Working Capital Scorecard as “Best in Industry.” Other third-party accolades we earned last year included being ranked among the 50 Best Manufacturing Companies by IndustryWeek Magazine, and winning the “2014 Best Emerging Maintenance Reliability Program Award” from Uptime® Magazine.
FINANCIAL RESULTS
Our strategy, when executed with excellence, delivers financial performance expected from a specialty growth company. Adjusted earnings per share have never been higher, and our five-year Total Shareholder Return of 430 percent quantifies our exceptional performance. As a result of the rapid growth in our earnings, in 2014 we increased our dividend 25 percent, which is now 250 percent higher than when we initiated it in 2011. We also bought back 6.3 million shares of our stock. Going forward, we expect to continue to deliver for our shareholders through share price appreciation, share repurchases and increasing dividends.
OUR FOUNDATION—POLYONE ASSOCIATES
Performance like ours is only possible with a passionate and innovative workforce dedicated to helping our customers succeed. At PolyOne we have just that—6,900 global associates working each day to execute our proven strategy and uphold our core values. Our team continues to strengthen, and we are building a world-class sustainable organization that thrives on, expects and delivers exceptional results.
A PLATINUM VISION FOR THE FUTURE
While no doubt a successful year, 2014 is history. We are now using our momentum to make 2015 even better. We’ve made great progress and have already achieved many of the 2015 goals we set for ourselves three years ago. Yet at PolyOne, we’re always asking ourselves, “what’s next?” Five years ago few would have predicted where we are today. And despite our remarkable transformation and what our scorecard currently shows, there is much more to come.
We’re defining our own future—one in which we expect to take PolyOne from gold to platinum. At the heart of this movement, we will elevate our rigorous and strategic focus on innovation to even greater heights. Our associates and customers will collaborate as a natural course of business, bringing to life new solutions that improve our customers’ product performance and bolster their bottom line. Our platinum vision will include unprecedented expectations of ourselves and bold performance targets we will strive to achieve. With our balance sheet strength, global infrastructure, culture of innovation, ability to execute and outstanding management team, we have limitless potential. And translation of that potential into future growth is already well underway!
In closing, I would like to first thank our dedicated customers, for choosing PolyOne as a partner for their material science and services needs. Thank you to our shareholders for your trust in PolyOne’s ability to deliver and grow. I am thankful to our diverse and talented Board of Directors for their ongoing support and guidance. And finally, I thank and congratulate our global associates for all they accomplished to make 2014 the best year in company history. I am inspired by them and look forward to making 2015 our best year ever!
Robert M. Patterson
President and Chief Executive OfficerMarch 16, 2015

Operating Income Mix Shift*^
% of O
perating Income
SPECIALTY DISTRIBUTION PP&S JV's
*Operating Income excludes Corporate charges and special items
^2005–2009 has not been restated for subsequent changes in accounting
principles or discontinued operations
100
80
60
40
20
0'05 '06 '07 '08 '09 '10 '11 '12 '13 '14
PROOF OF PERFORMANCEOur values, strategy, and execution are clearly evident in our financial performance.
STOCK PERFORMANCE
PolyOne’s stock performance has significantly outpaced the S&P 500 index and the S&P Mid Cap Chemicals index.
Adjusted Earnings Per Share°†
°EPS excluding special items and income from equity affiliates
†2006–2009 has not been restated for subsequent changes in accounting
principles or discontinued operations
2.00
1.60
1.20
.80
.40
0
'06 '07 '08 '09 '10 '11 '12'13 '14
$ US
Dollars
Working Capital % of SalesΔ
20
16
12
8
4
0'07 '08 '09 '10 '11 '12 '13
'14
Percentage
TARGETS FOR GROWTH
Last year, we continued to pursue the aggressive 2015 performance targets established in 2012.
500
450
400
350
300
250
200
150
100
50
0
-50
12.31.09 6.30.10 12.31.10 6.30.11 12.31.11 6.30.12 12.31.12 6.30.13 12.31.13 6.30.14 12.31.14DATE
Percentage
Stock Performance vs. S&P
POL
S&P MID CAP CHEMICALS
S&P 500
1.7%
1.1%
1.4% (2012)
5.5%
2.6%
6.0%
5.0%
N/A
14.7%
12.1%
7.3%
7.7%
6.1%
65%
11.3%
37%
12%–16%
12%–16%
8%–10%
9%–12%
6%–7.5%
65%–75%
15%
Double Digit Expansion
Operating Income %
Specialty:
• Global Color, Additives & Inks
• Global Specialty Engineered Materials
• Designed Structures & Solutions
Performance Products & Solutions
Distribution
Specialty Platform % of Operating Income
ROIC*
Adjusted EPS Growth
2015 TARGET(Established 2012)
2014(Where we are)
2006(Where we were)
*ROIC is defined as TTM adjusted OI divided by the sum of average debt and equity over a 5 quarter period
ΔDefined as the average thirteen months of accounts receivable,
plus inventory, less accounts payable divided by full year sales
5
Annual Report 2014

United StatesSecurities and Exchange Commission
Washington, DC 20549
FORM 10-KÍ ANNUAL REPORT PURSUANT TO SECTION 13 OR 15(d) OF THE SECURITIES EXCHANGE ACT OF 1934
For the fiscal year ended December 31, 2014
‘ TRANSITION REPORT PURSUANT TO SECTION 13 OR 15(d) OF THE SECURITIES EXCHANGE ACT OF 1934
For the transition period from to .
Commission file number 1-16091
PolyOne Corporation(Exact name of registrant as specified in its charter)
Ohio 34-1730488
(State or other jurisdiction ofincorporation or organization)
(IRS Employer Identification No.)
33587 Walker Road, 44012
Avon Lake, Ohio (Zip Code)
(Address of principal executive offices)
Registrant’s telephone number, including area code (440) 930-1000
Securities registered pursuant to Section 12(b) of the Act:
Title of each class Name of each exchange on which registered
Common Shares, par value $.01 per share New York Stock Exchange
Securities registered pursuant to Section 12(g) of the Act:None
Indicate by check mark if the registrant is a well-known seasoned issuer, as defined in Rule 405 of the Securities Act. Yes Í No ‘
Indicate by check mark if the registrant is not required to file reports pursuant to Section 13 or Section 15(d) of the Act. Yes ‘ No Í
Indicate by check mark whether the registrant: (1) has filed all reports required to be filed by Section 13 or 15(d) of the Securities Exchange Act of1934 during the preceding 12 months (or for such shorter period that the registrant was required to file such reports), and (2) has been subject tosuch filing requirements for the past 90 days. Yes Í No ‘
Indicate by check mark if disclosure of delinquent filers pursuant to Item 405 of Regulation S-K is not contained herein, and will not be contained, tothe best of registrant’s knowledge, in definitive proxy or information statements incorporated by reference in Part III of this Form 10-K or anyamendment to this Form 10-K. Í
Indicate by check mark whether the registrant has submitted electronically and posted on its corporate Web site, if any, every Interactive Data Filerequired to be submitted and posted pursuant to Rule 405 of Regulation S-T during the preceding 12 months (or for such shorter period that theregistrant was required to submit and post such files). Yes Í No ‘
Indicate by check mark whether the registrant is a large accelerated filer, an accelerated filer, a non-accelerated filer, or a smaller reporting company.See the definitions of “large accelerated filer,” “accelerated filer” and “smaller reporting company” in Rule 12b-2 of the Exchange Act. (Check one):
Large accelerated filer Í Accelerated filer ‘ Non-accelerated filer ‘ Smaller reporting company ‘
(Do not check if a smaller reporting company)
Indicate by check mark whether the registrant is a shell company (as defined in Rule 12b-2 of the Exchange Act). Yes ‘ No Í
The aggregate market value of the registrant’s outstanding common shares held by non-affiliates on June 30, 2014, determined using a per shareclosing price on that date of $42.14, as quoted on the New York Stock Exchange, was $3.7 billion.
The number of shares of common shares outstanding as of January 31, 2015 was 89,100,439.
DOCUMENTS INCORPORATED BY REFERENCE
Part III of this Annual Report on Form 10-K incorporates by reference certain information from the registrant’s definitive Proxy Statement with respectto the 2015 Annual Meeting of Shareholders.
POLYONE CORPORATION

[THIS PAGE INTENTIONALLY LEFT BLANK]

PART I
CAUTIONARY NOTE ON FORWARD-LOOKING STATEMENTS
In this Annual Report on Form 10-K, statements that are not reported financial results or otherhistorical information are “forward-looking statements” within the meaning of the Private SecuritiesLitigation Reform Act of 1995. Forward-looking statements give current expectations or forecasts offuture events and are not guarantees of future performance. They are based on management’sexpectations that involve a number of business risks and uncertainties, any of which could causeactual results to differ materially from those expressed in or implied by the forward-looking statements.You can identify these statements by the fact that they do not relate strictly to historic or current facts.They use words such as “anticipate,” “estimate,” “expect,” “project,” “intend,” “plan,” “believe” and otherwords and terms of similar meaning in connection with any discussion of future operating or financialperformance and/or sales. In particular, these include statements relating to future actions; prospectivechanges in raw material costs, product pricing or product demand; future performance; estimatedcapital expenditures; results of current and anticipated market conditions and market strategies; salesefforts; expenses; the outcome of contingencies such as legal proceedings; and financial results.Factors that could cause actual results to differ materially from those implied by these forward-lookingstatements include, but are not limited to:
• the effect on foreign operations of currency fluctuations, tariffs and other political, economicand regulatory risks;
• changes in polymer consumption growth rates and laws and regulations regarding thedisposal of plastic materials where we conduct business;
• changes in global industry capacity or in the rate at which anticipated changes in industrycapacity come online in the industries in which we participate;
• fluctuations in raw material prices, quality and supply, and in energy prices and supply;
• production outages or material costs associated with scheduled or unscheduled maintenanceprograms;
• unanticipated developments that could occur with respect to contingencies such as litigationand environmental matters, including any developments that would require any increase inour costs and/or reserves for such contingencies;
• an inability to achieve or delays in achieving or achievement of less than the anticipatedfinancial benefit from initiatives related to working capital reductions, cost reductions andemployee productivity goals;
• an inability to raise or sustain prices for products or services;
• an inability to maintain appropriate relations with unions and employees;
• the speed and extent of an economic recovery, including the recovery of the housing markets;
• the financial condition of our customers, including the ability of customers (especially those thatmay be highly leveraged and those with inadequate liquidity) to maintain their credit availability;
• disruptions, uncertainty or volatility in the credit markets that may limit our access to capital;
• other factors affecting our business beyond our control, including, without limitation, changesin the general economy, changes in interest rates and changes in the rate of inflation;
• the amount and timing of repurchases, if any, of PolyOne common shares;
• our ability to pay regular quarterly cash dividends and the amounts and timing of any futuredividends;
• our ability to realize anticipated savings and operational benefits from the realignment ofassets, including the closure of manufacturing facilities; the timing of closings and shifts of
POLYONE CORPORATION 1

production to new facilities related to asset realignments and any unforeseen loss ofcustomers and/or disruptions of service or quality caused by such closings and/or productionshifts; separation and severance amounts that differ from original estimates, amounts for non-cash charges related to asset write-offs and accelerated depreciation realignments ofproperty, plant and equipment, that differ from original estimates;
• our ability to identify and evaluate acquisition targets and consummate acquisitions;
• the ability to successfully integrate acquired companies into our operations, retain themanagement teams of acquired companies, and retain relationships with customers ofacquired companies, including, without limitation, Spartech and Accella PerformanceMaterials; and
• other factors described in this Annual Report on Form 10-K under Item 1A, “Risk Factors.”
We cannot guarantee that any forward-looking statement will be realized, although we believe we havebeen prudent in our plans and assumptions. Achievement of future results is subject to risks,uncertainties and inaccurate assumptions. Should known or unknown risks or uncertainties materialize,or should underlying assumptions prove inaccurate, actual results could vary materially from thoseanticipated, estimated or projected. Investors should bear this in mind as they consider forward-lookingstatements. We undertake no obligation to publicly update forward-looking statements, whether as aresult of new information, future events or otherwise, except as otherwise required by law. You areadvised, however, to consult any further disclosures we make on related subjects in our reports onForms 10-Q, 8-K and 10-K furnished to the SEC. You should understand that it is not possible topredict or identify all risk factors. Consequently, you should not consider any such list to be a completeset of all potential risks or uncertainties.
ITEM 1. BUSINESS
Business Overview
We are a premier provider of specialized polymer materials, services and solutions with operations inspecialty polymer formulations, color and additive systems, plastic sheet and packaging solutions andpolymer distribution. We are also a highly specialized developer and manufacturer of performanceenhancing additives, liquid colorants and fluoropolymers and silicone colorants. Headquartered in AvonLake, Ohio, we have employees at sales, manufacturing and distribution facilities in North America,South America, Europe, Asia and Africa. We provide value to our customers through our ability to linkour knowledge of polymers and formulation technology with our manufacturing and supply chaincapabilities to provide value added solutions to designers, assemblers and processors of plastics (ourcustomers). When used in this Annual Report on Form 10-K, the terms “we,” “us,” “our”, “PolyOne” andthe “Company” mean PolyOne Corporation and its consolidated subsidiaries.
PolyOne was formed on August 31, 2000 from the consolidation of The Geon Company (Geon) andM.A. Hanna Company (Hanna). Geon’s roots date back to 1927 when BFGoodrich scientist WaldoSemon produced the first usable vinyl polymer. In 1948, BFGoodrich created a vinyl plastic divisionthat was subsequently spun off through a public offering in 1993, creating Geon, a separate publicly-held company. Hanna was formed in 1885 as a privately-held company and became publicly-held in1927. In the mid-1980s, Hanna began to divest its historic mining and shipping businesses to focus onpolymers. Hanna purchased its first polymer company in 1986 and completed its 26th polymercompany acquisition in 2000.
PolyOne Corporation is incorporated in Ohio and headquartered in Avon Lake, Ohio. We employapproximately 6,900 people and have 75 manufacturing sites and eight distribution facilities in NorthAmerica, South America, Europe and Asia. We offer more than 35,000 polymer solutions to over10,000 customers across the globe. In 2014, we had sales of $3.8 billion, 32% of which were tocustomers outside the United States.
2 POLYONE CORPORATION

We provide value to our customers with solutions built upon our ability to leverage our polymer andformulation expertise with our operational capabilities, being the essential link between large chemicalproducers (our raw material suppliers) and designers, assemblers and processors of plastics (ourcustomers). We believe that our role in the value chain continues to become more essential as ourcustomers need reliable suppliers with global reach and more effective solutions to improve theirprofitability and competitive advantage. Our goal is to provide our customers with specialized materialsand service solutions through our global reach, broad market knowledge, technical expertise, productbreadth, efficient manufacturing operations, a fully integrated information technology network, and rawmaterial procurement leverage. Our end markets are primarily in transportation, packaging, building andconstruction, industrial, healthcare, consumer, wire and cable, electrical and electronics, and appliance.
Polymer Industry Overview
Polymers are a class of organic materials that are generally produced by converting natural gas or crudeoil derivatives into monomers, such as ethylene, propylene, vinyl chloride and styrene. These monomersare then polymerized into chains called polymers, or plastic resin, such as polyethylene andpolypropylene, in their most basic forms. Large petrochemical companies, including some in thepetroleum industry, produce a majority of the monomers and base resins because they have directaccess to the raw materials needed for production. Monomers make up the majority of the variable costof manufacturing the base resin. As a result, the cost of a base resin tends to move in tandem with theindustry market prices for monomers and the cost of raw materials and energy used during production.Resin selling prices can move in tandem with costs, but are largely driven by supply and demand.
Thermoplastic polymers make up a substantial majority of the resin market and are characterized by theirability to be reshaped repeatedly into new forms after heat and pressure are applied. Thermoplasticsoffer versatility and a wide range of applications. The major types of thermoplastics include polyethylene,polyvinyl chloride, polypropylene, polystyrene, polyester and a range of specialized engineering resins.Each type of thermoplastic has unique qualities and characteristics that make it appropriate for use in aparticular application. Thermoplastic composites include these base resins, but are combined with astructural filler such as glass, carbon or polymer fibers to enhance strength, rigidity and structure. Furtherperformance can be delivered through an engineered thermoplastic sheet or thick film, which mayincorporate more than one resin formulation or composite in multiple layers to impart additional propertiessuch as gas barrier, structural integrity and lightweighting.
Thermoplastic and polymer composites are found in a variety of end-use products and markets,including packaging, building and construction, wire and cable, transportation, medical, furniture andfurnishings, durable goods, electrical and electronics, adhesives, inks and coatings. Each type ofthermoplastic resin has unique characteristics (such as flexibility, strength or durability) suitable for usein a particular end-use application. The packaging industry requires plastics that help keep food freshand free of contamination while providing a variety of options for product display, and offeringadvantages in terms of weight and user-friendliness. In the building and construction industry, plasticprovides an economical and energy efficient replacement for other traditional materials in pipingapplications, siding, flooring, insulation, windows and doors, as well as structural and interior ordecorative uses. In the wire and cable industry, thermoplastics serve to protect by providing electricalinsulation, flame resistance, durability, water resistance, and color coding to wire coatings andconnectors. In the transportation industry, plastic has proven to be durable, lightweight and corrosionresistant while offering fuel savings, design flexibility and high performance, often replacing traditionalmaterials such as metal and glass. In the medical industry, plastics are used for a vast array of devicesand equipment, including blood and intravenous bags, medical tubing, catheters, lead replacement forradiation shielding, clamps and connectors to bed frames, curtains and sheeting, electronic enclosuresand equipment housings. In the electronics industry, plastic enclosures and connectors not onlyenhance safety through electrical insulation, but thermally and electrically conductive plastics provideheat transferring, cooling, antistatic, electrostatic discharge, and electromagnetic shieldingperformance for critical applications including integrated circuit chip packaging.
POLYONE CORPORATION 3
Various additives can be formulated with a base resin and further engineered into a structure toprovide them with greater versatility and performance. Polymer formulations and structures haveadvantages over metals, wood, rubber, glass and other traditional materials, which have resulted in thereplacement of these materials across a wide spectrum of applications that range from automobileparts to construction materials. These specialized polymers offer advantages compared to traditionalmaterials that include design freedom, processability, weight reduction, chemical resistance, flameretardance and lower cost. Plastics are renowned for their durability, aesthetics, ease of handling andrecyclability.
PolyOne Segments
We operate in five reportable segments: (1) Global Color, Additives and Inks; (2) Global SpecialtyEngineered Materials; (3) Designed Structures and Solutions; (4) Performance Products and Solutions;and (5) PolyOne Distribution.
On December 1, 2014, the Company completed the acquisition of specialty assets of AccellaPerformance Materials (Accella). The Accella acquisition complements the existing specialty businessportfolio by providing specialty coating solutions and value-added services in a wide-range ofapplications, including consumer products, interior and under-the-hood automotive parts, outdoorrecreational equipment and food packaging.
On May 30, 2013, we sold our vinyl dispersion, blending and suspension resin assets (Resin Business)to Mexichem Specialty Resins Inc. (Mexichem). As a result of the sale, the Resin Business has beenremoved from the Performance Products and Solutions segment and is presented as a discontinuedoperation in all periods presented.
On March 13, 2013, PolyOne acquired Spartech Corporation (Spartech), a supplier of sustainableplastic sheet, color and engineered materials, and packaging solutions, based in Clayton, Missouri.The acquisition of Spartech has provided substantial synergies through enhanced operational costefficiencies and has expanded PolyOne’s specialty portfolio.
Spartech’s results have been reflected within our Consolidated Statements of Income and within ourDesigned Structures and Solutions segment, as well as within our Global Specialty EngineeredMaterials, Global Color, Additives and Inks and Performance Products and Solutions segments, sincethe date of acquisition.
Our segments are further discussed in Note 16, Segment Information.
Global Color, Additives and Inks
Global Color, Additives and Inks is a leading provider of specialized custom color and additiveconcentrates in solid and liquid form for thermoplastics, dispersions for thermosets, as well as specialtyinks, plastisols, and vinyl slush molding solutions. Color and additive solutions include an innovativearray of colors, special effects and performance-enhancing and eco-friendly solutions. When combinedwith a non-base resin, our solutions help customers achieve differentiated specialized colors andeffects targeted at the demands of today’s highly design-oriented consumer and industrial endmarkets. Our additive concentrates encompass a wide variety of performance and process enhancingcharacteristics and are commonly categorized by the function that they perform, such as UVstabilization, antimicrobial, anti-static, blowing or foaming, antioxidant, lubricant, and productivityenhancement. Our colorant and additives concentrates are used in a broad range of polymers,including those used in medical and pharmaceutical devices, food packaging, personal care andcosmetics, transportation, building products, wire and cable markets. We also provide custom-formulated liquid systems that meet a variety of customer needs and chemistries, including vinyl,natural rubber and latex, polyurethane and silicone. Our offering also includes proprietary inks andlatexes for diversified markets such as recreational and athletic apparel, construction and filtration,outdoor furniture and healthcare. Our liquid polymer coatings and additives are largely based on vinyl
4 POLYONE CORPORATION

and are used in a variety of markets, including building and construction, consumer, healthcare,industrial, packaging, textiles, appliances, transportation, and wire and cable. Global Color, Additivesand Inks has manufacturing, sales and service facilities located throughout North America, SouthAmerica, Europe, Asia and Africa.
On December 1, 2014, the Company completed the acquisition of specialty assets of Accella, a leadingNorth American manufacturer of liquid polymer formulations, for $47.2 million in cash, net of cashacquired. Accella results are included within the Global Color, Additives and Inks segment.
Global Specialty Engineered Materials
Global Specialty Engineered Materials is a leading provider of specialty polymer formulations, servicesand solutions for designers, assemblers and processors of thermoplastic materials across a widevariety of markets and end-use applications. Our product portfolio, which we believe to be one of themost diverse in our industry, includes specialty formulated high-performance polymer materials that aremanufactured using thermoplastic resins and elastomers, which are then combined with advancedpolymer additives, reinforcement, filler, colorant and/or biomaterial technologies. Our technical andmarket expertise enables us to expand the performance range and structural properties of traditionalengineering-grade thermoplastic resins to meet evolving customer needs. Global Specialty EngineeredMaterials has manufacturing, sales and service facilities located throughout North America, Europe,Asia and South America. Our product development and application reach is further enhanced by thecapabilities of our Innovation Centers in the United States, Germany and China, which produce andevaluate prototype and sample parts to help assess end-use performance and guide productdevelopment. Our manufacturing capabilities are targeted at meeting our customers’ demand forspeed, flexibility and critical quality.
Designed Structures and Solutions
On March 13, 2013, the Company completed the acquisition of Spartech, a supplier of plastic sheet,color and engineered materials, and packaging solutions. As a result of the acquisition, a newreportable segment, “Designed Structures and Solutions”, was created. Designed Structures andSolutions is comprised of the former Spartech Custom Sheet and Rollstock and PackagingTechnologies businesses. We believe PolyOne’s Designed Structures and Solutions segment is amarket leader in providing specialized, full service and innovative solutions in engineered polymerstructures, rigid barrier packaging and specialty cast acrylics. We utilize a variety of polymers, specialtyadditives and processing technologies to produce a complete portfolio of sheet, custom rollstock andspecialty film, laminate and acrylic solutions. Our solutions can be engineered to provide structural orfunctional performance in an application or deliver design and visual aesthetics to meet our customers’needs. Our offerings also include a wide range of sustainable, cost-effective stock and custompackaging solutions for various industry processes used in the food, medical, consumer and graphicarts markets. In addition to packaging, we also work closely with customers to provide solutions fortransportation, building and construction, healthcare and consumer markets. Designed Structures andSolutions has manufacturing, sales and service facilities located throughout North America.
Performance Products and Solutions
Performance Products and Solutions is comprised of the Geon Performance Materials (Geon) andProducer Services business units. The Geon business delivers an array of products and services forvinyl molding and extrusion processors located in North America and Asia. The Geon brand namecarries strong recognition globally. Geon’s products are sold to manufacturers of durable plastic partsand consumer-oriented products. We also offer a wide range of services including materials testing,component analysis, custom formulation development, colorant and additive services, part designassistance, structural analysis, process simulations, mold design and flow analysis and extruder screwdesign. Vinyl is used across a broad range of markets and applications, including, but not limited to:
POLYONE CORPORATION 5

healthcare, wire and cable, building and construction, consumer and recreational products andtransportation and packaging. The Producer Services business unit offers contract manufacturing andoutsourced polymer manufacturing services to resin producers and polymer marketers, primarily in theUnited States and Mexico, as well as its own proprietary compounds for pressure pipe and dripirrigation applications. As a strategic and integrated supply chain partner, Producer Services offersresin producers a way to develop custom products for niche markets by using our process technologyexpertise and multiple manufacturing platforms.
PolyOne Distribution
The PolyOne Distribution business distributes more than 3,500 grades of engineering and commoditygrade resins, including PolyOne-produced solutions, principally to the North American and Asianmarkets. These products are sold to over 6,000 custom injection molders and extruders who, in turn,convert them into plastic parts that are sold to end-users in a wide range of industries. Representingover 25 major suppliers, we offer our customers a broad product portfolio, just-in-time delivery frommultiple stocking locations and local technical support. Recent expansion in Central America and Asiahave bolstered PolyOne Distribution’s ability to serve the specialized needs of customers globally.
Competition
The production of plastics and the manufacturing of custom and proprietary formulated color andadditives systems for the plastics industry are highly competitive. Competition is based on service,performance, product innovation, product recognition, speed, delivery, quality and price. The relativeimportance of these factors varies among our products and services. We believe that we are thelargest independent formulator of plastic materials and producer of custom and proprietary color andadditive systems in the United States and Europe, with a growing presence in Asia and South America.Our competitors range from large international companies with broad product offerings to localindependent custom producers whose focus is a specific market niche or product offering.
The distribution of polymer resin is also highly competitive. Speed, service, reputation, product line,brand recognition, delivery, quality and price, are the principal factors affecting competition. Wecompete against other national independent resin distributors in North America, along with otherregional distributors. Growth in the polymer distribution market is directly correlated with growth in thebase polymer resins market. We believe that the strength of our company name and reputation, thebroad range of product offerings from our suppliers and our speed and responsiveness, coupled withthe quality of products and agility of our distribution network, allow us to compete effectively.
Raw Materials
The primary raw materials used by our manufacturing operations are polyvinyl chloride (PVC) resin,polyolefin and other thermoplastic resins, plasticizers, inorganic and organic pigments, all of which webelieve are in adequate supply. We have a long-term supply contract with Oxy Vinyls LP, a formerequity investment affiliate, under which the majority of our PVC resin is supplied. This contract containsa year-by-year evergreen renewal provision, unless terminated by either party with a one-year advancenotice. We believe this contract assures the availability of adequate amounts of PVC resin. We alsobelieve that the pricing under this contract provides PVC resins to us at a competitive cost. See thediscussion of risks associated with raw material supply and costs in Item 1A, “Risk Factors”.
Patents and Trademarks
We own and maintain a number of patents and trademarks in the United States and other keycountries that contribute to our competitiveness in the markets we serve because they protect ourinventions and product names against infringement by others. Patents exist for 20 years from filingdate, and trademarks have an indefinite life based upon continued use. While we view our patents and
6 POLYONE CORPORATION

trademarks to be valuable because of the broad scope of our products and services and brandrecognition we enjoy, we do not believe that the loss or expiration of any single patent or trademarkwould have a material adverse effect on our results of operations, financial position or cash flows.Nevertheless, we have implemented management processes designed to protect our inventions andtrademarks.
Seasonality and Backlog
Sales of our products and services are slightly seasonal as demand is generally slower in the first andfourth calendar quarters of the year. Because of the nature of our business, we do not believe that ourbacklog is a meaningful indicator of the level of our present or future business.
Working Capital Practices
Our products are generally manufactured with a short turnaround time, and the scheduling ofmanufacturing activities from customer orders generally includes enough lead time to assure deliveryof an adequate supply of raw materials. We offer payment terms to our customers that are competitive.We generally allow our customers to return merchandise if pre-agreed quality standards orspecifications are not met; however, we employ quality assurance practices that seek to minimizecustomer returns. Our customer returns are immaterial.
Significant Customers
No customer accounted for more than 2% of our consolidated revenues in 2014, and we do not believewe would suffer a material adverse effect if we were to lose any single customer.
Research and Development
We have substantial technology and development capabilities. Our efforts are largely devoted todeveloping new product formulations to satisfy defined market needs, by providing quality technicalservices to evaluate alternative raw materials, assuring the continued success of our products forcustomer applications, providing technology to improve our products, processes and applications, andproviding support to our manufacturing plants for cost reduction, productivity and quality improvementprograms. We operate research and development centers that support our commercial developmentactivities and manufacturing operations. These facilities are equipped with state-of-the-art analytical,synthesis, polymer characterization and testing equipment, along with pilot plants and polymermanufacturing operations that simulate specific production processes that allow us to rapidly translatenew technologies into new products. Our investment in product research and development fromcontinuing operations was $53.4 million in 2014, $52.6 million in 2013 and $41.3 million in 2012.
Methods of Distribution
We sell products primarily through direct sales personnel, distributors, including our PolyOneDistribution segment, and commissioned sales agents. We primarily use truck carriers to transport ourproducts to customers, although some customers pick up product at our manufacturing facilities orwarehouses. We also ship some of our manufactured products to customers by rail.
Employees
As of December 31, 2014, we employed approximately 6,900 people. Approximately 5% of ouremployees are represented by labor unions under collective bargaining agreements. We believe thatrelations with our employees are good, and we do not anticipate significant operating issues to occuras a result of current negotiations, or when we renegotiate collective bargaining agreements as theyexpire.
POLYONE CORPORATION 7
Environmental, Health and Safety
We are subject to various environmental laws and regulations that apply to the production, use andsale of chemicals, emissions into the air, discharges into waterways and other releases of materialsinto the environment and the generation, handling, storage, transportation, treatment and disposal ofwaste material. We endeavor to ensure the safe and lawful operation of our facilities in themanufacture and distribution of products, and we believe we are in material compliance with allapplicable laws and regulations.
We maintain a disciplined environmental and occupational safety and health compliance program andconduct periodic internal and external regulatory audits at our facilities to identify and categorizepotential environmental exposures, including compliance matters and any actions that may be requiredto address. This effort can result in process or operational modifications, the installation of pollutioncontrol devices or cleaning up grounds or facilities. We believe that we are in material compliance withall applicable requirements.
We are strongly committed to safety as evidenced by our injury incidence rate of 0.84 per 100 full-timeworkers per year in 2014, compared to 0.97 in 2013. The 2013 average injury incidence rate for ourNAICS Code (326 Plastics and Rubber Products Manufacturing) was 4.4.
In our operations, we must comply with product-related governmental law and regulations affecting theplastics industry generally and also with content-specific law, regulations and non-governmentalstandards. We believe that compliance with current governmental laws and regulations and with non-governmental content-specific standards will not have a material adverse effect on our financial position,results of operations or cash flows. The risk of additional costs and liabilities, however, is inherent incertain plant operations and certain products produced at these plants, as is the case with othercompanies in the plastics industry. Therefore, we may incur additional costs or liabilities in the future.Other developments, such as increasingly strict environmental, safety and health laws, regulations andrelated enforcement policies, including those under the Restrictions on the Use of Certain HazardousSubstances (RoHS), Registration, Evaluation, Authorization and Restriction of Chemicals (REACH), theDodd-Frank Wall Street Reform and Consumer Protection Act (covering Conflict Minerals), and theConsumer Product Safety Improvement Act, the implementation of additional content-specific standards,discovery of unknown conditions, and claims for damages to property, persons or natural resourcesresulting from plant emissions or products, could also result in additional costs or liabilities.
A number of foreign countries and domestic communities have enacted, or are considering enacting,laws and regulations concerning the use and disposal of plastic materials. Widespread adoption ofthese laws and regulations, along with public perception, may have an adverse impact on sales ofplastic materials. Although many of our major markets are in durable, longer-life applications that couldreduce the impact of these kinds of environmental regulations, more stringent regulation of the use anddisposal of plastics may have an adverse effect on our business.
We have been notified by federal and state environmental agencies and by private parties that we maybe a potentially responsible party (PRP) in connection with their investigation and remediation of anumber of environmental sites. While government agencies assert that PRPs are jointly and severallyliable at these sites, in our experience, interim and final allocations of liability costs are generally madebased on the relative contribution of waste. However, even when allocations of costs based on relativecontribution of waste have been made, we cannot assure that our allocation will not increase if otherPRPs do not pay their allocated share of these costs.
We incurred environmental expenses, before insurance recoveries, of $10.3 million in 2014, $61.2million in 2013 and $12.8 million in 2012. Our environmental expense in 2014, 2013 and 2012 relatedmostly to ongoing remediation projects. 2013 expense included a $47.0 million adjustment to ourCalvert City reserve, which is discussed further in Note 13, Commitments and Contingencies. In 2014and 2013, we received insurance recoveries $3.7 million and $23.5 million, respectively, asreimbursement of previously incurred environmental remediation costs.
8 POLYONE CORPORATION

We also conduct investigations and remediation at certain of our active and inactive facilities and haveassumed responsibility for the resulting environmental liabilities from operations at sites we, or ourpredecessors, formerly owned or operated. We believe that our potential continuing liability at thesesites will not have a material adverse effect on our results of operations, financial position or cashflows. In addition, we voluntarily initiate corrective and preventive environmental projects at ourfacilities. As of December 31, 2014, our reserves totaled $121.1 million, covering probable futureenvironmental expenditures that we can reasonably estimate related to previously contaminated sites.This amount represents our best estimate of probable costs, based upon the information andtechnology currently available.
Depending upon the results of future testing, the ultimate remediation alternatives undertaken,changes in regulations, new information, newly discovered conditions and other factors, it isreasonably possible that we could incur additional costs in excess of the amount accrued atDecember 31, 2014. Such costs, if any, cannot be currently estimated. We may revise our estimate ofthis liability as new regulations or technologies are developed, or additional information is obtained.
Refer to Note 13, Commitments and Contingencies, for further discussion of our environmental liabilities.
We expect 2015 environmental cash expenditures to approximate $11.5 million.
International Operations
Our international operations are subject to a variety of risks, including currency fluctuations anddevaluations, exchange controls, currency restrictions and changes in local economic conditions. Whilethe impact of these risks is difficult to predict, any one or more of them could adversely affect our futureoperations. For more information about our international operations, see Note 16, SegmentInformation, to the accompanying consolidated financial statements, which is incorporated by referenceinto this Item 1.
Where You Can Find Additional Information
Our principal executive offices are located at 33587 Walker Road, Avon Lake, Ohio 44012, and ourtelephone number is (440) 930-1000. We are subject to the information reporting requirements of theExchange Act, and, in accordance with these requirements, we file annual, quarterly and other reports,proxy statements and other information with the SEC relating to our business, financial results andother matters. The reports, proxy statements and other information we file may be inspected andcopied at prescribed rates at the SEC’s Public Reference Room and via the SEC’s website (see belowfor more information).
You may inspect a copy of the reports, proxy statements and other information we file with the SEC,without charge, at the SEC’s Public Reference Room, 100 F Street, N.E., Room 1580, Washington,D.C. 20549, and you may obtain copies of the reports, proxy statements and other information we filewith the SEC, from those offices for a fee. You may obtain information on the operation of the PublicReference Room by calling the SEC at 1-800-SEC-0330. Our filings are available to the public at theSEC’s website at http://www.sec.gov.
Our Internet address is www.polyone.com. Our Annual Reports on Form 10-K, Quarterly Reports onForm 10-Q, Current Reports on Form 8-K and amendments to those reports filed or furnished pursuantto Section 13(a) or 15(d) of the Exchange Act are available, free of charge, on our website(www.polyone.com, select Investors and then SEC Edgar filings) or upon written request, as soon asreasonably practicable after we electronically file or furnish them to the SEC. The contents of ourwebsite are not part of this Annual Report on Form 10-K, and the reference to our website does notconstitute incorporation by reference into this Form 10-K of the information contained at that site.
POLYONE CORPORATION 9

ITEM 1A. RISK FACTORS
The following are certain risk factors that could affect our business, results of operations, financialposition or cash flows. These risk factors should be considered along with the forward-lookingstatements contained in this Annual Report on Form 10-K because these factors could cause ouractual results or financial condition to differ materially from those projected in forward-lookingstatements. The following discussion is not an all-inclusive listing of risks, although we believe theseare the more material risks that we face. If any of the following occur, our business, results ofoperations, financial position or cash flows could be adversely affected.
Demand for and supply of our products and services may be adversely affected by several
factors, some of which we cannot predict or control.
Several factors may affect the demand for and supply of our products and services, including:
• economic downturns in the significant end markets that we serve;
• product obsolescence or technological changes that unfavorably alter the value/cost proposition ofour products and services;
• competition from existing and unforeseen polymer and non-polymer based products;
• declines in general economic conditions or reductions in industrial production growth rates, bothdomestically and globally, which could impact our customers’ ability to pay amounts owed to us;
• changes in environmental regulations that would limit our ability to sell our products and servicesin specific markets;
• changes in laws and regulations regarding the disposal of plastic materials; and
• inability to obtain raw materials or supply products to customers due to factors such as supplierwork stoppages, supply shortages, plant outages or regulatory changes that may limit or prohibitoverland transportation of certain hazardous materials and exogenous factors, like severeweather.
If any of these events occur, the demand for and supply of our products and services could suffer.
Our manufacturing operations are subject to hazards and other risks associated with polymer
production and the related storage and transportation of raw materials, products and wastes.
The hazards and risks our manufacturing operations are subject to include, but are not limited to:
• explosions, fires, inclement weather and natural disasters;
• mechanical failure resulting in protracted or short duration unscheduled downtime;
• regulatory changes that affect or limit the transportation of raw materials;
• inability to obtain or maintain any required licenses or permits;
• interruptions and environmental hazards such as chemical spills, discharges or releases of toxic orhazardous substances or gases into the environment or workplace; and
• storage tank leaks or other issues resulting from remedial activities.
The occurrence of any of these operating problems at our facilities may have a material adverse effecton the productivity and profitability of a particular manufacturing or distribution facility or on ouroperations as a whole, during and after the period of these operating difficulties. These operatingproblems may also cause personal injury and loss of life, customer attrition and severe damage to ordestruction of property and equipment and environmental damage. We are subject to present claimsand potential future claims with respect to workplace exposure, workers’ compensation and othermatters. Our property and casualty insurance, which we believe is of the types and in the amounts thatare customary for the industry, may not fully insure us against all potential hazards that are incident toour business or otherwise could occur.
10 POLYONE CORPORATION
Extensive environmental, health and safety laws and regulations impact our operations and
assets.
Our operations on, and ownership of, real property are subject to extensive environmental, health andsafety laws and regulations at the national, state and local governmental levels. The nature of ourbusiness exposes us to compliance costs and risks of liability under these laws and regulations due tothe production, storage, transportation, recycling or disposal and/or sale of materials that can causecontamination and other harm to the environment or personal injury if they are improperly handled andreleased. Environmental compliance requirements on us and our vendors may significantly increasethe costs of these activities involving raw materials, energy, finished products and wastes. We mayincur substantial costs, including fines, criminal or civil sanctions, damages, remediation costs orexperience interruptions in our operations for violations of these laws.
We also conduct investigations and remediation at some of our active and inactive facilities and haveassumed responsibility or have been assessed responsibility for environmental liabilities at sitesformerly owned or operated by our predecessors or by us. Also, federal and state environmentalstatutes impose strict, and under some circumstances, joint and several liability for the cost ofinvestigations and remedial actions on any company that generated waste, arranged for disposal of thewaste, transported the waste to the disposal site or selected the disposal site, as well as the ownersand operators of these sites. Any or all of the responsible parties may be required to bear all of thecosts of clean up, regardless of fault or legality of the waste disposal or ownership of the site, and mayalso be subject to liability for natural resource damages. We have been notified by federal and stateenvironmental agencies and private parties that we may be a potentially responsible party inconnection with certain sites. We may incur substantial costs for some of these sites. It is possible thatwe will be identified as a potentially responsible party at more sites in the future, which could result inour being assessed substantial investigation or cleanup costs.
We may also incur additional costs and liabilities as a result of increasingly strict environmental, safetyand health laws, regulations and related enforcement policies, restrictions on the use of lead andphthalates under the Restrictions on the Use of Certain Hazardous Substances and the ConsumerProduct Safety Information Act of 2008, and restrictions on greenhouse gases emissions.
The European Union has adopted REACH, a legislative act to cover Registration, Evaluation,Authorization and Restriction of Chemicals. The goal of this legislation, which became effective in June2007, is to minimize risk to human health and to the environment by regulating the use of chemicals.As these regulations evolve, we will endeavor to remain in compliance with REACH, and similarregulations across the globe.
We accrue costs for environmental matters that have been identified when it is probable that thesecosts will be required and when they can be reasonably estimated. However, we may be subject toadditional environmental liabilities or potential liabilities that have not been identified. We expect thatwe will continue to be subject to increasingly stringent environmental, health and safety laws andregulations. We anticipate that compliance with these laws and regulations will continue to requirecapital expenditures and operating costs.
Our operations could be adversely affected by various risks inherent in conducting operations
worldwide.
As noted above in Item 1, “Business,” we have extensive operations outside of the United States.Revenue from these operations (principally from Canada, Mexico, Europe, South America and Asia)was approximately 32% in 2014, 33% in 2013 and 40% in 2012 of our total revenues. Long-livedassets of our foreign operations represented 29% in 2014, 31% in 2013 and 38% in 2012 of our totallong-lived assets.
POLYONE CORPORATION 11

International operations are subject to risks, which include, but are not limited to, the following:
• changes in local government regulations and policies including, but not limited to foreigncurrency exchange controls or monetary policy, repatriation of earnings, expropriation ofproperty, duty or tariff restrictions, investment limitations and tax policies;
• political and economic instability and disruptions, including labor unrest, civil strife, acts ofwar, guerrilla activities, insurrection and terrorism;
• legislation that regulates the use of chemicals;
• disadvantages of competing against companies from countries that are not subject toU.S. laws and regulations, including the Foreign Corrupt Practices Act (FCPA);
• compliance with international trade laws and regulations, including export control andeconomic sanctions;
• difficulties in staffing and managing multi-national operations;
• limitations on our ability to enforce legal rights and remedies;
• reduced protection of intellectual property rights; and
• other risks arising out of foreign sovereignty over the areas where our operations are conducted.
In addition, we could be adversely affected by violations of the FCPA and similar worldwide anti-briberylaws as well as export controls and economic sanction laws. The FCPA and similar anti-bribery laws inother jurisdictions generally prohibit companies and their intermediaries from making improperpayments to non-U.S. officials for the purpose of obtaining or retaining business. Our policies mandatecompliance with these laws. We operate in many parts of the world that have experiencedgovernmental corruption to some degree and, in certain circumstances, strict compliance with anti-bribery laws may conflict with local customs and practices. We cannot assure you that our internalcontrols and procedures will always protect us from the reckless or criminal acts committed by ouremployees or agents. If we are found to be liable for FCPA, export control or sanction violations, wecould suffer from criminal or civil penalties or other sanctions, including loss of export privileges orauthorization needed to conduct aspects of our international business, which could have a materialadverse effect on our business.
Any of these risks could have an adverse effect on our international operations by reducing thedemand for our products. We may not be able to continue to operate in compliance with applicablecustoms, currency exchange control regulations, transfer pricing regulations or any other laws orregulations that we may be subject to. In addition, these laws or regulations may be modified in thefuture, and we may not be able to operate in compliance with those modifications.
We engage in acquisitions and joint ventures, and may encounter unexpected difficulties
integrating those businesses.
Attainment of our strategic plan objectives require, in part, strategic acquisitions or joint venturesintended to complement or expand our businesses globally or add product technology that acceleratesour specialization strategy, or both. Success will depend on our ability to complete these transactionsor arrangements, and integrate the businesses acquired in these transactions as well as developsatisfactory working arrangements with our strategic partners in the joint ventures. Unexpecteddifficulties in integrating recent and future acquisitions with our existing operations and in managingstrategic investments could occur. Furthermore, we may not realize the degree, or timing, of benefitsinitially anticipated.
12 POLYONE CORPORATION

Natural gas, electricity, fuel and raw material costs, and other external factors that are also
beyond our control, as well as downturns in the home repair and remodeling and new home
sectors of the economy, can cause fluctuations in our margins.
The cost of our natural gas, electricity, fuel and raw materials, and other costs, may not correlate withchanges in the prices we receive for our products, either in the direction of the price change or in absolutemagnitude. Natural gas and raw materials costs represent a substantial part of our manufacturing costs.Most of the raw materials we use are commodities and the price of each can fluctuate widely for a variety ofreasons, including changes in availability because of major capacity additions or reductions or significantfacility operating problems. Other external factors beyond our control can cause volatility in raw materialsprices, demand for our products, product prices, sales volumes and margins. These factors include generaleconomic conditions, the level of business activity in the industries that use our products, competitors’actions, international events and circumstances, and governmental regulation in the United States andabroad, such as climate change regulation. These factors can also magnify the impact of economic cycleson our business. While we attempt to pass through price increases in energy costs and raw materials therecan be no assurance that we can do so in the future.
Additionally, our products used in housing, transportation and building and construction markets areimpacted by changes in demand in these sectors, which may be significantly affected by changes ineconomic and other conditions such as gross domestic product levels, employment levels,demographic trends, legislative actions and consumer confidence. These factors can lower thedemand for and pricing of our products.
We face competition from other polymer companies as well as chemical companies.
We encounter competition in price, payment terms, delivery, service, performance, product innovation,product recognition and quality, depending on the product involved.
We expect that our competitors will continue to develop and introduce new and enhanced products,which could cause a decline in the market acceptance of our products. In addition, our competitorscould cause a reduction in the selling prices of some of our products as a result of intensified pricecompetition. Competitive pressures can also result in the loss of customers.
We may also experience increased competition from companies that offer products based onalternative technologies and processes that may cause us to lose customers. Additionally, some of ourcustomers may already be or may become large enough to justify developing in-house productioncapabilities. Any significant reduction in customer orders as a result of a shift to in-house productioncould adversely affect our sales and operating profits.
A major failure of our information systems could harm our business.
We depend on integrated information systems to conduct our business. We may experience operatingproblems with our information systems as a result of system failures, viruses, computer hackers orother causes. Any significant disruption or slowdown of our systems could cause customers to cancelorders or cause standard business processes to become inefficient or ineffective.
Disruptions in the global credit and financial markets could limit our access to credit, which
could negatively impact our business.
Global credit and financial markets have experienced volatility in recent years, including volatility insecurities prices, diminished liquidity and credit availability, declining valuations of certain investmentsand significant changes in the capital and organizational structures of certain financial institutions.These market conditions may limit our ability to access the capital necessary to grow and maintain ourbusiness. Accordingly, we may be forced to delay raising capital, issue shorter tenors than we prefer orpay unattractive interest rates, which could increase our interest expense, decrease our profitabilityand significantly reduce our financial flexibility.
POLYONE CORPORATION 13
Significant movements in foreign currency exchange rates or change in monetary policy may
harm our financial results.
We are exposed to fluctuations in foreign currency exchange rates. Any significant change in the valueof the currencies of the countries in which we do business against the U.S. dollar could affect ourability to sell products competitively and control our cost structure, which could have a material adverseeffect on our business, financial condition and results of operations. For additional detail related to thisrisk, see Item 7A, Quantitative and Qualitative Disclosure About Market Risk.
We also face risks arising from the imposition of exchange controls and currency devaluations.Exchange controls may limit our ability to convert foreign currencies into U.S. dollars or to remitdividends and other payments by our foreign subsidiaries or customers located in or conductingbusiness in a country imposing controls. Currency devaluations diminish the U.S. dollar value of thecurrency of the country instituting the devaluation and, if they occur or continue for significant periods,could adversely affect our earnings or cash flow.
An economic downturn in Europe may have a negative effect on our business and operations.
A prolonged economic downturn in Europe may cause a negative effect on our results of operations.Many of our customers, distributors and suppliers have been affected by these economic conditions.Current or potential customers may be unable to fund purchases or may determine to reducepurchases or inventories or may cease to continue in business. In addition, suppliers may not be ableto supply us with needed raw materials on a timely basis, may increase prices or go out of business,which could result in our inability to meet customer demand or could affect our gross margins.
The agreements governing our debt, including our revolving credit facility and debt securities,
contain various covenants that limit our ability to take certain actions and also require us to
meet financial maintenance tests, failure to comply with which could have a material adverse
effect on us.
The agreement governing our senior secured revolving credit facility, and the indentures governing ourdebt securities, contain a number of customary restrictive covenants that, among other things, limit ourability to: consummate asset sales, incur additional debt or liens, consolidate or merge with any entityor transfer or sell all or substantially all of our assets, pay dividends or make certain other restrictedpayments, make investments, enter into transactions with affiliates, create dividend or other paymentrestrictions with respect to subsidiaries, make capital investments and alter the business we conduct.
In addition, these agreements require us to comply with specific financial tests, under which we arerequired to achieve specific financial and operating results. Our ability to comply with these provisionsmay be affected by events beyond our control. A breach of any of these covenants would result in adefault under the agreements. In the event of any default, our lenders could elect to declare allamounts borrowed under the agreements, together with accrued interest thereon, to be due andpayable. In such event, we cannot assure that we would have sufficient assets to pay debt thenoutstanding under the agreements governing our debt. Any future refinancing of the revolving creditfacility or debt securities may contain similar restrictive covenants.
To service our indebtedness, we will require a significant amount of cash. Our ability to
generate cash depends on many factors beyond our control.
Our ability to pay interest on our debt and to satisfy our other debt obligations will depend in part uponour future financial and operating performance and that of our subsidiaries and upon our ability torenew or refinance borrowings. Prevailing economic conditions and financial, business, competitive,legislative, regulatory and other factors, many of which are beyond our control, will affect our ability tomake these payments. While we believe that cash flow from our current level of operations, availablecash and available borrowings under our revolving credit facilities will provide adequate sources of
14 POLYONE CORPORATION

liquidity for at least the next twelve months, a significant drop in operating cash flow resulting fromeconomic conditions, competition or other uncertainties beyond our control could create the need foralternative sources of liquidity. If we are unable to generate sufficient cash flow to meet our debtservice obligations, we will have to pursue one or more alternatives, such as reducing or delayingcapital or other expenditures, refinancing debt, selling assets, or raising equity capital.
We cannot guarantee that our business will generate sufficient cash flow from operations or that futureborrowings will be available to us under our revolving credit facilities in an amount sufficient to enable usto pay our indebtedness or to fund our other liquidity needs. We may need to refinance all or a portion ofour indebtedness on or before maturity. We cannot guarantee that we will be able to refinance any of ourindebtedness, including our revolving credit facilities, on commercially reasonable terms or at all.
We have a significant amount of goodwill, and any future goodwill impairment charges could
adversely impact our results of operations.
As of December 31, 2014, we had goodwill of $590.6 million. The future occurrence of a potentialindicator of impairment, such as a significant adverse change in legal factors or business climate, anadverse action or assessment by a regulator, unanticipated competition, a material negative change inrelationships with significant customers, strategic decisions made in response to economic orcompetitive conditions, loss of key personnel or a more-likely-than-not expectation that a reporting unitor a significant portion of a reporting unit will be sold or disposed of, could result in goodwill impairmentcharges, which could adversely impact our results of operations. We have recorded goodwillimpairment charges in the past, and such charges materially impacted our historical results ofoperations. For additional information, see Note 3, Goodwill and Intangible Assets, to theaccompanying consolidated financial statements.
Poor investment performance by our pension plan assets may increase our pension liability
and expense, which may increase the required funding of our pension obligations and divert
funds from other potential uses.
We provide defined benefit pension plans to eligible employees. Our pension expense and our requiredcontributions to our pension plans are directly affected by the value of plan assets, the actual rate of returnon plan assets and the actuarial assumptions we use to measure our defined benefit pension planobligations, including the rate at which future obligations are discounted to a present value, or the discountrate. We assumed a weighted average rate of return of 6.86% on pension assets during 2014.
Poor investment performance by our pension plan assets resulting from a decline in prices in the equityand/or fixed income markets could impact the funded status of our plans. Should the assets earn anaverage return less than our assumed rate, it is likely that future pension expenses and fundingrequirements would increase.
We cannot predict whether changing market or economic conditions, regulatory changes or otherfactors will further increase our pension expense or funding obligations, diverting funds we wouldotherwise apply to other uses.
Risks related to our pension plans may adversely impact our results of operations and cash
flow.
Significant changes in the actual investment return on pension assets, discount rates, and other factorshave and may continue to adversely affect our results of operations and pension contributions in futureperiods. U.S. generally accepted accounting principles require that we calculate income or expense forthe plans using actuarial valuations. These valuations reflect assumptions about financial markets andinterest rates. Changes in these assumptions have resulted in material charges to income in recentyears and may continue to do so in future periods. We establish the discount rate used to determinethe present value of the projected and accumulated benefit obligation at the end of each year based
POLYONE CORPORATION 15
upon the available market rates for high quality, fixed income investments. An increase in the discountrate would increase future pension expense and, conversely, a decrease in the discount rate woulddecrease future pension expense.
Funding requirements for our U.S. pension plans may become more significant. The ultimate amountsto be contributed are dependent upon, among other things, interest rates, underlying asset returns andthe impact of legislative or regulatory changes related to pension funding obligations. For a discussionregarding the significant assumptions used to estimate pension expense, including discount rate,expected long-term rate of return on plan assets and mortality, and how our financial statements canbe affected by pension plan accounting policies, see “Critical Accounting Policies” included in Item 7,“Management’s Discussion and Analysis of Financial Condition and Results of Operations.”
The failure to successfully integrate Spartech may adversely affect future results.
The success of our acquisition of Spartech will depend, in part, on our ability to realize anticipatedbenefits from combining the businesses of PolyOne and Spartech. To realize these anticipatedbenefits, the businesses of PolyOne and Spartech must be successfully combined. If we are not ableto achieve these objectives, the anticipated benefits of the merger may not be realized fully or at all ormay take longer to realize than expected.
As a result of the Spartech acquisition, we are undergoing restructurings that may cause
disruption or could have an adverse effect on our business and operations.
We are undergoing certain restructurings and intended to realize certain of the potential synergies ofour acquisition of Spartech. There can be no assurance that such restructurings and reorganizationswill be successful or properly implemented. If any of such internal restructurings are not successful orproperly implemented, we may fail to realize the potential synergies of the acquisition, which may harmour business and results of operations or cause disruptions to our operations, including disruption inour supply chain or loss of customers.
Increased IT security threats and more sophisticated and targeted computer crime could pose a
risk to our systems, networks, and products.
Increased global IT security threats and more sophisticated and targeted computer crime pose a risk tothe security of our systems and networks and the confidentiality, availability and integrity of our dataand communications. While we attempt to mitigate these risks by employing a number of measures,including employee training, comprehensive monitoring of our networks and systems, andmaintenance of backup and protective systems, our systems, networks and products remain potentiallyvulnerable to advanced persistent threats. Depending on their nature and scope, such threats couldpotentially lead to the compromising of confidential information and communications, improper use ofour systems and networks, manipulation and destruction of data, defective products, productiondowntimes and operational disruptions, which in turn could adversely affect our reputation,competitiveness and results of operations.
16 POLYONE CORPORATION
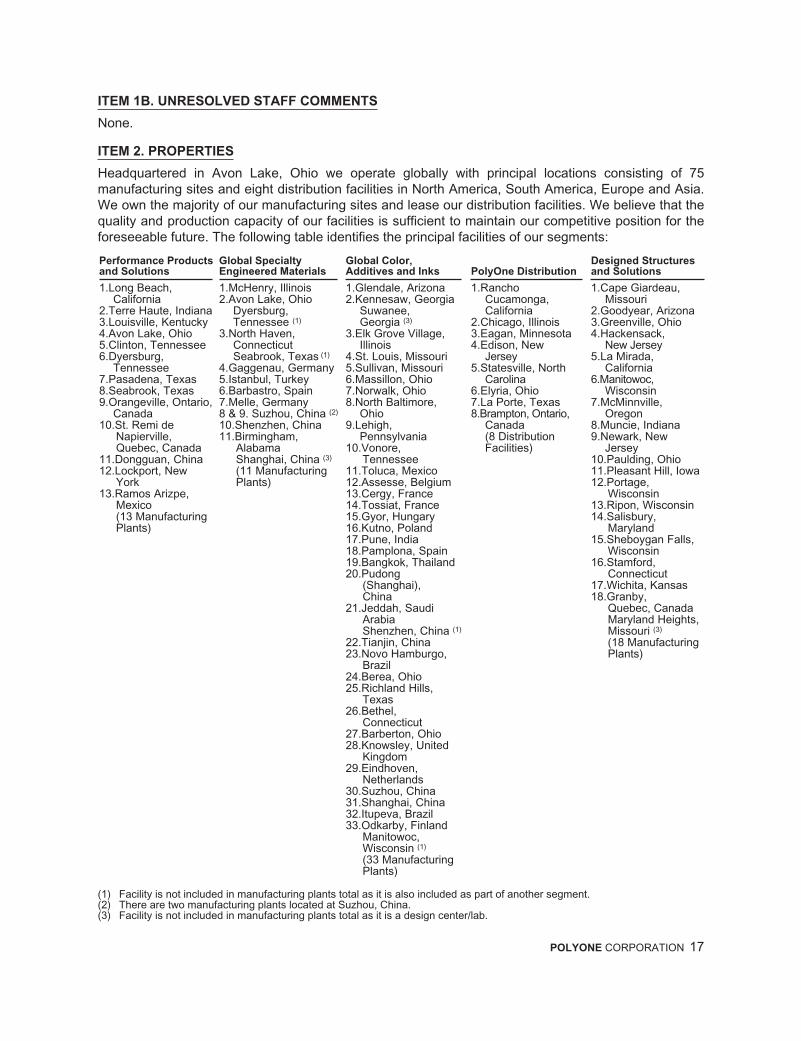
ITEM 1B. UNRESOLVED STAFF COMMENTS
None.
ITEM 2. PROPERTIES
Headquartered in Avon Lake, Ohio we operate globally with principal locations consisting of 75manufacturing sites and eight distribution facilities in North America, South America, Europe and Asia.We own the majority of our manufacturing sites and lease our distribution facilities. We believe that thequality and production capacity of our facilities is sufficient to maintain our competitive position for theforeseeable future. The following table identifies the principal facilities of our segments:
Performance Productsand Solutions
Global SpecialtyEngineered Materials
Global Color,Additives and Inks PolyOne Distribution
Designed Structuresand Solutions
1.Long Beach, 1.McHenry, Illinois 1.Glendale, Arizona 1.Rancho 1.Cape Giardeau,California 2.Avon Lake, Ohio 2.Kennesaw, Georgia Cucamonga, Missouri
2.Terre Haute, Indiana Dyersburg, Suwanee, California 2.Goodyear, Arizona3.Louisville, Kentucky Tennessee (1) Georgia (3) 2.Chicago, Illinois 3.Greenville, Ohio4.Avon Lake, Ohio 3.North Haven, 3.Elk Grove Village, 3.Eagan, Minnesota 4.Hackensack,5.Clinton, Tennessee Connecticut Illinois 4.Edison, New New Jersey6.Dyersburg, Seabrook, Texas (1) 4.St. Louis, Missouri Jersey 5.La Mirada,
Tennessee 4.Gaggenau, Germany 5.Sullivan, Missouri 5.Statesville, North California7.Pasadena, Texas 5.Istanbul, Turkey 6.Massillon, Ohio Carolina 6.Manitowoc,8.Seabrook, Texas 6.Barbastro, Spain 7.Norwalk, Ohio 6.Elyria, Ohio Wisconsin9.Orangeville, Ontario, 7.Melle, Germany 8.North Baltimore, 7.La Porte, Texas 7.McMinnville,
Canada 8 & 9. Suzhou, China (2) Ohio 8.Brampton, Ontario, Oregon10.St. Remi de 10.Shenzhen, China 9.Lehigh, Canada 8.Muncie, Indiana
Napierville, 11.Birmingham, Pennsylvania (8 Distribution 9.Newark, NewQuebec, Canada Alabama 10.Vonore, Facilities) Jersey
11.Dongguan, China Shanghai, China (3) Tennessee 10.Paulding, Ohio12.Lockport, New (11 Manufacturing 11.Toluca, Mexico 11.Pleasant Hill, Iowa
York Plants) 12.Assesse, Belgium 12.Portage,13.Ramos Arizpe, 13.Cergy, France Wisconsin
Mexico 14.Tossiat, France 13.Ripon, Wisconsin(13 Manufacturing 15.Gyor, Hungary 14.Salisbury,Plants) 16.Kutno, Poland Maryland
17.Pune, India 15.Sheboygan Falls,18.Pamplona, Spain Wisconsin19.Bangkok, Thailand 16.Stamford,20.Pudong Connecticut
(Shanghai), 17.Wichita, KansasChina 18.Granby,
21.Jeddah, Saudi Quebec, CanadaArabia Maryland Heights,Shenzhen, China (1) Missouri (3)
22.Tianjin, China (18 Manufacturing23.Novo Hamburgo, Plants)
Brazil24.Berea, Ohio25.Richland Hills,
Texas26.Bethel,
Connecticut27.Barberton, Ohio28.Knowsley, United
Kingdom29.Eindhoven,
Netherlands30.Suzhou, China31.Shanghai, China32.Itupeva, Brazil33.Odkarby, Finland
Manitowoc,Wisconsin (1)
(33 ManufacturingPlants)
(1) Facility is not included in manufacturing plants total as it is also included as part of another segment.(2) There are two manufacturing plants located at Suzhou, China.(3) Facility is not included in manufacturing plants total as it is a design center/lab.
POLYONE CORPORATION 17
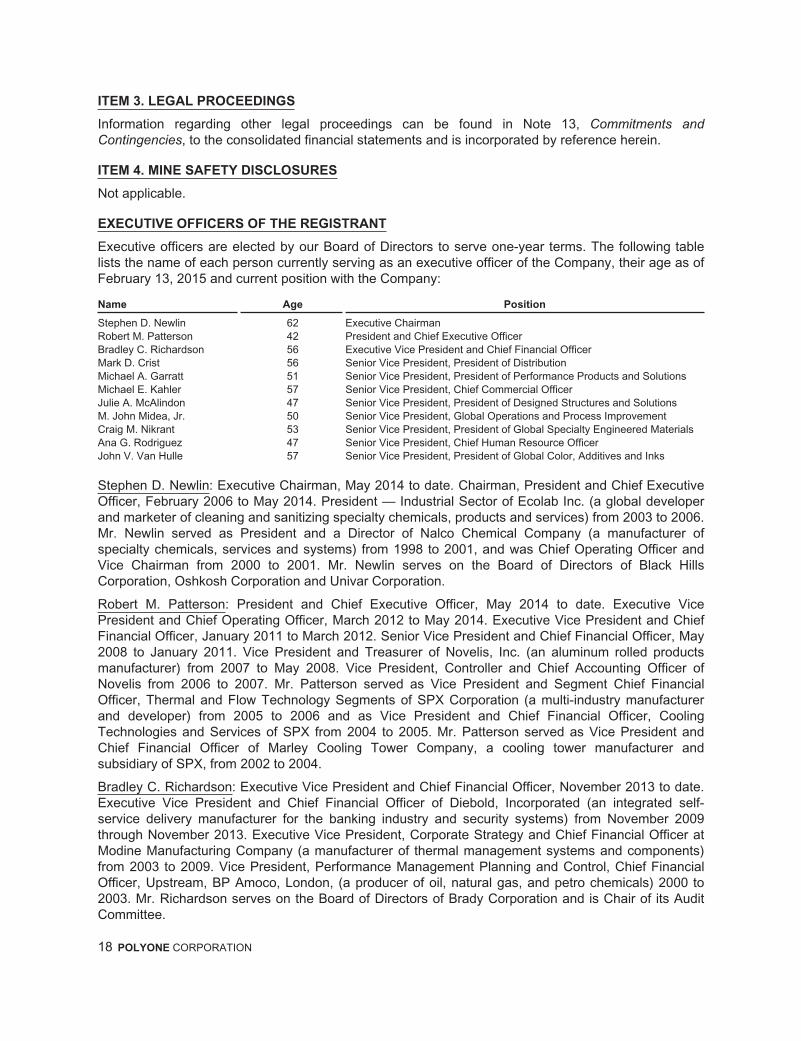
ITEM 3. LEGAL PROCEEDINGS
Information regarding other legal proceedings can be found in Note 13, Commitments andContingencies, to the consolidated financial statements and is incorporated by reference herein.
ITEM 4. MINE SAFETY DISCLOSURES
Not applicable.
EXECUTIVE OFFICERS OF THE REGISTRANT
Executive officers are elected by our Board of Directors to serve one-year terms. The following tablelists the name of each person currently serving as an executive officer of the Company, their age as ofFebruary 13, 2015 and current position with the Company:
Name Age Position
Stephen D. Newlin 62 Executive ChairmanRobert M. Patterson 42 President and Chief Executive OfficerBradley C. Richardson 56 Executive Vice President and Chief Financial OfficerMark D. Crist 56 Senior Vice President, President of DistributionMichael A. Garratt 51 Senior Vice President, President of Performance Products and SolutionsMichael E. Kahler 57 Senior Vice President, Chief Commercial OfficerJulie A. McAlindon 47 Senior Vice President, President of Designed Structures and SolutionsM. John Midea, Jr. 50 Senior Vice President, Global Operations and Process ImprovementCraig M. Nikrant 53 Senior Vice President, President of Global Specialty Engineered MaterialsAna G. Rodriguez 47 Senior Vice President, Chief Human Resource OfficerJohn V. Van Hulle 57 Senior Vice President, President of Global Color, Additives and Inks
Stephen D. Newlin: Executive Chairman, May 2014 to date. Chairman, President and Chief ExecutiveOfficer, February 2006 to May 2014. President — Industrial Sector of Ecolab Inc. (a global developerand marketer of cleaning and sanitizing specialty chemicals, products and services) from 2003 to 2006.Mr. Newlin served as President and a Director of Nalco Chemical Company (a manufacturer ofspecialty chemicals, services and systems) from 1998 to 2001, and was Chief Operating Officer andVice Chairman from 2000 to 2001. Mr. Newlin serves on the Board of Directors of Black HillsCorporation, Oshkosh Corporation and Univar Corporation.
Robert M. Patterson: President and Chief Executive Officer, May 2014 to date. Executive VicePresident and Chief Operating Officer, March 2012 to May 2014. Executive Vice President and ChiefFinancial Officer, January 2011 to March 2012. Senior Vice President and Chief Financial Officer, May2008 to January 2011. Vice President and Treasurer of Novelis, Inc. (an aluminum rolled productsmanufacturer) from 2007 to May 2008. Vice President, Controller and Chief Accounting Officer ofNovelis from 2006 to 2007. Mr. Patterson served as Vice President and Segment Chief FinancialOfficer, Thermal and Flow Technology Segments of SPX Corporation (a multi-industry manufacturerand developer) from 2005 to 2006 and as Vice President and Chief Financial Officer, CoolingTechnologies and Services of SPX from 2004 to 2005. Mr. Patterson served as Vice President andChief Financial Officer of Marley Cooling Tower Company, a cooling tower manufacturer andsubsidiary of SPX, from 2002 to 2004.
Bradley C. Richardson: Executive Vice President and Chief Financial Officer, November 2013 to date.Executive Vice President and Chief Financial Officer of Diebold, Incorporated (an integrated self-service delivery manufacturer for the banking industry and security systems) from November 2009through November 2013. Executive Vice President, Corporate Strategy and Chief Financial Officer atModine Manufacturing Company (a manufacturer of thermal management systems and components)from 2003 to 2009. Vice President, Performance Management Planning and Control, Chief FinancialOfficer, Upstream, BP Amoco, London, (a producer of oil, natural gas, and petro chemicals) 2000 to2003. Mr. Richardson serves on the Board of Directors of Brady Corporation and is Chair of its AuditCommittee.
18 POLYONE CORPORATION

Mark D. Crist: Senior Vice President, President of Distribution, June 2014 to date. Vice President,Global Key Accounts and Vice President of Asia January 2012 to May 2014. Global CommercialDirector of Geon Performance Materials June 2008 to December 2011. General Manager NalcoChemical Company Europe April 2006 to March 2008. General Manager Nalco Chemical CompanyNorth America June 2003 to March 2006. Marketing Manager Nalco Europe December 1999 to May2003. Regional Sales Manager Nalco Chemical Company March 1997 to November 1999.
Michael A. Garratt: Senior Vice President, President of Performance Products and Solutions,September 2013 to date. President, Marmon Utility (a manufacturer of medium-high voltage utility,subsea and down-hole power cables and molded insulator systems), March 2011 to September 2013.Chief Operating Officer, Excel Polymers (a custom thermoset rubber formulator), November 2009 toDecember 2010. Vice President and General Manager — Americas Compounding and PerformanceAdditives, Excel Polymers, March 2009 to November 2009. Vice President and GeneralManager — Industrial and Consumer, Excel Polymers, December 2005 to March 2009. From August1994 to June 2005, Mr. Garratt worked for DuPont Dow Elastomers, a joint venture of Dupont and Dow(global manufacturers of engineered thermoset rubber and thermoplastic elastomer materials) inmarket development and product management positions, culminating in a regional commercialleadership role for Europe, the Middle East and Africa.
Michael E. Kahler: Senior Vice President, Chief Commercial Officer, January 2010 to date. Senior VicePresident, Commercial Development, May 2006 to January 2010. President, Process TechnologyDivision, Alfa Laval Inc. (a global provider of heat transfer, separation and fluid handling products andengineering solutions) from January 2004 to March 2006. Group Vice President, Nalco ChemicalCompany (a manufacturer of specialty chemicals, services and systems) from December 1999 toOctober 2002.
Julie McAlindon: Senior Vice President, President of Designed Structures and Solutions, March 2013to date. Vice President of Marketing, May 2010 to March 2013. Global Corporate Account Director,Dow Advanced Materials, The Dow Chemical Company (a global provider of chemicals and plastics)July 2009 to May 2010, Global Strategic Marketing Director, Dow Coating Solutions, The DowChemical Company, March 2008 to July 2009. Global Business Director, Polypropylene, The DowChemical Company, May 2007 to March 2008. Senior Product Director, Solution Polyethylene, TheDow Chemical Company, May 2005 to May 2007. Global Marketing Executive, UCON™ Fluids andLubricants, The Dow Chemical Company, March 2002 to May 2005.
M. John Midea, Jr.: Senior Vice President, Global Operations and Process Improvement, February2015 to date. President and Chief Executive Officer, Resco Products (a refractory products company)from August 2012 to October 2014. President and Chief Operating Officer, Ennis Traffic SafetySolutions (a traffic safety and infrastructure company) from June 2008 to July 2012. Vice President,North American — General Industrial, Valspar Corporation (a manufacturer of paints and coatings)from June 2007 to May 2008. Vice President and General Manager, Power Coatings, ValsparCorporation from February 2002 to June 2007.
Craig M. Nikrant: Senior Vice President, President of Global Specialty Engineered Materials, January2010 to date. Vice President and General Manager, Specialty Engineered Materials, September 2006to December 2009. General Manager, Specialty Film & Sheet, General Electric Plastics, June 2004 toSeptember 2006. Director, Global Commercial Effectiveness, General Electric Plastics (a formerdivision of General Electric specializing in supplying plastics), December 2003 to June 2004. Six SigmaMaster Black Belt, General Electric Company Plastics Business, March 2001 to December 2002.General Manager, Commercial Operations, North Central Region, General Electric Plastics, June 1999to March 2001.
Ana G. Rodriguez: Senior Vice President, Chief Human Resources Officer, May 2014 to date. SeniorVice President, Global Human Resources, Molex Incorporated (a manufacturer of electronicconnectors), September 2008 to March 2014. Vice President, Co-General Counsel and Corporate
POLYONE CORPORATION 19

Secretary, Molex, September 2006 to August 2008, Vice President and Assistant General Counsel,Molex, October 2005 to September 2006. Senior Counsel, Amgen Inc. (a global biotechnologymedicines company), May 2003 to September 2005. Senior Counsel and Assistant CorporateSecretary, Tenet Healthcare Corporation (a health care services company) May 2000 to May 2003.
John V. Van Hulle: Senior Vice President, President of Global Color, Additives and Inks, January 2010to date. Senior Vice President and General Manager, Specialty Color, Additives and Inks, July 2006 toJanuary 2010. President and Chief Executive Officer — ChemDesign Corporation (a custom chemicalmanufacturer), December 2001 to July 2006. President, Specialty & Fine Chemicals — CambrexCorporation (a specialty chemical and pharmaceutical business) August 1994 to November 2000.
20 POLYONE CORPORATION
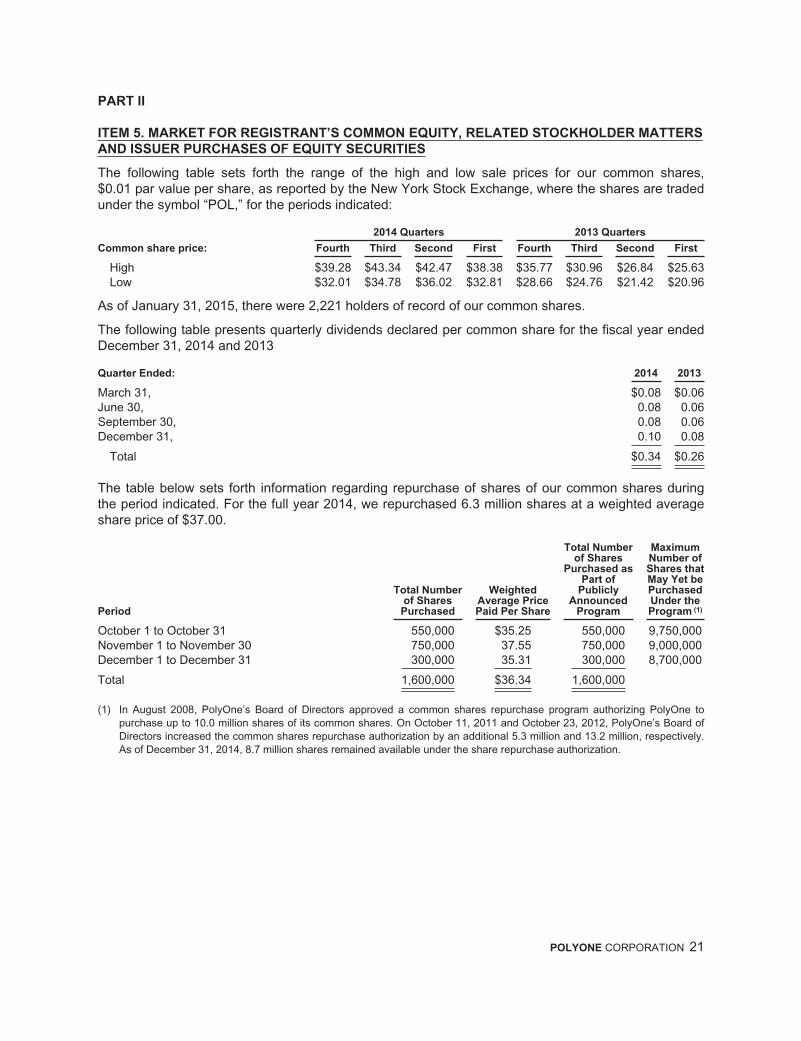
PART II
ITEM 5. MARKET FOR REGISTRANT’S COMMON EQUITY, RELATED STOCKHOLDER MATTERS
AND ISSUER PURCHASES OF EQUITY SECURITIES
The following table sets forth the range of the high and low sale prices for our common shares,$0.01 par value per share, as reported by the New York Stock Exchange, where the shares are tradedunder the symbol “POL,” for the periods indicated:
2014 Quarters 2013 Quarters
Common share price: Fourth Third Second First Fourth Third Second First
High $39.28 $43.34 $42.47 $38.38 $35.77 $30.96 $26.84 $25.63Low $32.01 $34.78 $36.02 $32.81 $28.66 $24.76 $21.42 $20.96
As of January 31, 2015, there were 2,221 holders of record of our common shares.
The following table presents quarterly dividends declared per common share for the fiscal year endedDecember 31, 2014 and 2013
Quarter Ended: 2014 2013
March 31, $0.08 $0.06June 30, 0.08 0.06September 30, 0.08 0.06December 31, 0.10 0.08
Total $0.34 $0.26
The table below sets forth information regarding repurchase of shares of our common shares duringthe period indicated. For the full year 2014, we repurchased 6.3 million shares at a weighted averageshare price of $37.00.
Period
Total Numberof Shares
Purchased
WeightedAverage PricePaid Per Share
Total Numberof Shares
Purchased asPart of
PubliclyAnnounced
Program
MaximumNumber ofShares thatMay Yet bePurchasedUnder theProgram (1)
October 1 to October 31 550,000 $35.25 550,000 9,750,000November 1 to November 30 750,000 37.55 750,000 9,000,000December 1 to December 31 300,000 35.31 300,000 8,700,000
Total 1,600,000 $36.34 1,600,000
(1) In August 2008, PolyOne’s Board of Directors approved a common shares repurchase program authorizing PolyOne topurchase up to 10.0 million shares of its common shares. On October 11, 2011 and October 23, 2012, PolyOne’s Board ofDirectors increased the common shares repurchase authorization by an additional 5.3 million and 13.2 million, respectively.As of December 31, 2014, 8.7 million shares remained available under the share repurchase authorization.
POLYONE CORPORATION 21

ITEM 6. SELECTED FINANCIAL DATA
Refer to Item 7, “Management’s Discussion and Analysis of Financial Condition and Results ofOperations,” in Part II of this Annual Report on Form 10-K and the notes to our accompanyingconsolidated financial statements for additional information regarding the financial data presentedbelow, including matters that might cause this data not to be indicative of our future financial condition,results of operations or cash flows.
(In millions, except per share data) 2014 (1) 2013 (2) 2012 (3) 2011 (4) 2010 (5)
Sales $3,835.5 $3,771.2 $2,860.8 $2,709.4 $2,506.2Operating income 155.1 231.5 137.5 203.0 159.2Net income from continuing operations, net of income tax 77.2 92.9 53.2 153.4 152.5Net income from continuing operations attributable to
PolyOne shareholders 78.0 94.0 53.3 153.4 152.5
Cash dividends declared per common share $ 0.34 $ 0.26 $ 0.20 $ 0.16 $ —
Earnings per share from continuing operations attributable to PolyOne shareholders:
Basic $ 0.85 $ 0.98 $ 0.60 $ 1.66 $ 1.64Diluted $ 0.83 $ 0.97 $ 0.59 $ 1.63 $ 1.59
Total assets $2,711.2 $2,944.1 $2,128.0 $2,078.1 $1,671.9Long-term debt, net of current portion $ 962.0 $ 976.2 $ 703.1 $ 704.0 $ 432.9
(1) Included in operating income for 2014 are: 1) a mark-to-market charge related to our pension and post-retirement healthcare benefit plans of $56.5 million, 2) expenses of $94.1 million related to employee separation and restructuring costs andreductions in force and 3) expenses of $10.3 million related to environmental remediation costs.
(2) Included in operating income for 2013 are: 1) gains of $26.9 million primarily related to the 2013 SunBelt Chlor AlkaliPartnership (SunBelt) earn-out, 2) a mark-to-market gain related to our pension and OPEB plans of $44.0 million, 3)expenses of $61.2 million related to environmental remediation costs, 4) insurance recoveries of $23.5 million, 5) a $7.0million gain on commercial litigation, 6) expenses of $52.0 million related to employee separation and restructuring costsand 7) acquisition-related costs (including inventory fair value adjustments) of $15.2 million.
(3) Included in operating income for 2012 are: 1) gains of $23.4 million for the 2012 SunBelt earn-out , 2) a mark-to-market lossrelated to our pension and OPEB plans of $42.0 million, 3) expenses of $12.8 million related to environmental remediationcosts, 4) expenses of $11.5 million related to employee separation and restructuring costs and 5) acquisition-related costs of$9.3 million.
(4) Included in operating income for 2011 are: 1) gains of $146.3 million related to the sale of our equity interest in SunBeltChlor Alkali Partnership (SunBelt), which includes the 2011 earn-out of $18.1 million, 2) a mark-to-market charge related toour pension and OPEB plans of $83.8 million, 3) environmental remediation costs of $9.7 million and 4) acquisition-relatedcosts of $6.6 million. Included in net income for 2011 is a $29.5 million tax benefit related to our investment in O’SullivanEngineered Films and a $13.0 million tax benefit primarily related with the reversal of valuation allowances.
(5) Included in operating income for 2010 are: 1) gains of $23.9 million related to legal and insurance settlements, 2) insurancerecoveries of $16.7 million related to reimbursement of previously incurred environmental expenses, 3) a gain of $16.3million related to the sale of our 50% interest in BayOne, a previously owned equity affiliate and part of BayerMaterialScience LLC, 4) debt extinguishment costs of $29.5 million, 5) environmental remediation costs of $20.5 million and6) a mark-to-market charge related to our pension and OPEB plans of $9.6 million. Included in net income are tax benefits of$107.1 million associated with the reversal of our valuation allowances.
22 POLYONE CORPORATION

ITEM 7. MANAGEMENT’S DISCUSSION AND ANALYSIS OF FINANCIAL CONDITION AND
RESULTS OF OPERATIONS
Overview
Management’s Discussion and Analysis of Financial Condition and Results of Operations (MD&A) isdesigned to provide information that is supplemental to, and should be read together with, ourconsolidated financial statements and the accompanying notes contained in this Annual Report onForm 10-K. Information in this Item 7 is intended to assist the reader in obtaining an understanding ofour consolidated financial statements, the changes in certain key items in those financial statementsfrom year to year, the primary factors that accounted for those changes, and any known trends oruncertainties that we are aware of that may have a material effect on our future performance, as wellas how certain accounting principles affect our consolidated financial statements.
The following discussion contains forward-looking statements that reflect our plans, estimates andbeliefs. Our actual results could differ materially from those discussed in these forward-lookingstatements. Factors that could cause or contribute to these differences include, but are not limited to,those discussed below and elsewhere in this Annual Report on Form 10-K, particularly in “CautionaryNote on Forward-Looking Statements” and Item 1A, “Risk Factors.”
Our Business
We are a premier provider of specialized polymer materials, services and solutions with operations inspecialty polymer formulations, color and additive systems, plastic sheet and packaging solutions andpolymer distribution. We are also a highly specialized developer and manufacturer of performanceenhancing additives, liquid colorants, and fluoropolymer and silicone colorants. Headquartered in AvonLake, Ohio, with 2014 sales of $3.8 billion, we have manufacturing sites and distribution facilities inNorth America, South America, Europe, Asia and Africa. We currently employ approximately 6,900people and offer more than 35,000 polymer solutions to over 10,000 customers across the globe. Weprovide value to our customers through our ability to link our knowledge of polymers and formulationtechnology with our manufacturing and supply chain capabilities to provide value-added solutions todesigners, assemblers and processors of plastics (our customers).
Business Model and Key Concepts
The central focus of our business model is to provide specialized material and service solutions to ourcustomers by leveraging our global footprint, product and technology breadth, manufacturing expertise,fully integrated information technology network, broad market reach and raw material procurementstrength. These resources enable us to capitalize on dynamic changes in the end markets we serve,which include transportation, packaging, building and construction, industrial, healthcare, consumer,wire and cable, electrical and electronics, and appliance.
Key Challenges
Overall, our business faces exposure resulting from economic downturns, especially as it relates toaffected markets such as building and construction, consumer, electrical, and industrial. Increasingprofitability during periods of raw material price volatility is another critical challenge. Further, we needto capitalize on the opportunity to accelerate development of products that meet a growing body ofenvironmental laws and regulations such as lead and phthalate restrictions included in the Restrictionson the Use of Certain Hazardous Substances and the Consumer Product Safety Information Act of2008.
Strategy and Key Trends
To address these challenges and achieve our vision, we have implemented a strategy with four corecomponents: specialization, globalization, operational excellence and commercial excellence.Specialization differentiates us through products, services, technology, and solutions that add value.
POLYONE CORPORATION 23
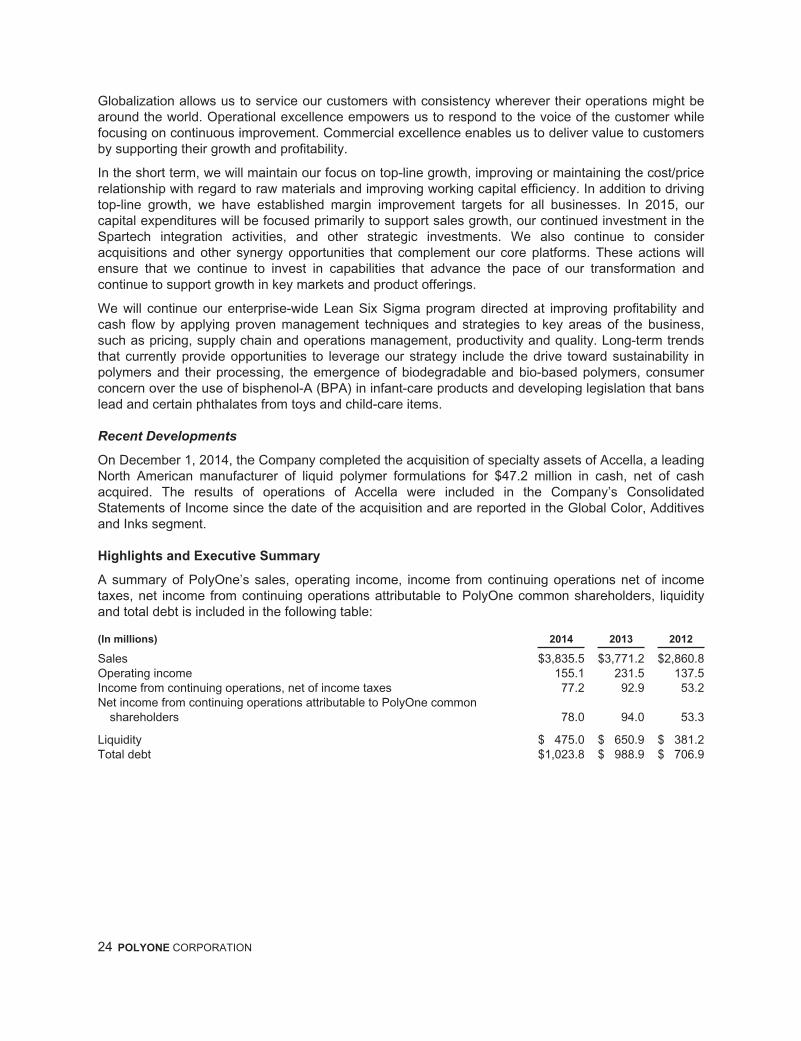
Globalization allows us to service our customers with consistency wherever their operations might bearound the world. Operational excellence empowers us to respond to the voice of the customer whilefocusing on continuous improvement. Commercial excellence enables us to deliver value to customersby supporting their growth and profitability.
In the short term, we will maintain our focus on top-line growth, improving or maintaining the cost/pricerelationship with regard to raw materials and improving working capital efficiency. In addition to drivingtop-line growth, we have established margin improvement targets for all businesses. In 2015, ourcapital expenditures will be focused primarily to support sales growth, our continued investment in theSpartech integration activities, and other strategic investments. We also continue to consideracquisitions and other synergy opportunities that complement our core platforms. These actions willensure that we continue to invest in capabilities that advance the pace of our transformation andcontinue to support growth in key markets and product offerings.
We will continue our enterprise-wide Lean Six Sigma program directed at improving profitability andcash flow by applying proven management techniques and strategies to key areas of the business,such as pricing, supply chain and operations management, productivity and quality. Long-term trendsthat currently provide opportunities to leverage our strategy include the drive toward sustainability inpolymers and their processing, the emergence of biodegradable and bio-based polymers, consumerconcern over the use of bisphenol-A (BPA) in infant-care products and developing legislation that banslead and certain phthalates from toys and child-care items.
Recent Developments
On December 1, 2014, the Company completed the acquisition of specialty assets of Accella, a leadingNorth American manufacturer of liquid polymer formulations for $47.2 million in cash, net of cashacquired. The results of operations of Accella were included in the Company’s ConsolidatedStatements of Income since the date of the acquisition and are reported in the Global Color, Additivesand Inks segment.
Highlights and Executive Summary
A summary of PolyOne’s sales, operating income, income from continuing operations net of incometaxes, net income from continuing operations attributable to PolyOne common shareholders, liquidityand total debt is included in the following table:
(In millions) 2014 2013 2012
Sales $3,835.5 $3,771.2 $2,860.8Operating income 155.1 231.5 137.5Income from continuing operations, net of income taxes 77.2 92.9 53.2Net income from continuing operations attributable to PolyOne common
shareholders 78.0 94.0 53.3
Liquidity $ 475.0 $ 650.9 $ 381.2Total debt $1,023.8 $ 988.9 $ 706.9
24 POLYONE CORPORATION
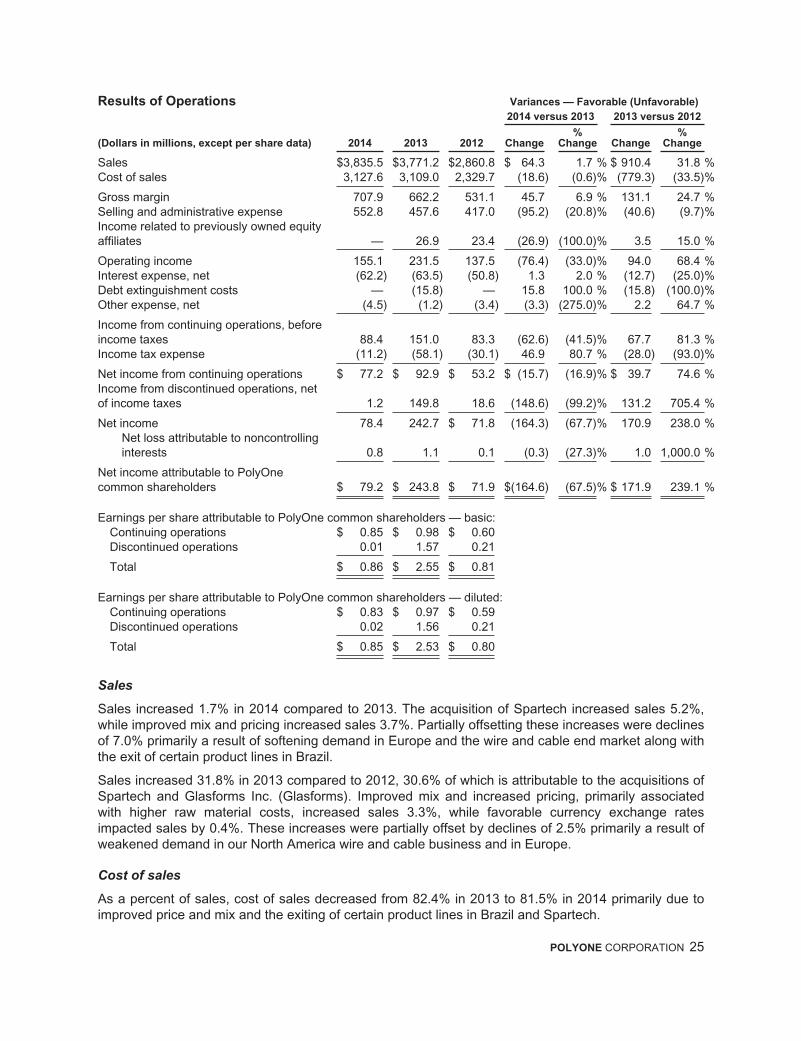
Results of Operations Variances — Favorable (Unfavorable)
2014 versus 2013 2013 versus 2012
(Dollars in millions, except per share data) 2014 2013 2012 Change%
Change Change%
Change
Sales $3,835.5 $3,771.2 $2,860.8 $ 64.3 1.7 % $ 910.4 31.8 %Cost of sales 3,127.6 3,109.0 2,329.7 (18.6) (0.6)% (779.3) (33.5)%
Gross margin 707.9 662.2 531.1 45.7 6.9 % 131.1 24.7 %Selling and administrative expense 552.8 457.6 417.0 (95.2) (20.8)% (40.6) (9.7)%Income related to previously owned equityaffiliates — 26.9 23.4 (26.9) (100.0)% 3.5 15.0 %
Operating income 155.1 231.5 137.5 (76.4) (33.0)% 94.0 68.4 %Interest expense, net (62.2) (63.5) (50.8) 1.3 2.0 % (12.7) (25.0)%Debt extinguishment costs — (15.8) — 15.8 100.0 % (15.8) (100.0)%Other expense, net (4.5) (1.2) (3.4) (3.3) (275.0)% 2.2 64.7 %
Income from continuing operations, beforeincome taxes 88.4 151.0 83.3 (62.6) (41.5)% 67.7 81.3 %Income tax expense (11.2) (58.1) (30.1) 46.9 80.7 % (28.0) (93.0)%
Net income from continuing operations $ 77.2 $ 92.9 $ 53.2 $ (15.7) (16.9)% $ 39.7 74.6 %Income from discontinued operations, netof income taxes 1.2 149.8 18.6 (148.6) (99.2)% 131.2 705.4 %
Net income 78.4 242.7 $ 71.8 (164.3) (67.7)% 170.9 238.0 %Net loss attributable to noncontrollinginterests 0.8 1.1 0.1 (0.3) (27.3)% 1.0 1,000.0 %
Net income attributable to PolyOnecommon shareholders $ 79.2 $ 243.8 $ 71.9 $(164.6) (67.5)% $ 171.9 239.1 %
Earnings per share attributable to PolyOne common shareholders — basic:Continuing operations $ 0.85 $ 0.98 $ 0.60Discontinued operations 0.01 1.57 0.21
Total $ 0.86 $ 2.55 $ 0.81
Earnings per share attributable to PolyOne common shareholders — diluted:Continuing operations $ 0.83 $ 0.97 $ 0.59Discontinued operations 0.02 1.56 0.21
Total $ 0.85 $ 2.53 $ 0.80
Sales
Sales increased 1.7% in 2014 compared to 2013. The acquisition of Spartech increased sales 5.2%,while improved mix and pricing increased sales 3.7%. Partially offsetting these increases were declinesof 7.0% primarily a result of softening demand in Europe and the wire and cable end market along withthe exit of certain product lines in Brazil.
Sales increased 31.8% in 2013 compared to 2012, 30.6% of which is attributable to the acquisitions ofSpartech and Glasforms Inc. (Glasforms). Improved mix and increased pricing, primarily associatedwith higher raw material costs, increased sales 3.3%, while favorable currency exchange ratesimpacted sales by 0.4%. These increases were partially offset by declines of 2.5% primarily a result ofweakened demand in our North America wire and cable business and in Europe.
Cost of sales
As a percent of sales, cost of sales decreased from 82.4% in 2013 to 81.5% in 2014 primarily due toimproved price and mix and the exiting of certain product lines in Brazil and Spartech.
POLYONE CORPORATION 25
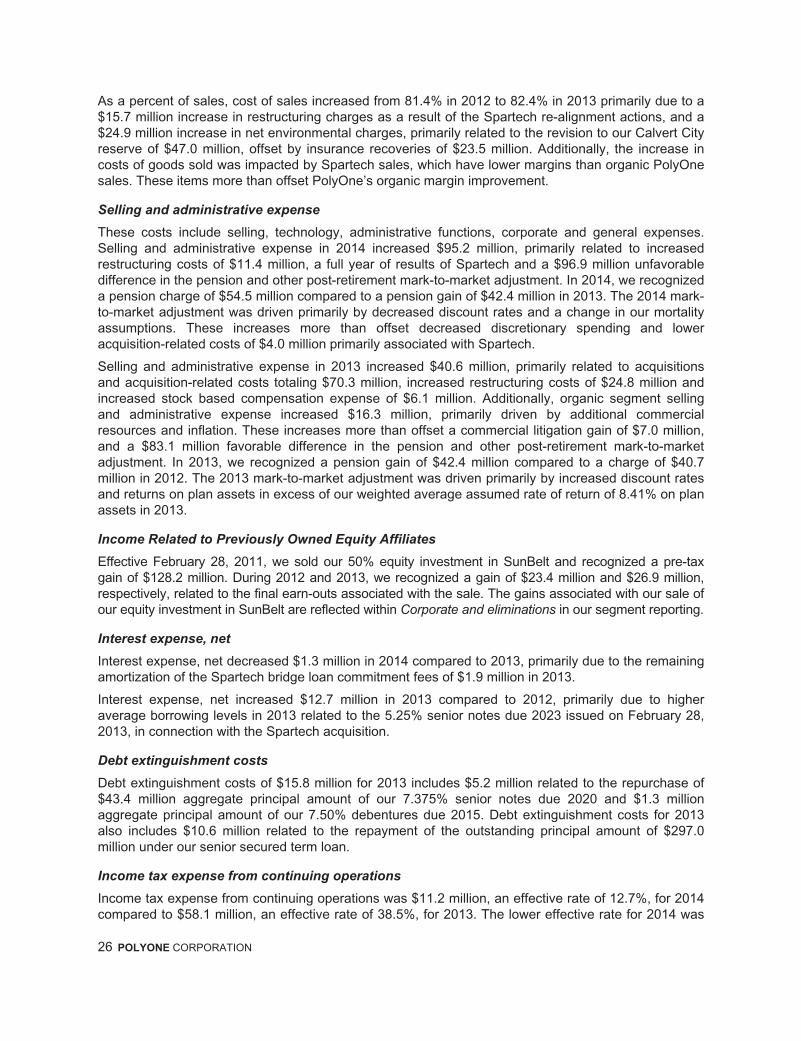
As a percent of sales, cost of sales increased from 81.4% in 2012 to 82.4% in 2013 primarily due to a$15.7 million increase in restructuring charges as a result of the Spartech re-alignment actions, and a$24.9 million increase in net environmental charges, primarily related to the revision to our Calvert Cityreserve of $47.0 million, offset by insurance recoveries of $23.5 million. Additionally, the increase incosts of goods sold was impacted by Spartech sales, which have lower margins than organic PolyOnesales. These items more than offset PolyOne’s organic margin improvement.
Selling and administrative expense
These costs include selling, technology, administrative functions, corporate and general expenses.Selling and administrative expense in 2014 increased $95.2 million, primarily related to increasedrestructuring costs of $11.4 million, a full year of results of Spartech and a $96.9 million unfavorabledifference in the pension and other post-retirement mark-to-market adjustment. In 2014, we recognizeda pension charge of $54.5 million compared to a pension gain of $42.4 million in 2013. The 2014 mark-to-market adjustment was driven primarily by decreased discount rates and a change in our mortalityassumptions. These increases more than offset decreased discretionary spending and loweracquisition-related costs of $4.0 million primarily associated with Spartech.
Selling and administrative expense in 2013 increased $40.6 million, primarily related to acquisitionsand acquisition-related costs totaling $70.3 million, increased restructuring costs of $24.8 million andincreased stock based compensation expense of $6.1 million. Additionally, organic segment sellingand administrative expense increased $16.3 million, primarily driven by additional commercialresources and inflation. These increases more than offset a commercial litigation gain of $7.0 million,and a $83.1 million favorable difference in the pension and other post-retirement mark-to-marketadjustment. In 2013, we recognized a pension gain of $42.4 million compared to a charge of $40.7million in 2012. The 2013 mark-to-market adjustment was driven primarily by increased discount ratesand returns on plan assets in excess of our weighted average assumed rate of return of 8.41% on planassets in 2013.
Income Related to Previously Owned Equity Affiliates
Effective February 28, 2011, we sold our 50% equity investment in SunBelt and recognized a pre-taxgain of $128.2 million. During 2012 and 2013, we recognized a gain of $23.4 million and $26.9 million,respectively, related to the final earn-outs associated with the sale. The gains associated with our sale ofour equity investment in SunBelt are reflected within Corporate and eliminations in our segment reporting.
Interest expense, net
Interest expense, net decreased $1.3 million in 2014 compared to 2013, primarily due to the remainingamortization of the Spartech bridge loan commitment fees of $1.9 million in 2013.
Interest expense, net increased $12.7 million in 2013 compared to 2012, primarily due to higheraverage borrowing levels in 2013 related to the 5.25% senior notes due 2023 issued on February 28,2013, in connection with the Spartech acquisition.
Debt extinguishment costs
Debt extinguishment costs of $15.8 million for 2013 includes $5.2 million related to the repurchase of$43.4 million aggregate principal amount of our 7.375% senior notes due 2020 and $1.3 millionaggregate principal amount of our 7.50% debentures due 2015. Debt extinguishment costs for 2013also includes $10.6 million related to the repayment of the outstanding principal amount of $297.0million under our senior secured term loan.
Income tax expense from continuing operations
Income tax expense from continuing operations was $11.2 million, an effective rate of 12.7%, for 2014compared to $58.1 million, an effective rate of 38.5%, for 2013. The lower effective rate for 2014 was
26 POLYONE CORPORATION

driven by $13.4 million, a 15.2% decline in our effective rate, of tax benefits associated with ourinvestments in certain foreign affiliates in addition to favorable settlements and tax return amendmentswith U.S. and foreign tax authorities of $6.0 million, a 6.8% decline in our effective rate.
Income tax expense from continuing operations was $58.1 million, an effective rate of 38.5%, for 2013compared to $30.1 million, an effective rate of 36.1%, for 2012. The higher effective rate for 2013 wasdriven primarily by a shift in earnings to the United States as a result of the acquisitions of Spartechand Glasforms, which have earnings primarily in the United States.
Segment Information
Operating income is the primary financial measure that is reported to the chief operating decisionmaker for purposes of making decisions about allocating resources to the segment and assessing itsperformance. Operating income at the segment level does not include: corporate general andadministrative costs that are not allocated to segments; intersegment sales and profit eliminations;charges related to specific strategic initiatives, such as the consolidation of operations; restructuringactivities, including employee separation costs resulting from personnel reduction programs, plantclosure and phase-in costs; integration costs; executive separation agreements; share-basedcompensation costs; environmental remediation costs for facilities no longer owned or closed in prioryears; gains and losses on the divestiture of joint ventures and equity investments; actuarial gains andlosses related to pension and post-retirement benefit plans; and certain other items that are notincluded in the measure of segment profit or loss that is reported to and reviewed by the chiefoperating decision maker. These costs are included in Corporate and eliminations.
PolyOne has five reportable segments: (1) Global Color, Additives and Inks; (2) Global SpecialtyEngineered Materials; (3) Designed Structures and Solutions; (4) Performance Products and Solutions;and (5) PolyOne Distribution.
Our segments are further discussed in Note 16, Segment Information, to the accompanyingconsolidated financial statements.
POLYONE CORPORATION 27

Sales and Operating Income — 2014 compared with 2013 and 2013 compared with 2012
2014 versus 2013 2013 versus 2012
(Dollars in millions) 2014 2013 2012 Change % Change Change % Change
Sales:Global Color, Additives and Inks 850.8 852.3 778.2 (1.5) (0.2)% 74.1 9.5 %Global Specialty Engineered
Materials 598.3 615.5 543.6 (17.2) (2.8)% 71.9 13.2 %Designed Structures and Solutions 617.5 597.4 — 20.1 3.4 % 597.4 100.0 %Performance Products and
Solutions 816.6 773.2 630.3 43.4 5.6 % 142.9 22.7 %PolyOne Distribution 1,114.4 1,075.2 1,030.3 39.2 3.6 % 44.9 4.4 %Corporate and eliminations (162.1) (142.4) (121.6) (19.7) (13.8)% (20.8) (17.1)%
Sales $ 3,835.5 $ 3,771.2 $ 2,860.8 $ 64.3 1.7 % $ 910.4 31.8 %
Operating income:Global Color, Additives and Inks 124.9 104.0 75.3 20.9 20.1 % 28.7 38.1 %Global Specialty Engineered
Materials 72.4 57.2 47.0 15.2 26.6 % 10.2 21.7 %Designed Structures and Solutions 45.1 33.4 — 11.7 35.0 % 33.4 100.0 %Performance Products and
Solutions 63.1 56.0 38.8 7.1 12.7 % 17.2 44.3 %PolyOne Distribution 68.2 63.3 66.0 4.9 7.7 % (2.7) (4.1)%Corporate and eliminations (218.6) (82.4) (89.6) (136.2) (165.3)% 7.2 (8.0)%
Operating income $ 155.1 $ 231.5 $ 137.5 $ (76.4) (33.0)% $ 94.0 68.4 %
Operating income as a percentage of sales:Global Color, Additives and Inks 14.7% 12.2% 9.7% 2.5% points 2.5% pointsGlobal Specialty Engineered
Materials 12.1% 9.3% 8.6% 2.8% points 0.7% pointsDesigned Structures and Solutions 7.3% 5.6% — % 1.7% points —Performance Products and
Solutions 7.7% 7.2% 6.2% 0.5% points 1.0% pointsPolyOne Distribution 6.1% 5.9% 6.4% 0.2% points (0.5)% pointsTotal 4.0% 6.1% 4.8% (2.1)% points 1.3% points
Global Color, Additives and Inks
Sales decreased $1.5 million, or 0.2%, in 2014 compared to 2013. Sales decreased 8.0% primarily asa result of weaker demand conditions in Europe and an unfavorable foreign exchange rate impact of0.4%. These decreases were largely offset by mix improvement of 6.2% and an increase of 2.0% dueto the inclusion of a full year of Spartech results.
Operating income increased $20.9 million in 2014 compared to 2013. This increase was driven by yearto date margin expansion related to mix improvement primarily in North America and Asia.
Sales increased $74.1 million, or 9.5%, in 2013 compared to 2012. Sales increased 8.0% as a result ofthe Spartech acquisition, 6.8% due to improved price and mix and 0.9% due to favorable exchangerate impact. These increases were partially offset by a 6.2% decline in volume primarily in the industrialand packaging end markets.
Operating income increased $28.7 million in 2013 compared to 2012. The increase is primarily due toimprovement in mix and the Spartech acquisition.
28 POLYONE CORPORATION

Global Specialty Engineered Materials
Sales decreased $17.2 million, or 2.8%, in 2014 compared to 2013. Improved price and mix resulted ina 4.8% increase to sales while the inclusion of a full year of results in Spartech increased sales 0.6%.These increases were more than offset by decreases of 7.8% primarily due to exiting certain productlines in Brazil and an unfavorable foreign exchange rate impact of 0.4%.
Operating income increased $15.2 million in 2014 compared to 2013. This increase was drivenprimarily by margin expansion resulting from improved mix and exiting certain unprofitable products inBrazil.
Sales increased $71.9 million, or 13.2%, in 2013 compared to 2012. Sales increased 10.0% due to theSpartech and Glasforms acquisitions and 2.6% due to organic sales primarily in the consumer andhealth care end markets, while favorable foreign exchange rates impacted sales by 0.6%.
Operating income increased $10.2 million in 2013 compared to 2012. This increase was drivenprimarily by organic improvements in sales and mix.
Designed Structures and Solutions
Sales increased $20.1 million, or 3.4%, in 2014 compared to 2013. Sales increased 22.1% as a resultof the inclusion of Spartech results for the full year in 2014 and 6.5% due to improved mix and price.Partially offsetting these increases was a 25.0% decline resulting from exiting certain products.
Operating income increased $11.7 million, or 35.0%, in 2014 compared to 2013. This increase wasdriven primarily by improved mix reflecting the exit of certain unprofitable products, cost reductionsrelated to North American realignment actions and the inclusion of Spartech results for the full year of2014.
Performance Products and Solutions
Sales increased $43.4 million, or 5.6%, in 2014 compared to 2013. Sales increased 5.5% as a result ofthe acquisition of Spartech and 2.1% due to increases primarily within the industrial and transportationend markets. These increases were partially offset by unfavorable mix as the volume increases wereassociated with higher contract manufacturing sales.
Operating income increased $7.1 million in 2014 compared to 2013 primarily due to increased salesand cost reductions from the North American realignment actions.
Sales increased $142.9 million, or 22.7%, in 2013 compared to 2012. Sales increased 25.3% due tothe Spartech acquisition and 2.2% due to improved pricing and mix. These increases were partiallyoffset by volume declines of 4.8% primarily related to contract manufacturing for the transportation endmarkets.
Operating income increased $17.2 million in 2013 compared to 2012 primarily due to improved priceand mix and the Spartech acquisition.
PolyOne Distribution
Sales increased $39.2 million, or 3.6%, in 2014 compared to 2013, primarily associated with higher rawmaterial costs.
Operating income increased $4.9 million in 2014 compared to 2013 primarily due to increased salesand slightly lower selling and administrative expense.
Sales increased $44.9 million, or 4.4%, in 2013 compared to 2012. Increased pricing associated withhigher raw material costs increased sales by 3.1%, while volume increases favorably impacted salesby 1.3%.
POLYONE CORPORATION 29

Operating income decreased $2.7 million in 2013 compared to 2012 primarily due to higher rawmaterial costs.
Corporate and Eliminations
The following table breaks down Corporate and eliminations into its various components for 2014,2013 and 2012:
(In millions)
Year EndedDecember 31,
2014
Year EndedDecember 31,
2013
Year EndedDecember 31,
2012
Environmental remediation costs $ (10.3) $(61.2) $(12.8)Insurance recoveries and other settlements (a) 3.7 30.5 —Employee separation and restructuring costs (b) (94.1) (52.0) (11.5)Gain on sale related to investment in equity affiliate (c) — 26.9 23.4Share based compensation (14.2) (16.5) (10.4)Non-share based incentive compensation (25.0) (25.2) (22.8)Pension and other post-retirement (expense)/income (d) (51.5) 55.2 (26.5)Acquisition-related costs, including inventory fair value adjustments (3.8) (15.2) (9.3)All other and eliminations (e) (23.4) (24.9) (19.7)
Total Corporate and eliminations $(218.6) $(82.4) $(89.6)
(a) These settlements primarily relate to the reimbursement of previously incurred environmental costs.(b) Includes $59.7 million and $44.1 million in 2014 and 2013, respectively, of Spartech related restructuring as part of the
Spartech integration designed to better serve customers, improve efficiency and deliver synergy related cost savings. 2014also includes $17.0 million of charges related to our closure of two manufacturing locations in Brazil. Refer to Note 4,Employee Separation and Restructuring Costs, for further information about these actions and estimated future costs.
(c) On February 28, 2011, we sold our 50% equity interest in SunBelt to Olin Corporation (Olin). The gain for 2012 and 2013primarily represents the second and final earn-outs related to the sale of our equity interest in SunBelt.
(d) We have elected to immediately recognize actuarial gains and losses in our operating results in the year in which the gainsor losses occur related to our pension and other post-retirement benefit plans. Amounts shown here include the followingmark-to-market adjustments: a $56.5 million charge in 2014, a $44.0 million gain in 2013 and a $42.0 million charge in 2012.
(e) All other and eliminations is comprised of intersegment eliminations and corporate general and administrative costs that arenot allocated to segments.
Liquidity and Capital Resources
Our objective is to finance our business through operating cash flow and an appropriate mix of debtand equity. By laddering the maturity structure, we avoid concentrations of debt maturities, reducingliquidity risk. We may from time to time seek to retire or purchase our outstanding debt with cash and/or exchanges for equity securities, in open market purchases, privately negotiated transactions orotherwise. We may also seek to repurchase our outstanding common shares. Such repurchases, ifany, will depend on prevailing market conditions, our liquidity requirements, contractual restrictions andother factors. The amounts involved may be material.
The following table summarizes our liquidity as of December 31, 2014:
(In millions) As of December 31, 2014
Cash and cash equivalents $238.6Revolving credit availability 236.4
Liquidity $475.0
As of December 31, 2014, 91% of the Company’s cash and cash equivalents resided outside theUnited States. Repatriation of these funds could result in potential foreign and domestic taxes. To theextent foreign earnings previously treated as permanently reinvested were to be repatriated, thepotential U.S. tax liability may be reduced by any foreign income taxes paid on these earnings.However, based on the Company’s policy of permanent reinvestment, it is not practicable to determine
30 POLYONE CORPORATION
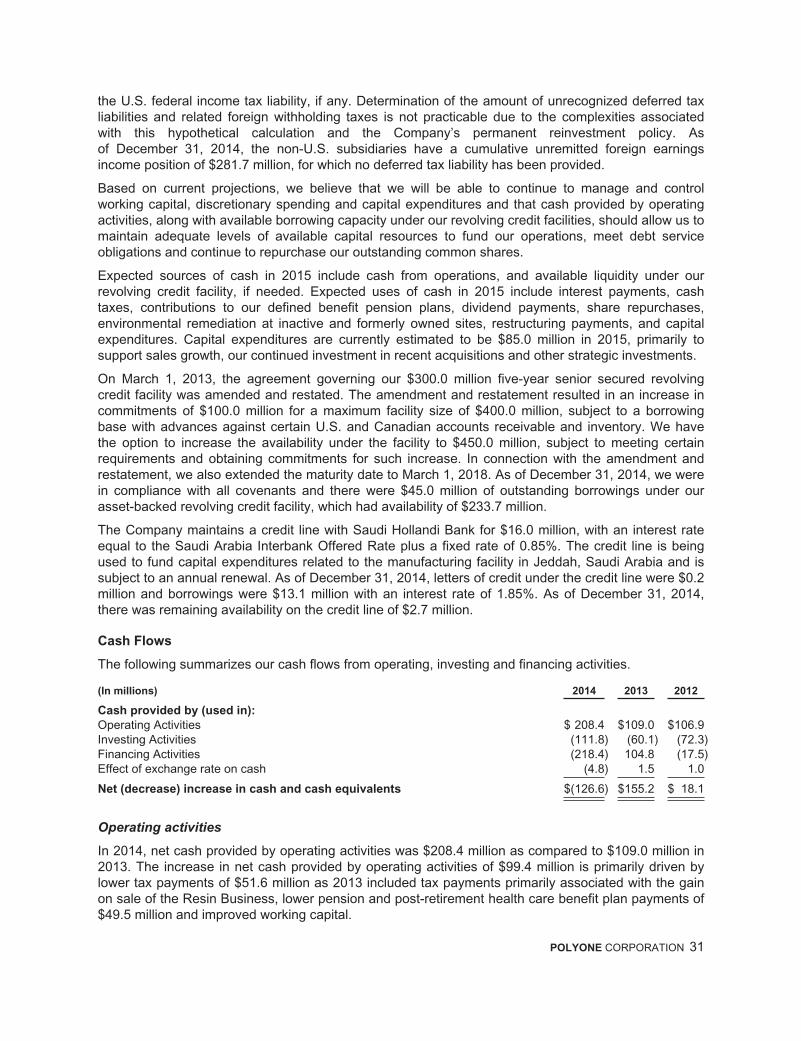
the U.S. federal income tax liability, if any. Determination of the amount of unrecognized deferred taxliabilities and related foreign withholding taxes is not practicable due to the complexities associatedwith this hypothetical calculation and the Company’s permanent reinvestment policy. Asof December 31, 2014, the non-U.S. subsidiaries have a cumulative unremitted foreign earningsincome position of $281.7 million, for which no deferred tax liability has been provided.
Based on current projections, we believe that we will be able to continue to manage and controlworking capital, discretionary spending and capital expenditures and that cash provided by operatingactivities, along with available borrowing capacity under our revolving credit facilities, should allow us tomaintain adequate levels of available capital resources to fund our operations, meet debt serviceobligations and continue to repurchase our outstanding common shares.
Expected sources of cash in 2015 include cash from operations, and available liquidity under ourrevolving credit facility, if needed. Expected uses of cash in 2015 include interest payments, cashtaxes, contributions to our defined benefit pension plans, dividend payments, share repurchases,environmental remediation at inactive and formerly owned sites, restructuring payments, and capitalexpenditures. Capital expenditures are currently estimated to be $85.0 million in 2015, primarily tosupport sales growth, our continued investment in recent acquisitions and other strategic investments.
On March 1, 2013, the agreement governing our $300.0 million five-year senior secured revolvingcredit facility was amended and restated. The amendment and restatement resulted in an increase incommitments of $100.0 million for a maximum facility size of $400.0 million, subject to a borrowingbase with advances against certain U.S. and Canadian accounts receivable and inventory. We havethe option to increase the availability under the facility to $450.0 million, subject to meeting certainrequirements and obtaining commitments for such increase. In connection with the amendment andrestatement, we also extended the maturity date to March 1, 2018. As of December 31, 2014, we werein compliance with all covenants and there were $45.0 million of outstanding borrowings under ourasset-backed revolving credit facility, which had availability of $233.7 million.
The Company maintains a credit line with Saudi Hollandi Bank for $16.0 million, with an interest rateequal to the Saudi Arabia Interbank Offered Rate plus a fixed rate of 0.85%. The credit line is beingused to fund capital expenditures related to the manufacturing facility in Jeddah, Saudi Arabia and issubject to an annual renewal. As of December 31, 2014, letters of credit under the credit line were $0.2million and borrowings were $13.1 million with an interest rate of 1.85%. As of December 31, 2014,there was remaining availability on the credit line of $2.7 million.
Cash Flows
The following summarizes our cash flows from operating, investing and financing activities.
(In millions) 2014 2013 2012
Cash provided by (used in):
Operating Activities $ 208.4 $109.0 $106.9Investing Activities (111.8) (60.1) (72.3)Financing Activities (218.4) 104.8 (17.5)Effect of exchange rate on cash (4.8) 1.5 1.0
Net (decrease) increase in cash and cash equivalents $(126.6) $155.2 $ 18.1
Operating activities
In 2014, net cash provided by operating activities was $208.4 million as compared to $109.0 million in2013. The increase in net cash provided by operating activities of $99.4 million is primarily driven bylower tax payments of $51.6 million as 2013 included tax payments primarily associated with the gainon sale of the Resin Business, lower pension and post-retirement health care benefit plan payments of$49.5 million and improved working capital.
POLYONE CORPORATION 31
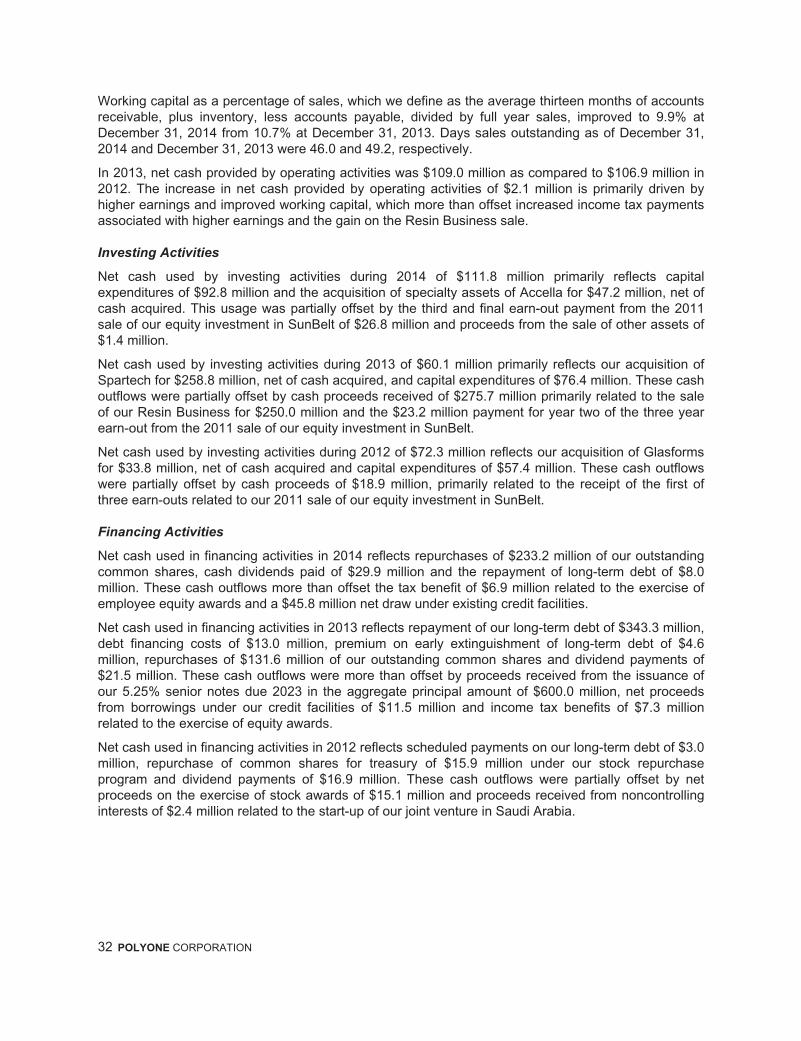
Working capital as a percentage of sales, which we define as the average thirteen months of accountsreceivable, plus inventory, less accounts payable, divided by full year sales, improved to 9.9% atDecember 31, 2014 from 10.7% at December 31, 2013. Days sales outstanding as of December 31,2014 and December 31, 2013 were 46.0 and 49.2, respectively.
In 2013, net cash provided by operating activities was $109.0 million as compared to $106.9 million in2012. The increase in net cash provided by operating activities of $2.1 million is primarily driven byhigher earnings and improved working capital, which more than offset increased income tax paymentsassociated with higher earnings and the gain on the Resin Business sale.
Investing Activities
Net cash used by investing activities during 2014 of $111.8 million primarily reflects capitalexpenditures of $92.8 million and the acquisition of specialty assets of Accella for $47.2 million, net ofcash acquired. This usage was partially offset by the third and final earn-out payment from the 2011sale of our equity investment in SunBelt of $26.8 million and proceeds from the sale of other assets of$1.4 million.
Net cash used by investing activities during 2013 of $60.1 million primarily reflects our acquisition ofSpartech for $258.8 million, net of cash acquired, and capital expenditures of $76.4 million. These cashoutflows were partially offset by cash proceeds received of $275.7 million primarily related to the saleof our Resin Business for $250.0 million and the $23.2 million payment for year two of the three yearearn-out from the 2011 sale of our equity investment in SunBelt.
Net cash used by investing activities during 2012 of $72.3 million reflects our acquisition of Glasformsfor $33.8 million, net of cash acquired and capital expenditures of $57.4 million. These cash outflowswere partially offset by cash proceeds of $18.9 million, primarily related to the receipt of the first ofthree earn-outs related to our 2011 sale of our equity investment in SunBelt.
Financing Activities
Net cash used in financing activities in 2014 reflects repurchases of $233.2 million of our outstandingcommon shares, cash dividends paid of $29.9 million and the repayment of long-term debt of $8.0million. These cash outflows more than offset the tax benefit of $6.9 million related to the exercise ofemployee equity awards and a $45.8 million net draw under existing credit facilities.
Net cash used in financing activities in 2013 reflects repayment of our long-term debt of $343.3 million,debt financing costs of $13.0 million, premium on early extinguishment of long-term debt of $4.6million, repurchases of $131.6 million of our outstanding common shares and dividend payments of$21.5 million. These cash outflows were more than offset by proceeds received from the issuance ofour 5.25% senior notes due 2023 in the aggregate principal amount of $600.0 million, net proceedsfrom borrowings under our credit facilities of $11.5 million and income tax benefits of $7.3 millionrelated to the exercise of equity awards.
Net cash used in financing activities in 2012 reflects scheduled payments on our long-term debt of $3.0million, repurchase of common shares for treasury of $15.9 million under our stock repurchaseprogram and dividend payments of $16.9 million. These cash outflows were partially offset by netproceeds on the exercise of stock awards of $15.1 million and proceeds received from noncontrollinginterests of $2.4 million related to the start-up of our joint venture in Saudi Arabia.
32 POLYONE CORPORATION

Total Debt
The following summarizes our debt as of December 31, 2014 and 2013.
(Dollars in millions)December 31,
2014December 31,
2013
7.500% debentures due 2015 $ 48.7 $ 48.7Revolving credit facility due 2018 45.0 —7.375% senior notes due 2020 316.6 316.65.250% senior notes due 2023 600.0 600.0Other debt 13.5 23.6
Total debt $1,023.8 $988.9Less: short-term and current portion of long-term debt 61.8 12.7
Total long-term debt, net of current portion $ 962.0 $976.2
During the first quarter of 2014, we repaid an $8.0 million industrial revenue bond that was assumed asa result of the Spartech acquisition.
In 2013, we repurchased $43.4 million aggregate principal amount of our 7.375% senior notes due2020, $1.3 million aggregate principal amount of our 7.50% debentures due 2015 and $1.6 million ofother debt. Additionally, we recognized $5.2 million of debt extinguishment costs within Debtextinguishment costs in our Consolidated Statements of Income in connection with these repurchases.
On February 28, 2013, PolyOne issued $600.0 million aggregate principal amount of senior notes,which mature on March 15, 2023. The senior notes bear an interest rate of 5.25% per year, payablesemi-annually, in arrears, on March 15 and September 15 of each year, which commenced onSeptember 15, 2013. We used a portion of the net proceeds of the offering to pay the cash portion ofthe Spartech acquisition, and to repay certain Spartech debt, including the $88.9 million aggregateprincipal amount of its senior notes due 2016 and related interest and make-whole payments totaling$13.4 million and all outstanding amounts under its revolving credit facility. We also used a portion ofthese net proceeds to make a voluntary $50.0 million contribution to our U.S. qualified defined benefitplan and to repay the outstanding principal amount of $297.0 million under our senior secured termloan. We incurred debt extinguishment costs of $10.6 million related to the early retirement of oursenior secured term loan including $8.2 million of deferred financing cost write-offs and $2.4 million ofdiscounts that were written off. These costs are presented within Debt extinguishment costs in ourConsolidated Statements of Income.
On March 1, 2013, the agreement governing our $300.0 million five-year senior secured revolvingcredit facility was amended and restated. The amendment and restatement resulted in an increase incommitments of $100.0 million for a maximum facility size of $400.0 million, subject to a borrowingbase with advances against certain U.S. and Canadian accounts receivable and inventory. We havethe option to increase the availability under the facility to $450.0 million, subject to meeting certainrequirements and obtaining commitments for such increase. In connection with the amendment andrestatement, we also extended the maturity date to March 1, 2018. As of December 31, 2014, we werein compliance with all covenants and there were $45.0 million of outstanding borrowings under ourasset-backed revolving credit facility, which had remaining availability of $233.7 million.
The Company maintains a credit line with Saudi Hollandi Bank for $16.0 million, with an interest rateequal to the Saudi Arabia Interbank Offered Rate plus a fixed rate of 0.85%. The credit line is beingused to fund capital expenditures related to the manufacturing facility in Jeddah, Saudi Arabia and issubject to an annual renewal. As of December 31, 2014, letters of credit under the credit line were $0.2million and borrowings were $13.1 million with an interest rate of 1.85%. As of December 31, 2014,there was remaining availability on the credit line of $2.7 million.
For additional information about our financing arrangements, see Note 6, Financing Arrangements, tothe accompanying consolidated financial statements.
POLYONE CORPORATION 33
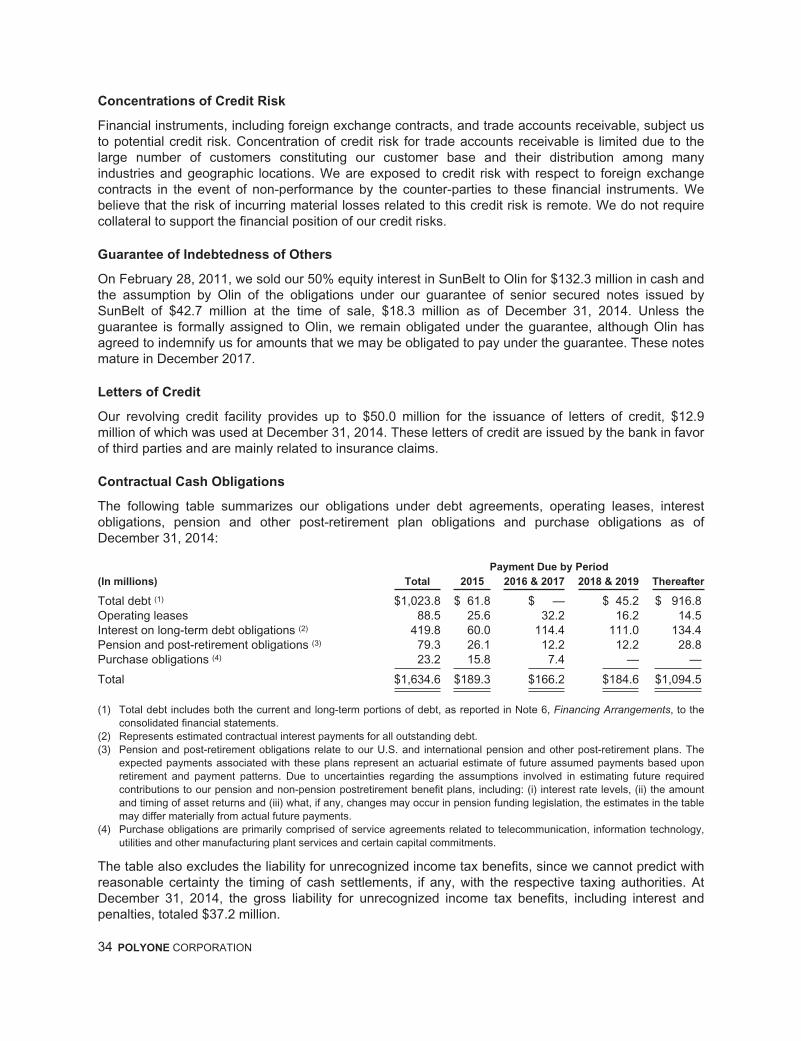
Concentrations of Credit Risk
Financial instruments, including foreign exchange contracts, and trade accounts receivable, subject usto potential credit risk. Concentration of credit risk for trade accounts receivable is limited due to thelarge number of customers constituting our customer base and their distribution among manyindustries and geographic locations. We are exposed to credit risk with respect to foreign exchangecontracts in the event of non-performance by the counter-parties to these financial instruments. Webelieve that the risk of incurring material losses related to this credit risk is remote. We do not requirecollateral to support the financial position of our credit risks.
Guarantee of Indebtedness of Others
On February 28, 2011, we sold our 50% equity interest in SunBelt to Olin for $132.3 million in cash andthe assumption by Olin of the obligations under our guarantee of senior secured notes issued bySunBelt of $42.7 million at the time of sale, $18.3 million as of December 31, 2014. Unless theguarantee is formally assigned to Olin, we remain obligated under the guarantee, although Olin hasagreed to indemnify us for amounts that we may be obligated to pay under the guarantee. These notesmature in December 2017.
Letters of Credit
Our revolving credit facility provides up to $50.0 million for the issuance of letters of credit, $12.9million of which was used at December 31, 2014. These letters of credit are issued by the bank in favorof third parties and are mainly related to insurance claims.
Contractual Cash Obligations
The following table summarizes our obligations under debt agreements, operating leases, interestobligations, pension and other post-retirement plan obligations and purchase obligations as ofDecember 31, 2014:
Payment Due by Period
(In millions) Total 2015 2016 & 2017 2018 & 2019 Thereafter
Total debt (1) $1,023.8 $ 61.8 $ — $ 45.2 $ 916.8Operating leases 88.5 25.6 32.2 16.2 14.5Interest on long-term debt obligations (2) 419.8 60.0 114.4 111.0 134.4Pension and post-retirement obligations (3) 79.3 26.1 12.2 12.2 28.8Purchase obligations (4) 23.2 15.8 7.4 — —
Total $1,634.6 $189.3 $166.2 $184.6 $1,094.5
(1) Total debt includes both the current and long-term portions of debt, as reported in Note 6, Financing Arrangements, to theconsolidated financial statements.
(2) Represents estimated contractual interest payments for all outstanding debt.(3) Pension and post-retirement obligations relate to our U.S. and international pension and other post-retirement plans. The
expected payments associated with these plans represent an actuarial estimate of future assumed payments based uponretirement and payment patterns. Due to uncertainties regarding the assumptions involved in estimating future requiredcontributions to our pension and non-pension postretirement benefit plans, including: (i) interest rate levels, (ii) the amountand timing of asset returns and (iii) what, if any, changes may occur in pension funding legislation, the estimates in the tablemay differ materially from actual future payments.
(4) Purchase obligations are primarily comprised of service agreements related to telecommunication, information technology,utilities and other manufacturing plant services and certain capital commitments.
The table also excludes the liability for unrecognized income tax benefits, since we cannot predict withreasonable certainty the timing of cash settlements, if any, with the respective taxing authorities. AtDecember 31, 2014, the gross liability for unrecognized income tax benefits, including interest andpenalties, totaled $37.2 million.
34 POLYONE CORPORATION

Off-Balance Sheet Arrangements
We have no off-balance sheet arrangements as defined in Item 303(a)(4)(ii) of Regulation S-K otherthan the SunBelt debt guarantee described previously in the Guarantee of Indebtedness of Otherssection.
Critical Accounting Policies and Estimates
Significant accounting policies are described more fully in Note 1, Description of Business andSummary of Significant Accounting Policies, to the accompanying consolidated financial statements.The preparation of financial statements in conformity with U.S. generally accepted accountingprinciples (U.S. GAAP) requires us to make estimates and assumptions about future events that affectthe amounts reported in our consolidated financial statements and accompanying notes. We base ourestimates on historical experience and assumptions that we believe are reasonable considering therelated facts and circumstances. The application of these critical accounting policies involves theexercise of judgment and use of assumptions for future uncertainties. Accordingly, actual results coulddiffer significantly from these estimates. We believe that the following discussion addresses our mostcritical accounting policies, which are those that are the most important to the portrayal of our financialcondition and results of operations and require our most difficult, subjective and complex judgments.
Description Judgments and UncertaintiesEffect if Actual Results
Differ from Assumptions
Pension and Other Post-retirement Plans
Š We account for our defined benefitpension plans and other post-retirementplans in accordance with FASB ASC Topic715, Compensation — RetirementBenefits. We immediately recognizeactuarial gains and losses in our operatingresults in the year in which the gains orlosses occur. In 2014, we recognized a$56.5 million charge as a result of therecognition of these actuarial losses, whichunfavorably impacted our statement ofincome, statement of comprehensiveincome, and the funded status of ourpension plans. This charge was mainlydriven by a decrease in discount rates andupdated mortality assumptions.
Š Asset returns and interest ratessignificantly affect the value of futureassets and liabilities of our pension andpost-retirement plans and therefore thefunded status of our plans. It is difficultto predict these factors due to thevolatility of market conditions.
Š To develop our discount rate, weconsider the yields of high-quality, fixed-income investments with maturities thatcorrespond to the timing of our benefitobligations.
Š To develop our expected long-termreturn on plan assets, we considerhistorical and forward looking long-termasset returns and the expectedinvestment portfolio mix of plan assets.The weighted-average expected long-term rate of return on plan assets was6.86% for 2014, 8.41% for 2013 and8.43% 2012.
Š Life expectancy is a significantassumption that impacts our pensionand other post-retirement benefitsobligation. During 2014, we adoptedthe RP-2014 mortality table which wasissued by the Society of Actuaries inOctober 2014.
Š The weighted average discountrates used to value our pensionliabilities as of December 31, 2014and 2013 were 3.88% and 4.83%,post-retirement liabilities were 3.75%and 4.38%. As of December 31,2014, an increase/decrease in thediscount rate of 50 basis points,holding all other assumptionsconstant, would have increased ordecreased pre-tax income and therelated pension and post-retirementliability by approximately $28.0million. An increase/decrease in thediscount rate of 50 basis points as ofDecember 31, 2014 would result in achange of approximately $1.5 millionin the 2015 net periodic benefit cost.
Š As we recognize returns on ourplan assets based upon the actualreturns of these assets through amark-to-market adjustment that isrecorded in the fourth quarter,therefore no sensitivity analysis for aone percentage increase/decrease inour expected long-term return on planassets has been provided.
Goodwill and Indefinite-lived Intangible
Assets
Š Goodwill represents the excess of thepurchase price over the fair value of the netassets of acquired companies. We follow theguidance in ASC 350, Intangibles —
Š We have identified our reporting unitsat the operating segment level, or insome cases, one level below theoperating segment level. Goodwill is
Š If actual results are not consistentwith our assumptions and estimates,we may be exposed to additionalgoodwill impairment charges.
POLYONE CORPORATION 35
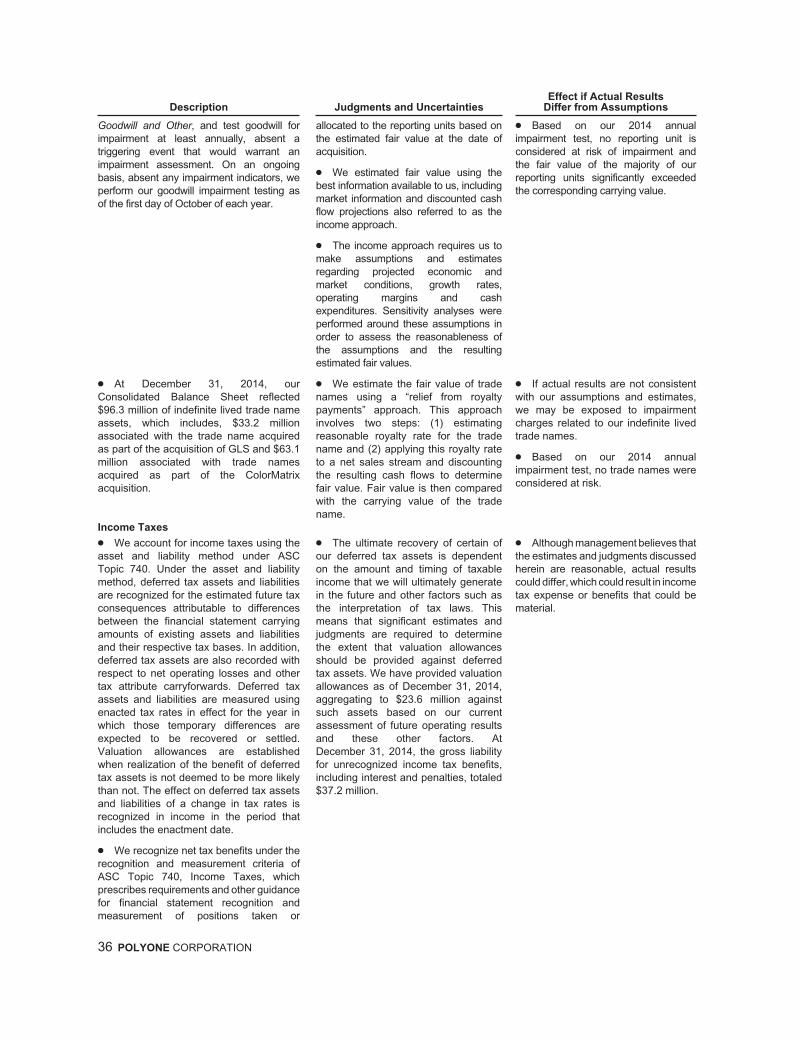
Description Judgments and UncertaintiesEffect if Actual Results
Differ from Assumptions
Goodwill and Other, and test goodwill forimpairment at least annually, absent atriggering event that would warrant animpairment assessment. On an ongoingbasis, absent any impairment indicators, weperform our goodwill impairment testing asof the first day of October of each year.
allocated to the reporting units based onthe estimated fair value at the date ofacquisition.
Š We estimated fair value using thebest information available to us, includingmarket information and discounted cashflow projections also referred to as theincome approach.
Š The income approach requires us tomake assumptions and estimatesregarding projected economic andmarket conditions, growth rates,operating margins and cashexpenditures. Sensitivity analyses wereperformed around these assumptions inorder to assess the reasonableness ofthe assumptions and the resultingestimated fair values.
Š Based on our 2014 annualimpairment test, no reporting unit isconsidered at risk of impairment andthe fair value of the majority of ourreporting units significantly exceededthe corresponding carrying value.
Š At December 31, 2014, ourConsolidated Balance Sheet reflected$96.3 million of indefinite lived trade nameassets, which includes, $33.2 millionassociated with the trade name acquiredas part of the acquisition of GLS and $63.1million associated with trade namesacquired as part of the ColorMatrixacquisition.
Š We estimate the fair value of tradenames using a “relief from royaltypayments” approach. This approachinvolves two steps: (1) estimatingreasonable royalty rate for the tradename and (2) applying this royalty rateto a net sales stream and discountingthe resulting cash flows to determinefair value. Fair value is then comparedwith the carrying value of the tradename.
Š If actual results are not consistentwith our assumptions and estimates,we may be exposed to impairmentcharges related to our indefinite livedtrade names.
Š Based on our 2014 annualimpairment test, no trade names wereconsidered at risk.
Income Taxes
Š We account for income taxes using theasset and liability method under ASCTopic 740. Under the asset and liabilitymethod, deferred tax assets and liabilitiesare recognized for the estimated future taxconsequences attributable to differencesbetween the financial statement carryingamounts of existing assets and liabilitiesand their respective tax bases. In addition,deferred tax assets are also recorded withrespect to net operating losses and othertax attribute carryforwards. Deferred taxassets and liabilities are measured usingenacted tax rates in effect for the year inwhich those temporary differences areexpected to be recovered or settled.Valuation allowances are establishedwhen realization of the benefit of deferredtax assets is not deemed to be more likelythan not. The effect on deferred tax assetsand liabilities of a change in tax rates isrecognized in income in the period thatincludes the enactment date.
Š The ultimate recovery of certain ofour deferred tax assets is dependenton the amount and timing of taxableincome that we will ultimately generatein the future and other factors such asthe interpretation of tax laws. Thismeans that significant estimates andjudgments are required to determinethe extent that valuation allowancesshould be provided against deferredtax assets. We have provided valuationallowances as of December 31, 2014,aggregating to $23.6 million againstsuch assets based on our currentassessment of future operating resultsand these other factors. AtDecember 31, 2014, the gross liabilityfor unrecognized income tax benefits,including interest and penalties, totaled$37.2 million.
Š Although management believes thatthe estimates and judgments discussedherein are reasonable, actual resultscould differ, which could result in incometax expense or benefits that could bematerial.
Š We recognize net tax benefits under therecognition and measurement criteria ofASC Topic 740, Income Taxes, whichprescribes requirements and other guidancefor financial statement recognition andmeasurement of positions taken or
36 POLYONE CORPORATION

Description Judgments and UncertaintiesEffect if Actual Results
Differ from Assumptions
expected to be taken on tax returns. Werecord interest and penalties related touncertain tax positions as a component ofincome tax expense.
Environmental Liabilities
Š Based upon our estimates, we have$121.1 million accrued at December 31,2014 for probable future environmentalexpenditures. Any such provision isrecognized using the Company’s bestestimate of the amount of loss incurred, orat the lower end of an estimated range,when a single best estimate is notdeterminable. In some cases, the Companyrecovers a portion of the costs relating tothese obligations from insurers or otherthird parties; however, the Companyrecords such amounts only when it isprobable that they will be collected.
Š This accrual represents our bestestimate of the remaining probable costsbased upon information and technologycurrently available. Depending upon theresults of future testing, the ultimateremediation alternatives undertaken,changes in regulations, new information,newly discovered conditions and otherfactors, it is reasonably possible that wecould incur additional costs in excess ofthe amount accrued. However, suchadditional costs, if any, cannot currentlybe estimated. Our estimate of thisliability may be revised as newregulations or technologies aredeveloped or additional information isobtained.
Š If further developments orresolution of these matters are notconsistent with our assumptions andjudgments, we may need to recognizea significant adjustment in a futureperiod.
Š As noted in Note 13,Commitments and Contingencies, werecorded a $47.0 million adjustment in2013 related to our ongoing remedialinvestigation and feasibility study(RIFS) at Calvert City. As we progressthrough certain benchmarks such ascompletion of the RIFS, issuance of arecord of decision and remedialdesign, additional information maybecome available that requires anadjustment to our existing reserves.
Share-Based Compensation
Š We have share-based compensationplans that include non-qualified stockoptions, incentive stock options, restrictedstock units, performance shares and stockappreciation rights (SARs). See Note 15,Share-Based Compensation, to theaccompanying consolidated financialstatements for a complete discussion ofour stock-based compensation programs.
Š Option-pricing models and generallyaccepted valuation techniques requiremanagement to make assumptions andto apply judgment to determine the fairvalue of our awards. These assumptionsand judgments include estimating thefuture volatility of our stock price, futureforfeiture rates and risk-free rates ofreturn.
Š We do not believe there is areasonable likelihood there will be amaterial change in the future estimatesor assumptions we use to determineshare-based compensation expense.
Š We determined the fair value of theSARs granted based on a Monte Carlosimulation method.
Future Adoption of Accounting Standards
In April 2014, the FASB issued ASU No. 2014-08, “Presentation of Financial Statements and Property,Plant, and Equipment,” which revises what qualifies as a discontinued operation, changes the criteriafor determining which disposals can be presented as discontinued operations and modifies relateddisclosure requirements. This ASU will be effective for the Company for applicable transactionsoccurring after January 1, 2015. We will prospectively apply the guidance to applicable transactions.
In May 2014, the FASB issued a new standard regarding revenue recognition. Under this standard, acompany recognizes revenue when it transfers promised goods or services to customers in an amountthat reflects the consideration to which the company expects to be entitled in exchange for those goodsor services. The standard implements a five-step process for customer contract revenue recognitionthat focuses on transfer of control. It will be effective for us beginning January 1, 2017, with earlyadoption not permitted. Entities can transition to the standard either retrospectively or as a cumulative-effect adjustment as of the date of adoption. We are currently assessing the impact this standard willhave on our consolidated financial statements as well as the method by which we will adopt the newstandard.
POLYONE CORPORATION 37
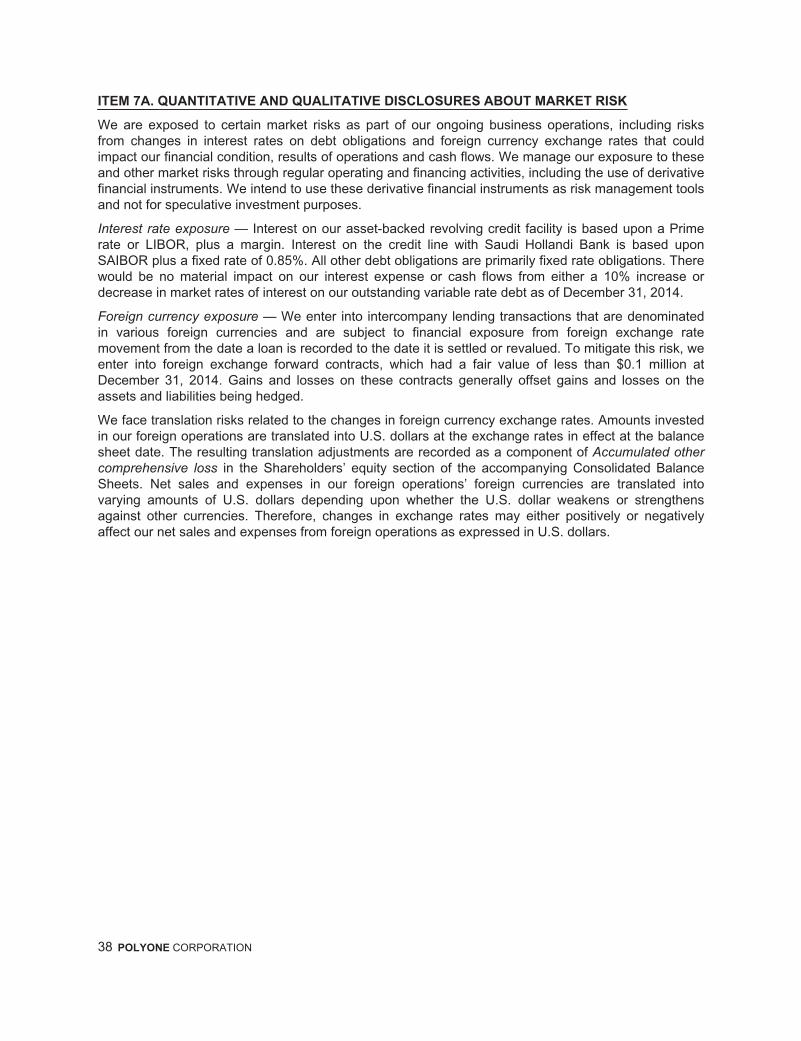
ITEM 7A. QUANTITATIVE AND QUALITATIVE DISCLOSURES ABOUT MARKET RISK
We are exposed to certain market risks as part of our ongoing business operations, including risksfrom changes in interest rates on debt obligations and foreign currency exchange rates that couldimpact our financial condition, results of operations and cash flows. We manage our exposure to theseand other market risks through regular operating and financing activities, including the use of derivativefinancial instruments. We intend to use these derivative financial instruments as risk management toolsand not for speculative investment purposes.
Interest rate exposure — Interest on our asset-backed revolving credit facility is based upon a Primerate or LIBOR, plus a margin. Interest on the credit line with Saudi Hollandi Bank is based uponSAIBOR plus a fixed rate of 0.85%. All other debt obligations are primarily fixed rate obligations. Therewould be no material impact on our interest expense or cash flows from either a 10% increase ordecrease in market rates of interest on our outstanding variable rate debt as of December 31, 2014.
Foreign currency exposure — We enter into intercompany lending transactions that are denominatedin various foreign currencies and are subject to financial exposure from foreign exchange ratemovement from the date a loan is recorded to the date it is settled or revalued. To mitigate this risk, weenter into foreign exchange forward contracts, which had a fair value of less than $0.1 million atDecember 31, 2014. Gains and losses on these contracts generally offset gains and losses on theassets and liabilities being hedged.
We face translation risks related to the changes in foreign currency exchange rates. Amounts investedin our foreign operations are translated into U.S. dollars at the exchange rates in effect at the balancesheet date. The resulting translation adjustments are recorded as a component of Accumulated othercomprehensive loss in the Shareholders’ equity section of the accompanying Consolidated BalanceSheets. Net sales and expenses in our foreign operations’ foreign currencies are translated intovarying amounts of U.S. dollars depending upon whether the U.S. dollar weakens or strengthensagainst other currencies. Therefore, changes in exchange rates may either positively or negativelyaffect our net sales and expenses from foreign operations as expressed in U.S. dollars.
38 POLYONE CORPORATION
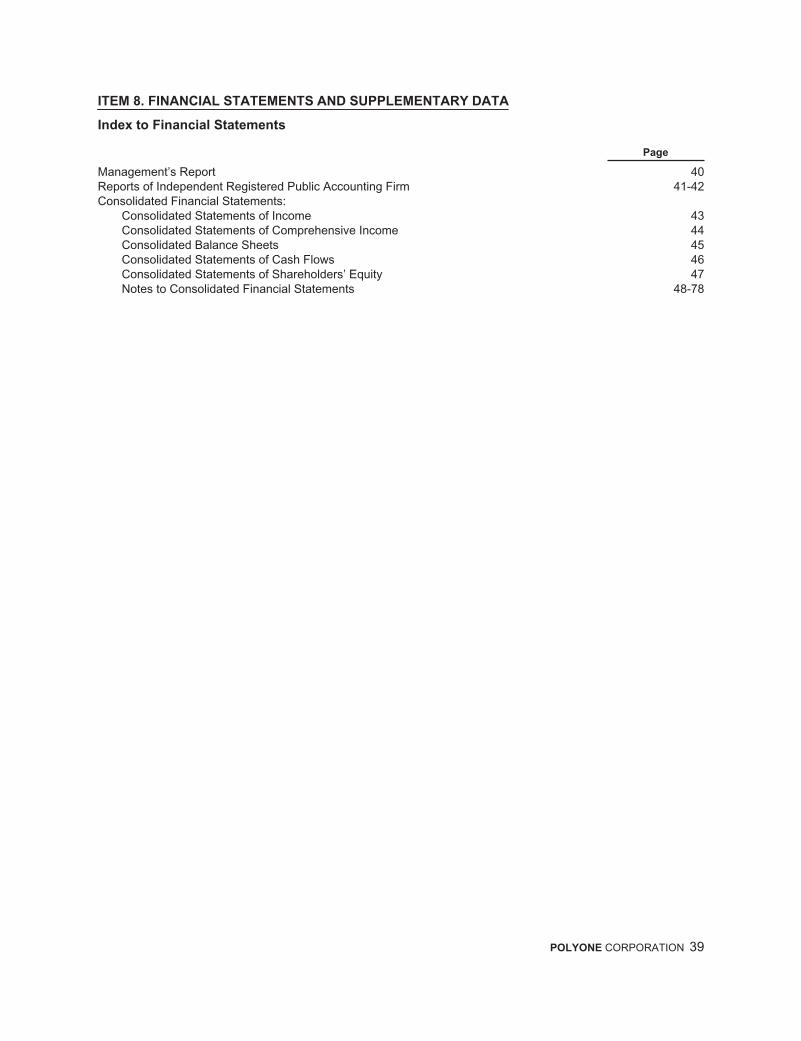
ITEM 8. FINANCIAL STATEMENTS AND SUPPLEMENTARY DATA
Index to Financial Statements
Page
Management’s Report 40Reports of Independent Registered Public Accounting Firm 41-42Consolidated Financial Statements:
Consolidated Statements of Income 43Consolidated Statements of Comprehensive Income 44Consolidated Balance Sheets 45Consolidated Statements of Cash Flows 46Consolidated Statements of Shareholders’ Equity 47Notes to Consolidated Financial Statements 48-78
POLYONE CORPORATION 39
MANAGEMENT’S REPORT
The management of PolyOne Corporation is responsible for preparing the consolidated financialstatements and disclosures included in this Annual Report on Form 10-K. The consolidated financialstatements and disclosures included in this Annual Report fairly present in all material respects theconsolidated financial position, results of operations, shareholders’ equity and cash flows of PolyOneCorporation as of and for the year ended December 31, 2014.
Management is responsible for establishing and maintaining disclosure controls and proceduresdesigned to ensure that the information required to be disclosed by the Company is captured andreported in a timely manner. Management has evaluated the design and operation of the Company’sdisclosure controls and procedures at December 31, 2014 and found them to be effective.
Management is also responsible for establishing and maintaining a system of internal control overfinancial reporting that is designed to provide reasonable assurance regarding the reliability of financialreporting and the preparation of financial statements for external purposes in accordance withgenerally accepted accounting principles. Internal control over financial reporting includes policies andprocedures that provide reasonable assurance that: PolyOne Corporation’s accounting recordsaccurately and fairly reflect the transactions and dispositions of the assets of the Company;unauthorized or improper acquisition, use or disposal of Company assets will be prevented or timelydetected; the Company’s transactions are properly recorded and reported to permit the preparation ofthe Company’s consolidated financial statements in conformity with generally accepted accountingprinciples; and the Company’s receipts and expenditures are made only in accordance withauthorizations of management and the Board of Directors of the Company.
Management has assessed the effectiveness of PolyOne’s internal control over financial reporting asof December 31, 2014 and has prepared Management’s Annual Report On Internal Control OverFinancial Reporting contained on page 79 of this Annual Report, which concludes that as ofDecember 31, 2014, PolyOne’s internal control over financial reporting is effective and that no materialweaknesses were identified.
/s/ ROBERT M. PATTERSON /s/ BRADLEY C. RICHARDSON
Robert M. Patterson Bradley C. RichardsonPresident and Chief Executive Officer Executive Vice President and Chief Financial Officer
February 13, 2015
40 POLYONE CORPORATION

REPORT OF INDEPENDENT REGISTERED PUBLIC ACCOUNTING FIRM
The Board of Directors and Shareholders of PolyOne Corporation
We have audited PolyOne Corporation’s internal control over financial reporting as of December 31,2014, based on criteria established in Internal Control-Integrated Framework issued by the Committeeof Sponsoring Organizations of the Treadway Commission (2013 framework) (the COSO criteria).PolyOne Corporation’s management is responsible for maintaining effective internal control overfinancial reporting, and for its assessment of the effectiveness of internal control over financialreporting included in the accompanying “Management’s Annual Report on Internal Control overFinancial Reporting”. Our responsibility is to express an opinion on the company’s internal control overfinancial reporting based on our audit.
We conducted our audit in accordance with the standards of the Public Company Accounting OversightBoard (United States). Those standards require that we plan and perform the audit to obtainreasonable assurance about whether effective internal control over financial reporting was maintainedin all material respects. Our audit included obtaining an understanding of internal control over financialreporting, assessing the risk that a material weakness exists, testing and evaluating the design andoperating effectiveness of internal control based on the assessed risk, and performing such otherprocedures as we considered necessary in the circumstances. We believe that our audit provides areasonable basis for our opinion.
A company’s internal control over financial reporting is a process designed to provide reasonableassurance regarding the reliability of financial reporting and the preparation of financial statements forexternal purposes in accordance with generally accepted accounting principles. A company’s internalcontrol over financial reporting includes those policies and procedures that (1) pertain to themaintenance of records that, in reasonable detail, accurately and fairly reflect the transactions anddispositions of the assets of the company; (2) provide reasonable assurance that transactions arerecorded as necessary to permit preparation of financial statements in accordance with generallyaccepted accounting principles, and that receipts and expenditures of the company are being madeonly in accordance with authorizations of management and directors of the company; and (3) providereasonable assurance regarding prevention or timely detection of unauthorized acquisition, use, ordisposition of the company’s assets that could have a material effect on the financial statements.
Because of its inherent limitations, internal control over financial reporting may not prevent or detectmisstatements. Also, projections of any evaluation of effectiveness to future periods are subject to therisk that controls may become inadequate because of changes in conditions, or that the degree ofcompliance with the policies or procedures may deteriorate.
In our opinion, PolyOne Corporation maintained, in all material respects, effective internal control overfinancial reporting as of December 31, 2014, based on the COSO criteria.
We also have audited, in accordance with the standards of the Public Company Accounting OversightBoard (United States), the consolidated balance sheets of PolyOne Corporation as of December 31,2014 and 2013, and the related consolidated statements of income, comprehensive income,shareholders’ equity and cash flows for each of the three years in the period ended December 31,2014 and our report dated February 13, 2015 expressed an unqualified opinion thereon.
/s/ Ernst & Young LLP
Cleveland, OhioFebruary 13, 2015
POLYONE CORPORATION 41
REPORT OF INDEPENDENT REGISTERED PUBLIC ACCOUNTING FIRM
The Board of Directors and Shareholders of PolyOne Corporation
We have audited the accompanying consolidated balance sheets of PolyOne Corporation as ofDecember 31, 2014 and 2013, and the related consolidated statements of income, comprehensiveincome, shareholders’ equity and cash flows for each of the three years in the period endedDecember 31, 2014. These financial statements are the responsibility of the Company’s management.Our responsibility is to express an opinion on these financial statements based on our audits.
We conducted our audits in accordance with the standards of the Public Company AccountingOversight Board (United States). Those standards require that we plan and perform the audit to obtainreasonable assurance about whether the financial statements are free of material misstatement. Anaudit also includes examining, on a test basis, evidence supporting the amounts and disclosures in thefinancial statements. An audit also includes assessing the accounting principles used and significantestimates made by management, as well as evaluating the overall financial statement presentation.We believe that our audits provide a reasonable basis for our opinion.
In our opinion, the financial statements referred to above present fairly, in all material respects, theconsolidated financial position of PolyOne Corporation at December 31, 2014 and 2013, and theconsolidated results of its operations and its cash flows for each of the three years in the period endedDecember 31, 2014, in conformity with U.S. generally accepted accounting principles.
We also have audited, in accordance with the standards of the Public Company Accounting OversightBoard (United States), PolyOne Corporation’s internal control over financial reporting as ofDecember 31, 2014, based on criteria established in Internal Control-Integrated Framework issued bythe Committee of Sponsoring Organizations of the Treadway Commission (2013 framework) and ourreport dated February 13, 2015 expressed an unqualified opinion thereon.
/s/ Ernst & Young LLP
Cleveland, OhioFebruary 13, 2015
42 POLYONE CORPORATION

Consolidated Statements of Income
Year Ended December 31,
(In millions, except per share data) 2014 2013 2012
Sales $ 3,835.5 $ 3,771.2 $ 2,860.8Cost of sales 3,127.6 3,109.0 2,329.7
Gross margin 707.9 662.2 531.1Selling and administrative expense 552.8 457.6 417.0Income related to previously owned equity affiliates — 26.9 23.4
Operating income 155.1 231.5 137.5Interest expense, net (62.2) (63.5) (50.8)
Debt extinguishment costs — (15.8) —Other expense, net (4.5) (1.2) (3.4)
Income from continuing operations, before income taxes 88.4 151.0 83.3Income tax expense (11.2) (58.1) (30.1)
Net income from continuing operations 77.2 92.9 53.2Income from discontinued operations, net of income taxes 1.2 149.8 18.6
Net income 78.4 242.7 71.8Net loss attributable to noncontrolling interests 0.8 1.1 0.1
Net income attributable to PolyOne common shareholders $ 79.2 $ 243.8 $ 71.9
Earnings per share attributable to PolyOne common shareholders — basic:Continuing operations $ 0.85 $ 0.98 $ 0.60Discontinued operations 0.01 1.57 0.21
Total $ 0.86 $ 2.55 $ 0.81
Earnings per share attributable to PolyOne common shareholders — diluted:Continuing operations $ 0.83 $ 0.97 $ 0.59Discontinued operations 0.02 1.56 0.21
Total $ 0.85 $ 2.53 $ 0.80
Cash dividends declared per common share $ 0.34 $ 0.26 $ 0.20
Weighted-average number of common shares outstanding:Basic 92.3 95.5 89.1Diluted 93.5 96.5 89.8
The accompanying notes to the consolidated financial statements are an integral part of these statements.
POLYONE CORPORATION 43
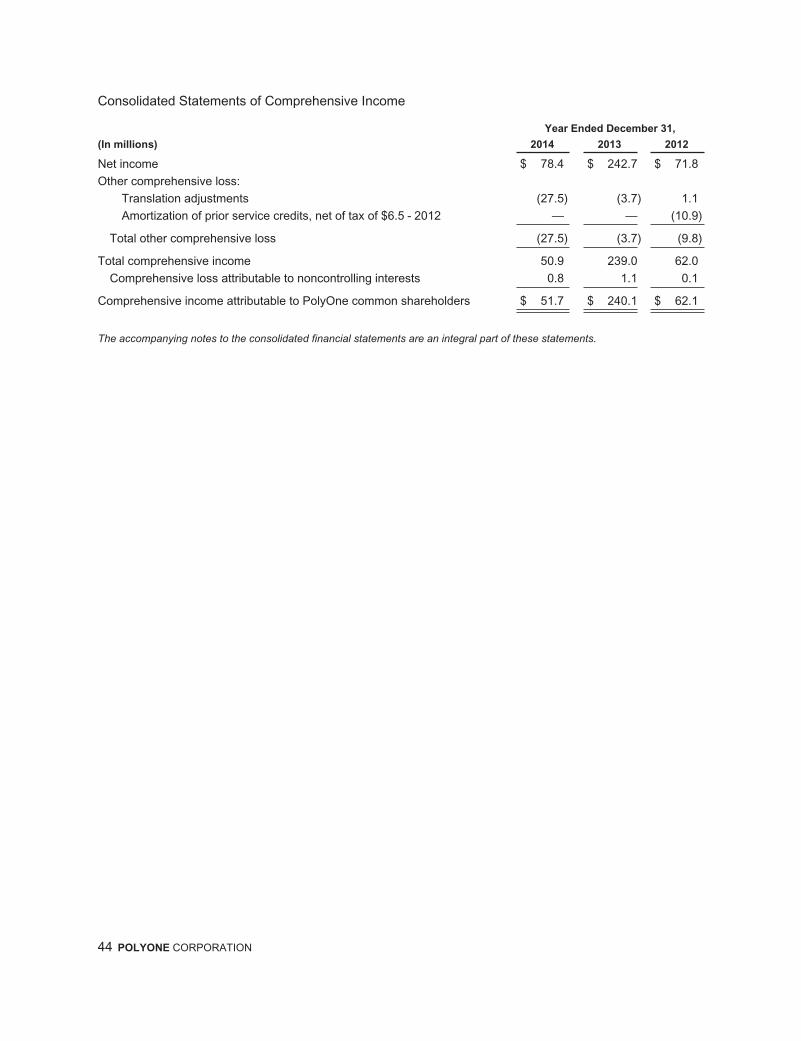
Consolidated Statements of Comprehensive Income
Year Ended December 31,
(In millions) 2014 2013 2012
Net income $ 78.4 $ 242.7 $ 71.8
Other comprehensive loss:
Translation adjustments (27.5) (3.7) 1.1
Amortization of prior service credits, net of tax of $6.5 - 2012 — — (10.9)
Total other comprehensive loss (27.5) (3.7) (9.8)
Total comprehensive income 50.9 239.0 62.0
Comprehensive loss attributable to noncontrolling interests 0.8 1.1 0.1
Comprehensive income attributable to PolyOne common shareholders $ 51.7 $ 240.1 $ 62.1
The accompanying notes to the consolidated financial statements are an integral part of these statements.
44 POLYONE CORPORATION

Consolidated Balance Sheets
Year Ended December 31,
(In millions, except par value per share) 2014 2013
ASSETS
Current assets:
Cash and cash equivalents $ 238.6 $ 365.2
Accounts receivable, net 396.8 428.0
Inventories, net 309.0 342.5
Other current assets 98.3 117.9
Total current assets 1,042.7 1,253.6
Property, net 596.7 646.2
Goodwill 590.6 559.0
Intangible assets, net 362.7 365.8
Other non-current assets 118.5 119.5
Total assets $ 2,711.2 $ 2,944.1
LIABILITIES AND SHAREHOLDERS’ EQUITY
Current liabilities:
Short-term and current portion of long-term debt $ 61.8 $ 12.7
Accounts payable 365.9 386.9
Accrued expenses and other liabilities 173.5 209.3
Total current liabilities 601.2 608.9
Long-term debt 962.0 976.2
Pension and other post-retirement benefits 103.7 77.3
Deferred income taxes 88.8 133.8
Other non-current liabilities 178.3 169.4
Total non-current liabilities 1,332.8 1,356.7
SHAREHOLDERS’ EQUITY
Preferred stock, 40.0 shares authorized, no shares issued — —
Common Shares, $0.01 par, 400.0 shares authorized, 122.2 shares issued 1.2 1.2
Additional paid-in capital 1,155.4 1,149.8
Retained earnings 259.7 211.6
Common shares held in treasury, at cost, 32.9 shares in 2014 and 27.1 shares in2013 (597.7) (371.0)
Accumulated other comprehensive loss (42.3) (14.8)
Total PolyOne shareholders’ equity 776.3 976.8
Noncontrolling interest 0.9 1.7
Total equity 777.2 978.5
Total liabilities and equity $ 2,711.2 $ 2,944.1
The accompanying notes to the consolidated financial statements are an integral part of these statements.
POLYONE CORPORATION 45

Consolidated Statements of Cash Flows
Year Ended December 31,
(In millions) 2014 2013 2012
Operating activities
Net income $ 78.4 $ 242.7 $ 71.8Adjustments to reconcile net income to net cash provided by operating activities:
Depreciation and amortization 123.9 109.8 69.8Deferred income tax provision (45.2) 12.9 13.4Debt extinguishment costs — 15.8 —Provision for doubtful accounts 0.4 0.2 0.3Stock compensation expense 14.2 16.5 10.4Gain on sale of business (1.2) (223.7) —Income related to previously owned equity affiliates — (26.9) (23.4)
Changes in assets and liabilities, net of the effect of acquisitions anddivestitures:Decrease in accounts receivable 24.4 26.9 1.2Decrease (increase) in inventories 28.4 20.4 (3.0)(Decrease) increase in accounts payable (15.2) (16.6) 16.8Increase (decrease) in pension and other post-retirement benefits 30.0 (124.5) (41.7)(Decrease) increase in accrued expenses and other assets and liabilities (29.7) 55.5 (8.7)
Net cash provided by operating activities 208.4 109.0 106.9Investing activities
Capital expenditures (92.8) (76.4) (57.4)Business acquisitions, net of cash acquired (47.2) (259.4) (33.8)Proceeds from sale of businesses and other assets 28.2 275.7 18.9
Net cash used by investing activities (111.8) (60.1) (72.3)Financing activities
Repayment of long-term debt (8.0) (343.3) (3.0)Premium on early extinguishment of long-term debt — (4.6) —Proceeds from long-term debt — 600.0 —Debt financing costs — (13.0) —Borrowing under credit facilities 168.6 129.0 0.8Repayment under credit facilities (122.8) (117.5) —Purchase of common shares for treasury (233.2) (131.6) (15.9)Exercise of stock awards 6.9 7.3 15.1Cash dividends paid (29.9) (21.5) (16.9)Proceeds from noncontrolling interests — — 2.4
Net cash (used) provided by financing activities (218.4) 104.8 (17.5)Effect of exchange rate changes on cash (4.8) 1.5 1.0
(Decrease) increase in cash and cash equivalents (126.6) 155.2 18.1Cash and cash equivalents at beginning of year 365.2 210.0 191.9
Cash and cash equivalents at end of year $ 238.6 $ 365.2 $ 210.0
The accompanying notes to the consolidated financial statements are an integral part of these statements.
46 POLYONE CORPORATION

Consolidated Statements of Shareholders’ Equity
Common Shares Shareholders’ Equity
(In millions)CommonShares
CommonShares
Heldin
TreasuryCommonShares
AdditionalPaid-inCapital
RetainedEarnings(Deficit)
CommonShares
Heldin
Treasury
AccumulatedOther
Comprehensive(Loss)
TotalPolyOne
shareholders’equity
Non-controllingInterests
Totalequity
Balance atJanuary 1, 2012 122.2 (33.4) $ 1.2 $ 1,042.7 $ (84.9) $ (369.4) $ (1.3) $ 588.3 — $ 588.3
Net income (loss) 71.9 71.9 (0.1) 71.8
Other comprehensiveincome (loss) (9.8) (9.8) (9.8)
Noncontrolling interestactivity 2.4 2.4
Cash dividendsdeclared (17.8) (17.8) (17.8)
Repurchase ofcommon shares (1.2) (15.9) (15.9) (15.9)
Stock-basedcompensation andexercise of awards 1.9 (8.8) 21.2 12.4 12.4
Balance atDecember 31, 2012 122.2 (32.7) $ 1.2 $ 1,016.1 $ (13.0) $ (364.1) $ (11.1) $ 629.1 $ 2.3 $ 631.4
Net income (loss) 243.8 243.8 (1.1) 242.7
Other comprehensiveincome (loss) (3.7) (3.7) (3.7)
Noncontrolling interestactivity 0.5 0.5
Shares issued inconnection withacquisitions 10.0 136.6 117.2 253.8 253.8
Cash dividendsdeclared (5.4) (19.2) (24.6) (24.6)
Repurchase ofcommon shares (5.0) (131.6) (131.6) (131.6)
Stock-basedcompensation andexercise of awards 0.6 2.5 7.5 10.0 10.0
Balance atDecember 31, 2013 122.2 (27.1) $ 1.2 $ 1,149.8 $ 211.6 $ (371.0) $ (14.8) $ 976.8 $ 1.7 $ 978.5
Net income (loss) 79.2 79.2 (0.8) 78.4
Other comprehensiveincome (loss) (27.5) (27.5) (27.5)
Cash dividendsdeclared (31.1) (31.1) (31.1)
Repurchase ofcommon shares (6.3) (233.2) (233.2) (233.2)
Stock-basedcompensation andexercise of awards 0.5 5.6 6.5 12.1 12.1
Balance atDecember 31, 2014 122.2 (32.9) $ 1.2 $ 1,155.4 $ 259.7 $ (597.7) $ (42.3) $ 776.3 $ 0.9 $ 777.2
The accompanying notes to the consolidated financial statements are an integral part of these statements.
POLYONE CORPORATION 47

NOTES TO CONSOLIDATED FINANCIAL STATEMENTS
Note 1 — DESCRIPTION OF BUSINESS AND SUMMARY OF SIGNIFICANT ACCOUNTING POLICIES
Description of Business
We are a premier provider of specialized polymer materials, services and solutions with operations inspecialty polymer formulations, color and additive systems, plastic sheet and packaging solutions, andpolymer distribution. We are also a highly specialized developer and manufacturer of performanceenhancing additives, liquid colorants, and fluoropolymer and silicone colorants. Headquartered in AvonLake, Ohio, we have employees at manufacturing sites and distribution facilities in North America,South America, Europe, Asia and Africa. We provide value to our customers through our ability to linkour knowledge of polymers and formulation technology with our manufacturing and supply chain toprovide value added solutions to designers, assemblers and processors of plastics (our customers).When used in this Annual Report on Form 10-K, the terms “we,” “us,” “our”, “PolyOne” and the“Company” mean PolyOne Corporation and its consolidated subsidiaries.
Our operations are located primarily in North America, Europe, Asia and Brazil. Our operations arereported in five reportable segments: Global Color, Additives and Inks; Global Specialty EngineeredMaterials; Designed Structures and Solutions; Performance Products and Solutions; and PolyOneDistribution. See Note 16, Segment Information, for more information.
On December 1, 2014, the Company completed the acquisition of specialty assets of AccellaPerformance Materials (Accella), a leading North American manufacturer of liquid polymerformulations. The Accella acquisition expands PolyOne’s specialty portfolio and provides specialtycoatings solutions and value-added services in a wide range of applications, including consumerproducts, interior and under-the-hood automotive parts, outdoor recreational equipment and foodpackaging.
Accounting Standards Not Yet Adopted
In April 2014, the FASB issued ASU No. 2014-08, “Presentation of Financial Statements and Property,Plant, and Equipment,” which revises what qualifies as a discontinued operation, changes the criteriafor determining which disposals can be presented as discontinued operations and modifies relateddisclosure requirements. This ASU will be effective for the Company for applicable transactionsoccurring after January 1, 2015. We will prospectively apply the guidance to applicable transactions.
In May 2014, the Financial Accounting Standards Board issued Auditing Standards Update 2014-09,“Revenue from Contracts with Customers” (ASU 2014-09). Under this standard, a company recognizesrevenue when it transfers promised goods or services to customers in an amount that reflects theconsideration to which the company expects to be entitled in exchange for those goods or services.The standard implements a five-step process for customer contract revenue recognition that focuseson transfer of control. It will be effective for us beginning January 1, 2017, with early adoption notpermitted. Entities can transition to the standard either retrospectively or as a cumulative-effectadjustment as of the date of adoption. We are currently assessing the impact this standard will have onour consolidated financial statements as well as the method by which we will adopt the new standard.
Consolidation and Basis of Presentation
The consolidated financial statements include the accounts of PolyOne and its subsidiaries. Allmajority-owned affiliates over which we have control are consolidated. Transactions with relatedparties, including joint ventures, are in the ordinary course of business.
Reclassifications
Certain reclassifications of the prior period amounts and presentation have been made to conform tothe presentation for the current period.
48 POLYONE CORPORATION

Use of Estimates
Preparation of financial statements in conformity with accounting principles generally accepted in theUnited States requires management to make estimates and assumptions in certain circumstances thataffect amounts reported in the accompanying consolidated financial statements and notes. Actualresults could differ from these estimates.
Cash and Cash Equivalents
We consider all highly liquid investments purchased with a maturity of less than three months to becash equivalents. Cash equivalents are stated at cost, which approximates fair value.
Allowance for Doubtful Accounts
We evaluate the collectability of receivables based on a combination of factors. We regularly analyzesignificant customer accounts and, when we become aware of a specific customer’s inability to meet itsfinancial obligations to us, such as in the case of a bankruptcy filing or deterioration in the customer’soperating results or financial position, we record a specific allowance for bad debt to reduce the relatedreceivable to the amount we reasonably believe is collectible. We also record bad debt allowances forall other customers based on a variety of factors including the length of time the receivables are pastdue, the financial health of the customer, economic conditions and historical experience. In estimatingthe allowances, we take into consideration the existence of credit insurance. If circumstances related tospecific customers change, our estimates of the recoverability of receivables could be adjusted further.Accounts receivable balances are written off against the allowance for doubtful accounts after a finaldetermination of uncollectability has been made.
Inventories
External purchases of raw materials and finished goods are valued at weighted average cost.Manufactured finished goods are stated at the lower of cost or market using the first-in, first-out (FIFO)method.
Long-lived Assets
Property, plant and equipment is carried at cost, net of depreciation and amortization that is computedusing the straight-line method over the estimated useful lives of the assets, which generally rangesfrom 3 to 15 years for machinery and equipment and up to 40 years for buildings. During 2013 and2014, we depreciated certain assets associated with closing manufacturing locations over a shortenedlife (through a cease-use date). Software is amortized over periods not exceeding 10 years. Property,plant and equipment is generally depreciated on accelerated methods for income tax purposes. Weexpense repair and maintenance costs as incurred. We capitalize replacements and betterments thatincrease the estimated useful life of an asset.
We retain fully depreciated assets in property and accumulated depreciation accounts until we removethem from service. In the case of sale, retirement or disposal, the asset cost and related accumulateddepreciation balance is removed from the respective account, and the resulting net amount, less anyproceeds, is included as a component of income from continuing operations in the accompanyingConsolidated Statements of Income.
We account for operating leases under the provisions of Financial Accounting Standards Board (FASB)Accounting Standards Codification (ASC) Topic 840, Leases.
Finite-lived intangible assets, which consist primarily of customer relationships, patents and technologyare amortized over their estimated useful lives. The remaining useful lives range up to 22 years.
We assess the recoverability of long-lived assets when events or changes in circumstances indicatethat we may not be able to recover the assets’ carrying amount. We measure the recoverability of
POLYONE CORPORATION 49

assets to be held and used by a comparison of the carrying amount of the asset to the expected futureundiscounted cash flows associated with the asset. We measure the amount of impairment of long-lived assets as the amount by which the carrying value of the asset exceeds the fair value of the asset,which is generally determined based on projected discounted future cash flows or appraised values.
Goodwill and Indefinite Lived Intangible Assets
Goodwill is the excess of the purchase price paid over the fair value of the net assets of the acquiredbusiness. Goodwill is tested for impairment at the reporting unit level. Our reporting units have beenidentified at the operating segment level, or in some cases, one level below the operating segmentlevel. Goodwill is allocated to the reporting units based on the estimated fair value at the date ofacquisition.
Our annual measurement date for testing impairment of goodwill and other indefinite-lived intangiblesis October 1st. We completed our testing of impairment as of October 1, noting no impairment in 2014,2013 or 2012. The future occurrence of a potential indicator of impairment would require an interimassessment for some or all of the reporting units prior to the next required annual assessment onOctober 1, 2015. Refer to Note 19, Fair Value, for further discussion of our approach for assessing thefair value of goodwill.
Litigation Reserves
FASB ASC Topic 450, Contingencies, requires that we accrue for loss contingencies associated withoutstanding litigation, claims and assessments for which management has determined it is probablethat a loss contingency exists and the amount of loss can be reasonably estimated. We recordexpense associated with professional fees related to litigation claims and assessments as incurred.Refer to Note 13, Commitments and Contingencies, for further information.
Derivative Financial Instruments
FASB ASC Topic 815, Derivative and Hedging, requires that all derivative financial instruments, suchas foreign exchange contracts, be recognized in the financial statements and measured at fair value,regardless of the purpose or intent in holding them.
We are exposed to foreign currency changes in the normal course of business. We have establishedpolicies and procedures that manage this exposure through the use of financial instruments. By policy,we do not enter into these instruments for trading purposes or speculation. These instruments are notdesignated as hedges and, as a result, are adjusted to fair value, with the resulting gains and lossesrecognized in the accompanying Consolidated Statements of Income immediately.
Pension and Other Post-retirement Plans
We account for our pensions and other post-retirement benefits in accordance with FASB ASC Topic715, Compensation — Retirement Benefits. This standard requires us to (1) recognize the fundedstatus of the benefit plans in our Consolidated Balance Sheet, (2) recognize, as a component of othercomprehensive income or net periodic benefit cost, the gains or losses and prior service costs orcredits that arise during the period and (3) measure defined benefit plan assets and obligations as ofDecember 31. We immediately recognize actuarial gains and losses in our operating results in the yearin which the gains or losses occur. Refer to Note 12, Employee Benefit Plans, for more information.
50 POLYONE CORPORATION
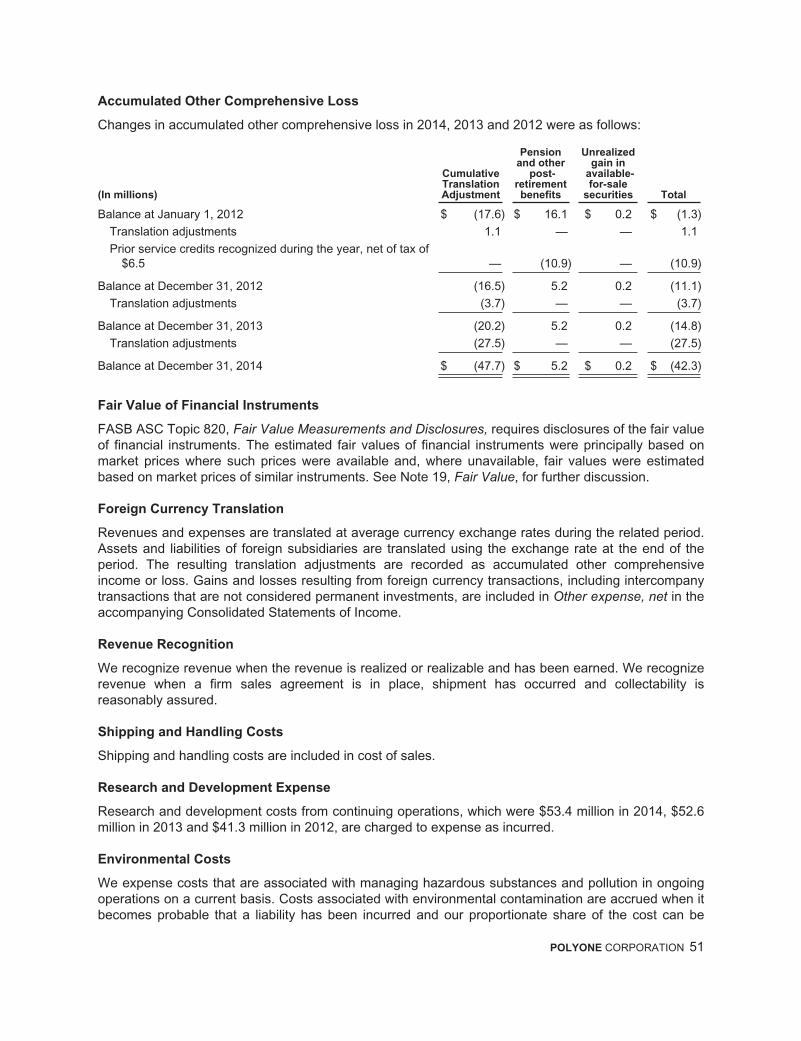
Accumulated Other Comprehensive Loss
Changes in accumulated other comprehensive loss in 2014, 2013 and 2012 were as follows:
(In millions)
CumulativeTranslationAdjustment
Pensionand other
post-retirementbenefits
Unrealizedgain in
available-for-sale
securities Total
Balance at January 1, 2012 $ (17.6) $ 16.1 $ 0.2 $ (1.3)
Translation adjustments 1.1 — — 1.1
Prior service credits recognized during the year, net of tax of$6.5 — (10.9) — (10.9)
Balance at December 31, 2012 (16.5) 5.2 0.2 (11.1)
Translation adjustments (3.7) — — (3.7)
Balance at December 31, 2013 (20.2) 5.2 0.2 (14.8)
Translation adjustments (27.5) — — (27.5)
Balance at December 31, 2014 $ (47.7) $ 5.2 $ 0.2 $ (42.3)
Fair Value of Financial Instruments
FASB ASC Topic 820, Fair Value Measurements and Disclosures, requires disclosures of the fair valueof financial instruments. The estimated fair values of financial instruments were principally based onmarket prices where such prices were available and, where unavailable, fair values were estimatedbased on market prices of similar instruments. See Note 19, Fair Value, for further discussion.
Foreign Currency Translation
Revenues and expenses are translated at average currency exchange rates during the related period.Assets and liabilities of foreign subsidiaries are translated using the exchange rate at the end of theperiod. The resulting translation adjustments are recorded as accumulated other comprehensiveincome or loss. Gains and losses resulting from foreign currency transactions, including intercompanytransactions that are not considered permanent investments, are included in Other expense, net in theaccompanying Consolidated Statements of Income.
Revenue Recognition
We recognize revenue when the revenue is realized or realizable and has been earned. We recognizerevenue when a firm sales agreement is in place, shipment has occurred and collectability isreasonably assured.
Shipping and Handling Costs
Shipping and handling costs are included in cost of sales.
Research and Development Expense
Research and development costs from continuing operations, which were $53.4 million in 2014, $52.6million in 2013 and $41.3 million in 2012, are charged to expense as incurred.
Environmental Costs
We expense costs that are associated with managing hazardous substances and pollution in ongoingoperations on a current basis. Costs associated with environmental contamination are accrued when itbecomes probable that a liability has been incurred and our proportionate share of the cost can be
POLYONE CORPORATION 51
reasonably estimated. Any such provision is recognized using the Company’s best estimate of theamount of loss incurred, or at the lower end of an estimated range, when a single best estimate is notdeterminable. In some cases, the Company may be able to recover a portion of the costs relating tothese obligations from insurers or other third parties; however, the Company records such amountsonly when it is probable that they will be collected.
Share-Based Compensation
We account for share-based compensation under the provisions of FASB ASC Topic 718,Compensation — Stock Compensation, which requires us to estimate the fair value of share-basedawards on the date of grant. The value of the portion of the award that is ultimately expected to vest isrecognized as expense over the requisite service periods in the accompanying ConsolidatedStatements of Income. As of December 31, 2014, we had one active share-based employeecompensation plan, which is described more fully in Note 15, Share-Based Compensation.
Income Taxes
Deferred income tax liabilities and assets are determined based upon the differences between thefinancial reporting and tax basis of assets and liabilities and are measured using the tax rate and lawscurrently in effect. In accordance with FASB ASC Topic 740, Income Taxes, we evaluate our deferredincome taxes to determine whether a valuation allowance should be established against the deferredtax assets or whether the valuation allowance should be reduced based on consideration of allavailable evidence, both positive and negative, using a “more likely than not” standard.
Note 2 — BUSINESS COMBINATIONS
Accella Performance Materials
On December 1, 2014, the Company completed the acquisition of specialty assets of AccellaPerformance Materials (Accella), a leading North American manufacturer of liquid polymerformulations, for approximately $47.2 million in cash, net of cash acquired. The results of operations ofAccella were included in the Company’s Consolidated Statements of Income for the period subsequentto the date of the acquisition and are reported in the Global Color, Additives and Inks segment. Theacquisition resulted in preliminary goodwill and intangible assets of $40.5 million. Goodwill recognizedas a result of this acquisition is deductible for tax purposes. As of December 31, 2014, the entirepurchase price allocation is preliminary.
Spartech Corporation
On March 13, 2013, PolyOne acquired Spartech Corporation (Spartech), a supplier of sustainableplastic sheet, color and engineered materials, and packaging solutions, based in Clayton, Missouri,with fiscal 2012 sales of $1,149.4 million and net income from continuing operations of $2.7 million.
At the effective time of the merger, each issued and outstanding share of Spartech common shareswas canceled and converted into the right to receive consideration equal to $2.67 in cash and 0.3167shares of PolyOne common shares. PolyOne paid $83.4 million in cash and issued approximately10.0 million shares of its common shares to Spartech’s stockholders. PolyOne funded the cash portionof the consideration, and the repayment of certain portions of Spartech’s debt, with a portion of the netproceeds of its issuance of 5.25% senior notes due 2023, discussed in Note 6, FinancingArrangements.
The acquisition of Spartech has provided substantial synergies through enhanced operational costefficiencies and has expanded PolyOne’s specialty portfolio. By combining Spartech’s leading marketpositions in sheet, rigid barrier packaging and specialty cast acrylics with PolyOne’s capabilities, wehave been better able serve our customers and accelerate growth.
52 POLYONE CORPORATION
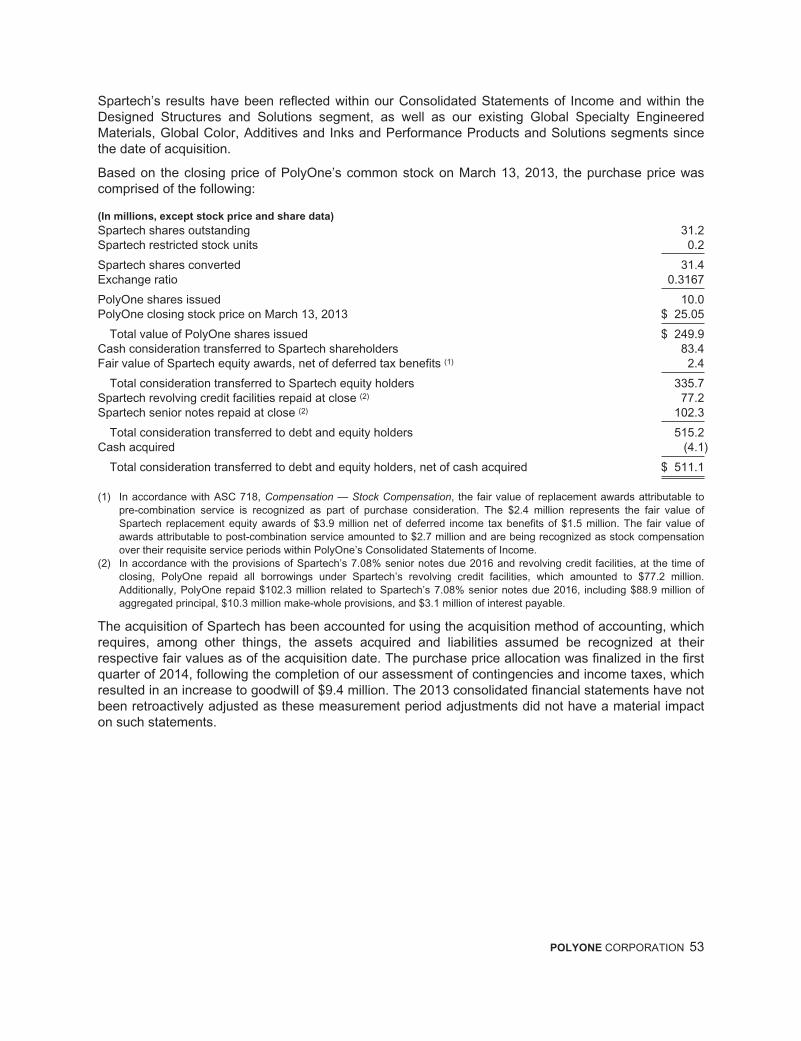
Spartech’s results have been reflected within our Consolidated Statements of Income and within theDesigned Structures and Solutions segment, as well as our existing Global Specialty EngineeredMaterials, Global Color, Additives and Inks and Performance Products and Solutions segments sincethe date of acquisition.
Based on the closing price of PolyOne’s common stock on March 13, 2013, the purchase price wascomprised of the following:
(In millions, except stock price and share data)
Spartech shares outstanding 31.2Spartech restricted stock units 0.2
Spartech shares converted 31.4Exchange ratio 0.3167
PolyOne shares issued 10.0PolyOne closing stock price on March 13, 2013 $ 25.05
Total value of PolyOne shares issued $ 249.9Cash consideration transferred to Spartech shareholders 83.4Fair value of Spartech equity awards, net of deferred tax benefits (1) 2.4
Total consideration transferred to Spartech equity holders 335.7Spartech revolving credit facilities repaid at close (2) 77.2Spartech senior notes repaid at close (2) 102.3
Total consideration transferred to debt and equity holders 515.2Cash acquired (4.1)
Total consideration transferred to debt and equity holders, net of cash acquired $ 511.1
(1) In accordance with ASC 718, Compensation — Stock Compensation, the fair value of replacement awards attributable topre-combination service is recognized as part of purchase consideration. The $2.4 million represents the fair value ofSpartech replacement equity awards of $3.9 million net of deferred income tax benefits of $1.5 million. The fair value ofawards attributable to post-combination service amounted to $2.7 million and are being recognized as stock compensationover their requisite service periods within PolyOne’s Consolidated Statements of Income.
(2) In accordance with the provisions of Spartech’s 7.08% senior notes due 2016 and revolving credit facilities, at the time ofclosing, PolyOne repaid all borrowings under Spartech’s revolving credit facilities, which amounted to $77.2 million.Additionally, PolyOne repaid $102.3 million related to Spartech’s 7.08% senior notes due 2016, including $88.9 million ofaggregated principal, $10.3 million make-whole provisions, and $3.1 million of interest payable.
The acquisition of Spartech has been accounted for using the acquisition method of accounting, whichrequires, among other things, the assets acquired and liabilities assumed be recognized at theirrespective fair values as of the acquisition date. The purchase price allocation was finalized in the firstquarter of 2014, following the completion of our assessment of contingencies and income taxes, whichresulted in an increase to goodwill of $9.4 million. The 2013 consolidated financial statements have notbeen retroactively adjusted as these measurement period adjustments did not have a material impacton such statements.
POLYONE CORPORATION 53

The following table summarizes PolyOne’s final fair value estimates at the acquisition date:
(In millions)Final
allocation
Accounts receivable $139.7Inventories 114.4Other current assets 18.6Property 280.3Other non-current assets 19.6Intangible assets 44.6Goodwill 162.6
Total assets acquired 779.8Short-term and current portion of long-term debt 0.5Accounts payable 105.0Accrued expenses and other liabilities 43.1Long-term debt 11.0Other non-current liabilities 109.1
Total liabilities assumed 268.7
Net assets acquired $511.1
Goodwill is calculated as the excess of the consideration transferred over the assets acquired, andrepresents the estimated future economic benefits arising from other assets acquired that could not beindividually identified and separately recognized. Goodwill has been allocated to the DesignedStructures and Solutions, Global Color, Additives and Inks and Performance Products and Solutionssegments. Goodwill recognized as a result of this acquisition is not deductible for tax purposes. SeeNote 3, Goodwill and Intangible Assets, for information about goodwill and intangible assets.
The following unaudited pro forma information of PolyOne for the years ended December 31, 2013 and2012 includes Spartech’s operating results for the respective periods, as if the acquisition and relatedfinancing occurred on January 1, 2012. The following pro forma financial information is not necessarilyindicative of the results of operations as they would have been had the transaction occurred on theassumed date, nor is it necessarily an indication of trends in future results for a number of reasons,including, but not limited to, differences between the assumptions used to prepare the pro formainformation, cost savings from operating efficiencies, potential synergies, and the impact of incrementalcosts incurred in integrating the businesses.
Year Ended December 31,
(In millions) Pro Forma 2013 Pro Forma 2012
Sales $3,989.2 $4,006.9Net income from continuing operations $ 94.7 $ 56.5
The unaudited pro forma financial information presented in the table above has been adjusted to giveeffect to adjustments that are: (1) directly related to the business combination; (2) factuallysupportable; and (3) expected to have a continuing impact. These adjustments include, but are notlimited to, depreciation and amortization related to fair value adjustments to property, plant andequipment and intangible assets, and interest expense on acquisition-related debt.
In 2013, we incurred acquisition-related costs totaling of $7.6 million which have been included withinselling and administrative expense in our Consolidated Statements of Income.
Glasforms
On December 19, 2012, PolyOne acquired all of the outstanding equity of Glasforms Inc. (Glasforms),a leading manufacturer of glass and carbon fiber reinforced polymers and advanced compositeproducts, with 2012 annual sales of $51.1 million. The purchase marks PolyOne’s entry into advanced
54 POLYONE CORPORATION
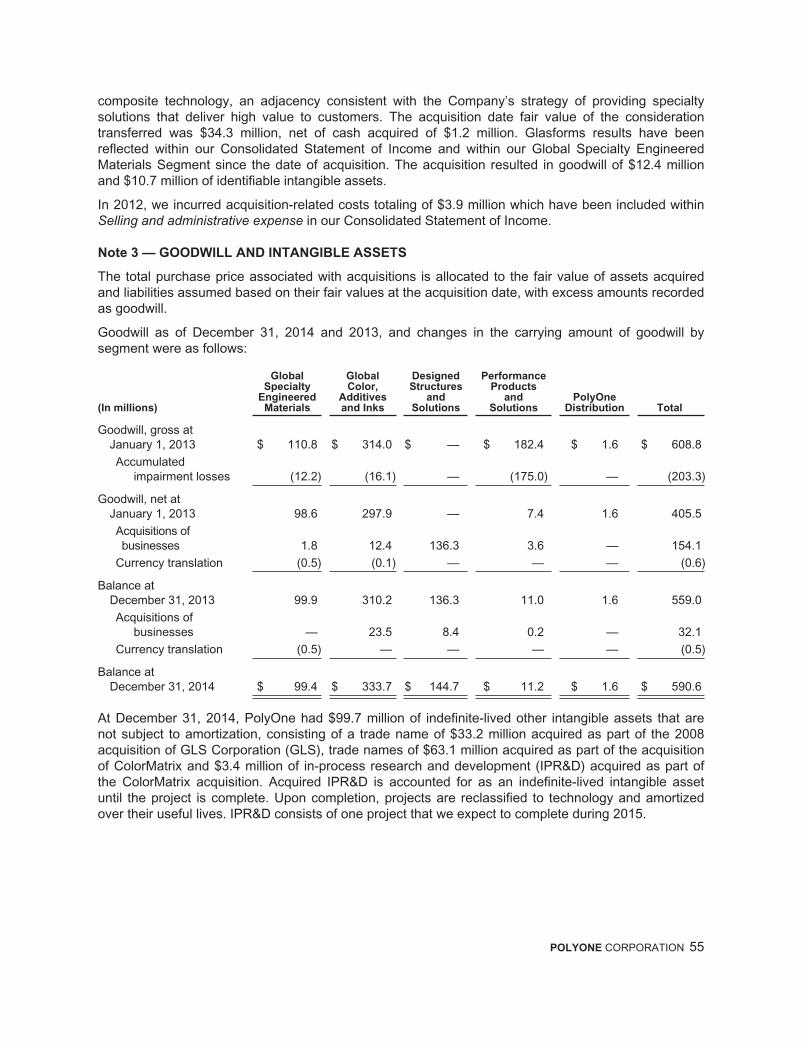
composite technology, an adjacency consistent with the Company’s strategy of providing specialtysolutions that deliver high value to customers. The acquisition date fair value of the considerationtransferred was $34.3 million, net of cash acquired of $1.2 million. Glasforms results have beenreflected within our Consolidated Statement of Income and within our Global Specialty EngineeredMaterials Segment since the date of acquisition. The acquisition resulted in goodwill of $12.4 millionand $10.7 million of identifiable intangible assets.
In 2012, we incurred acquisition-related costs totaling of $3.9 million which have been included withinSelling and administrative expense in our Consolidated Statement of Income.
Note 3 — GOODWILL AND INTANGIBLE ASSETS
The total purchase price associated with acquisitions is allocated to the fair value of assets acquiredand liabilities assumed based on their fair values at the acquisition date, with excess amounts recordedas goodwill.
Goodwill as of December 31, 2014 and 2013, and changes in the carrying amount of goodwill bysegment were as follows:
(In millions)
GlobalSpecialty
EngineeredMaterials
GlobalColor,
Additivesand Inks
DesignedStructures
andSolutions
PerformanceProducts
andSolutions
PolyOneDistribution Total
Goodwill, gross atJanuary 1, 2013 $ 110.8 $ 314.0 $ — $ 182.4 $ 1.6 $ 608.8
Accumulatedimpairment losses (12.2) (16.1) — (175.0) — (203.3)
Goodwill, net atJanuary 1, 2013 98.6 297.9 — 7.4 1.6 405.5
Acquisitions ofbusinesses 1.8 12.4 136.3 3.6 — 154.1
Currency translation (0.5) (0.1) — — — (0.6)
Balance atDecember 31, 2013 99.9 310.2 136.3 11.0 1.6 559.0
Acquisitions ofbusinesses — 23.5 8.4 0.2 — 32.1
Currency translation (0.5) — — — — (0.5)
Balance atDecember 31, 2014 $ 99.4 $ 333.7 $ 144.7 $ 11.2 $ 1.6 $ 590.6
At December 31, 2014, PolyOne had $99.7 million of indefinite-lived other intangible assets that arenot subject to amortization, consisting of a trade name of $33.2 million acquired as part of the 2008acquisition of GLS Corporation (GLS), trade names of $63.1 million acquired as part of the acquisitionof ColorMatrix and $3.4 million of in-process research and development (IPR&D) acquired as part ofthe ColorMatrix acquisition. Acquired IPR&D is accounted for as an indefinite-lived intangible assetuntil the project is complete. Upon completion, projects are reclassified to technology and amortizedover their useful lives. IPR&D consists of one project that we expect to complete during 2015.
POLYONE CORPORATION 55

Indefinite and finite-lived intangible assets consisted of the following:
As of December 31, 2014
(In millions)Acquisition
CostAccumulatedAmortization
CurrencyTranslation Impairment Net
Customer relationships $ 199.4 $ (32.6) $ — $ (1.3) $ 165.5
Patents, technology and other 133.4 (35.3) (0.1) (0.5) 97.5
Indefinite-lived trade names 96.3 — — — 96.3
In-process research and development 3.4 — — — 3.4
Total $ 432.5 $ (67.9) $ (0.1) $ (1.8) $ 362.7
As of December 31, 2013
(In millions)Acquisition
CostAccumulatedAmortization
CurrencyTranslation Net
Customer relationships $ 181.5 $ (24.1) $ 0.1 $ 157.5
Patents, technology and other 134.3 (25.8) 0.1 108.6
Indefinite-lived trade names 96.3 — — 96.3
In-process research and development 3.4 — — 3.4
Total $ 415.5 $ (49.9) $ 0.2 $ 365.8
Amortization of other finite-lived intangible assets for the years ended December 31, 2014, 2013 and2012 was $19.2 million, $17.8 million and $13.2 million, respectively.
As of December 31, 2014, we expect amortization expense on finite-lived intangibles for the next fiveyears as follows:
2015 2016 2017 2018 2019
Expected amortization $20.0 $20.1 $20.1 $20.1 $20.0
Note 4 — EMPLOYEE SEPARATION AND RESTRUCTURING COSTS
In 2013, PolyOne determined it would close seven former Spartech manufacturing facilities and oneadministrative office and relocate production to other PolyOne facilities. The manufacturing facilities’closings are part of the Company’s ongoing integration of Spartech, which are designed to enable theCompany to better serve customers, improve efficiency, and deliver a portion of the anticipatedsynergy-related cost savings in connection with the Spartech acquisition. In addition to these actions,PolyOne incurred severance costs related to former Spartech executives and other employees, as wellas fixed asset-related charges and other ongoing costs associated with restructuring actions that wereunderway prior to PolyOne’s acquisition of Spartech. We also incurred costs associated with furtherasset rationalization at Spartech locations that were not part of the above actions.
The Company has incurred $103.8 million of charges in connection with the Spartech actions notedabove. These costs include $26.2 million of severance, $40.9 million of asset-related charges,including accelerated depreciation, and $36.7 million of other ongoing costs. We expect to incur anadditional $15.0 million of costs related to these actions, primarily in the first half of 2015.
56 POLYONE CORPORATION
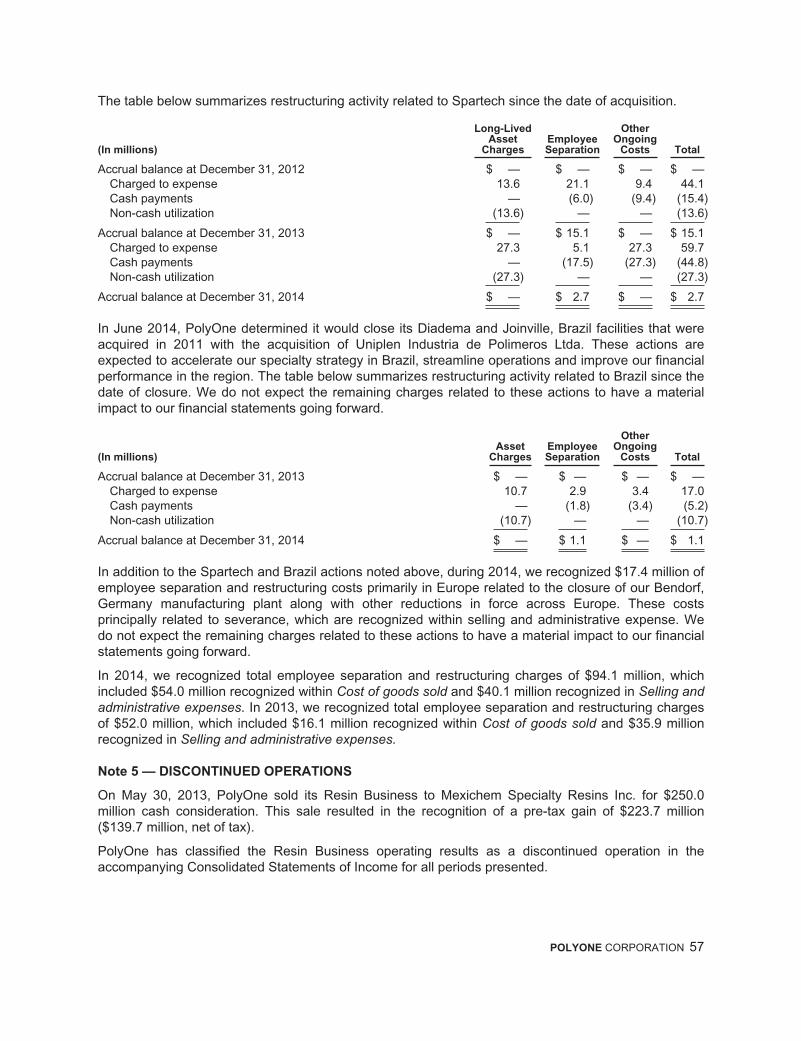
The table below summarizes restructuring activity related to Spartech since the date of acquisition.
(In millions)
Long-LivedAsset
ChargesEmployeeSeparation
OtherOngoing
Costs Total
Accrual balance at December 31, 2012 $ — $ — $ — $ —Charged to expense 13.6 21.1 9.4 44.1Cash payments — (6.0) (9.4) (15.4)Non-cash utilization (13.6) — — (13.6)
Accrual balance at December 31, 2013 $ — $ 15.1 $ — $ 15.1Charged to expense 27.3 5.1 27.3 59.7Cash payments — (17.5) (27.3) (44.8)Non-cash utilization (27.3) — — (27.3)
Accrual balance at December 31, 2014 $ — $ 2.7 $ — $ 2.7
In June 2014, PolyOne determined it would close its Diadema and Joinville, Brazil facilities that wereacquired in 2011 with the acquisition of Uniplen Industria de Polimeros Ltda. These actions areexpected to accelerate our specialty strategy in Brazil, streamline operations and improve our financialperformance in the region. The table below summarizes restructuring activity related to Brazil since thedate of closure. We do not expect the remaining charges related to these actions to have a materialimpact to our financial statements going forward.
(In millions)Asset
ChargesEmployeeSeparation
OtherOngoing
Costs Total
Accrual balance at December 31, 2013 $ — $ — $ — $ —Charged to expense 10.7 2.9 3.4 17.0Cash payments — (1.8) (3.4) (5.2)Non-cash utilization (10.7) — — (10.7)
Accrual balance at December 31, 2014 $ — $ 1.1 $ — $ 1.1
In addition to the Spartech and Brazil actions noted above, during 2014, we recognized $17.4 million ofemployee separation and restructuring costs primarily in Europe related to the closure of our Bendorf,Germany manufacturing plant along with other reductions in force across Europe. These costsprincipally related to severance, which are recognized within selling and administrative expense. Wedo not expect the remaining charges related to these actions to have a material impact to our financialstatements going forward.
In 2014, we recognized total employee separation and restructuring charges of $94.1 million, whichincluded $54.0 million recognized within Cost of goods sold and $40.1 million recognized in Selling andadministrative expenses. In 2013, we recognized total employee separation and restructuring chargesof $52.0 million, which included $16.1 million recognized within Cost of goods sold and $35.9 millionrecognized in Selling and administrative expenses.
Note 5 — DISCONTINUED OPERATIONS
On May 30, 2013, PolyOne sold its Resin Business to Mexichem Specialty Resins Inc. for $250.0million cash consideration. This sale resulted in the recognition of a pre-tax gain of $223.7 million($139.7 million, net of tax).
PolyOne has classified the Resin Business operating results as a discontinued operation in theaccompanying Consolidated Statements of Income for all periods presented.
POLYONE CORPORATION 57

The Resin Business’ sales, income before income taxes and net income were as follows:
Year Ended December 31,
(In millions) 2014 2013* 2012
Sales $ — $ 55.3 $131.8Gain on sale $ — $223.7 $ —Income from operations — 12.2 29.7
Income before taxes — 235.9 29.7Income tax benefit (expense) 1.2 (86.1) (11.1)
Income from discontinued operations, net of income taxes $1.2 $149.8 $ 18.6
* Includes the Resin Business’ operating results through May 29, 2013.
Note 6 — FINANCING ARRANGEMENTS
Total debt as of December 31 consisted of the following:
(In millions)December 31,
2014December 31,
2013
7.500% debentures due 2015 $ 48.7 $ 48.7Revolving credit facility due 2018 45.0 —7.375% senior notes due 2020 316.6 316.65.250% senior notes due 2023 600.0 600.0Other debt 13.5 23.6
Total debt $ 1,023.8 $ 988.9Less short-term and current portion of long-term debt 61.8 12.7
Total long-term debt, net of current portion $ 962.0 $ 976.2
During the first quarter of 2014, we repaid an $8.0 million industrial revenue bond that was assumed asa result of the Spartech acquisition.
In 2013, we repurchased $43.4 million aggregate principal amount of our 7.375% senior notes due2020, $1.3 million aggregate principal amount of our 7.50% debentures due 2015 and $1.6 million ofother debt. Additionally, we recognized $5.2 million of debt extinguishment costs within Debtextinguishment costs in our Consolidated Statements of Income in connection with these repurchases.
On February 28, 2013, PolyOne issued $600.0 million aggregate principal amount of senior notes,which mature on March 15, 2023. The senior notes bear an interest rate of 5.25% per year, payablesemi-annually, in arrears, on March 15 and September 15 of each year, which commenced onSeptember 15, 2013. We used a portion of the net proceeds of the offering to pay the cash portion ofthe Spartech acquisition, and to repay certain Spartech debt, including the $88.9 million aggregateprincipal amount of its senior notes due 2016 and related interest and make-whole payments totaling$13.4 million and all outstanding amounts under its revolving credit facility. We also used a portion ofthese net proceeds to make a voluntary $50.0 million contribution to our U.S. qualified defined benefitplan and to repay the outstanding principal amount of $297.0 million under our senior secured termloan. We incurred debt extinguishment costs of $10.6 million related to the early retirement of oursenior secured term loan, including $8.2 million of deferred financing cost write-offs and $2.4 million ofdiscounts that were written off. These costs are presented within Debt extinguishment costs in ourConsolidated Statements of Income.
On March 1, 2013, the agreement, dated December 21, 2011, governing our $300.0 million five-yearsenior secured revolving credit facility was amended and restated. The amendment and restatementresulted in an increase in commitments of $100.0 million for a maximum borrowing facility size of$400.0 million, subject to a borrowing base with advances against certain U.S. and Canadian accounts
58 POLYONE CORPORATION

receivable and inventory. We have the option to increase the availability under the facility to $450.0million, subject to meeting certain requirements and obtaining commitments for such increase. Inconnection with the amendment and restatement, we also extended the maturity date to March 1,2018. As of December 31, 2014, we were in compliance with all covenants and there were $45.0million of outstanding borrowings under our asset-backed revolving credit facility, which had remainingavailability of $233.7 million.
The Company maintains a credit line with Saudi Hollandi Bank for $16.0 million, with an interest rateequal to the Saudi Arabia Interbank Offered Rate plus a fixed rate of 0.85%. The credit line is beingused to fund capital expenditures related to the manufacturing facility in Jeddah, Saudi Arabia and issubject to an annual renewal. As of December 31, 2014, letters of credit under the credit line were $0.2million and borrowings were $13.1 million with an interest rate of 1.85%. As of December 31, 2013,letters of credit under the credit line were $0.3 million and borrowings were $12.3 million with aninterest rate of 1.85%. As of December 31, 2014 and 2013, there was remaining availability on thecredit line of $2.7 million and $3.4 million, respectively.
During 2013, we incurred $13.0 million in debt financing related fees. These costs are included inOther current and Other non-current assets and are being amortized over the life of their respectiveagreements.
Aggregate maturities of debt for the next five years and thereafter are as follows:
(In millions)
2015 $ 61.82016 & 2017 —2018 45.12019 0.1Thereafter 916.8
Aggregate maturities $ 1,023.8
Included in Interest expense, net for the years ended December 31, 2014, 2013 and 2012 was interestincome of $1.1 million, $1.3 million and $0.8 million, respectively. Total interest paid on debt was $59.8million in 2014, $50.4 million in 2013 and $45.8 million in 2012.
Note 7 — LEASING ARRANGEMENTS
We lease certain manufacturing facilities, warehouse space, machinery and equipment, automobiles,railcars, computers and software under operating leases. Rent expense from continuing operationswas $30.4 million in 2014, $24.5 million in 2013 and $20.2 million in 2012.
Future minimum lease payments under non-cancelable operating leases with initial lease terms longerthan one year as of December 31, 2014 are as follows (in millions):
(In millions)
2015 $ 25.6
2016 19.5
2017 12.7
2018 9.0
2019 7.2
Thereafter 14.5
Total $ 88.5
POLYONE CORPORATION 59
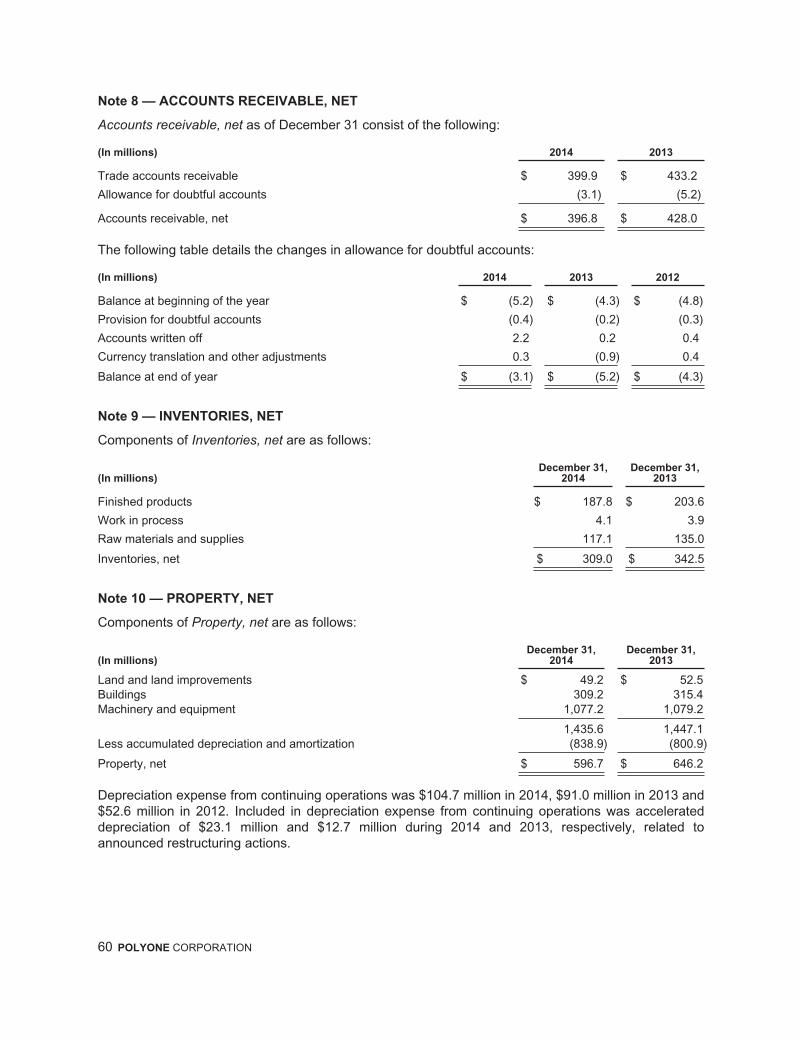
Note 8 — ACCOUNTS RECEIVABLE, NET
Accounts receivable, net as of December 31 consist of the following:
(In millions) 2014 2013
Trade accounts receivable $ 399.9 $ 433.2
Allowance for doubtful accounts (3.1) (5.2)
Accounts receivable, net $ 396.8 $ 428.0
The following table details the changes in allowance for doubtful accounts:
(In millions) 2014 2013 2012
Balance at beginning of the year $ (5.2) $ (4.3) $ (4.8)
Provision for doubtful accounts (0.4) (0.2) (0.3)
Accounts written off 2.2 0.2 0.4
Currency translation and other adjustments 0.3 (0.9) 0.4
Balance at end of year $ (3.1) $ (5.2) $ (4.3)
Note 9 — INVENTORIES, NET
Components of Inventories, net are as follows:
(In millions)December 31,
2014December 31,
2013
Finished products $ 187.8 $ 203.6
Work in process 4.1 3.9
Raw materials and supplies 117.1 135.0
Inventories, net $ 309.0 $ 342.5
Note 10 — PROPERTY, NET
Components of Property, net are as follows:
(In millions)December 31,
2014December 31,
2013
Land and land improvements $ 49.2 $ 52.5Buildings 309.2 315.4Machinery and equipment 1,077.2 1,079.2
1,435.6 1,447.1Less accumulated depreciation and amortization (838.9) (800.9)
Property, net $ 596.7 $ 646.2
Depreciation expense from continuing operations was $104.7 million in 2014, $91.0 million in 2013 and$52.6 million in 2012. Included in depreciation expense from continuing operations was accelerateddepreciation of $23.1 million and $12.7 million during 2014 and 2013, respectively, related toannounced restructuring actions.
60 POLYONE CORPORATION
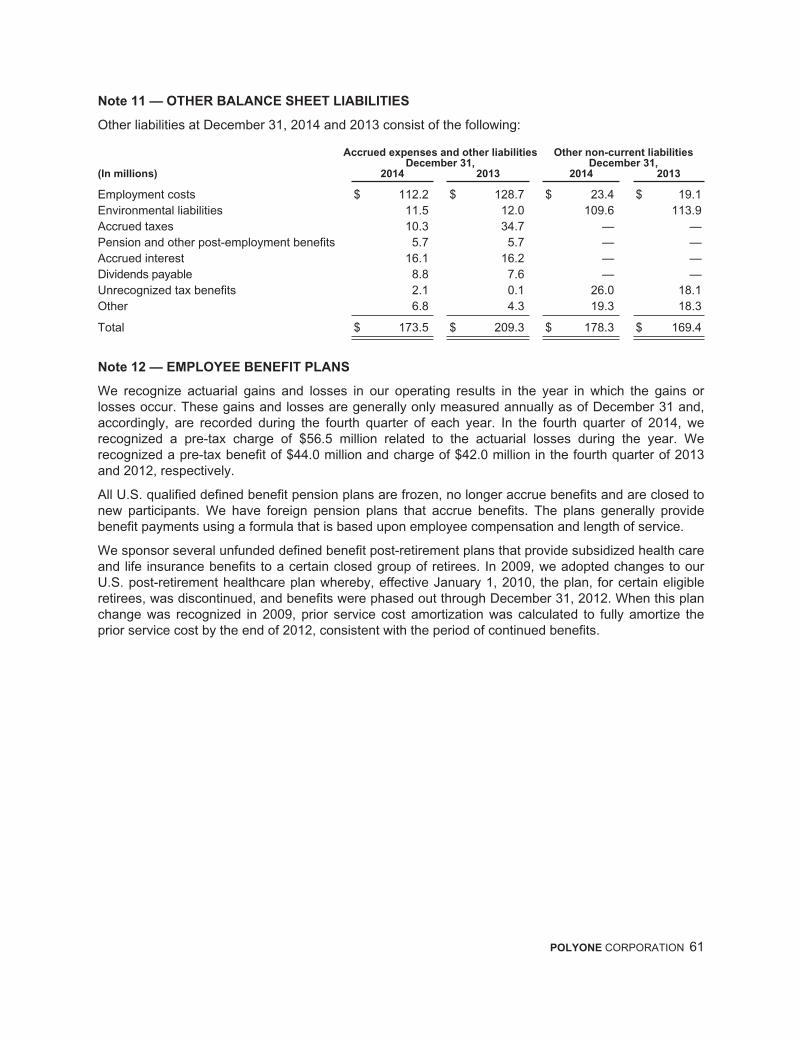
Note 11 — OTHER BALANCE SHEET LIABILITIES
Other liabilities at December 31, 2014 and 2013 consist of the following:
Accrued expenses and other liabilities Other non-current liabilitiesDecember 31, December 31,
(In millions) 2014 2013 2014 2013
Employment costs $ 112.2 $ 128.7 $ 23.4 $ 19.1Environmental liabilities 11.5 12.0 109.6 113.9Accrued taxes 10.3 34.7 — —Pension and other post-employment benefits 5.7 5.7 — —Accrued interest 16.1 16.2 — —Dividends payable 8.8 7.6 — —Unrecognized tax benefits 2.1 0.1 26.0 18.1Other 6.8 4.3 19.3 18.3
Total $ 173.5 $ 209.3 $ 178.3 $ 169.4
Note 12 — EMPLOYEE BENEFIT PLANS
We recognize actuarial gains and losses in our operating results in the year in which the gains orlosses occur. These gains and losses are generally only measured annually as of December 31 and,accordingly, are recorded during the fourth quarter of each year. In the fourth quarter of 2014, werecognized a pre-tax charge of $56.5 million related to the actuarial losses during the year. Werecognized a pre-tax benefit of $44.0 million and charge of $42.0 million in the fourth quarter of 2013and 2012, respectively.
All U.S. qualified defined benefit pension plans are frozen, no longer accrue benefits and are closed tonew participants. We have foreign pension plans that accrue benefits. The plans generally providebenefit payments using a formula that is based upon employee compensation and length of service.
We sponsor several unfunded defined benefit post-retirement plans that provide subsidized health careand life insurance benefits to a certain closed group of retirees. In 2009, we adopted changes to ourU.S. post-retirement healthcare plan whereby, effective January 1, 2010, the plan, for certain eligibleretirees, was discontinued, and benefits were phased out through December 31, 2012. When this planchange was recognized in 2009, prior service cost amortization was calculated to fully amortize theprior service cost by the end of 2012, consistent with the period of continued benefits.
POLYONE CORPORATION 61
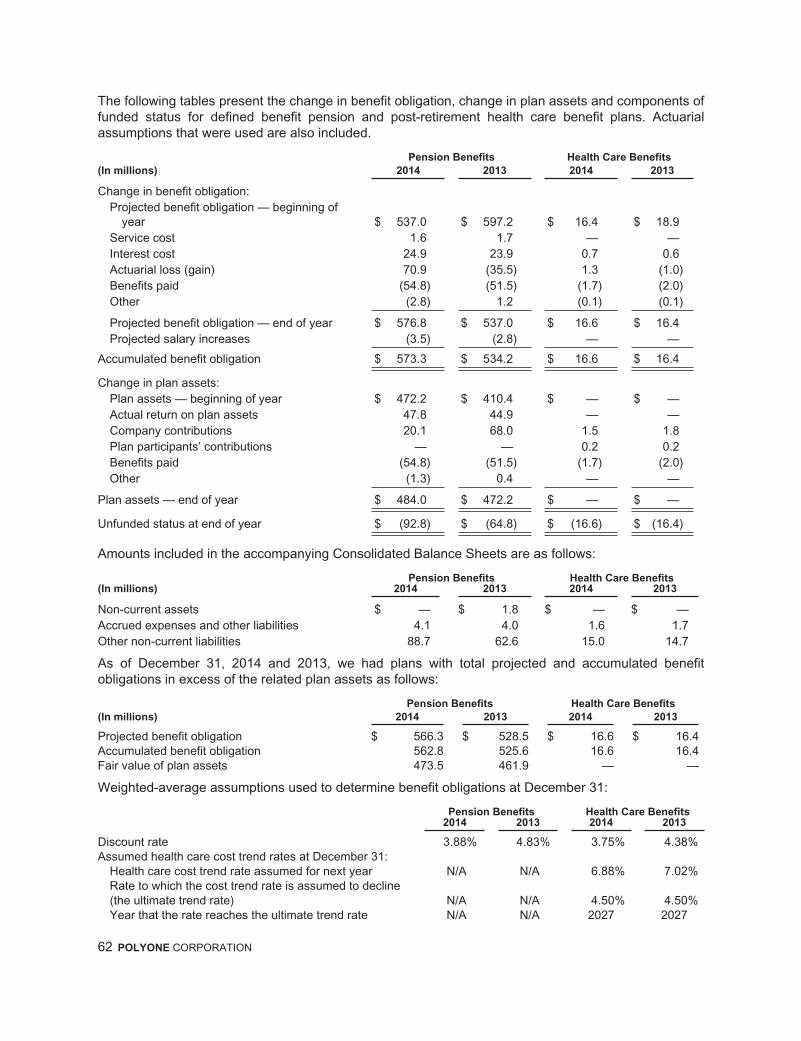
The following tables present the change in benefit obligation, change in plan assets and components offunded status for defined benefit pension and post-retirement health care benefit plans. Actuarialassumptions that were used are also included.
Pension Benefits Health Care Benefits
(In millions) 2014 2013 2014 2013
Change in benefit obligation:Projected benefit obligation — beginning of
year $ 537.0 $ 597.2 $ 16.4 $ 18.9Service cost 1.6 1.7 — —Interest cost 24.9 23.9 0.7 0.6Actuarial loss (gain) 70.9 (35.5) 1.3 (1.0)Benefits paid (54.8) (51.5) (1.7) (2.0)Other (2.8) 1.2 (0.1) (0.1)
Projected benefit obligation — end of year $ 576.8 $ 537.0 $ 16.6 $ 16.4Projected salary increases (3.5) (2.8) — —
Accumulated benefit obligation $ 573.3 $ 534.2 $ 16.6 $ 16.4
Change in plan assets:Plan assets — beginning of year $ 472.2 $ 410.4 $ — $ —Actual return on plan assets 47.8 44.9 — —Company contributions 20.1 68.0 1.5 1.8Plan participants’ contributions — — 0.2 0.2Benefits paid (54.8) (51.5) (1.7) (2.0)Other (1.3) 0.4 — —
Plan assets — end of year $ 484.0 $ 472.2 $ — $ —
Unfunded status at end of year $ (92.8) $ (64.8) $ (16.6) $ (16.4)
Amounts included in the accompanying Consolidated Balance Sheets are as follows:
Pension Benefits Health Care Benefits(In millions) 2014 2013 2014 2013
Non-current assets $ — $ 1.8 $ — $ —Accrued expenses and other liabilities 4.1 4.0 1.6 1.7Other non-current liabilities 88.7 62.6 15.0 14.7
As of December 31, 2014 and 2013, we had plans with total projected and accumulated benefitobligations in excess of the related plan assets as follows:
Pension Benefits Health Care Benefits
(In millions) 2014 2013 2014 2013
Projected benefit obligation $ 566.3 $ 528.5 $ 16.6 $ 16.4Accumulated benefit obligation 562.8 525.6 16.6 16.4Fair value of plan assets 473.5 461.9 — —
Weighted-average assumptions used to determine benefit obligations at December 31:
Pension Benefits Health Care Benefits2014 2013 2014 2013
Discount rate 3.88% 4.83% 3.75% 4.38%Assumed health care cost trend rates at December 31:
Health care cost trend rate assumed for next year N/A N/A 6.88% 7.02%Rate to which the cost trend rate is assumed to decline(the ultimate trend rate) N/A N/A 4.50% 4.50%Year that the rate reaches the ultimate trend rate N/A N/A 2027 2027
62 POLYONE CORPORATION
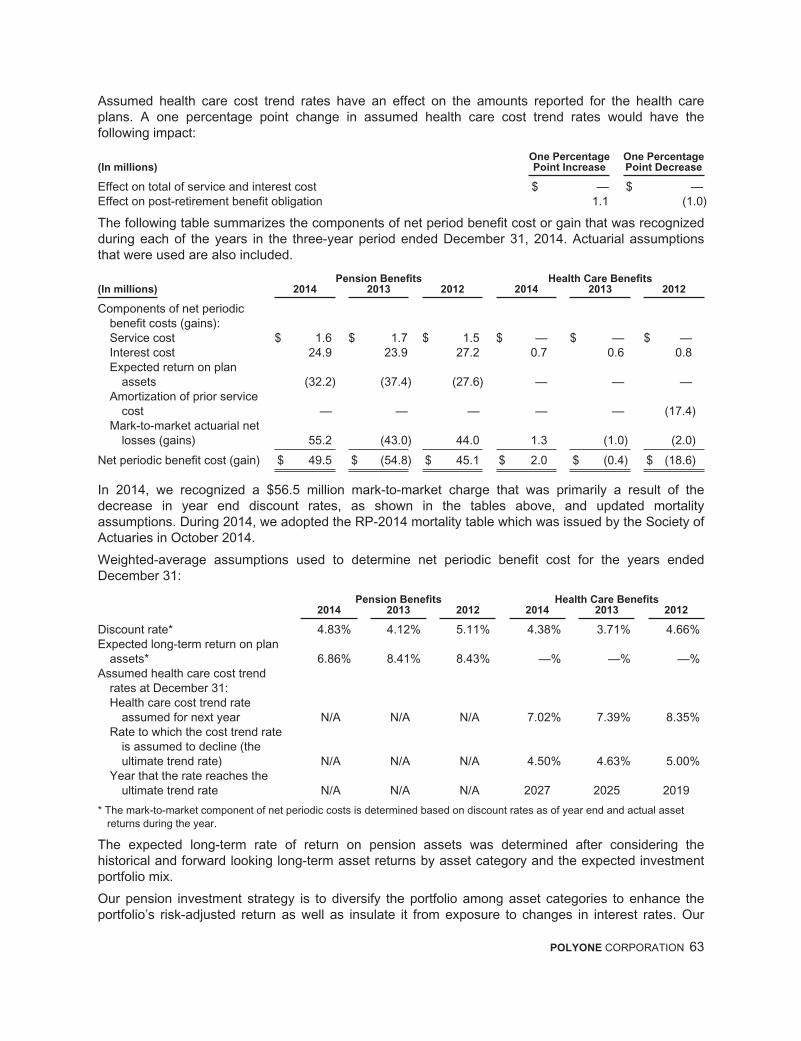
Assumed health care cost trend rates have an effect on the amounts reported for the health careplans. A one percentage point change in assumed health care cost trend rates would have thefollowing impact:
(In millions)One PercentagePoint Increase
One PercentagePoint Decrease
Effect on total of service and interest cost $ — $ —Effect on post-retirement benefit obligation 1.1 (1.0)
The following table summarizes the components of net period benefit cost or gain that was recognizedduring each of the years in the three-year period ended December 31, 2014. Actuarial assumptionsthat were used are also included.
Pension Benefits Health Care Benefits(In millions) 2014 2013 2012 2014 2013 2012
Components of net periodicbenefit costs (gains):Service cost $ 1.6 $ 1.7 $ 1.5 $ — $ — $ —Interest cost 24.9 23.9 27.2 0.7 0.6 0.8Expected return on plan
assets (32.2) (37.4) (27.6) — — —Amortization of prior service
cost — — — — — (17.4)Mark-to-market actuarial net
losses (gains) 55.2 (43.0) 44.0 1.3 (1.0) (2.0)
Net periodic benefit cost (gain) $ 49.5 $ (54.8) $ 45.1 $ 2.0 $ (0.4) $ (18.6)
In 2014, we recognized a $56.5 million mark-to-market charge that was primarily a result of thedecrease in year end discount rates, as shown in the tables above, and updated mortalityassumptions. During 2014, we adopted the RP-2014 mortality table which was issued by the Society ofActuaries in October 2014.
Weighted-average assumptions used to determine net periodic benefit cost for the years endedDecember 31:
Pension Benefits Health Care Benefits2014 2013 2012 2014 2013 2012
Discount rate* 4.83% 4.12% 5.11% 4.38% 3.71% 4.66%Expected long-term return on plan
assets* 6.86% 8.41% 8.43% —% —% —%Assumed health care cost trend
rates at December 31:Health care cost trend rate
assumed for next year N/A N/A N/A 7.02% 7.39% 8.35%Rate to which the cost trend rate
is assumed to decline (theultimate trend rate) N/A N/A N/A 4.50% 4.63% 5.00%
Year that the rate reaches theultimate trend rate N/A N/A N/A 2027 2025 2019
* The mark-to-market component of net periodic costs is determined based on discount rates as of year end and actual assetreturns during the year.
The expected long-term rate of return on pension assets was determined after considering thehistorical and forward looking long-term asset returns by asset category and the expected investmentportfolio mix.
Our pension investment strategy is to diversify the portfolio among asset categories to enhance theportfolio’s risk-adjusted return as well as insulate it from exposure to changes in interest rates. Our
POLYONE CORPORATION 63

asset mix considers the duration of plan liabilities, historical and expected returns of the investments,and the funded status of the plan. The pension asset allocation is reviewed and actively managedbased on the funded status of the plan. As the funded status of the plan increases, the asset allocationis adjusted to increase the mix of fixed income investments and match the duration of thoseinvestments with the duration of the plan liabilities. Based on the current funded status of the plan, ourpension asset investment allocation guidelines are to invest 60% to 70% in fixed income securities,30% to 40% in equity securities and 0% to 10% in alternative investments and cash. These alternativeinvestments may include funds of multiple asset investment strategies and funds of hedge funds.
The fair values of pension plan assets at December 31, 2014 and 2013, by asset category, are asfollows:
Fair Value of Plan Assets atDecember 31, 2014
(In millions)
QuotedPrices in
ActiveMarkets(Level 1)
SignificantOther
ObservableInputs
(Level 2)
SignificantUnobservable
Inputs(Level 3) Total
Asset category
Cash $ 6.7 $ — $ — $ 6.7Small-cap equity 19.2 — — 19.2Registered investment companies:
Non-U.S. equity 44.3 — — 44.3Floating rate income 35.7 — — 35.7
Common collective funds:Short-term investments — 18.8 — 18.8United States equity — 62.6 — 62.6Fixed income — 77.0 — 77.0
United States treasuries 74.6 — — 74.6Fixed income securities 124.7 5.2 — 129.9Other — — 15.2 15.2
Totals $ 305.2 $ 163.6 $ 15.2 $ 484.0
Fair Value of Plan Assets atDecember 31, 2013
(In millions)
QuotedPrices in
ActiveMarkets(Level 1)
SignificantOther
ObservableInputs
(Level 2)
SignificantUnobservable
Inputs(Level 3) Total
Asset category
Cash $ 6.6 $ — $ — $ 6.6Equity securities:
Large-cap equity 28.4 — — 28.4Small-cap equity 22.0 — — 22.0International equity 14.4 — — 14.4
Registered investment companies:Fixed income 107.7 — — 107.7Non-U.S. equity 45.2 — — 45.2Floating rate income 35.3 — — 35.3
Common collective funds:Short-term investments — 14.8 — 14.8United States equity — 30.0 — 30.0
United States treasuries 42.8 — — 42.8Fixed income securities 125.0 — — 125.0
Totals $ 427.4 $ 44.8 $ — $ 472.2
64 POLYONE CORPORATION

Large-cap equities represent U.S. publicly-traded equity securities of companies with a marketcapitalization typically in excess of $10 billion with a focus on growth or value. Small-cap equitiesrepresent U.S. publicly-traded equity securities of companies with a market capitalization typically lessthan $2 billion with a focus on growth or value. International equities primarily represent publicly-tradedequity securities of developed international countries and emerging markets with a focus on growth orvalue. The registered investment company fixed income funds invest primarily in investment gradefixed income securities. The registered investment company non-US equity funds invest in underlyingsecurities that are actively traded in public, non-US markets. The registered investment companyfloating rate income fund strategy is to invest primarily in a diversified portfolio of first and second lienhigh-yield senior floating rate loans and other floating rate debt securities. Common collective fundsare valued at the net value of units held by the fund at year end. The unit value is determined by thetotal value of fund assets divided by the total number of units of the fund owned. Short-terminvestments in common collective funds represent cash and other short-term investments. The equityinvestments in common collective funds are predominately in equity or investment grade fixed incomesecurities actively traded in public markets based upon readily measurable prices. The United Statestreasuries and fixed income securities consist of publicly traded United States and non-United Statesfixed interest obligations (principally corporate and government bonds and debentures). Other assetsare primarily insurance contracts for international plans.
Level 1 assets are valued based on quoted market prices. Level 2 investments included within therespective common collective trust funds are valued using a net asset value per share that is based onquoted market prices and/or other market data for the same or comparable instruments andtransactions of the underlying equity or fixed income investments. The insurance contracts included inthe other asset category are valued at the transacted price.
The estimated future benefit payments for our pension and health care plans are as follows:
(In millions)PensionBenefits
HealthCare
Benefits
2015 $ 50.0 $ 1.62016 39.5 1.62017 39.0 1.52018 39.1 1.52019 38.6 1.42020 through 2024 186.3 6.0
We currently estimate that 2015 employer contributions will be $24.5 million to all qualified and non-qualified pension plans and $1.6 million to all healthcare benefit plans.
PolyOne sponsors various voluntary retirement savings plans (RSP). Under the provisions of the plans,eligible employees receive defined Company contributions and are eligible for Company matchingcontributions based on their eligible earnings contributed to the plan. In addition, we may makediscretionary contributions to the plans for eligible employees based on a specific percentage of eachemployee’s compensation.
Following are our contributions to the RSP:
(In millions) 2014 2013 2012
Retirement savings match $ 9.7 $ 9.8 $ 7.6Retirement benefit contribution 4.0 4.0 3.8
Total contributions $ 13.7 $ 13.8 $ 11.4
POLYONE CORPORATION 65

Note 13 — COMMITMENTS AND CONTINGENCIES
Environmental — We or our subsidiaries have been notified by federal and state environmentalagencies and by private parties that we may be a potentially responsible party (PRP) in connectionwith the investigation and remediation of certain environmental sites. While government agenciesfrequently assert that PRPs are jointly and severally liable at these sites, in our experience, the interimand final allocations of liability costs are generally made based on the relative contribution of waste.We initiate corrective and preventive environmental projects of our own to ensure safe and lawfulactivities at our operations. We believe that compliance with current governmental regulations at alllevels will not have a material adverse effect on our financial condition.
In September 2007, we were informed of rulings by the United States District Court for the WesternDistrict of Kentucky on several pending motions in the case of Westlake Vinyls, Inc. v. GoodrichCorporation, et al., which had been pending since 2003. The Court held that PolyOne must pay theremediation costs at the former Goodrich Corporation (now Westlake Vinyls, Inc.) Calvert City facility,together with certain defense costs of Goodrich Corporation. The rulings also provided that PolyOnecan seek indemnification for contamination attributable to Westlake Vinyls.
The environmental obligation at the site arose as a result of an agreement between The B.F.GoodrichCompany (n/k/a Goodrich Corporation) and our predecessor, The Geon Company, at the time of theinitial public offering in 1993, by which the Geon Company became a public company, to indemnifyGoodrich Corporation for environmental costs at the site. At the time, neither PolyOne nor The GeonCompany ever owned or operated the facility. Following the Court rulings, the parties to the litigationentered into settlement negotiations and agreed to settle all claims regarding past environmental costsincurred at the site. The settlement agreement provides a mechanism to pursue allocations of futureremediation costs at the Calvert City site to Westlake Vinyls, Inc. While we do not currently assumeany allocation of costs in our current reserve, we will adjust our reserve, in the future, consistent withany such future allocation of costs.
A remedial investigation and feasibility study (RIFS) is underway at Calvert City. During the thirdquarter of 2013, we submitted a remedial investigation report to the United States EnvironmentalProtection Agency (USEPA). The USEPA has required certain changes to the remedial investigationreport, and development of a final report by the USEPA is ongoing. Further, we have undertaken stepsto develop a feasibility study, including engaging a third party to perform ground water modeling at thissite. Utilizing the preliminary results of this study, we were able to develop estimates for potentialremedies at Calvert City. Based upon this information, in the fourth quarter of 2013, we adjusted ourreserve by $47.0 million to reflect our best estimate of future costs. We expect the remedialinvestigation report and feasibility study to be finalized at the end of 2015, and we continue to pursueavailable insurance coverage. No receivable has been recognized for future recoveries.
On March 13, 2013, PolyOne acquired Spartech. One of Spartech’s subsidiaries, Franklin-BurlingtonPlastics, Inc. (Franklin-Burlington), operated a plastic resin compounding facility in Kearny, NewJersey, located adjacent to the Passaic River. The USEPA has requested that companies located inthe area of the lower Passaic River, including Franklin-Burlington, cooperate in an investigation ofcontamination of the lower Passaic River. In response, Franklin-Burlington and approximately 70 othercompanies (collectively, the Cooperating Parties) agreed, pursuant to an Administrative Order ofConsent with the USEPA, to assume responsibility for development of a RIFS of the lower PassaicRiver. The RIFS costs are exclusive of any costs that may ultimately be required to remediate thelower Passaic River area being studied or costs associated with natural resource damages that may beassessed. By agreeing to bear a portion of the cost of the RIFS, Franklin-Burlington did not admit toany liability or agree to bear any such remediation or natural resource damage costs. In April 2014, theUSEPA released a Focused Feasibility Study for public comment for a portion of the lower PassaicRiver. The Cooperating Parties, along with other interested parties, have submitted comments, and theUSEPA is currently reviewing the comments.
66 POLYONE CORPORATION

Given the uncertainties related to the lower Passaic River, including the fact that the final remedialactions and scope, and the ultimate allocation to Franklin-Burlington, have not yet been determined,we are not able to assess or estimate our remedial liability, if any, related to this matter.
Based on our estimates we had accruals totaling $121.1 million and $125.9 million as of December 31,2014 and 2013, respectively, for probable future environmental expenditures relating to previouslycontaminated sites. These accruals are undiscounted and included in Accrued expenses and otherliabilities and Other non-current liabilities on the accompanying Consolidated Balance Sheets. Theaccruals represent our best estimate of probable future costs that we can reasonably estimate, basedupon information and technology that is currently available and our view of the most likely remedy.Depending upon the results of future testing, completion and results of remedial investigation andfeasibility studies, the ultimate remediation alternatives undertaken, changes in regulations, newinformation, newly discovered conditions and other factors, it is reasonably possible that we could incuradditional costs in excess of the amount accrued at December 31, 2014. However, such additionalcosts, if any, cannot be currently estimated.
We believe that the probability is remote that losses in excess of amounts we have accrued would bematerially adverse to our financial position, results of operations or cash flows.
The following table details the changes in the environmental accrued liabilities:
(In millions) 2014 2013 2012
Balance at beginning of the year $ 125.9 $ 75.4 $ 76.2Environmental expenses 10.3 61.2 12.8Net cash payments (14.7) (14.3) (13.7)Currency translation and other (0.4) 3.6 0.1
Balance at end of year $ 121.1 $ 125.9 $ 75.4
Included in Cost of sales in the accompanying Consolidated Statements of Income are insurancereimbursements received for previously incurred environmental costs of $3.7 million and $23.5 millionin 2014 and 2013, respectively.
Other Litigation — We are involved in various pending or threatened claims, lawsuits andadministrative proceedings, all arising from the ordinary course of business concerning commercial,product liability, employment and environmental matters that seek remedies or damages. We believethat the probability is remote that losses in excess of the amounts we have accrued would bematerially adverse to our financial position, results of operations or cash flows.
Guarantees — On February 28, 2011, we sold our 50% equity interest in SunBelt Chlor AlkaliPartnership (Sunbelt) to Olin for $132.3 million in cash and the assumption by Olin of the obligationsunder our guarantee of senior secured notes issued by SunBelt of $42.7 million at the time of sale,$18.3 million as of December 31, 2014. Unless the guarantee is formally assigned to Olin, we remainobligated under the guarantee, although Olin has agreed to indemnify us for amounts that we may beobligated to pay under the guarantee. The senior secured notes mature in December 2017.
Note 14 — INCOME TAXES
Income from continuing operations, before income taxes is summarized below based on thegeographic location of the operation to which such earnings are attributable. Certain foreign operationsare branches of PolyOne and are, therefore, subject to United States as well as foreign income taxregulations. As a result, pre-tax income by location and the components of income tax expense bytaxing jurisdiction are not directly related.
POLYONE CORPORATION 67

Income from continuing operations, before income taxes consists of the following:
(In millions) 2014 2013 2012
Domestic $ 54.1 $ 105.2 $ 46.2Foreign 34.3 45.8 37.1
Income from continuing operations, before income taxes $ 88.4 $ 151.0 $ 83.3
A summary of income tax expense from continuing operations is as follows:
(In millions) 2014 2013 2012
Current:Federal $ (33.5) $ (17.4) $ (1.7)State (3.1) (2.8) (0.9)Foreign (19.8) (23.3) (14.7)
Total current $ (56.4) $ (43.5) $ (17.3)Deferred:
Federal $ 36.7 $ (12.9) $ (15.8)State 4.6 (1.8) 0.1Foreign 3.9 0.1 2.9
Total deferred $ 45.2 $ (14.6) $ (12.8)
Total income tax expense $ (11.2) $ (58.1) $ (30.1)
Refer to Note 5, Discontinued Operations, for income tax expense allocated to discontinued operations.
Reconciliation of income taxes from continuing operations at the U.S. statutory rate of 35% to theconsolidated effective tax rate is as follows:
(In millions) 2014 2013 2012
Income tax expense at 35% of income from continuing operations,before income taxes $ (30.9) $ (52.8) $ (29.2)
State tax, net of federal benefit 1.1 (3.9) (1.3)Differences in rates of foreign operations 5.4 (1.2) 3.3Changes in valuation allowances (6.9) (3.1) (0.9)U.S. research and development credit 1.0 2.1 —Tax benefits on certain foreign investments 13.4 — —Uncertain tax positions (0.9) 0.5 0.1U.S. tax settlements 2.8 — —Domestic manufacturing deduction 2.2 1.5 —Other, net 1.6 (1.2) (2.1)
Income tax expense $ (11.2) $ (58.1) $ (30.1)
68 POLYONE CORPORATION

Components of our deferred tax liabilities and assets as of December 31, 2014 and 2013 were asfollows:
(In millions) 2014 2013
Deferred tax liabilities:Tax over book depreciation $ (76.9) $ (87.1)Intangibles (135.2) (132.4)Other, net (9.1) (13.6)
Total deferred tax liabilities $ (221.2) $ (233.1)Deferred tax assets:
Pension and other post-retirement benefits $ 39.1 $ 20.6Employment costs 47.2 36.8Environmental 46.5 49.3Net operating loss carryforwards 42.0 38.0Other, net 30.6 32.6
Total deferred tax assets $ 205.4 $ 177.3Valuation allowances (23.6) (29.3)
Net deferred tax liabilities $ (39.4) $ (85.1)
As of December 31, 2014, we have combined state net operating loss carryforwards of $223.4 millionthat expire at various dates from 2015 through 2033. Various foreign subsidiaries have net operatingloss carryforwards totaling $108.5 million that expire at various dates from 2015 through 2033. Wehave provided valuation allowances of $21.5 million against certain foreign and state losscarryforwards.
No provision has been made for income taxes on undistributed earnings of consolidated non-U.S.subsidiaries of $281.7 million at December 31, 2014, because our intention is to reinvest indefinitelyundistributed earnings of our foreign subsidiaries. It is not practicable to estimate the additional incometaxes and applicable foreign withholding taxes that would be payable on the remittance of suchundistributed earnings.
We made worldwide income tax payments of $70.0 million and received refunds of $4.2 million in2014. We made worldwide income tax payments of $120.3 million and $30.8 million in 2013 and 2012,respectively, and received refunds of $2.9 million and $13.0 million in 2013 and 2012, respectively. Theincrease in income tax payments made in 2013 is primarily related to higher 2013 earnings and thegain recognized related to the divestiture of the Resin Business.
The Company records provisions for uncertain tax positions in accordance with ASC Topic 740,Income Taxes. A reconciliation of unrecognized tax benefits is as follows:
Unrecognized Tax Benefits
(In millions) 2014 2013 2012
Balance as of January 1 $ 15.2 $ 14.5 $ 15.1Additions based on tax positions related to the current year 4.8 — 0.2Additions for tax positions of prior years 0.1 — —Reductions for tax positions of prior years (2.3) (0.9) (0.4)Balances related to acquired businesses 14.2 1.1 —Settlements and other (3.4) 0.5 (0.4)
Balance as of December 31 $ 28.6 $ 15.2 $ 14.5
We recognize interest and penalties related to uncertain tax positions in the provision for income taxes.As of December 31, 2014 and 2013, we had $8.6 million and $3.0 million accrued for interest andpenalties, respectively. The increase during 2014 is primarily associated with purchase accountingadjustments.
POLYONE CORPORATION 69

Although the timing and outcome of tax settlements are uncertain, it is reasonably possible that duringthe next 12 months a reduction in unrecognized tax benefits may occur up to $19.2 million based onthe outcome of tax examinations and as a result of the expiration of various statues of limitations.
If all unrecognized tax benefits were recognized, the net impact on the provision for income taxexpense would be $25.0 million.
The Company is currently being audited by multiple state and foreign taxing jurisdictions. We are nolonger subject to U.S. federal income tax examinations for periods preceding 2010 and, with limitedexceptions, for periods preceding 2007 for state and 2002 for foreign tax examinations.
Note 15 — SHARE-BASED COMPENSATION
Share-based compensation cost is based on the value of the portion of share-based payment awardsthat are ultimately expected to vest during the period. Share-based compensation cost recognized inthe accompanying Consolidated Statements of Income includes compensation cost for share-basedpayment awards based on the grant date fair value estimated in accordance with the provision ofFASB ASC Topic 718, Compensation — Stock Compensation. Share-based compensation expense isbased on awards expected to vest and therefore has been reduced for estimated forfeitures. Weestimate forfeitures at the time of grant and revise that estimate, if necessary, in subsequent periods ifactual forfeitures differ from those estimates.
Equity and Performance Incentive Plans
The PolyOne Corporation 2010 Equity and Performance Incentive Plan (2010 EPIP), as amended in2012, reserved 5.0 million common shares for the award of a variety of share-based compensationalternatives, including non-qualified stock options, incentive stock options, restricted stock, restrictedstock units (RSUs), performance shares, performance units and stock appreciation rights (SARs). It isanticipated that all share-based grants and awards that are earned and exercised will be issued fromPolyOne common shares that are held in treasury.
Share-based compensation is included in Selling and administrative expense in the accompanyingConsolidated Statements of Income. A summary of compensation expense by type of award follows:
(In millions) 2014 2013 2012
Stock appreciation rights $ 5.5 $ 6.1 $ 5.1Performance shares 0.7 0.3 —Restricted stock units 8.0 10.1 5.3
Total share-based compensation $ 14.2 $ 16.5 $ 10.4
Stock Appreciation Rights
During the years ended December 31, 2014, 2013 and 2012, the total number of SARs granted were0.3 million, 0.5 million and 0.8 million, respectively. Awards vest in one-third increments upon the laterof the attainment of stock price targets and time-based vesting over a three-year service period.Awards granted in 2014 are subject to an appreciation cap of 200% of the base price. OutstandingSARs have contractual terms ranging from seven to ten years from the date of the grant.
The SARs were valued using a Monte Carlo simulation method as the vesting is dependent on theachievement of certain stock price targets. The SARs have time and market-based vesting conditionsbut vest no earlier than their three year graded vesting schedule. The below expected term assumptionfor fiscal 2014 is an output from the Monte Carlo model, and are derived from employee exerciseassumptions that are based on PolyOne historical exercise experience. The expected volatility wasdetermined based on the average weekly volatility for our common shares for the contractual life of the
70 POLYONE CORPORATION

awards. The expected dividend assumption was determined based upon PolyOne’s dividend yield atthe time of grant. The risk-free rate of return was based on available yields on U.S. Treasury bills of thesame duration as the contractual life of the awards. Forfeitures were estimated at 3% per year basedon our historical experience.
The following is a summary of the weighted average assumptions related to the grants issued during2014, 2013 and 2012:
2014 2013 2012
Expected volatility (weighted-average) 48.0% 50.0% 53.0%Expected dividends 0.91% 1.04% 1.37%Expected term (in years) 6.4 7.4 8.0Risk-free rate 2.94% 2.12% 2.05%Value of SARs granted $14.05 $10.83 $6.92
A summary of SAR activity for 2014 is presented below:
Stock Appreciation Rights
In millions, except per share data) Shares
Weighted-Average
Exercise PricePer Share
Weighted-Average
RemainingContractual
Term
AggregateIntrinsic
Value
Outstanding as of January 1, 2014 2.1 $ 16.63 6.33 $ 39.3Granted 0.3 35.19 —Exercised (0.7) 15.55 —Forfeited or expired (0.1) 32.00 —
Outstanding as of December 31, 2014 1.6 $ 20.13 6.63 $ 28.9
Vested and exercisable as of December 31, 2014 0.8 $ 14.81 5.02 $ 19.0
The total intrinsic value of SARs exercised during 2014, 2013 and 2012 was $15.0 million, $14.9million and $25.5 million, respectively. As of December 31, 2014, there was $2.1 million of totalunrecognized compensation cost related to SARs, which is expected to be recognized over theweighted average remaining vesting period of 15 months.
Restricted Stock Units
Restricted stock units (RSUs) represent contingent rights to receive one common share at a futuredate provided certain vesting criteria are met.
During 2014, 2013 and 2012, the total number of RSUs granted were 0.2 million, 0.5 million and0.6 million, respectively. These RSUs, which vest on the third anniversary of the grant date, weregranted to executives and other key employees. Compensation expense is measured on the grant dateusing the quoted market price of our common shares and is recognized on a straight-line basis overthe requisite service period.
As of December 31, 2014, 1.0 million RSUs remain unvested with a weighted-average grant date fairvalue of $23.49. Unrecognized compensation cost for RSUs at December 31, 2014 was $6.1 million,which is expected to be recognized over the weighted average remaining vesting period of 12 months.
Note 16 — SEGMENT INFORMATION
A segment is a component of an enterprise whose operating results are regularly reviewed by theenterprise’s chief operating decision maker to make decisions about resources to be allocated to thesegment and assess its performance, and for which discrete financial information is available.
Operating income is the primary measure that is reported to our chief operating decision maker forpurposes of allocating resources to the segments and assessing their performance. Operating incomeat the segment level does not include: corporate general and administrative expenses that are not
POLYONE CORPORATION 71
allocated to segments; intersegment sales and profit eliminations; charges related to specific strategicinitiatives such as the consolidation of operations; restructuring activities, including employeeseparation costs resulting from personnel reduction programs, plant closure and phase-in costs;executive separation agreements; share-based compensation costs; asset impairments; environmentalremediation costs and other liabilities for facilities no longer owned or closed in prior years; gains andlosses on the divestiture of joint ventures and equity investments; actuarial gains and lossesassociated with our pension and other post-retirement benefit plans; and certain other items that arenot included in the measure of segment profit or loss that is reported to and reviewed by our chiefoperating decision maker. These costs are included in Corporate and eliminations.
Segment assets are primarily customer receivables, inventories, net property, plant and equipment,intangibles and goodwill. Intersegment sales are generally accounted for at prices that approximatethose for similar transactions with unaffiliated customers. Corporate and eliminations assets andliabilities primarily include cash, debt, environmental liabilities, retained assets and liabilities ofdiscontinued operations, and other unallocated corporate assets and liabilities. The accounting policiesof each segment are consistent with those described in Note 1, Description of Business and Summaryof Significant Accounting Policies.
The following is a description of each of our five reportable segments.
Global Color, Additives and Inks
Global Color, Additives and Inks is a leading provider of specialized custom color and additiveconcentrates in solid and liquid form for thermoplastics, dispersions for thermosets, as well as specialtyinks, plastisols, and vinyl slush molding solutions. Color and additive solutions include an innovativearray of colors, special effects and performance-enhancing and eco-friendly solutions. When combinedwith a non-base resin, our solutions help customers achieve differentiated specialized colors andeffects targeted at the demands of today’s highly design-oriented consumer and industrial endmarkets. Our additive concentrates encompass a wide variety of performance and process enhancingcharacteristics and are commonly categorized by the function that they perform, such as UVstabilization, antimicrobial, anti-static, blowing or foaming, antioxidant, lubricant, and productivityenhancement. Our colorant and additives concentrates are used in a broad range of polymers,including those used in medical and pharmaceutical devices, food packaging, personal care andcosmetics, transportation, building products, wire and cable markets. We also provide custom-formulated liquid systems that meet a variety of customer needs and chemistries, including vinyl,natural rubber and latex, polyurethane and silicone. Our offering also includes proprietary inks andlatexes for diversified markets such as recreational and athletic apparel, construction and filtration,outdoor furniture and healthcare. Our liquid polymer coatings and additives are largely based on vinyland are used in a variety of markets, including building and construction, consumer, healthcare,industrial, packaging, textiles, appliances, transportation, and wire and cable. Global Color, Additivesand Inks has manufacturing, sales and service facilities located throughout North America, SouthAmerica, Europe, Asia and Africa.
On December 1, 2014, the Company completed the acquisition of specialty assets of Accella, a leadingNorth American manufacturer of liquid polymer formulations, for $47.2 million in cash, net of cashacquired. Accella results are included within the Global Color, Additives and Inks segment.
Global Specialty Engineered Materials
Global Specialty Engineered Materials is a leading provider of specialty polymer formulations, servicesand solutions for designers, assemblers and processors of thermoplastic materials across a widevariety of markets and end-use applications. Our product portfolio, which we believe to be one of themost diverse in our industry, includes specialty formulated high-performance polymer materials that aremanufactured using thermoplastic resins and elastomers, which are then combined with advancedpolymer additives, reinforcement, filler, colorant and/or biomaterial technologies. Our technical and
72 POLYONE CORPORATION

market expertise enables us to expand the performance range and structural properties of traditionalengineering-grade thermoplastic resins to meet evolving customer needs. Global Specialty EngineeredMaterials has manufacturing, sales and service facilities located throughout North America, Europe,Asia and South America. Our product development and application reach is further enhanced by thecapabilities of our Innovation Centers in the United States, Germany and China, which produce andevaluate prototype and sample parts to help assess end-use performance and guide productdevelopment. Our manufacturing capabilities are targeted at meeting our customers’ demand forspeed, flexibility and critical quality.
Designed Structures and Solutions
On March 13, 2013, the Company completed the acquisition of Spartech, a supplier of plastic sheet,color and engineered materials, and packaging solutions. As a result of the acquisition, a newreportable segment, “Designed Structures and Solutions”, was created. Designed Structures andSolutions is comprised of the former Spartech Custom Sheet and Rollstock and PackagingTechnologies businesses. We believe PolyOne’s Designed Structures and Solutions segment is amarket leader in providing specialized, full service and innovative solutions in engineered polymerstructures, rigid barrier packaging and specialty cast acrylics. We utilize a variety of polymers, specialtyadditives and processing technologies to produce a complete portfolio of sheet, custom rollstock andspecialty film, laminate and acrylic solutions. Our solutions can be engineered to provide structural orfunctional performance in an application or deliver design and visual aesthetics to meet our customers’needs. Our offerings also include a wide range of sustainable, cost-effective stock and custompackaging solutions for various industry processes used in the food, medical, consumer and graphicarts markets. In addition to packaging, we also work closely with customers to provide solutions fortransportation, building and construction, healthcare and consumer markets. Designed Structures andSolutions has manufacturing, sales and service facilities located throughout North America.
Performance Products and Solutions
Performance Products and Solutions is comprised of the Geon Performance Materials (Geon) andProducer Services business units. The Geon business delivers an array of products and services forvinyl molding and extrusion processors located in North America and Asia. The Geon brand namecarries strong recognition globally. Geon’s products are sold to manufacturers of durable plastic partsand consumer-oriented products. We also offer a wide range of services including materials testing,component analysis, custom formulation development, colorant and additive services, part designassistance, structural analysis, process simulations, mold design and flow analysis and extruder screwdesign. Vinyl is used across a broad range of markets and applications, including, but not limited to:healthcare, wire and cable, building and construction, consumer and recreational products andtransportation and packaging. The Producer Services business unit offers contract manufacturing andoutsourced polymer manufacturing services to resin producers and polymer marketers, primarily in theUnited States and Mexico, as well as its own proprietary compounds for pressure pipe and dripirrigation applications. As a strategic and integrated supply chain partner, Producer Services offersresin producers a way to develop custom products for niche markets by using our process technologyexpertise and multiple manufacturing platforms.
PolyOne Distribution
The PolyOne Distribution business distributes more than 3,500 grades of engineering and commoditygrade resins, including PolyOne-produced solutions, principally to the North American and Asianmarkets. These products are sold to over 6,000 custom injection molders and extruders who, in turn,convert them into plastic parts that are sold to end-users in a wide range of industries. Representingover 25 major suppliers, we offer our customers a broad product portfolio, just-in-time delivery frommultiple stocking locations and local technical support. Recent expansion in Central America and Asiahave bolstered PolyOne Distribution’s ability to serve the specialized needs of customers globally.
POLYONE CORPORATION 73
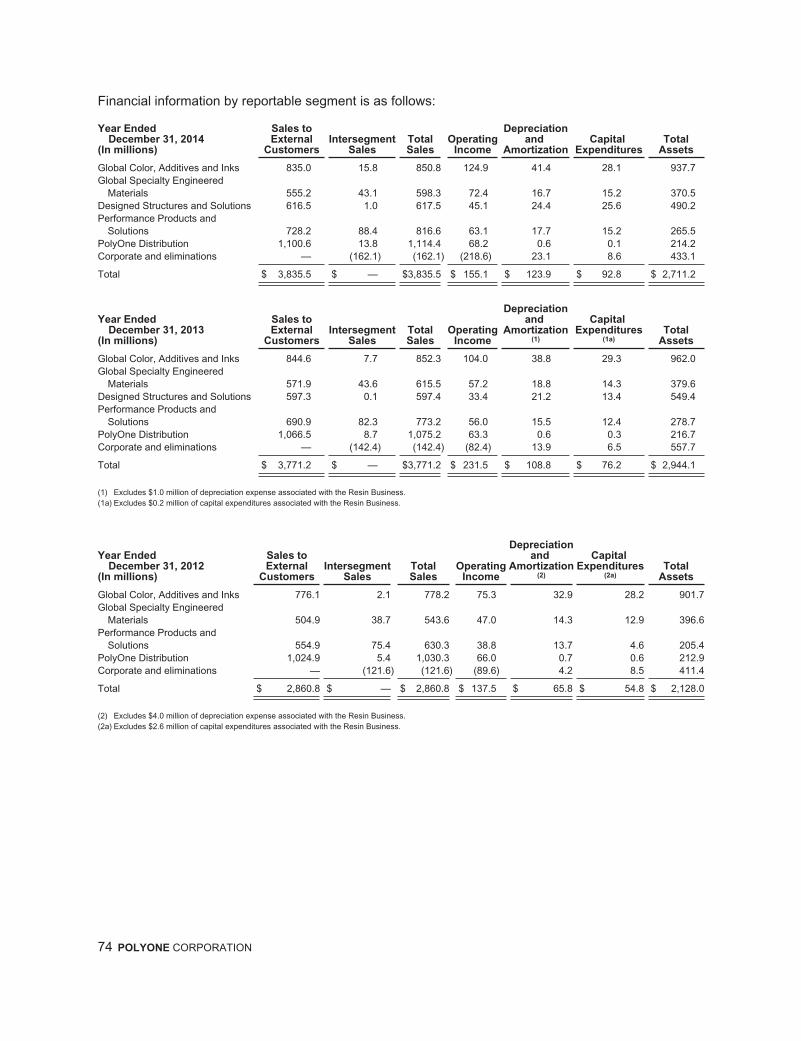
Financial information by reportable segment is as follows:
Year EndedDecember 31, 2014
(In millions)
Sales toExternal
CustomersIntersegment
SalesTotalSales
OperatingIncome
Depreciationand
AmortizationCapital
ExpendituresTotal
Assets
Global Color, Additives and Inks 835.0 15.8 850.8 124.9 41.4 28.1 937.7Global Specialty Engineered
Materials 555.2 43.1 598.3 72.4 16.7 15.2 370.5Designed Structures and Solutions 616.5 1.0 617.5 45.1 24.4 25.6 490.2Performance Products and
Solutions 728.2 88.4 816.6 63.1 17.7 15.2 265.5PolyOne Distribution 1,100.6 13.8 1,114.4 68.2 0.6 0.1 214.2Corporate and eliminations — (162.1) (162.1) (218.6) 23.1 8.6 433.1
Total $ 3,835.5 $ — $3,835.5 $ 155.1 $ 123.9 $ 92.8 $ 2,711.2
Year EndedDecember 31, 2013
(In millions)
Sales toExternal
CustomersIntersegment
SalesTotalSales
OperatingIncome
Depreciationand
Amortization(1)
CapitalExpenditures
(1a)Total
Assets
Global Color, Additives and Inks 844.6 7.7 852.3 104.0 38.8 29.3 962.0Global Specialty Engineered
Materials 571.9 43.6 615.5 57.2 18.8 14.3 379.6Designed Structures and Solutions 597.3 0.1 597.4 33.4 21.2 13.4 549.4Performance Products and
Solutions 690.9 82.3 773.2 56.0 15.5 12.4 278.7PolyOne Distribution 1,066.5 8.7 1,075.2 63.3 0.6 0.3 216.7Corporate and eliminations — (142.4) (142.4) (82.4) 13.9 6.5 557.7
Total $ 3,771.2 $ — $3,771.2 $ 231.5 $ 108.8 $ 76.2 $ 2,944.1
(1) Excludes $1.0 million of depreciation expense associated with the Resin Business.(1a) Excludes $0.2 million of capital expenditures associated with the Resin Business.
Year EndedDecember 31, 2012
(In millions)
Sales toExternal
CustomersIntersegment
SalesTotalSales
OperatingIncome
Depreciationand
Amortization(2)
CapitalExpenditures
(2a)Total
Assets
Global Color, Additives and Inks 776.1 2.1 778.2 75.3 32.9 28.2 901.7Global Specialty Engineered
Materials 504.9 38.7 543.6 47.0 14.3 12.9 396.6Performance Products and
Solutions 554.9 75.4 630.3 38.8 13.7 4.6 205.4PolyOne Distribution 1,024.9 5.4 1,030.3 66.0 0.7 0.6 212.9Corporate and eliminations — (121.6) (121.6) (89.6) 4.2 8.5 411.4
Total $ 2,860.8 $ — $ 2,860.8 $ 137.5 $ 65.8 $ 54.8 $ 2,128.0
(2) Excludes $4.0 million of depreciation expense associated with the Resin Business.(2a) Excludes $2.6 million of capital expenditures associated with the Resin Business.
74 POLYONE CORPORATION
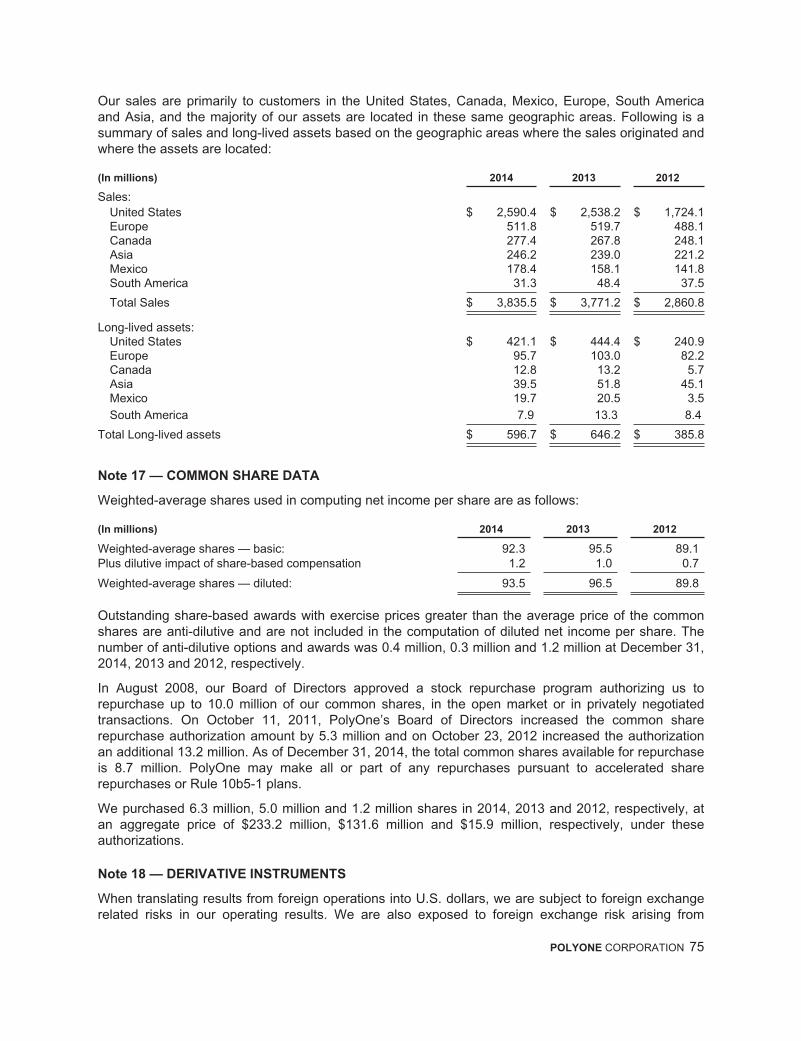
Our sales are primarily to customers in the United States, Canada, Mexico, Europe, South Americaand Asia, and the majority of our assets are located in these same geographic areas. Following is asummary of sales and long-lived assets based on the geographic areas where the sales originated andwhere the assets are located:
(In millions) 2014 2013 2012
Sales:United States $ 2,590.4 $ 2,538.2 $ 1,724.1Europe 511.8 519.7 488.1Canada 277.4 267.8 248.1Asia 246.2 239.0 221.2Mexico 178.4 158.1 141.8South America 31.3 48.4 37.5
Total Sales $ 3,835.5 $ 3,771.2 $ 2,860.8
Long-lived assets:United States $ 421.1 $ 444.4 $ 240.9Europe 95.7 103.0 82.2Canada 12.8 13.2 5.7Asia 39.5 51.8 45.1Mexico 19.7 20.5 3.5South America 7.9 13.3 8.4
Total Long-lived assets $ 596.7 $ 646.2 $ 385.8
Note 17 — COMMON SHARE DATA
Weighted-average shares used in computing net income per share are as follows:
(In millions) 2014 2013 2012
Weighted-average shares — basic: 92.3 95.5 89.1Plus dilutive impact of share-based compensation 1.2 1.0 0.7
Weighted-average shares — diluted: 93.5 96.5 89.8
Outstanding share-based awards with exercise prices greater than the average price of the commonshares are anti-dilutive and are not included in the computation of diluted net income per share. Thenumber of anti-dilutive options and awards was 0.4 million, 0.3 million and 1.2 million at December 31,2014, 2013 and 2012, respectively.
In August 2008, our Board of Directors approved a stock repurchase program authorizing us torepurchase up to 10.0 million of our common shares, in the open market or in privately negotiatedtransactions. On October 11, 2011, PolyOne’s Board of Directors increased the common sharerepurchase authorization amount by 5.3 million and on October 23, 2012 increased the authorizationan additional 13.2 million. As of December 31, 2014, the total common shares available for repurchaseis 8.7 million. PolyOne may make all or part of any repurchases pursuant to accelerated sharerepurchases or Rule 10b5-1 plans.
We purchased 6.3 million, 5.0 million and 1.2 million shares in 2014, 2013 and 2012, respectively, atan aggregate price of $233.2 million, $131.6 million and $15.9 million, respectively, under theseauthorizations.
Note 18 — DERIVATIVE INSTRUMENTS
When translating results from foreign operations into U.S. dollars, we are subject to foreign exchangerelated risks in our operating results. We are also exposed to foreign exchange risk arising from
POLYONE CORPORATION 75
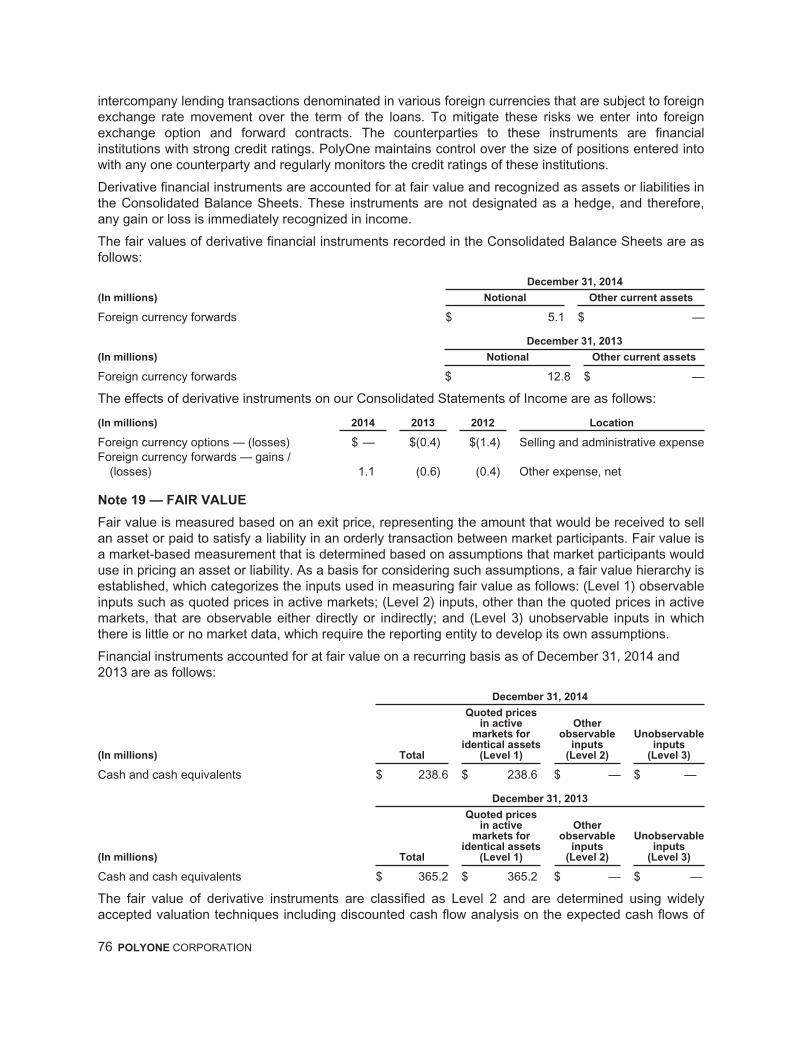
intercompany lending transactions denominated in various foreign currencies that are subject to foreignexchange rate movement over the term of the loans. To mitigate these risks we enter into foreignexchange option and forward contracts. The counterparties to these instruments are financialinstitutions with strong credit ratings. PolyOne maintains control over the size of positions entered intowith any one counterparty and regularly monitors the credit ratings of these institutions.
Derivative financial instruments are accounted for at fair value and recognized as assets or liabilities inthe Consolidated Balance Sheets. These instruments are not designated as a hedge, and therefore,any gain or loss is immediately recognized in income.
The fair values of derivative financial instruments recorded in the Consolidated Balance Sheets are asfollows:
December 31, 2014
(In millions) Notional Other current assets
Foreign currency forwards $ 5.1 $ —
December 31, 2013
(In millions) Notional Other current assets
Foreign currency forwards $ 12.8 $ —
The effects of derivative instruments on our Consolidated Statements of Income are as follows:
(In millions) 2014 2013 2012 Location
Foreign currency options — (losses) $ — $(0.4) $(1.4) Selling and administrative expenseForeign currency forwards — gains /
(losses) 1.1 (0.6) (0.4) Other expense, net
Note 19 — FAIR VALUE
Fair value is measured based on an exit price, representing the amount that would be received to sellan asset or paid to satisfy a liability in an orderly transaction between market participants. Fair value isa market-based measurement that is determined based on assumptions that market participants woulduse in pricing an asset or liability. As a basis for considering such assumptions, a fair value hierarchy isestablished, which categorizes the inputs used in measuring fair value as follows: (Level 1) observableinputs such as quoted prices in active markets; (Level 2) inputs, other than the quoted prices in activemarkets, that are observable either directly or indirectly; and (Level 3) unobservable inputs in whichthere is little or no market data, which require the reporting entity to develop its own assumptions.
Financial instruments accounted for at fair value on a recurring basis as of December 31, 2014 and2013 are as follows:
December 31, 2014
(In millions) Total
Quoted pricesin active
markets foridentical assets
(Level 1)
Otherobservable
inputs(Level 2)
Unobservableinputs
(Level 3)
Cash and cash equivalents $ 238.6 $ 238.6 $ — $ —
December 31, 2013
(In millions) Total
Quoted pricesin active
markets foridentical assets
(Level 1)
Otherobservable
inputs(Level 2)
Unobservableinputs
(Level 3)
Cash and cash equivalents $ 365.2 $ 365.2 $ — $ —
The fair value of derivative instruments are classified as Level 2 and are determined using widelyaccepted valuation techniques including discounted cash flow analysis on the expected cash flows of
76 POLYONE CORPORATION
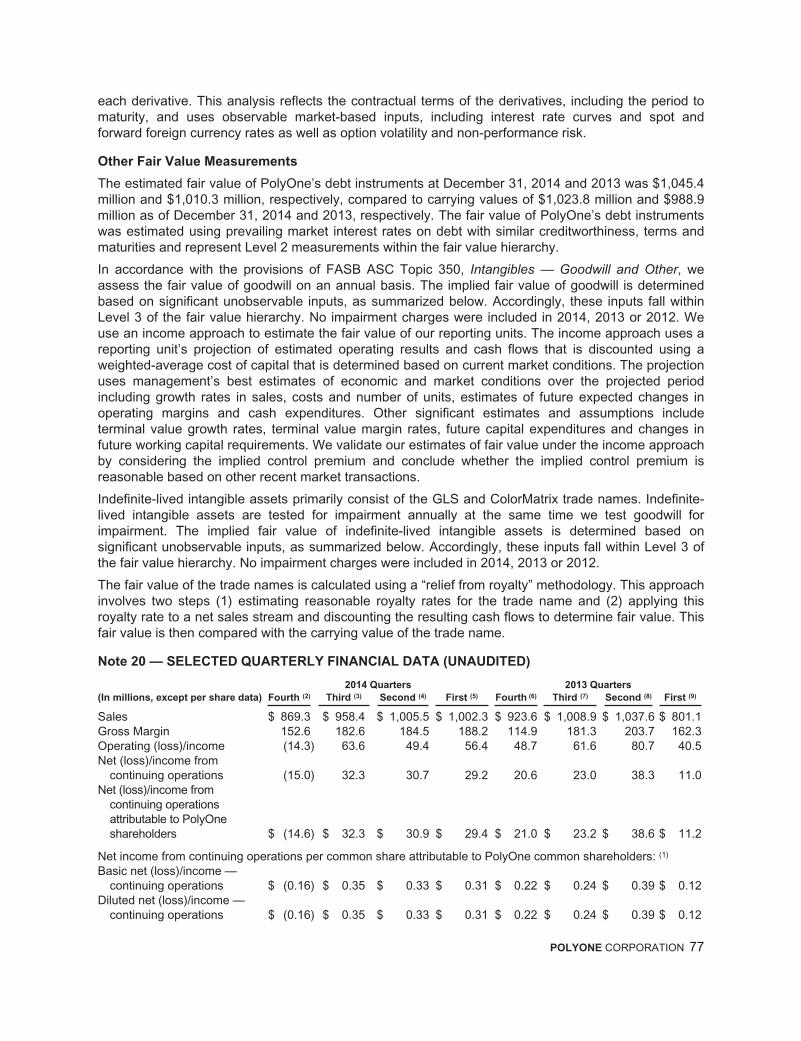
each derivative. This analysis reflects the contractual terms of the derivatives, including the period tomaturity, and uses observable market-based inputs, including interest rate curves and spot andforward foreign currency rates as well as option volatility and non-performance risk.
Other Fair Value Measurements
The estimated fair value of PolyOne’s debt instruments at December 31, 2014 and 2013 was $1,045.4million and $1,010.3 million, respectively, compared to carrying values of $1,023.8 million and $988.9million as of December 31, 2014 and 2013, respectively. The fair value of PolyOne’s debt instrumentswas estimated using prevailing market interest rates on debt with similar creditworthiness, terms andmaturities and represent Level 2 measurements within the fair value hierarchy.
In accordance with the provisions of FASB ASC Topic 350, Intangibles — Goodwill and Other, weassess the fair value of goodwill on an annual basis. The implied fair value of goodwill is determinedbased on significant unobservable inputs, as summarized below. Accordingly, these inputs fall withinLevel 3 of the fair value hierarchy. No impairment charges were included in 2014, 2013 or 2012. Weuse an income approach to estimate the fair value of our reporting units. The income approach uses areporting unit’s projection of estimated operating results and cash flows that is discounted using aweighted-average cost of capital that is determined based on current market conditions. The projectionuses management’s best estimates of economic and market conditions over the projected periodincluding growth rates in sales, costs and number of units, estimates of future expected changes inoperating margins and cash expenditures. Other significant estimates and assumptions includeterminal value growth rates, terminal value margin rates, future capital expenditures and changes infuture working capital requirements. We validate our estimates of fair value under the income approachby considering the implied control premium and conclude whether the implied control premium isreasonable based on other recent market transactions.
Indefinite-lived intangible assets primarily consist of the GLS and ColorMatrix trade names. Indefinite-lived intangible assets are tested for impairment annually at the same time we test goodwill forimpairment. The implied fair value of indefinite-lived intangible assets is determined based onsignificant unobservable inputs, as summarized below. Accordingly, these inputs fall within Level 3 ofthe fair value hierarchy. No impairment charges were included in 2014, 2013 or 2012.
The fair value of the trade names is calculated using a “relief from royalty” methodology. This approachinvolves two steps (1) estimating reasonable royalty rates for the trade name and (2) applying thisroyalty rate to a net sales stream and discounting the resulting cash flows to determine fair value. Thisfair value is then compared with the carrying value of the trade name.
Note 20 — SELECTED QUARTERLY FINANCIAL DATA (UNAUDITED)
2014 Quarters 2013 Quarters
(In millions, except per share data) Fourth (2) Third (3) Second (4) First (5) Fourth (6) Third (7) Second (8) First (9)
Sales $ 869.3 $ 958.4 $ 1,005.5 $ 1,002.3 $ 923.6 $ 1,008.9 $ 1,037.6 $ 801.1Gross Margin 152.6 182.6 184.5 188.2 114.9 181.3 203.7 162.3Operating (loss)/income (14.3) 63.6 49.4 56.4 48.7 61.6 80.7 40.5Net (loss)/income from
continuing operations (15.0) 32.3 30.7 29.2 20.6 23.0 38.3 11.0Net (loss)/income from
continuing operationsattributable to PolyOneshareholders $ (14.6) $ 32.3 $ 30.9 $ 29.4 $ 21.0 $ 23.2 $ 38.6 $ 11.2
Net income from continuing operations per common share attributable to PolyOne common shareholders: (1)
Basic net (loss)/income —continuing operations $ (0.16) $ 0.35 $ 0.33 $ 0.31 $ 0.22 $ 0.24 $ 0.39 $ 0.12
Diluted net (loss)/income —continuing operations $ (0.16) $ 0.35 $ 0.33 $ 0.31 $ 0.22 $ 0.24 $ 0.39 $ 0.12
POLYONE CORPORATION 77

(1) Per share amounts for the quarter and the full year have been computed separately. The sum of the quarterly amounts maynot equal the annual amounts presented because of differences in the average shares outstanding during each period.
(2) Included for the fourth quarter 2014 are: 1) mark-to-market pension and other post-retirement charge of $56.5 million, 2)employee separation and restructuring costs of $23.2 million, 3) environmental remediation costs of $2.6 million and 5) again related to the reimbursement of previously incurred environmental costs of $2.1 million.
(3) Included for the third quarter 2014 are: 1) $17.9 million in employee separation and restructuring costs, 2) $5.9 million inenvironmental remediation costs and 3) a gain related to the reimbursement of previously incurred environmental costs of$1.6 million.
(4) Included for the second quarter 2014 are: 1) $35.1 million in employee separation and restructuring costs and 2) $5.4 milliontax benefit associated with our investments in certain foreign affiliates.
(5) Included for the first quarter 2014 are: 1) $17.9 million in employee separation and restructuring costs.(6) Included for the fourth quarter 2013 are: 1) gains from the SunBelt earn-out of $26.8 million, 2) mark-to-market pension and
other post-retirement benefit gains of $44.0 million, 3) environmental remediation costs of $52.6 million, 4) a gain related tothe reimbursement of previously incurred environmental costs of $3.4 million and 5) employee separation and restructuringcosts of $28.3 million.
(7) Included for the third quarter 2013 are: 1) $5.3 million in environmental remediation costs, 2) $10.9 million in employeeseparation and restructuring costs, 3) $7.0 million gain on commercial litigation, 4) $5.2 million in debt extinguishment costsassociated with our outstanding debt repurchases and 5) $1.2 million of acquisition and divestiture-related costs.
(8) Included for the second quarter 2013 are: 1) pre-tax gain of $223.7 million related to the sale of the Resin Business, 2) $2.9million in employee separation and restructuring costs, 3) acquisition and divestiture-related costs of $4.9 million, 4)environmental remediation costs of $1.3 million and 5) a gain related to the reimbursement of previously incurredenvironmental costs of $14.9 million.
(9) Included for the first quarter 2013 are: 1) $9.9 million in employee separation and restructuring costs 2) acquisition anddivestiture-related costs of $8.7 million, 3) environmental remediation costs of $2.0 million, 4) a gain related to thereimbursement of previously incurred environmental costs of $5.2 million and 5) $10.6 million in debt extinguishment costsrelated to the early retirement of our senior secured term loan.
78 POLYONE CORPORATION

ITEM 9. CHANGES IN AND DISAGREEMENTS WITH ACCOUNTANTS ON ACCOUNTING AND
FINANCIAL DISCLOSURE
None.
ITEM 9A. CONTROLS AND PROCEDURES
Disclosure controls and procedures
PolyOne’s management, with the participation of the Chief Executive Officer and the Chief FinancialOfficer, has evaluated the effectiveness of the design and operation of PolyOne’s disclosure controlsand procedures (as defined in Rules 13a-15(e) and 15d-15(e) under the Securities Exchange Act of1934) as of December 31, 2014. Based on this evaluation, the Chief Executive Officer and the ChiefFinancial Officer have concluded that our disclosure controls and procedures were effective as ofDecember 31, 2014.
Management’s annual report on internal control over financial reporting
The following report is provided by management in respect of PolyOne’s internal control over financialreporting (as defined in Rules 13a-15(f) and 15d-15(f) under the Securities Exchange Act of 1934):
1. PolyOne’s management is responsible for establishing and maintaining adequate internal controlover financial reporting.
2. Under the supervision of and with participation of PolyOne’s management, including the ChiefExecutive Officer and the Chief Financial Officer, we conducted an evaluation of the effectivenessof internal control over financial reporting as of December 31, 2014 based on the guidelinesestablished in Internal Control — Integrated Framework issued by the Committee of SponsoringOrganizations of the Treadway Commission (COSO) (2013 Framework). Management believesthat the COSO framework is a suitable framework for its evaluation of financial reporting becauseit is free from bias, permits reasonably consistent qualitative and quantitative measurements ofPolyOne’s internal control over financial reporting, is sufficiently complete so that those relevantfactors that would alter a conclusion about the effectiveness of PolyOne’s internal control overfinancial reporting are not omitted and is relevant to an evaluation of internal control over financialreporting.
3. Based on the results of our evaluation, management has concluded that such internal control overfinancial reporting was effective as of December 31, 2014. There were no material weaknesses ininternal control over financial reporting identified by management. The results of management’sassessment were reviewed with our Audit Committee.
4. Ernst & Young LLP, who audited the consolidated financial statements of PolyOne for the yearended December 31, 2014, also issued an attestation report on PolyOne’s internal control overfinancial reporting under Auditing Standard No. 5 of the Public Company Accounting OversightBoard. This attestation report is set forth on page 41 of this Annual Report on Form 10-K and isincorporated by reference into this Item 9A.
Changes in internal control over financial reporting
There were no changes in the Company’s internal control over financial reporting that occurred duringthe quarter ended December 31, 2014 that have materially affected, or are reasonably likely tomaterially affect, the Company’s internal control over financial reporting.
Limitations in internal control over financial reporting
Because of its inherent limitations, internal control over financial reporting may not prevent or detectmisstatements. Also, projections of any evaluation of effectiveness to future periods are subject to therisk that controls may become inadequate because of changes in conditions, or that the degree ofcompliance with the policies or procedures may deteriorate.
POLYONE CORPORATION 79

ITEM 9B. OTHER INFORMATION
None.
PART III
ITEM 10. DIRECTORS, EXECUTIVE OFFICERS AND CORPORATE GOVERNANCE
The information regarding PolyOne’s directors, including the identification of the audit committee andaudit committee financial experts, is incorporated by reference to the information contained inPolyOne’s Proxy Statement with respect to the 2015 Annual Meeting of Shareholders (2015 ProxyStatement). Information concerning executive officers is contained in Part I of this Annual Report onForm 10-K under the heading “Executive Officers of the Registrant.”
The information regarding Section 16(a) beneficial ownership reporting compliance is incorporated byreference to the material under the heading “Section 16(a) Beneficial Ownership ReportingCompliance” in the 2015 Proxy Statement.
The information regarding any changes in procedures by which shareholders may recommendnominees to PolyOne’s Board of Directors is incorporated by reference to the information contained inthe 2015 Proxy Statement.
PolyOne has adopted a code of ethics that applies to its principal executive officer, principal financialofficer and principal accounting officer. PolyOne’s code of ethics is posted under the Investor Relationstab of its website at www.polyone.com. PolyOne will post any amendments to, or waivers of, its code ofethics that apply to its principal executive officer, principal financial officer and principal accountingofficer on its website.
ITEM 11. EXECUTIVE COMPENSATION
The information regarding executive officer and director compensation is incorporated by reference tothe information contained in the 2015 Proxy Statement.
The information regarding compensation committee interlocks and insider participation and thecompensation committee report is incorporated by reference to the information contained in the 2015Proxy Statement.
ITEM 12. SECURITY OWNERSHIP OF CERTAIN BENEFICIAL OWNERS AND MANAGEMENT
AND RELATED SHAREHOLDER MATTER
The information about our equity compensation plans is incorporated by reference to informationcontained in the 2015 Proxy Statement.
The information regarding security ownership of certain beneficial owners and management isincorporated by reference to the information contained in the 2015 Proxy Statement.
ITEM 13. CERTAIN RELATIONSHIPS AND RELATED TRANSACTIONS, AND DIRECTOR
INDEPENDENCE
The information regarding certain relationships and related transactions and director independence isincorporated by reference to the information contained in the 2015 Proxy Statement.
ITEM 14. PRINCIPAL ACCOUNTANT FEES AND SERVICES
Information regarding fees paid to and services provided by PolyOne’s independent registered publicaccounting firm and the pre-approval policies and procedures of the audit committee is incorporated byreference to the information contained in the 2015 Proxy Statement.
80 POLYONE CORPORATION

PART IV
ITEM 15. EXHIBITS AND FINANCIAL STATEMENT SCHEDULES
(a)(1) Financial Statements:
The following consolidated financial statements of PolyOne Corporation are included in Item 8:
Consolidated Statements of Income for the years ended December 31, 2014, 2013 and 2012
Consolidated Statements of Comprehensive Income for the years ended December 31, 2014,2013 and 2012
Consolidated Balance Sheets at December 31, 2014 and 2013
Consolidated Statements of Cash Flows for the years ended December 31, 2014, 2013 and 2012
Consolidated Statements of Shareholders’ Equity for the years ended December 31, 2014, 2013and 2012
Notes to Consolidated Financial Statements
All other schedules for which provision is made in Regulation S-X of the SEC are not requiredunder the related instructions or are inapplicable and, therefore, have been omitted.
(a)(3) Exhibits.
Refer to the Exhibit Index, which is incorporated by reference herein.
POLYONE CORPORATION 81
SIGNATURES
Pursuant to the requirements of Section 13 or 15(d) of the Securities Exchange Act of 1934, theRegistrant has duly caused this report to be signed on its behalf by the undersigned, thereunto dulyauthorized.
POLYONE CORPORATION
February 13, 2015
BY: /S/ BRADLEY C. RICHARDSONBradley C. RichardsonExecutive Vice President and Chief Financial Officer(Principal Financial and Accounting Officer)
Pursuant to the requirements of the Securities Exchange Act of 1934, this report has been signedbelow by the following persons on behalf of the Registrant and in the capacities indicated and on thedates indicated.
Signature and Title
/S/ ROBERT M. PATTERSON
Robert M. Patterson
President and Chief Executive Officer and Director(Principal Executive Officer)
Date: February 13,2015
/S/ BRADLEY C. RICHARDSON
Bradley C. Richardson
Executive Vice President and Chief Financial Officer(Principal Financial and Accounting Officer)
Date: February 13,2015
/S/ STEPHEN D. NEWLIN
Stephen D. Newlin
Executive Chairman and Director Date: February 13,2015
/S/ RICHARD H. FEARON
Richard H. Fearon
Director Date: February 13,2015
/S/ GREGORY J. GOFF
Gregory J. Goff
Director Date: February 13,2015
/S/ GORDON D. HARNETT
Gordon D. Harnett
Director Date: February 13,2015
/S/ SANDRA BEACH LIN
Sandra Beach Lin
Director Date: February 13,2015
/S/ RICHARD A. LORRAINE
Richard A. Lorraine
Director Date: February 13,2015
/S/ WILLIAM H. POWELL
William H. Powell
Director Date: February 13,2015
/S/ KERRY J. PREETE
Kerry J. Preete
Director Date: February 13,2015
/S/ FARAH M. WALTERS
Farah M. Walters
Director Date: February 13,2015
/S/ WILLIAM A. WULFSOHN
William A. Wulfsohn
Director Date: February 13,2015
82 POLYONE CORPORATION
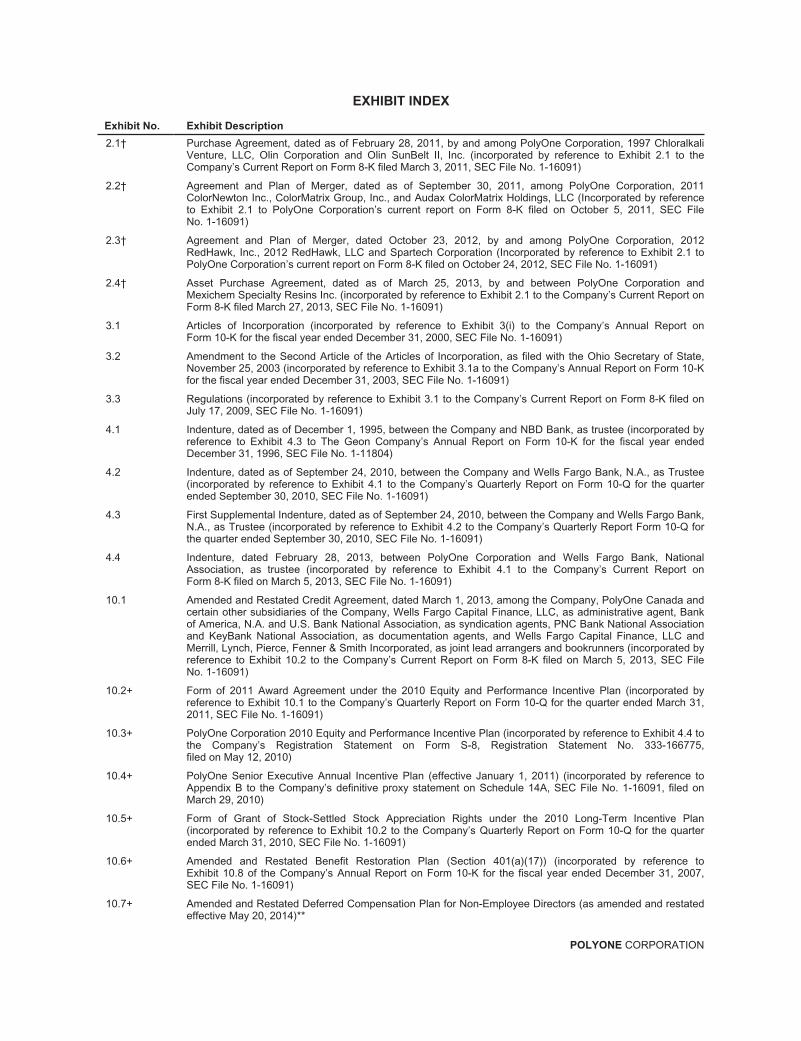
EXHIBIT INDEX
Exhibit No. Exhibit Description
2.1† Purchase Agreement, dated as of February 28, 2011, by and among PolyOne Corporation, 1997 ChloralkaliVenture, LLC, Olin Corporation and Olin SunBelt II, Inc. (incorporated by reference to Exhibit 2.1 to theCompany’s Current Report on Form 8-K filed March 3, 2011, SEC File No. 1-16091)
2.2† Agreement and Plan of Merger, dated as of September 30, 2011, among PolyOne Corporation, 2011ColorNewton Inc., ColorMatrix Group, Inc., and Audax ColorMatrix Holdings, LLC (Incorporated by referenceto Exhibit 2.1 to PolyOne Corporation’s current report on Form 8-K filed on October 5, 2011, SEC FileNo. 1-16091)
2.3† Agreement and Plan of Merger, dated October 23, 2012, by and among PolyOne Corporation, 2012RedHawk, Inc., 2012 RedHawk, LLC and Spartech Corporation (Incorporated by reference to Exhibit 2.1 toPolyOne Corporation’s current report on Form 8-K filed on October 24, 2012, SEC File No. 1-16091)
2.4† Asset Purchase Agreement, dated as of March 25, 2013, by and between PolyOne Corporation andMexichem Specialty Resins Inc. (incorporated by reference to Exhibit 2.1 to the Company’s Current Report onForm 8-K filed March 27, 2013, SEC File No. 1-16091)
3.1 Articles of Incorporation (incorporated by reference to Exhibit 3(i) to the Company’s Annual Report onForm 10-K for the fiscal year ended December 31, 2000, SEC File No. 1-16091)
3.2 Amendment to the Second Article of the Articles of Incorporation, as filed with the Ohio Secretary of State,November 25, 2003 (incorporated by reference to Exhibit 3.1a to the Company’s Annual Report on Form 10-Kfor the fiscal year ended December 31, 2003, SEC File No. 1-16091)
3.3 Regulations (incorporated by reference to Exhibit 3.1 to the Company’s Current Report on Form 8-K filed onJuly 17, 2009, SEC File No. 1-16091)
4.1 Indenture, dated as of December 1, 1995, between the Company and NBD Bank, as trustee (incorporated byreference to Exhibit 4.3 to The Geon Company’s Annual Report on Form 10-K for the fiscal year endedDecember 31, 1996, SEC File No. 1-11804)
4.2 Indenture, dated as of September 24, 2010, between the Company and Wells Fargo Bank, N.A., as Trustee(incorporated by reference to Exhibit 4.1 to the Company’s Quarterly Report on Form 10-Q for the quarterended September 30, 2010, SEC File No. 1-16091)
4.3 First Supplemental Indenture, dated as of September 24, 2010, between the Company and Wells Fargo Bank,N.A., as Trustee (incorporated by reference to Exhibit 4.2 to the Company’s Quarterly Report Form 10-Q forthe quarter ended September 30, 2010, SEC File No. 1-16091)
4.4 Indenture, dated February 28, 2013, between PolyOne Corporation and Wells Fargo Bank, NationalAssociation, as trustee (incorporated by reference to Exhibit 4.1 to the Company’s Current Report onForm 8-K filed on March 5, 2013, SEC File No. 1-16091)
10.1 Amended and Restated Credit Agreement, dated March 1, 2013, among the Company, PolyOne Canada andcertain other subsidiaries of the Company, Wells Fargo Capital Finance, LLC, as administrative agent, Bankof America, N.A. and U.S. Bank National Association, as syndication agents, PNC Bank National Associationand KeyBank National Association, as documentation agents, and Wells Fargo Capital Finance, LLC andMerrill, Lynch, Pierce, Fenner & Smith Incorporated, as joint lead arrangers and bookrunners (incorporated byreference to Exhibit 10.2 to the Company’s Current Report on Form 8-K filed on March 5, 2013, SEC FileNo. 1-16091)
10.2+ Form of 2011 Award Agreement under the 2010 Equity and Performance Incentive Plan (incorporated byreference to Exhibit 10.1 to the Company’s Quarterly Report on Form 10-Q for the quarter ended March 31,2011, SEC File No. 1-16091)
10.3+ PolyOne Corporation 2010 Equity and Performance Incentive Plan (incorporated by reference to Exhibit 4.4 tothe Company’s Registration Statement on Form S-8, Registration Statement No. 333-166775,filed on May 12, 2010)
10.4+ PolyOne Senior Executive Annual Incentive Plan (effective January 1, 2011) (incorporated by reference toAppendix B to the Company’s definitive proxy statement on Schedule 14A, SEC File No. 1-16091, filed onMarch 29, 2010)
10.5+ Form of Grant of Stock-Settled Stock Appreciation Rights under the 2010 Long-Term Incentive Plan(incorporated by reference to Exhibit 10.2 to the Company’s Quarterly Report on Form 10-Q for the quarterended March 31, 2010, SEC File No. 1-16091)
10.6+ Amended and Restated Benefit Restoration Plan (Section 401(a)(17)) (incorporated by reference toExhibit 10.8 of the Company’s Annual Report on Form 10-K for the fiscal year ended December 31, 2007,SEC File No. 1-16091)
10.7+ Amended and Restated Deferred Compensation Plan for Non-Employee Directors (as amended and restatedeffective May 20, 2014)**
POLYONE CORPORATION

Exhibit No. Exhibit Description
10.8+ Form of Management Continuity Agreement for Executive Officers prior to 2011 (incorporated by reference toExhibit 10.13 to the Company’s Annual Report on Form 10-K for the fiscal year ended December 31, 2007,SEC File No. 1-16091)
10.9+ Form of Management Continuity Agreement for Executive Officers after 2011 (incorporated by reference toExhibit 10.12 to the Company’s Annual Report on Form 10-K for the fiscal year ended December 31, 2013,SEC File No. 1-16091)
10.10+ Schedule of Executive Officers with Management Continuity Agreements**
10.11+ PolyOne Supplemental Retirement Benefit Plan (As Amended and Restated Effective January 1, 2014)(incorporated by reference to Exhibit 10.14 to the Company’s Annual Report on Form 10-K for the fiscal yearended December 31, 2013, SEC file No. 1-16091)
10.12+ Amended and Restated Letter Agreement, dated as of March 6, 2014, between the Company and Stephen D.Newlin, originally effective as of February 13, 2006 (incorporated by reference to Exhibit 10.1 to theCompany’s Quarterly Report on Form 10-Q for the quarter ended March 31, 2014, SEC File No. 1-16091)
10.13+ Assumption of Liabilities and Indemnification Agreement, dated March 1, 1993, amended and restated byAmended and Restated Assumption of Liabilities and Indemnification Agreement, dated April 27, 1993(incorporated by reference to Exhibit 10.14 to The Geon Company’s Annual Report on Form 10-K for thefiscal year ended December 31, 1996, SEC File No. 1-11804)
10.14+ Unconditional and Continuing Guaranty, between the Company and Olin Corporation and Sunbelt Chlor AlkaliPartnership (incorporated by reference to Exhibit 10(c) to The Geon Company’s Quarterly Report onForm 10-Q for the quarter ended September 30, 1996, SEC File No. 1-11804)
10.15+ Asset Contribution Agreement — PVC Partnership (Geon) (incorporated by reference to Exhibit 10.3 to TheGeon Company’s Current Report on Form 8-K filed on May 13, 1999, SEC File No. 1-11804)
10.16+ Form of 2007 Award Agreement for Stock-Settled Stock Appreciation Rights (incorporated by reference toExhibit 10.1 to the Company’s Quarterly Report on Form 10-Q for the quarter ended March 31, 2007, SECFile No. 1-16091)
10.17+ PolyOne Corporation 2008 Equity and Performance Incentive Plan (incorporated herein by reference toAppendix A to the Registrant’s proxy statement on Schedule 14A (SEC File No. 1-16091), filed on March 25,2008)
10.18+ Form of 2008 Award Agreement for Stock-Settled Stock Appreciation Rights (incorporated by reference toExhibit 10.2 to the Company’s Quarterly Report on Form 10-Q for the quarter ended March 31, 2008, SECFile No. 1-16091)
10.19+ First Amendment to The Geon Company Section 401(a)(17) Benefit Restoration Plan (December 31, 2007Restatement) (incorporated by reference to Exhibit 10.1 to the Company’s Quarterly Report on Form 10-Q forthe quarter ended March 31, 2009, SEC File No. 1-16091)
10.20+ Form of 2009 Grant of Stock-Settled Stock Appreciation Rights under the 2009 Long-Term Incentive Plan(incorporated by reference to Exhibit 10.4 to the Company’s Quarterly Report on Form 10-Q for the quarterended March 31, 2009, SEC File No. 1-16091)
10.21+ Executive Severance Plan, as amended and restated effective May 15, 2014 (incorporated by reference toExhibit 10.1 to the Company’s Quarterly Report on Form 10-Q for the quarter ended June 30, 2014, SEC FileNo. 1-16091)
10.22+ First Amendment to the PolyOne Corporation 2010 Equity and Performance Incentive Plan (incorporated byreference to Appendix A to the Company’s definitive proxy statement on Schedule 14A, SEC FileNo. 1-16091, filed on March 23, 2012)
10.23+ Form of 2012 Award Agreement under the PolyOne Corporation 2010 Equity and Performance Incentive Plan,as amended (incorporated by reference to Exhibit 10.38 to the Company’s Annual Report on Form 10-K forthe fiscal year ended December 31, 2012, SEC File No. 1-16091)
10.24+ Form of 2013 Award Agreement under the PolyOne Corporation 2010 Equity and Performance Incentive Plan,as amended (incorporated by reference to Exhibit 10.27 to the Company’s Annual Report on Form 10-K forthe fiscal year ended December 31, 2013, SEC File No. 1-16091)
10.25+ Form of Director and Officer Indemnification Agreement (incorporated by reference to Exhibit 10.1 to theCompany’s Current Report on Form 8-K filed on July 5, 2006, SEC File No. 1-16091)
10.26+ Form of 2014 Award Agreement under the PolyOne Corporation 2010 Equity and Performance Incentive Plan,as amended (incorporated by reference to Exhibit 10.2 to the Company’s Quarterly Report on Form 10-Q forthe quarter ended June 30, 2014, SEC File No. 1-16091)
21.1 Subsidiaries of the Company**
POLYONE CORPORATION
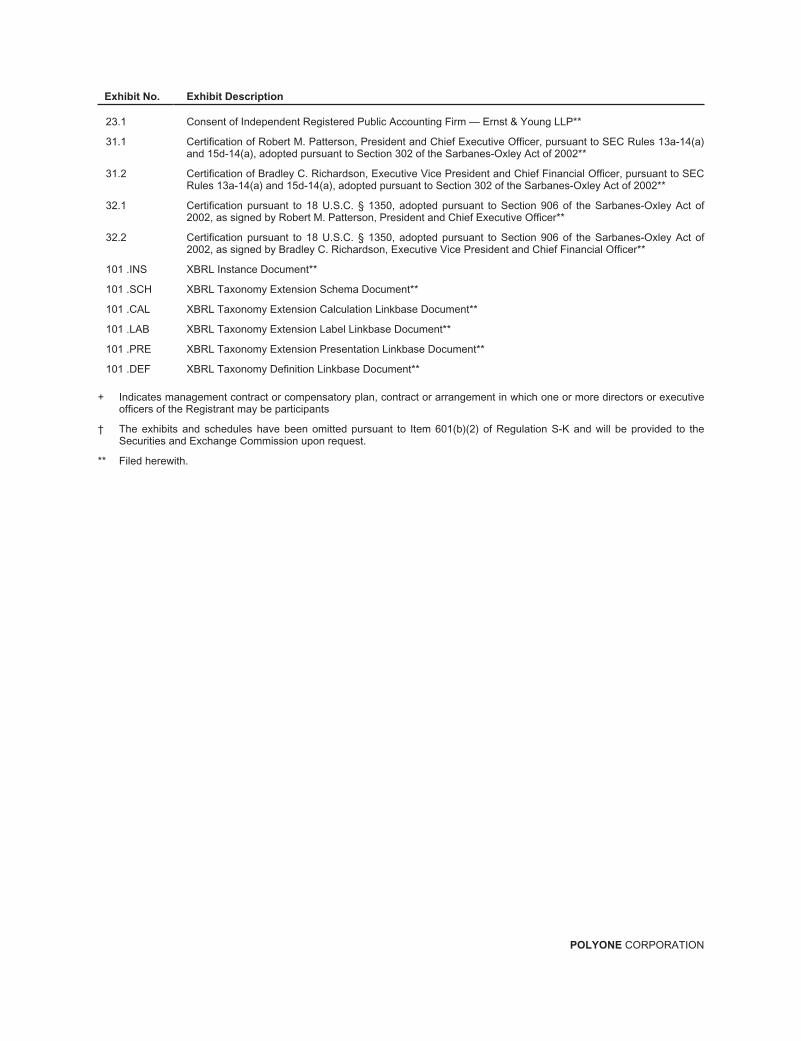
Exhibit No. Exhibit Description
23.1 Consent of Independent Registered Public Accounting Firm — Ernst & Young LLP**
31.1 Certification of Robert M. Patterson, President and Chief Executive Officer, pursuant to SEC Rules 13a-14(a)and 15d-14(a), adopted pursuant to Section 302 of the Sarbanes-Oxley Act of 2002**
31.2 Certification of Bradley C. Richardson, Executive Vice President and Chief Financial Officer, pursuant to SECRules 13a-14(a) and 15d-14(a), adopted pursuant to Section 302 of the Sarbanes-Oxley Act of 2002**
32.1 Certification pursuant to 18 U.S.C. § 1350, adopted pursuant to Section 906 of the Sarbanes-Oxley Act of2002, as signed by Robert M. Patterson, President and Chief Executive Officer**
32.2 Certification pursuant to 18 U.S.C. § 1350, adopted pursuant to Section 906 of the Sarbanes-Oxley Act of2002, as signed by Bradley C. Richardson, Executive Vice President and Chief Financial Officer**
101 .INS XBRL Instance Document**
101 .SCH XBRL Taxonomy Extension Schema Document**
101 .CAL XBRL Taxonomy Extension Calculation Linkbase Document**
101 .LAB XBRL Taxonomy Extension Label Linkbase Document**
101 .PRE XBRL Taxonomy Extension Presentation Linkbase Document**
101 .DEF XBRL Taxonomy Definition Linkbase Document**
+ Indicates management contract or compensatory plan, contract or arrangement in which one or more directors or executiveofficers of the Registrant may be participants
† The exhibits and schedules have been omitted pursuant to Item 601(b)(2) of Regulation S-K and will be provided to theSecurities and Exchange Commission upon request.
** Filed herewith.
POLYONE CORPORATION
Exhibit 31.1
CERTIFICATION
I, Robert M. Patterson, certify that:
1. I have reviewed this Annual Report on Form 10-K of PolyOne Corporation;
2. Based on my knowledge, this report does not contain any untrue statement of a material fact or omit to state a material factnecessary to make the statements made, in light of the circumstances under which such statements were made, not misleadingwith respect to the period covered by this report;
3. Based on my knowledge, the financial statements, and other financial information included in this report, fairly present in allmaterial respects the financial condition, results of operations and cash flows of the registrant as of, and for, the periodspresented in this report;
4. The registrant’s other certifying officer(s) and I are responsible for establishing and maintaining disclosure controls andprocedures (as defined in Exchange Act Rules 13a-15(e) and 15d-15(e)) and internal control over financial reporting (as definedin Exchange Act Rules 13a-15(f) and 15d-15(f)) for the registrant and have:
(a) Designed such disclosure controls and procedures, or caused such disclosure controls and procedures to be designedunder our supervision, to ensure that material information relating to the registrant, including its consolidated subsidiaries, ismade known to us by others within those entities, particularly during the period in which this report is being prepared;
(b) Designed such internal control over financial reporting, or caused such internal control over financial reporting to bedesigned under our supervision, to provide reasonable assurance regarding the reliability of financial reporting and thepreparation of financial statements for external purposes in accordance with generally accepted accounting principles;
(c) Evaluated the effectiveness of the registrant’s disclosure controls and procedures and presented in this report ourconclusions about the effectiveness of the disclosure controls and procedures, as of the end of the period covered by thisreport based on such evaluation; and
(d) Disclosed in this report any change in the registrant’s internal control over financial reporting that occurred during theregistrant’s most recent fiscal quarter (the registrant’s fourth fiscal quarter in the case of an annual report) that has materiallyaffected, or is reasonably likely to materially affect, the registrant’s internal control over financial reporting; and
5. The registrant’s other certifying officer(s) and I have disclosed, based on our most recent evaluation of internal control overfinancial reporting, to the registrant’s auditors and the audit committee of the registrant’s board of directors (or personsperforming the equivalent functions):
(a) All significant deficiencies and material weaknesses in the design or operation of internal control over financial reportingwhich are reasonably likely to adversely affect the registrant’s ability to record, process, summarize and report financialinformation; and
(b) Any fraud, whether or not material, that involves management or other employees who have a significant role in theregistrant’s internal control over financial reporting.
/s/ Robert M. Patterson
Robert M. PattersonPresident and Chief Executive Officer
February 13, 2015
POLYONE CORPORATION

Exhibit 31.2
CERTIFICATION
I, Bradley C. Richardson, certify that:
1. I have reviewed this Annual Report on Form 10-K of PolyOne Corporation;
2. Based on my knowledge, this report does not contain any untrue statement of a material fact or omit to state a material factnecessary to make the statements made, in light of the circumstances under which such statements were made, not misleadingwith respect to the period covered by this report;
3. Based on my knowledge, the financial statements, and other financial information included in this report, fairly present in allmaterial respects the financial condition, results of operations and cash flows of the registrant as of, and for, the periodspresented in this report;
4. The registrant’s other certifying officer(s) and I are responsible for establishing and maintaining disclosure controls andprocedures (as defined in Exchange Act Rules 13a-15(e) and 15d-15(e)) and internal control over financial reporting (as definedin Exchange Act Rules 13a-15(f) and 15d-15(f)) for the registrant and have:
(a) Designed such disclosure controls and procedures, or caused such disclosure controls and procedures to be designedunder our supervision, to ensure that material information relating to the registrant, including its consolidated subsidiaries, ismade known to us by others within those entities, particularly during the period in which this report is being prepared;
(b) Designed such internal control over financial reporting, or caused such internal control over financial reporting to bedesigned under our supervision, to provide reasonable assurance regarding the reliability of financial reporting and thepreparation of financial statements for external purposes in accordance with generally accepted accounting principles;
(c) Evaluated the effectiveness of the registrant’s disclosure controls and procedures and presented in this report ourconclusions about the effectiveness of the disclosure controls and procedures, as of the end of the period covered by thisreport based on such evaluation; and
(d) Disclosed in this report any change in the registrant’s internal control over financial reporting that occurred during theregistrant’s most recent fiscal quarter (the registrant’s fourth fiscal quarter in the case of an annual report) that has materiallyaffected, or is reasonably likely to materially affect, the registrant’s internal control over financial reporting; and
5. The registrant’s other certifying officer(s) and I have disclosed, based on our most recent evaluation of internal control overfinancial reporting, to the registrant’s auditors and the audit committee of the registrant’s board of directors (or personsperforming the equivalent functions):
(a) All significant deficiencies and material weaknesses in the design or operation of internal control over financial reportingwhich are reasonably likely to adversely affect the registrant’s ability to record, process, summarize and report financialinformation; and
(b) Any fraud, whether or not material, that involves management or other employees who have a significant role in theregistrant’s internal control over financial reporting.
/s/ Bradley C. Richardson
Bradley C. RichardsonExecutive Vice President and Chief Financial Officer
February 13, 2015
POLYONE CORPORATION

Exhibit 32.1
CERTIFICATION PURSUANT TO
18 U.S.C. SECTION 1350,
AS ADOPTED PURSUANT TO
SECTION 906 OF THE SARBANES-OXLEY ACT OF 2002
In connection with the Annual Report on Form 10-K of PolyOne Corporation (the “Company”) for the year ended December 31,2014, as filed with the Securities and Exchange Commission on the date hereof (the “Report”), I, Robert M. Patterson, Presidentand Chief Executive Officer of the Company, do hereby certify, pursuant to 18 U.S.C. § 1350, as adopted pursuant to § 906 ofthe Sarbanes-Oxley Act of 2002, that, to my knowledge:
(1) The Report fully complies with the requirements of Section 13(a) or 15(d) of the Securities Exchange Act of 1934; and
(2) The information contained in the Report fairly presents, in all material respects, the financial condition and results ofoperations of the Company as of the dates and for the periods expressed in the Report.
/s/ Robert M. Patterson
Robert M. PattersonPresident and Chief Executive Officer
February 13, 2015
The foregoing certification is being furnished solely pursuant to 18 U.S.C. § 1350 and is not being filed as part of the Report or asa separate disclosure document.
POLYONE CORPORATION

Exhibit 32.2
CERTIFICATION PURSUANT TO
18 U.S.C. SECTION 1350,
AS ADOPTED PURSUANT TO
SECTION 906 OF THE SARBANES-OXLEY ACT OF 2002
In connection with the Annual Report on Form 10-K of PolyOne Corporation (the “Company”) for the year ended December 31,2014, as filed with the Securities and Exchange Commission on the date hereof (the “Report”), I, Bradley C. Richardson,Executive Vice President and Chief Financial Officer of the Company, do hereby certify, pursuant to 18 U.S.C. § 1350, asadopted pursuant to § 906 of the Sarbanes-Oxley Act of 2002, that, to my knowledge:
(1) The Report fully complies with the requirements of Section 13(a) or 15(d) of the Securities Exchange Act of 1934; and
(2) The information contained in the Report fairly presents, in all material respects, the financial condition and results ofoperations of the Company as of the dates and for the periods expressed in the Report.
/s/ Bradley C. Richardson
Bradley C. RichardsonExecutive Vice President and Chief Financial Officer
February 13, 2015
The foregoing certification is being furnished solely pursuant to 18 U.S.C. § 1350 and is not being filed as part of the Report or as
a separate disclosure document.
POLYONE CORPORATION

STOCK EXCHANGE LISTING
PolyOne's Common Stock is listed on the New York Stock Exchange, Symbol: POL.
SHAREHOLDER INQUIRIES
If you have any questions concerning your account as a shareholder, name or address changes, inquiries regarding stock certificates, or if you need tax information regarding your account, please contact our transfer agent:
Wells Fargo Shareowner Services1110 Centre Pointe Curve, Suite 101Mendota Heights, MN 55120-4100Phone: 1-855-598-2615www.shareowneronline.com
Additional information about PolyOne, including current and historic copies of Annual
Reports on Form 10-K and other reports filed with the Securities and Exchange
Commission, is available online at www.polyone.com or free of charge from:
Investor Affairs AdministratorPolyOne Corporation33587 Walker RoadAvon Lake, Ohio 44012Phone: 440-930-1522
ANNUAL MEETING
The annual meeting of shareholders of PolyOne will be held May 14, 2015 at 9:00 a.m. at PolyOne’s Corporate headquarters, 33587 Walker Road, Avon Lake, Ohio. The meeting notice and proxy materials were mailed to shareholders with this annual report. PolyOne urges all shareholders to vote their proxies so that they can participate in the decisions at the annual meeting.
FINANCIAL INFORMATION
Security analysts and representatives of financial institutions are invited to contact:
Eric SwansonDirector, Investor RelationsPhone: 440-930-1013Fax: 440-930-1446Email: [email protected]
AUDITORS
Ernst & Young LLP950 Main Ave., Suite 1800Cleveland, OH 44113
INTERNET ACCESS
Information on PolyOne’s products and services, news releases, corporate governance, EDGAR filings, Reports on Forms 10-K and 10-Q, etc. as well as an electronic version of this annual report, are available on the Internet at www.polyone.com.
PolyOne Stock Performance
The following is a graph that compares the cumulative total shareholder returns for PolyOne’s common shares, the S&P 500 index
and the S&P Mid Cap Chemicals index, with dividends assumed to be reinvested when received. The graph assumes the investing of
$100 from December 31, 2009 through December 31, 2014. The S&P Mid Cap Chemicals index includes a broad range of chemical
manufacturers. Because of the relationship of PolyOne’s business within the chemical industry, comparison with this broader index
is appropriate.
THIS PAGE IS NOT PART OF POLYONE’S FORM 10-K FILING

STEPHEN D. NEWLIN
Executive Chairman
ROBERT M. PATTERSON
President and
Chief Executive Officer
BRADLEY C. RICHARDSON
Executive Vice President,
Chief Financial Officer
ROBERT T. BINDNER
Vice President, Asia
MARK D. CRIST
Senior Vice President,
President of Distribution
GIUSEPPE DI SALVO
Vice President,
Corporate Controller
CATHY K. DODD
Vice President, Marketing
JAVIER A. ECHEVARRIA
Vice President, Global Sourcing
MICHAEL A. GARRATT
Senior Vice President,
President of Performance
Products and Solutions
AVERY L. JOHNSON
Vice President, Tax
MICHAEL E. KAHLER
Senior Vice President,
Chief Commercial Officer
HOLGER KRONIMUS
Vice President, Europe,
General Manager, Engineered
Materials Europe
LISA K. KUNKLE
Senior Vice President,
General Counsel and Secretary
SCOTT J. LEFFLER
Vice President, Treasurer
JULIE A. MCALINDON
Senior Vice President, President of
Designed Structures and Solutions
M. JOHN MIDEA, JR.
Senior Vice President,
Global Operations and
Process Improvement
DR. CHRISTOPHER MURPHY
Vice President, Research and
Development, Chief Innovation
Officer
CRAIG M. NIKRANT
Senior Vice President,
President of Global Specialty
Engineered Materials
ANA G. RODRIGUEZ
Senior Vice President,
Chief Human Resources Officer
KURT C. SCHUERING
Vice President, Global Key
Account Management
JOHN V. VAN HULLE
Senior Vice President, President of
Global Color Additives and Inks
CORPORATE OFFICERS BOARD OF DIRECTORS
STEPHEN D. NEWLIN
Executive Chairman,
PolyOne Corporation
Committee: 3
ROBERT M. PATTERSON
President and Chief Executive
Officer, PolyOne Corporation
Committee: 3
RICHARD H. FEARON
Vice Chairman and Chief
Financial and Planning Officer,
Eaton
Committees: 1*, 4
GREGORY J. GOFF
President and Chief Executive
Officer, Tesoro Corporation and
Chairman and Chief Executive
Officer, Tesoro Logistics
Committees: 3*, 4
GORDON D. HARNETT
Lead Director, PolyOne Corporation;
Retired Chairman and Chief
Executive Officer, Materion Corp.
(formerly Brush Engineered
Materials, Inc.)
Committees: 1, 2, 4*
SANDRA B. LIN
Retired President, Chief Executive
Officer and Director, Calisolar Inc.
(now Silico Materials)
Committees: 1, 3
RICHARD A. LORRAINE
Retired Senior Vice President
and Chief Financial Officer,
Eastman Chemical Company
Committees: 1, 4
WILLIAM H. POWELL
Retired Chairman and Chief
Executive Officer, National Starch
and Chemical Company
Committee: 2*
KERRY J. PREETE
Executive Vice President, Global
Strategy, Monsanto Company
Committees: 2, 3
FARAH M. WALTERS
President and Chief Executive
Officer, QualHealth, LLC
Committees: 2, 4
WILLIAM A. WULFSOHN
Chairman and Chief Executive
Officer, Ashland Inc.
Committee: 2
COMMITTEES
1. Audit
2. Compensation
3. Environmental, Health and Safety
4. Nominating & Governance
* Denotes Chairperson
PolyOne Corporation Board of Directors (Left to Right): Sandra B. Lin, William H. Powell, Richard H. Fearon, William A. Wulfsohn, Stephen D. Newlin,
Kerry J. Preete, Robert M. Patterson, Gordon D. Harnett, Farah M. Walters, Richard A. Lorraine and Gregory J. Goff

Annual Report 2014