collaborative phenotype inference from comorbid …jis10006/doc/pub/bibm-lu-2017.pdf · method,...
TRANSCRIPT

Collaborative Phenotype Inference from Comorbid
Substance Use Disorders and Genotypes
Jin Lu∗, Jiangwen Sun∗, Xinyu Wang∗, Henry R. Kranzler†, Joel Gelernter‡ and Jinbo Bi∗
∗Department of Computer Science and Engineering, University of Connecticut, Storrs, Connecticut†Department of Psychiatry, University of Pennsylvania Perelman School of Medicine, Philadelphia, Pennsylvania
‡Departments of Psychiatry, Genetics, and Neurobiology, Yale University School of Medicine, New Haven, Connecticut
Email: jin.lu,jiangwen.sun,xinyu.wang,[email protected], [email protected], [email protected]
Abstract—Data in large-scale genetic studies of complex humandiseases, such as substance use disorders, are often incomplete.Despite great progress in genotype imputation, e.g., the IMPUTE2method, considerably less progress has been made in inferringphenotypes. We designed a novel approach to integrate individu-als’ comorbid conditions with their genotype data to infer missing(unreported) diagnostic criteria of a disorder. The premise ofour approach derives from correlations among symptoms andthe shared biological bases of concurrent disorders such asco-dependence on cocaine and opioids. We describe a matrixcompletion method to construct a bi-linear model based onthe interactions of genotypes and known symptoms of relateddisorders to infer unknown values of another set of symptoms orphenotypes. An efficient stochastic and parallel algorithm basedon the linearized alternating direction method of multipliers wasdeveloped to solve the proposed optimization problem. Empiricalevaluation of the approach in comparison with other advanceddata matrix completion methods via a case study shows thatit both significantly improves imputation accuracy and providesgreater computational efficiency.
I. INTRODUCTION
Illicit drug use is very common in the United States and is
associated with serious health and social problems [1]. Studies
have shown that substance use disorders (SUDs) are heritable
[2], [3], [4]. However, association studies aiming at identifying
their genetic causes to date have been unsuccessful due to mul-
tiple factors, especially inadequate sample size [5]. In many
datasets aggregated for genetic studies of mixed substance de-
pendence, genetic data are often available for subjects exposed
to one substance but not another [6]. These subjects are often
excluded from the study because either they had no exposure to
the substance or provided no reports of related symptoms [7],
[6]. Dependence on different illicit drugs is correlated, both
phenomenologically and biologically. Recent advances in the
neurobiology of addiction have shown that many substances
affect the same biological process, including reward, stress
resiliency and executive cognitive control [8]. Many substance
users use multiple drugs, resulting in comorbid dependence
disorders [9], [10]. Sample size is essential to ensure adequate
statistical power in genome-wide association studies (GWAS).
The capability of expanding sample size by inferring missing
phenotypes using the comorbidity among SUDs and shared
genetic factors could be very helpful statistically. In this paper,
we designed and evaluated such a statistical approach.
The problem of inferring diagnostic criteria of comorbid
SUDs (CSUDs) can be considered to be analogous to a
recommender system that predicts the preference of a us-
er to a product with known preference for other products.
We similarly would like to predict if a patient endorse a
symptom based on the endorsement of other symptoms. By
organizing the ratings of different users (rows) for various
items (columns) into a matrix, a recommender system uses
matrix completion methods to infer missing ratings. Similarly,
by organizing symptoms of patients with a disorder into a
matrix (as shown in Figure 1), we can use a matrix completion
method to infer missing phenotypes. Classical matrix comple-
tion methods [11], [12] make use of the observation that the
matrices to be completed are low rank (because similar users
give similar ratings to similar products). Hence these methods
search for solutions that minimize the rank of the completed
matrix. Because similar patients may endorse similar symp-
toms, matrices that we seek to complete are expected to be
low rank as well, so classic matrix completion methods may
be applicable to our problem. However, these methods do not
utilize additional useful information, such as associated genetic
variants or known similarities between comorbid disorders,
which is often referred to as side or auxiliary information in
matrix completion. Therefore, classical methods may not be
effective in solving our problem.
Recently matrix completion methods were proposed to
make use of side information. Most of these methods are
either non-convex [13], [14], or restricted in their use of
side data to only in the minimization of matrix rank [15],
[16], [17], leading to ambiguous or suboptimal solutions.
A recent method completes a matrix F by considering the
features (X) describing row entities (e.g., users), side features
(Y) describing column entities (e.g., products), and their
interactions (XTGY) where G contains model parameters
used in the inference model [18]. The optimization problem of
this method is convex and the model parameter matrix G is not
limited to being low rank. By a sampling rate of O(logN), this
approach could achieve exact recovery when the side features
span the latent space of the matrix F, and an ǫ-recovery when
the side features are corrupted by perturbation. However, this
method has limited scalability, and thus is difficult to be used
in genetic studies with hundreds of symptoms or millions
of genotypes. In this paper, we propose a novel stochastic

Fig. 1: Collaborative inference of CSUD diagnostic criteria using side information. Two sources including genotypes X and
criterion similarity or correlation Y are integrated in a bi-linear model that predicts unreported diagnostic criteria. The matrix
G captures the impact of the side features on the criteria to be inferred.
algorithm that is parallelized in a shared memory to solve the
same optimization problem proposed in [18]. This algorithm
can be proved to have global convergence and a sub-linear
learning rate.
Figure 1 illustrates how we use our matrix completion
method to infer missing phenotypes. Here, F is the phenotype
matrix to be completed with rows representing patients and
columns representing symptoms of a disorder, X contains
genetic variants from different patients, Y characterizes sim-
ilarities or correlations between each criterion of the disorder
and criteria of other disorders. The inference model is in the
form of XTGY+N = F where N captures any random effect
from environment on the phenotype. The genetic variants in
X are first identified through a GWAS. We use the proposed
algorithm to determine G which is then used to infer missing
phenotypes. We evaluated this approach in both simulations
and the analysis of real world CSUD datasets and compared
it with several state-of-the-art matrix completion methods.
The following notation is used throughout the paper. A
vector is denoted by a bold lower case letter as in v and ‖v‖prepresents its ℓp-norm that is defined by ‖v‖p = (|v(1)|p +· · ·+ |v(d)|p)1/p, where v(i) is the i-th index entry within the
vector of v and d is the length of v, also written as length(v).A matrix is denoted by a bold upper case letter, e.g., Mn×d
is a n-by-d matrix, and ‖M‖F is its Frobenius norm.
II. RELATED WORKS
A recommender system, such as the Netflix movie recom-
mendations, commonly uses collaborative filtering, or matrix
completion, where the goal is to ‘complete’ the user-item
rating matrix given a limited number of observed ratings. With
the low-rank assumption of true underlying matrix, matrix
completion methods require only the partially observed data
in the matrix F and solve the following problem [11], [12]minE ‖E‖∗, subject to RΩ(E) = RΩ(F), (1)
where F ∈ Rm×n is the partially observed low-rank
matrix (with a rank of r) that needs to be recovered, Ω ⊆1, · · · ,m × 1, · · · , n be the set of indexes where the
corresponding components in F are observed, the mapping
RΩ(M): Rm×n → Rm×n gives another matrix whose (i, j)-
th entry is Mi,j if (i, j) ∈ Ω (or 0 otherwise), and ‖E‖∗computes the nuclear norm of E.
Several works utilize side features in their methods [13],
[14] based on non-convex matrix factorization formulations
with no theoretical guarantees. Three most recent methods
have proposed convex formulations, which make it possible for
them to have theoretical guarantees on matrix recovery [16],
[17]. These methods all construct an inductive model XTGY
so that RΩ(XTGY) = RΩ(F) where the side matrices X and
Y consist of side features, respectively, for the row entities
(e.g., users) and column entities (e.g., movies) of a (rating)
matrix F. This inductive model has a parameter matrix G
that is either required to be sufficiently low rank [15] or to
have a minimal nuclear norm ‖G‖∗ [16]. With a very strong
assumption that both X and Y are orthonormal matrices, and
respectively in the latent column and row space of the matrix
F, the method in [16] was proved to be likely to achieve an
exact recovery of F with low sampling rate.
Another recent work [17] improves [16] by introducing a
residual matrix N to handle the noisy side features. This
method constructs an inductive model in the form of XTGY+N to approximate F and requires both G and N to be low
rank. An unnecessarily strong condition of the low-rank G
is assumed because although a low-rank G leads to a low-
rank F, a low-rank F does not require a low-rank G. Hence,
we propose another method in [18] that removes this strong
assumption. We will briefly revisit this approach in Section
IV-B.
III. DATA DESCRIPTION
A total of 7,189 subjects were aggregated from family
and case-control based genetic studies of cocaine use dis-
order (CUD) and opioid use disorder (OUD). Subjects were
recruited at five sites: Yale University School of Medicine,
the University of Connecticut Health Center, the University
of Pennsylvania Perelman School of Medicine, the Medical

TABLE I: Sample size by study and raceAfrican America European America
CUD association, microarray 2,718 2,037CUD association, exome sequencing 940 1,395OUD association, microarray 1,398 1,756OUD association, exome sequencing 540 1,190Phenome inference 1,149 2,292
University of South Carolina, and McLean Hospital. The
institutional review board at each site approved the study
protocol and informed consent forms. The National Institute on
Drug Abuse and the National Institute on Alcohol Abuse and
Alcoholism each provided a Certificate of Confidentiality to
protect participants. Subjects were paid for their participation.
Among the total 7,189 subjects, 7,008 had cocaine exposure
and were included in a GWAS of CUD and 4,843 had opioid
exposure and were used in a GWAS of OUD. In total, 4,662
subjects had both exposures. Of that number, 3,441 subjects
that had used an opioid more than 11 times were used in
the evaluation of our approach to infer opioid use behaviors.
Statistics for these datasets can be found in Table I.
Phenotypic information was obtained by face-to-face in-
terview using the Semi-Structured Assessment for Drug De-
pendence and Alcoholism (SSADDA), a computer-assisted
interview comprised of 26 sections (including sections for
both cocaine and opioids) that yields diagnoses of various
SUDs and Axis I psychiatric disorders, as well as antisocial
personality disorder [19] For the DSM-5 diagnosis of CUD,
OUD or SUD in general, 11 criteria, which can be clustered
into four groups: impaired control, social impairment, risky
use and pharmacological effects. The criteria for CUD and
OUD were evaluated using questions from the SSADDA
cocaine and opioid sections, respectively. In this study, we
aimed to impute data for the 11 criteria for the drug that
subjects had no prior exposure based on the criteria that they
met for the use of other drugs. For example, we imputed
cocaine use criteria from opioid use criteria, or vice-versa. In
order to have groundtruth to evaluate the proposed and other
compared methods, we include subjects for whom we have
both cocaine and opioid (i.e., 3,441) symptoms.
Most of the sample subjects were genotyped using one
of two different methods: Illumina HumanOmni1-Quad v1.0
microarray (MA) or exome sequencing (ES). There were
total of 4,821 subjects genotyped with MA and 2,450 with
ES. See [6] for details regarding the genotyping and variant
calling. Genotypes were imputed with IMPUTE2 [20] using
the genotyped variants and the 1000 Genomes reference panel
(http://www.1000genomes.org/; released June 2011). For both
the MA and ES sample, a total of 47,104,916 variants were
imputed. We considered the imputed variants with r2 > 0.8.
IV. METHOD
We describe the two steps in our proposed analysis where
we first identified genetic variants in a GWAS and then used
the identified genetic variants in a matrix completion method
to complete a phenotype data matrix.
A. Finding genetic variants associated with CUD and OUD
The genetic relationship (GR) between each pair of subjects
was evaluated with LDAK4 [21]. The evaluation was done
separately in the MA and ES samples, and included only com-
mon variants with minor allele frequency (MAF) ≥ 0.03 and
with a very high imputation quality (with r2 ≥ 0.99). There
were 3,140,006 single nucleotide polymorphisms (SNPs) for
MA and 604,884 for ES included in the GR estimation.
The estimated GR matrix was used in subsequent association
analyses to account for the population effect from genetic
correlation.
To verify and correct the misclassification of self-reported
race, we compared the MA (and ES) data from all subjects
with genotypes from the HapMap 3 reference populations:
CEU, YRI, and CHB. We conducted principal components
(PC) analysis in the sample using PLINK [22] with 489,697
(91,089) SNPs common to those included in the GR evaluation
in the MA (ES) dataset and HapMap panel [after pruning the
MA (ES) SNPs for linkage disequilibrium (LD), defined as
r2 > 80%] to characterize the underlying genetic architecture
of the sample. The first PC scores distinguished African
Americans (AAs) and European Americans (EAs), for which
association analysis was done separately. The first three PCs
were used in the analysis of each population to correct for
residual population stratification.
The CUD (or OUD) criterion count was derived by counting
the number of criteria endorsed out of the 11 DSM-5 criteria
and was used in the GWAS to identify genetic variants. We ran
the genomewide efficient mixed model association (GEMMA)
method [23] to conduct association tests with sex and age,
as well as the first three PCs being covariates. We combined
the results from all eight studies (with the two different traits
[CUD or OUD], datasets [MA or ES], or populations [AAs or
EAs]) via meta analysis using METAL [24]. Genetic variants
with meta P-value < 1 × 10⁻⁵ were used as side features in
the subsequent phenotype inference.
B. Matrix completion with side information
We briefly review the formulation of the matrix comple-
tion method in [18]. This method integrates the side in-
formation into the formulation by explicitly building a bi-
linear predictive model that predicts missing components in
the matrix (F) using side features. Mathematically, we have
f = xTHy + xTu + yTv + g, where x and y are the side
feature vectors of a patient and a symptom, respectively, and
u,v, g and H are model parameters. By defining x = [xT 1]T ,
y = [yT 1]T and G(a=d1+1)×(b=d2+1) =
(
H u
vT g
)
, the
above equation can be simplified to: f = xTGy. We solve
the following overall problem formulation for the best G:
minG,E
1
2‖XT
GY −E‖2F + λE‖E‖∗ + λGg(G),
subject to RΩ(E) = RΩ(F).(2)
where E is a completed version of F. The X and Y here are
matrices that are created by stacking one row of all ones to the


where we can re-organize this subproblem in a simpler form
as:
minE
λE‖E‖∗ +β
2‖RΩ(E−B
k2)‖
2F +
β
2‖E−B
k3‖
2F
where Bk2 = RΩ(F−Mk
1/β) and Bk3 = XTGk+1Y+Ck −
Mk2/β. Via the same linearization technique, the problem can
be approximated by:
minE
λE‖E‖∗ +βτB2
‖E− (Ek − fk2 /τB)‖
2F
+βτB2
‖E− (Ek − fk3 /τB)‖
2F
where fk2 and fk
3 are the gradients of 12‖RΩ(E−Bk
2)‖2F and12‖E−Bk
3‖2F at Ek, which are illustrated below:
fk2 = RΩ(E
k −Bk2) = RΩ(E
k − F+Mk1/β),
fk3 = E
k −Bk3 = E
k −XTG
k+1Y −C
k +Mk2/β.
(6)
Therefore, the closed-form solution can be obtained as
Ek+1 = SV T (Ek − (fk
2 + fk3 )/(2τB), λE/2(βτB))
Here the operator SV T (E, t) is defined in [11] for soft-
thresholding the singular values of an arbitrary matrix E by
t.Updating M:
Mk+11 =M
k1 + β(RΩ(E
k+1 − F)),
Mk+12 =M
k2 + β(Ek+1 −X
TG
k+1Y −C
k+1).
Algorithm 1 summarizes the StoLADMM steps for the
variables of (C,E,G,M1,M2).
Algorithm 1 The StoLADMM algorithm to solve Ck, Gk,
Ek, k = 1, ...,K
Input: X, Y and RΩ(F) with parameters λG, λE , τA, τB ,
ρ and βmax.
Output: C,G,E;
1: Initialize E0,G0,M01,M
02. Compute A = YT ⊗XT . k =
0,
repeat;
2: Ck+1 = β
β+1(Ek −XTGkY +Mk
2/β);
3: Gk+1 = reshape(max(|gk − fk1 /τA| −
λG
τAβ, 0) ⊙ sgn(gk −
fk1 /τA)) where fk
1 can be computed by (5);
4: Ek+1 = SV T (Ek− (fk2 +fk
3 )/(2τB), λE/2(βτB)) where fk2
and fk3 can be computed by (6);
5: Mk+11 = Mk
1 + β(RΩ(Ek+1 − F)).
6: Mk+12 = Mk
2 + β(Ek+1 −XTGk+1Y −Ck+1).
7: k = k + 1 until convergence;
Return C,G,E;
It is beneficial that our algorithm has an O(1/√t) conver-
gence rate, the same as the convergence rate as proved in [26],
which guarantees our algorithm’s performance while saving
considerable memory and computational costs. In Algorithm 1
we set the sampling block size s to max (1,√
length(g)/100).τA < ‖A‖, τB < ‖RΩ(F)‖ and β = 0.01 as the preferable
values [25] in practice. In the initialization step, M01 and M0
2
are randomly drawn from the standard Gaussian distribution;
we initialize E0 and G0 by the iterative soft-thresholding
algorithm [27] and SV T operator respectively.
q StoLADMM LADMM DirtyIMC IMC MAXIDE BM
20%RMSEtime(s)
0.23630.938
0.231664.515
0.29745.366
0.230
21.053
0.2354732.718
0.567NaN
40%RMSEtime(s)
0.226
29.9530.234
982.2120.298
21.0630.235
20.803
0.2363772.202
0.582NaN
60%RMSEtime(s)
0.228
28.7190.236
815.8410.301
20.269
0.23736.737
0.2354718.916
0.581NaN
80%RMSEtime(s)
0.23630.547
0.237877.886
0.30323.906
0.23932.872
0.2414011.692
0.585NaN
100%RMSEtime(s)
0.223
30.1720.239
489.7700.303
22.922
0.24624.653
0.2423695.292
0.574NaN
TABLE II: The inference results on the Opioid-Cocaine data.
VI. EVALUATION
We compared the proposed method with other matrix com-
pletion approaches that also use side information, including:
MAXIDE [16], IMC [15] and DirtyIMC [17]. A benchmark
method (BM) was also compared, which simply used the
known values on the comparable phenotypes between co-
caine and opioid use disorders to impute missing entries.
We randomly removed the phenotypes of q% CSUD patients
associated with either opioid or cocaine use (not both). Then,
all compared methods were run to infer these missing values.
Their performance was measured by the relative mean squared
error (RMSE) calculated on missing entries: ‖R 6Ω(XTGY −
F)‖22/‖R 6Ω(F)‖22. The hyperparameters λ’s and the rank of
G (required by IMC and DirtyIMC) were selected by cross-
validation: using 30% of the given entries randomly to form
a validation set. Models were obtained by applying each
method to the remaining entries with a specific choice of λfrom 10−3, 10−2, ..., 104. The average validation RMSE was
computed by repeating the above procedure three times. The
hyperparameter values were fixed to those that gave the best
average validation RMSEs for each individual method. For
each choice of q, we repeated the above entire procedure five
times and reported the average RMSE on the missing entries.
All tests were conducted using Matlab on an Intel Core i7
3.6GHz and 16GB RAM computer.
The 383 genetic variants identified in our GWAS were used
as side features X. The correlations between 22 CUD and 22
OUD symptoms formed a correlation matrix which was used
as side features Y. The accuracy and computational time for
all methods with five q values (ranging from 20% to 100%)
are presented in Table II. The results indicate that our method
improves computational efficiency without sacrificing recovery
accuracy. When the run time was significantly reduced by
nearly 95% of that used by the non-stochastic LADMM, our
RMSE still outperformed other methods, showing that our
method can readily handle big data.
Figure 3 depicts the recovered G matrix whose rows
(corresponding to genotypes) are sorted in ascending order
according to their association p-values, and columns corre-
spond to 22 phenotypes. Color of higher saturation reflects
the stronger interaction between a specific genotype and a
criterion. Red represents a positive interaction, while blue
represents a negative interaction. We observed that the top
20 rows had the most none zero values in the matrix because
these rows corresponded to the most significantly associated
genetic variants. For instance, the interactions between a
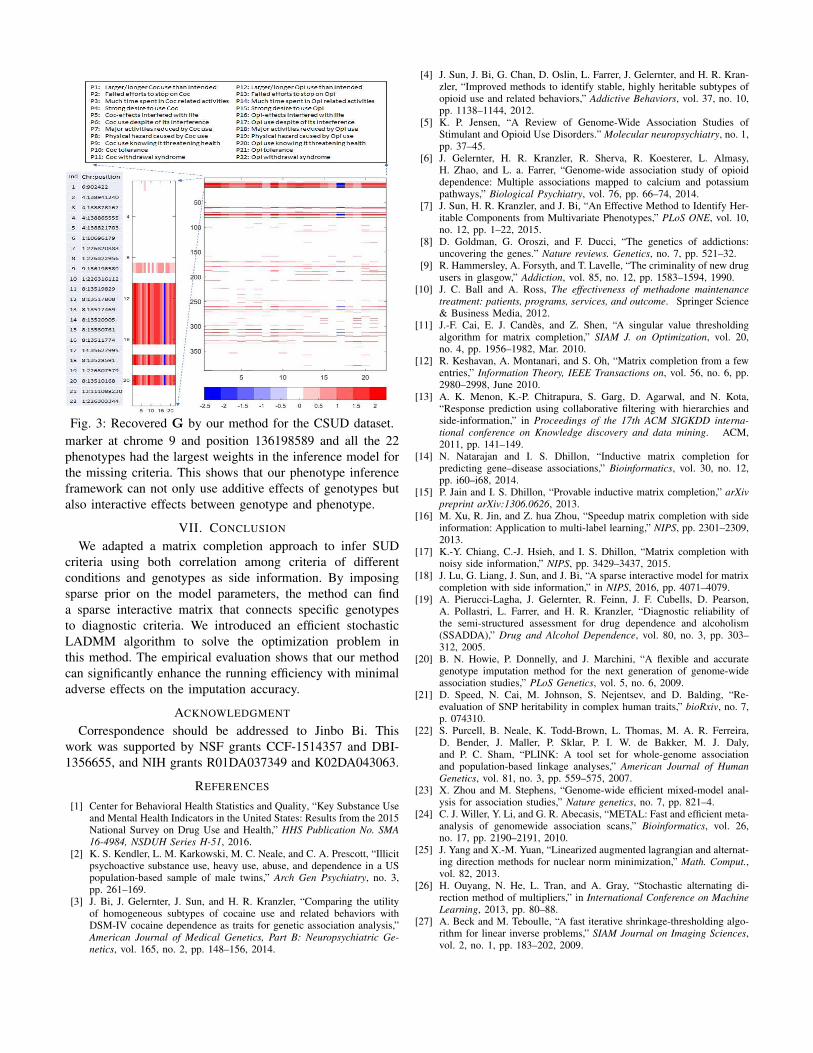
Fig. 3: Recovered G by our method for the CSUD dataset.
marker at chrome 9 and position 136198589 and all the 22
phenotypes had the largest weights in the inference model for
the missing criteria. This shows that our phenotype inference
framework can not only use additive effects of genotypes but
also interactive effects between genotype and phenotype.
VII. CONCLUSION
We adapted a matrix completion approach to infer SUD
criteria using both correlation among criteria of different
conditions and genotypes as side information. By imposing
sparse prior on the model parameters, the method can find
a sparse interactive matrix that connects specific genotypes
to diagnostic criteria. We introduced an efficient stochastic
LADMM algorithm to solve the optimization problem in
this method. The empirical evaluation shows that our method
can significantly enhance the running efficiency with minimal
adverse effects on the imputation accuracy.
ACKNOWLEDGMENT
Correspondence should be addressed to Jinbo Bi. This
work was supported by NSF grants CCF-1514357 and DBI-
1356655, and NIH grants R01DA037349 and K02DA043063.
REFERENCES
[1] Center for Behavioral Health Statistics and Quality, “Key Substance Useand Mental Health Indicators in the United States: Results from the 2015National Survey on Drug Use and Health,” HHS Publication No. SMA
16-4984, NSDUH Series H-51, 2016.[2] K. S. Kendler, L. M. Karkowski, M. C. Neale, and C. A. Prescott, “Illicit
psychoactive substance use, heavy use, abuse, and dependence in a USpopulation-based sample of male twins,” Arch Gen Psychiatry, no. 3,pp. 261–169.
[3] J. Bi, J. Gelernter, J. Sun, and H. R. Kranzler, “Comparing the utilityof homogeneous subtypes of cocaine use and related behaviors withDSM-IV cocaine dependence as traits for genetic association analysis,”American Journal of Medical Genetics, Part B: Neuropsychiatric Ge-
netics, vol. 165, no. 2, pp. 148–156, 2014.
[4] J. Sun, J. Bi, G. Chan, D. Oslin, L. Farrer, J. Gelernter, and H. R. Kran-zler, “Improved methods to identify stable, highly heritable subtypes ofopioid use and related behaviors,” Addictive Behaviors, vol. 37, no. 10,pp. 1138–1144, 2012.
[5] K. P. Jensen, “A Review of Genome-Wide Association Studies ofStimulant and Opioid Use Disorders.” Molecular neuropsychiatry, no. 1,pp. 37–45.
[6] J. Gelernter, H. R. Kranzler, R. Sherva, R. Koesterer, L. Almasy,H. Zhao, and L. a. Farrer, “Genome-wide association study of opioiddependence: Multiple associations mapped to calcium and potassiumpathways,” Biological Psychiatry, vol. 76, pp. 66–74, 2014.
[7] J. Sun, H. R. Kranzler, and J. Bi, “An Effective Method to Identify Her-itable Components from Multivariate Phenotypes,” PLoS ONE, vol. 10,no. 12, pp. 1–22, 2015.
[8] D. Goldman, G. Oroszi, and F. Ducci, “The genetics of addictions:uncovering the genes.” Nature reviews. Genetics, no. 7, pp. 521–32.
[9] R. Hammersley, A. Forsyth, and T. Lavelle, “The criminality of new drugusers in glasgow,” Addiction, vol. 85, no. 12, pp. 1583–1594, 1990.
[10] J. C. Ball and A. Ross, The effectiveness of methadone maintenance
treatment: patients, programs, services, and outcome. Springer Science& Business Media, 2012.
[11] J.-F. Cai, E. J. Candes, and Z. Shen, “A singular value thresholdingalgorithm for matrix completion,” SIAM J. on Optimization, vol. 20,no. 4, pp. 1956–1982, Mar. 2010.
[12] R. Keshavan, A. Montanari, and S. Oh, “Matrix completion from a fewentries,” Information Theory, IEEE Transactions on, vol. 56, no. 6, pp.2980–2998, June 2010.
[13] A. K. Menon, K.-P. Chitrapura, S. Garg, D. Agarwal, and N. Kota,“Response prediction using collaborative filtering with hierarchies andside-information,” in Proceedings of the 17th ACM SIGKDD interna-
tional conference on Knowledge discovery and data mining. ACM,2011, pp. 141–149.
[14] N. Natarajan and I. S. Dhillon, “Inductive matrix completion forpredicting gene–disease associations,” Bioinformatics, vol. 30, no. 12,pp. i60–i68, 2014.
[15] P. Jain and I. S. Dhillon, “Provable inductive matrix completion,” arXiv
preprint arXiv:1306.0626, 2013.[16] M. Xu, R. Jin, and Z. hua Zhou, “Speedup matrix completion with side
information: Application to multi-label learning,” NIPS, pp. 2301–2309,2013.
[17] K.-Y. Chiang, C.-J. Hsieh, and I. S. Dhillon, “Matrix completion withnoisy side information,” NIPS, pp. 3429–3437, 2015.
[18] J. Lu, G. Liang, J. Sun, and J. Bi, “A sparse interactive model for matrixcompletion with side information,” in NIPS, 2016, pp. 4071–4079.
[19] A. Pierucci-Lagha, J. Gelernter, R. Feinn, J. F. Cubells, D. Pearson,A. Pollastri, L. Farrer, and H. R. Kranzler, “Diagnostic reliability ofthe semi-structured assessment for drug dependence and alcoholism(SSADDA),” Drug and Alcohol Dependence, vol. 80, no. 3, pp. 303–312, 2005.
[20] B. N. Howie, P. Donnelly, and J. Marchini, “A flexible and accurategenotype imputation method for the next generation of genome-wideassociation studies,” PLoS Genetics, vol. 5, no. 6, 2009.
[21] D. Speed, N. Cai, M. Johnson, S. Nejentsev, and D. Balding, “Re-evaluation of SNP heritability in complex human traits,” bioRxiv, no. 7,p. 074310.
[22] S. Purcell, B. Neale, K. Todd-Brown, L. Thomas, M. A. R. Ferreira,D. Bender, J. Maller, P. Sklar, P. I. W. de Bakker, M. J. Daly,and P. C. Sham, “PLINK: A tool set for whole-genome associationand population-based linkage analyses,” American Journal of Human
Genetics, vol. 81, no. 3, pp. 559–575, 2007.[23] X. Zhou and M. Stephens, “Genome-wide efficient mixed-model anal-
ysis for association studies,” Nature genetics, no. 7, pp. 821–4.[24] C. J. Willer, Y. Li, and G. R. Abecasis, “METAL: Fast and efficient meta-
analysis of genomewide association scans,” Bioinformatics, vol. 26,no. 17, pp. 2190–2191, 2010.
[25] J. Yang and X.-M. Yuan, “Linearized augmented lagrangian and alternat-ing direction methods for nuclear norm minimization,” Math. Comput.,vol. 82, 2013.
[26] H. Ouyang, N. He, L. Tran, and A. Gray, “Stochastic alternating di-rection method of multipliers,” in International Conference on Machine
Learning, 2013, pp. 80–88.[27] A. Beck and M. Teboulle, “A fast iterative shrinkage-thresholding algo-
rithm for linear inverse problems,” SIAM Journal on Imaging Sciences,vol. 2, no. 1, pp. 183–202, 2009.