collaborative problem solving - key findings
TRANSCRIPT

Collaborative problem solving
Key findings
Andreas SchleicherDirector for Education and Skills
Why collaborative problem-solving matters
Knowledge and skills for tomorrow

The kind of things that are easy to teach are
now easy to automate, digitize or outsource
35
40
45
50
55
60
65
70
1960 1970 1980 1990 2000 2006 2009
Routine manual
Nonroutine manual
Routine cognitive
Nonroutine analytic
Nonroutine interpersonal
Mean task input in percentiles of 1960 task

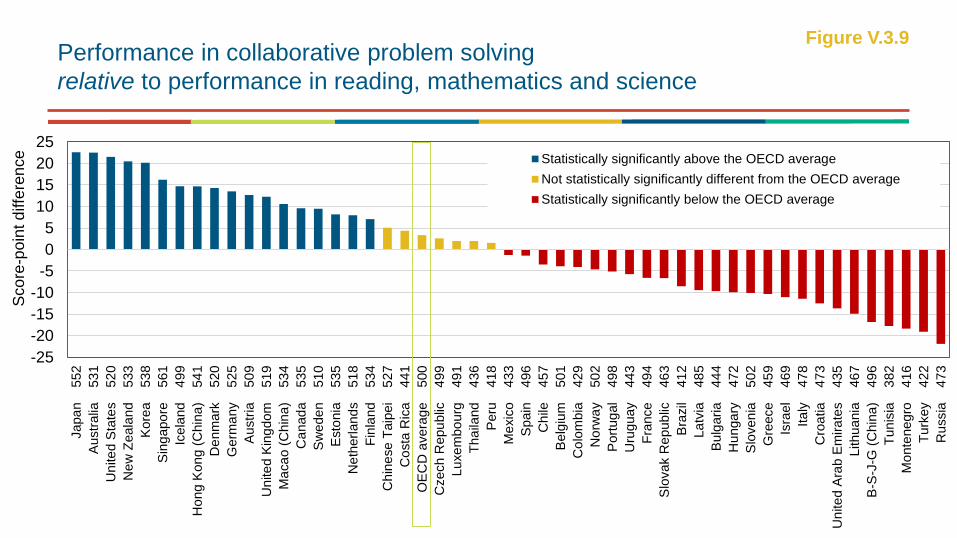
Collaborative problem-solving skills vary across countries, and are not an automatic by product of disciplinary knowledge
Individual skills explain less than two-thirds of the variation in student performance on the PISA collaborative problem-solving scale; and only three
quarters of the performance differences among countries on this measure are explained by the relative standing of countries on the 2012 PISA assessment of
individual problem-solving skills.

Singapore
Japan
Hong Kong (China)Korea
EstoniaCanada FinlandMacao (China)New Zealand Australia
Chinese TaipeiGermany
United StatesDenmark United KingdomNetherlands
Sweden AustriaNorway Slovenia Belgium
Czech RepublicIceland PortugalB-S-J-G (China) Spain
France Luxembourg
Latvia
ItalyCroatiaRussia HungaryIsrael Lithuania
Slovak RepublicGreeceChile
BulgariaUruguay Costa Rica
ThailandUnited Arab
EmiratesMexico
Colombia
TurkeyPeru
MontenegroBrazil
Tunisia380
400
420
440
460
480
500
520
540
560
Mean scoreFigure V.3.3
Mean performance on the PISA
collaborative problem-solving scale
PISA 2015 defines collaborative problem-solving competency as the capacity of an individual to effectively engage in a process whereby two or more agents attempt to solve a problem by sharing the understanding and effort required to come to a solution and pooling their knowledge, skills and efforts to reach that solution.
-25
-20
-15
-10
-5
0
5
10
15
20
25
Japa
n
552
Austr
alia
53
1
Un
ite
d S
tate
s
52
0
Ne
w Z
eala
nd
533
Kore
a
53
8
Sin
gapo
re
561
Icela
nd
4
99
Ho
ng K
on
g (
Chin
a)
5
41
De
nm
ark
520
Germ
any 5
25
Austr
ia
50
9
Un
ite
d K
ing
dom
519
Ma
ca
o (
Ch
ina
) 5
34
Ca
nad
a
535
Sw
ede
n
510
Esto
nia
535
Ne
therl
and
s
51
8
Fin
land
53
4
Ch
ine
se
Taip
ei 5
27
Co
sta
Ric
a 4
41
OE
CD
avera
ge
500
Czech R
epu
blic
4
99
Lu
xe
mbo
urg
49
1
Tha
iland
4
36
Peru
418
Me
xic
o
433
Spain
496
Ch
ile
457
Belg
ium
501
Co
lom
bia
429
No
rwa
y
50
2
Port
ug
al 4
98
Uru
guay
443
Fra
nce
49
4
Slo
vak R
epub
lic
46
3
Bra
zil
4
12
La
tvia
48
5
Bulg
aria
4
44
Hu
nga
ry
472
Slo
ven
ia 5
02
Gre
ece
45
9
Isra
el 4
69
Ita
ly
478
Cro
atia
4
73
Un
ite
d A
rab E
mira
tes
435
Lithu
ania
46
7
B-S
-J-G
(C
hin
a)
4
96
Tun
isia
3
82
Mo
nte
neg
ro 4
16
Turk
ey 4
22
Ru
ssia
4
73
Sco
re-p
oin
t d
iffe
ren
ce Statistically significantly above the OECD average
Not statistically significantly different from the OECD average
Statistically significantly below the OECD average
Performance in collaborative problem solving
relative to performance in reading, mathematics and science
Figure V.3.9

All countries can make headway
The share of top performers is limited
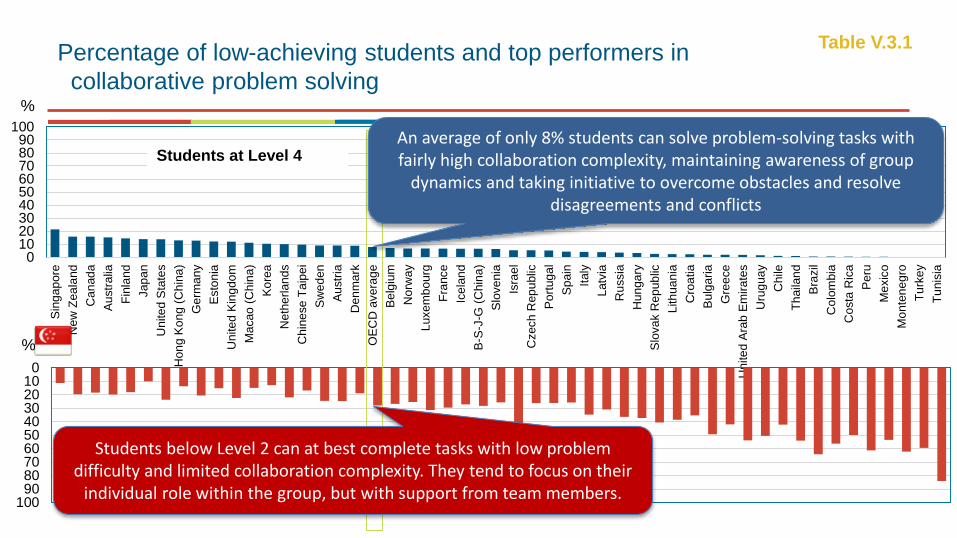
Percentage of low-achieving students and top performers in
collaborative problem solving
Table V.3.1
0102030405060708090
100
Sin
ga
pore
New
Zea
land
Can
ad
a
Au
str
alia
Fin
land
Jap
an
Unite
d S
tate
s
Hon
g K
on
g (
Ch
ina
)
Ge
rma
ny
Esto
nia
Unite
d K
ing
do
m
Ma
cao
(C
hin
a)
Ko
rea
Neth
erl
an
ds
Chin
ese
Ta
ipe
i
Sw
ed
en
Au
str
ia
Den
ma
rk
OE
CD
avera
ge
Be
lgiu
m
Norw
ay
Luxe
mb
ourg
Fra
nce
Ice
lan
d
B-S
-J-G
(C
hin
a)
Slo
ve
nia
Isra
el
Czech
Rep
ublic
Po
rtug
al
Sp
ain
Italy
Latv
ia
Ru
ssia
Hun
ga
ry
Slo
va
k R
ep
ub
lic
Lith
uan
ia
Cro
atia
Bu
lga
ria
Gre
ece
Un
ite
d A
rab
Em
ira
tes
Uru
gua
y
Chile
Th
aila
nd
Bra
zil
Colo
mbia
Costa
Ric
a
Pe
ru
Me
xic
o
Mo
nte
ne
gro
Tu
rke
y
Tu
nis
ia
Students at Level 4
0102030405060708090
100Students below Level 2
%
%
An average of only 8% students can solve problem-solving tasks with fairly high collaboration complexity, maintaining awareness of group
dynamics and taking initiative to overcome obstacles and resolve disagreements and conflicts
Students below Level 2 can at best complete tasks with low problem difficulty and limited collaboration complexity. They tend to focus on their
individual role within the group, but with support from team members.

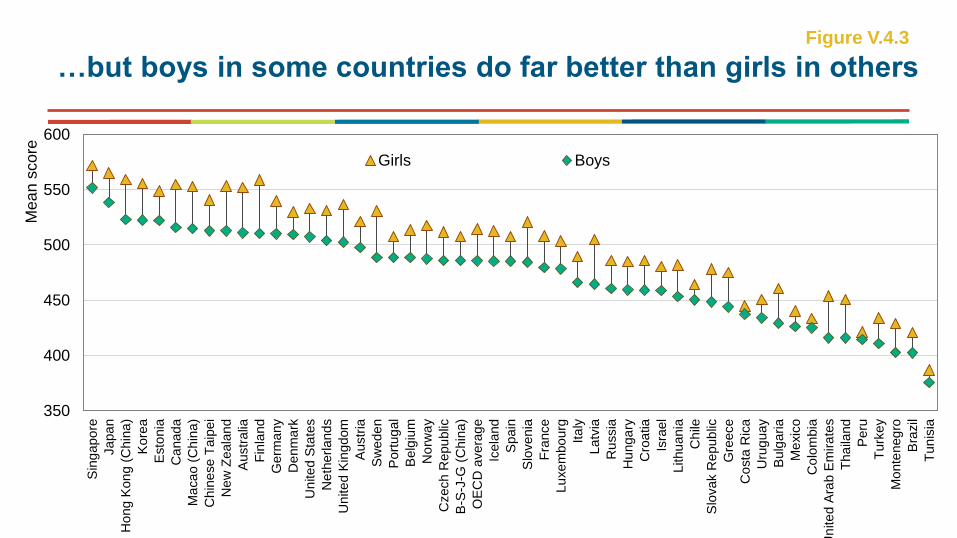
Boys are lagging behind
When individual problem-solving skills were at the centre of PISA in 2012, boys scored higher in most countries. In
contrast, on the 2015 assessment of collaborative problem-solving girls outperformed boys in in every country

-50
-45
-40
-35
-30
-25
-20
-15
-10
-5
0
Fin
land
Sw
ede
n
Austr
alia
Ne
w Z
eala
nd
La
tvia
Ca
nad
a
Ma
ca
o (
Ch
ina
)
Un
ite
d A
rab E
mira
tes
Slo
ven
ia
Ho
ng K
on
g (
Chin
a)
Tha
iland
Un
ite
d K
ing
dom
Kore
a
Bulg
aria
Gre
ece
No
rwa
y
Slo
vak R
epub
lic
Germ
any
OE
CD
avera
ge
Fra
nce
Lithu
ania
Ch
ine
se
Taip
ei
Ne
therl
and
s
Icela
nd
Cro
atia
Esto
nia
Japa
n
Mo
nte
neg
ro
Czech R
epu
blic
Un
ite
d S
tate
s
Hu
nga
ry
Ru
ssia
Lu
xe
mbo
urg
Belg
ium
Austr
ia
Ita
ly
Turk
ey
Spain
Isra
el
B-S
-J-G
(C
hin
a)
De
nm
ark
Sin
gapo
re
Port
ug
al
Bra
zil
Uru
guay
Ch
ile
Me
xic
o
Tun
isia
Co
lom
bia
Co
sta
Ric
a
Peru
Sco
re-p
oin
t d
iffe
ren
ce
Gender differences in collaborative problem-solving performance (boys minus girls)
Figure V.4.3
Girls perform better in all
countries and economies

-50
-45
-40
-35
-30
-25
-20
-15
-10
-5
0
Ne
w Z
eala
nd
Germ
any
Austr
alia
Ita
ly
Ca
nad
a
Austr
ia
Un
ite
d K
ing
dom
Belg
ium
Czech R
epu
blic
Japa
n
Fin
land
Ho
ng K
on
g (
Chin
a)
Un
ite
d S
tate
s
Sw
ede
n
Esto
nia
B-S
-J-G
(C
hin
a)
OE
CD
avera
ge
Fra
nce
La
tvia
Tha
iland
Lu
xe
mbo
urg
Isra
el
No
rwa
y
Ch
ine
se
Taip
ei
Slo
ven
ia
Hu
nga
ry
Cro
atia
Ma
ca
o (
Ch
ina
)
Spain
Ne
therl
and
s
De
nm
ark
Ru
ssia
Slo
vak R
epub
lic
Ch
ile
Gre
ece
Uru
guay
Lithu
ania
Sin
gapo
re
Port
ug
al
Mo
nte
neg
ro
Kore
a
Turk
ey
Co
lom
bia
Me
xic
o
Bra
zil
Ma
laysia
Un
ite
d A
rab E
mira
tes
Icela
nd
Tun
isia
Bulg
aria
Co
sta
Ric
a
Peru
Sco
re-p
oin
t d
iffe
ren
ce
Gender differences in collaborative problem solving (boys minus girls)
after considering performance in the science, reading and math
Figure V.4.6
Girls perform better in collaborative problem
solving, even after accounting for performance
in science, reading and mathematics
350
400
450
500
550
600
Sin
gapo
re
Japa
n
Ho
ng K
on
g (
Chin
a)
Kore
a
Esto
nia
Ca
nad
a
Ma
ca
o (
Ch
ina
)
Ch
ine
se
Taip
ei
Ne
w Z
eala
nd
Austr
alia
Fin
land
Germ
any
De
nm
ark
Un
ite
d S
tate
s
Ne
therl
and
s
Un
ite
d K
ing
dom
Austr
ia
Sw
ede
n
Port
ug
al
Belg
ium
No
rwa
y
Czech R
epu
blic
B-S
-J-G
(C
hin
a)
OE
CD
avera
ge
Icela
nd
Spain
Slo
ven
ia
Fra
nce
Lu
xe
mbo
urg
Ita
ly
La
tvia
Ru
ssia
Hu
nga
ry
Cro
atia
Isra
el
Lithu
ania
Ch
ile
Slo
vak R
epub
lic
Gre
ece
Co
sta
Ric
a
Uru
guay
Bulg
aria
Me
xic
o
Co
lom
bia
Un
ite
d A
rab E
mira
tes
Tha
iland
Peru
Turk
ey
Mo
nte
neg
ro
Bra
zil
Tun
isia
Me
an
sco
re
Girls Boys
…but boys in some countries do far better than girls in othersFigure V.4.3
Gender differences in performance are mirrored in attitudes towards collaboration
Girls report more positive attitudes towards relationships, meaning that they tend to be interested in others’ opinions and want others to
succeed. Boys, on the other hand, are more likely to see the instrumental benefits of teamwork and how collaboration can help them work more
effectively and efficiently

-6
-4
-2
0
2
4
6
I am a goodlistener
I enjoy seeingmy classmatesbe successful
I take intoaccount what
others areinterested in
I enjoyconsidering
differentperspectives
I prefer workingas part of a
team to workingalone
I find that teamsmake better
decisions thanindividuals
I find thatteamwork raises
my ownefficiency
I enjoy co-operating with
peers
Perc
enta
ge-p
oin
t d
iffe
ren
ce
(bo
ys m
inu
s gi
rls)
Gender differences in attitudes towards collaborationFigure V.5.5
Items comprising the index of valuing relationships Items comprising the index of valuing teamwork
Boys are more likely to value teamwork
Girls are more likely to value relationships

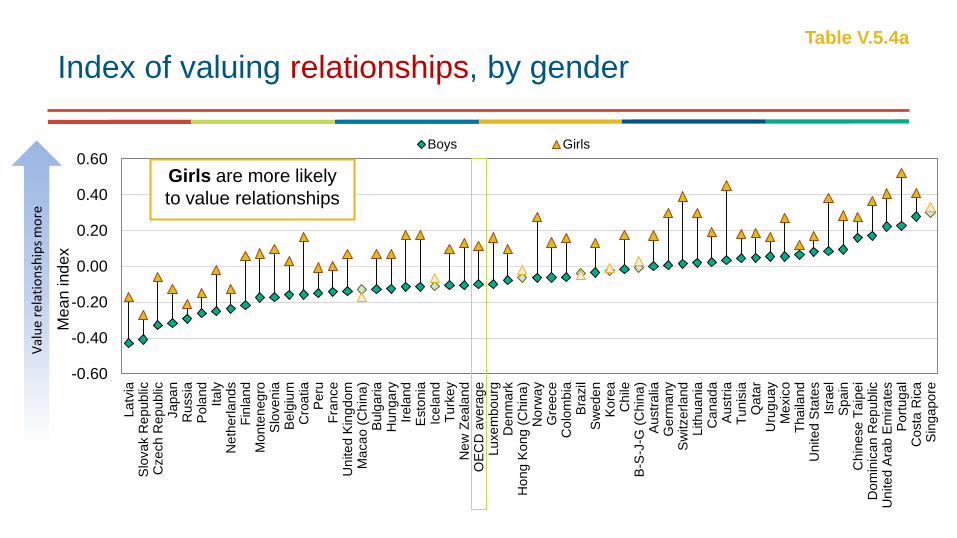
Attitudes towards collaboration vary across countries too
If schools foster boys’ appreciation of others and their interpersonal friendships and relationships, then they may also
see better outcomes among boys in collaborative problem-solving
-0.60
-0.40
-0.20
0.00
0.20
0.40
0.60
La
tvia
Slo
vak R
epub
licC
zech R
epu
blic
Japa
nR
ussia
Pola
nd
Ita
lyN
eth
erl
and
sF
inla
nd
Mo
nte
neg
roS
loven
iaB
elg
ium
Cro
atia
Peru
Fra
nce
Un
ite
d K
ing
dom
Ma
ca
o (
Ch
ina
)B
ulg
aria
Hu
nga
ryIr
ela
nd
Esto
nia
Icela
nd
Turk
ey
Ne
w Z
eala
nd
OE
CD
avera
ge
Lu
xe
mbo
urg
De
nm
ark
Ho
ng K
on
g (
Chin
a)
No
rwa
yG
reece
Co
lom
bia
Bra
zil
Sw
ede
nK
ore
aC
hile
B-S
-J-G
(C
hin
a)
Austr
alia
Germ
any
Sw
itzerl
and
Lithu
ania
Ca
nad
aA
ustr
iaT
un
isia
Qata
rU
rug
uay
Me
xic
oT
ha
iland
Un
ite
d S
tate
sIs
rael
Spain
Ch
ine
se
Taip
ei
Do
min
ican
Rep
ublic
Un
ite
d A
rab E
mira
tes
Port
ug
al
Co
sta
Ric
aS
ing
apo
re
Me
an
ind
ex
Boys Girls
Index of valuing relationships, by genderTable V.5.4a
Val
ue
rela
tio
nsh
ips
mo
re
Girls are more likely
to value relationships

-0.40
-0.30
-0.20
-0.10
0.00
0.10
0.20
0.30
0.40
0.50
0.60
Ne
therl
and
sN
orw
ay
Fin
land
Ru
ssia
Icela
nd
Slo
vak R
epub
licM
onte
neg
roLa
tvia
Sw
ede
nJapa
nE
sto
nia
Isra
el
Belg
ium
De
nm
ark
Bulg
aria
Turk
ey
Pola
nd
Un
ite
d K
ing
dom
Ma
ca
o (
Ch
ina
)H
unga
ryC
zech R
epu
blic
Lu
xe
mbo
urg
Slo
ven
iaO
EC
D a
vera
ge
Irela
nd
Ho
ng K
on
g (
Chin
a)
Ita
lyA
ustr
alia
Ca
nad
aP
eru
Fra
nce
Ne
w Z
eala
nd
Un
ite
d S
tate
sS
pain
Germ
any
Gre
ece
Qata
rA
ustr
iaK
ore
aB
razil
Uru
guay
Co
lom
bia
Sw
itzerl
and
Ch
ileC
roa
tia
Me
xic
oS
ing
apo
reP
ort
ug
al
Lithu
ania
Co
sta
Ric
aB
-S-J
-G (
Chin
a)
Ch
ine
se
Taip
ei
Tha
iland
Tun
isia
Un
ite
d A
rab E
mira
tes
Do
min
ican
Rep
ublic
Me
an
ind
ex
Boys Girls
Index of valuing teamwork, by genderTable V.5.4b
Val
ue
team
wo
rk m
ore
Boys are more likely to value teamwork

Attitudes towards collaboration and performance in collaboration
0
5
10
I am a goodlistener
I take intoaccount what
others areinterested in
I enjoyconsidering
differentperspectives
I enjoy seeingmy classmatesbe successful
I find that teamsmake better
decisions thanindividuals
I enjoy co-operating with
peers
I prefer workingas part of a
team to workingalone
I find thatteamwork raises
my ownefficiency
Sco
re-p
oin
t d
iffe
ren
ce
After accounting for gender and students' and schools' socio-economic profile
Before accounting for gender and students' and schools' socio-economic profile
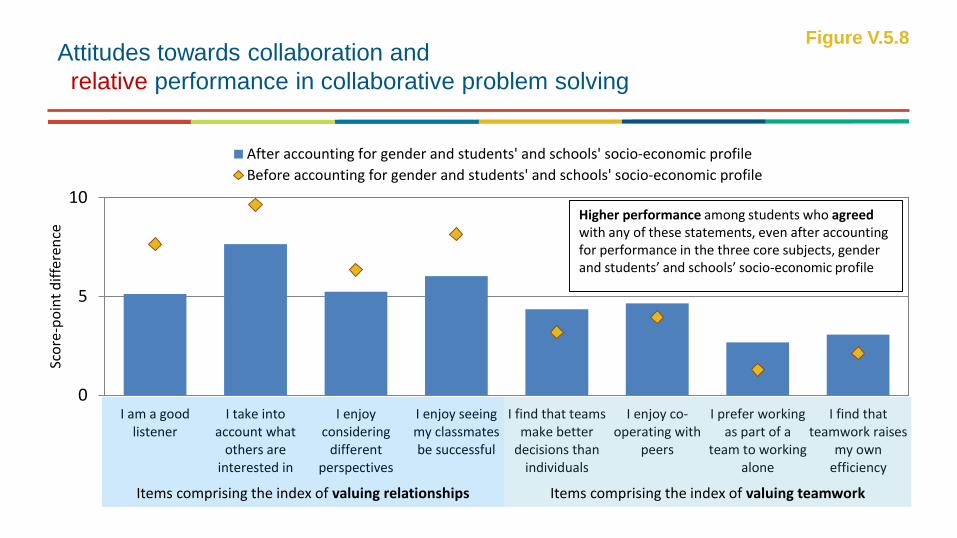
Attitudes towards collaboration and
relative performance in collaborative problem solving
Figure V.5.8
Higher performance among students who agreedwith any of these statements, even after accountingfor performance in the three core subjects, genderand students’ and schools’ socio-economic profile
Items comprising the index of valuing relationships Items comprising the index of valuing teamwork

Taking into account others’ interests and
relative performance in collaborative problem solving
Figure V.5.9
-5
0
5
10
15
20
25
30
Esto
nia
Ne
w Z
eala
nd
Ru
ssia
No
rwa
y
Un
ite
d K
ing
dom
Belg
ium
Spain
Ca
nad
a
Co
sta
Ric
a
Bulg
aria
Gre
ece
Ita
ly
Ch
ile
Slo
ven
ia
Port
ug
al
Sw
ede
n
Fin
land
Ne
therl
and
s
OE
CD
avera
ge
Slo
vak R
epub
lic
Czech R
epu
blic
Lu
xe
mbo
urg
Tha
iland
B-S
-J-G
(C
hin
a)
Japa
n
Ma
ca
o (
Ch
ina
)
Icela
nd
Austr
alia
Mo
nte
neg
ro
De
nm
ark
Lithu
ania
Ma
laysia
Uru
guay
Tun
isia
Bra
zil
Turk
ey
Fra
nce
Sin
gapo
re
Kore
a
Un
ite
d A
rab E
mira
tes
Germ
any
Hu
nga
ry
Ho
ng K
on
g (
Chin
a)
Cro
atia
Me
xic
o
Austr
ia
La
tvia
Un
ite
d S
tate
s
Peru
Ch
ine
se
Taip
ei
Isra
el
Co
lom
bia
Sco
re-p
oin
t d
iffe
ren
ce
After accounting for gender and students' and schools' socio-economic profile
Before accounting for gender and students' and schools' socio-economic profile
Higher performance among students who agreed/strongly
agreed that they take others’ interests into account, even after
accounting for performance in science, reading and mathematics
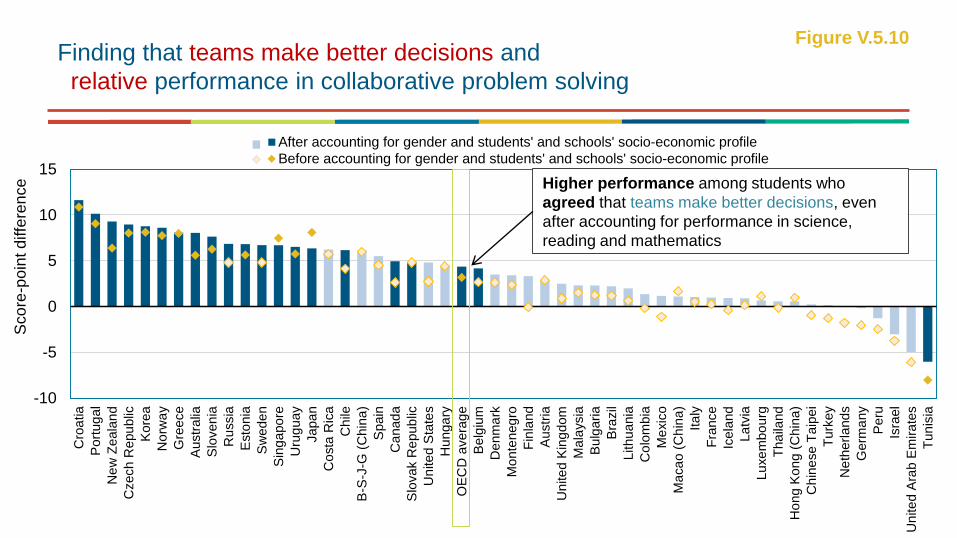
Finding that teams make better decisions and
relative performance in collaborative problem solving
Figure V.5.10
-10
-5
0
5
10
15
Cro
atia
Port
ug
al
Ne
w Z
eala
nd
Czech R
epu
blic
Kore
a
No
rwa
y
Gre
ece
Austr
alia
Slo
ven
ia
Ru
ssia
Esto
nia
Sw
ede
n
Sin
gapo
re
Uru
guay
Japa
n
Co
sta
Ric
a
Ch
ile
B-S
-J-G
(C
hin
a)
Spain
Ca
nad
a
Slo
vak R
epub
lic
Un
ite
d S
tate
s
Hu
nga
ry
OE
CD
avera
ge
Belg
ium
De
nm
ark
Mo
nte
neg
ro
Fin
land
Austr
ia
Un
ite
d K
ing
dom
Ma
laysia
Bulg
aria
Bra
zil
Lithu
ania
Co
lom
bia
Me
xic
o
Ma
ca
o (
Ch
ina
)
Ita
ly
Fra
nce
Icela
nd
La
tvia
Lu
xe
mbo
urg
Tha
iland
Ho
ng K
on
g (
Chin
a)
Ch
ine
se
Taip
ei
Turk
ey
Ne
therl
and
s
Germ
any
Peru
Isra
el
Un
ite
d A
rab E
mira
tes
Tun
isia
Sco
re-p
oin
t d
iffe
ren
ce
After accounting for gender and students' and schools' socio-economic profile
Before accounting for gender and students' and schools' socio-economic profile
Higher performance among students who
agreed that teams make better decisions, even
after accounting for performance in science,
reading and mathematics
Learning environments can shape attitudes and outcomes in collaboration
PISA asked students about how often they engage in communication-intensive activities such as explaining one’s ideas in science class;
spending time in the laboratory doing practical experiments; arguing about science questions; and taking part in class debates about
investigations. The results show a clear relationship between these activities and positive attitudes towards collaboration
-0.30
-0.20
-0.10
0.00
0.10
0.20
0.30
0 1 2 3 4 5 6 7
Mean index All students Boys Girls
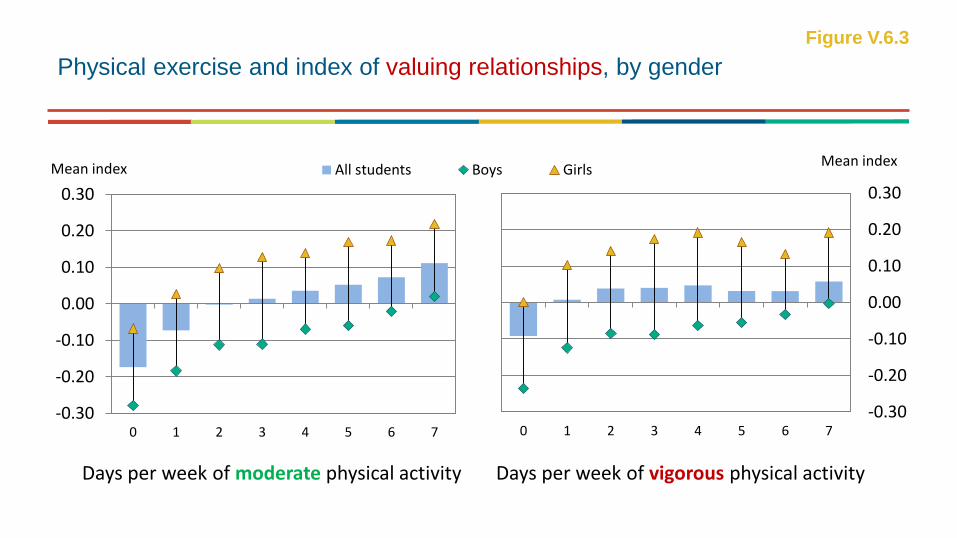
Physical exercise and index of valuing relationships, by gender
Figure V.6.3
-0.30
-0.20
-0.10
0.00
0.10
0.20
0.30
0 1 2 3 4 5 6 7
Mean index
Days per week of moderate physical activity Days per week of vigorous physical activity
-0.20
-0.10
0.00
0.10
0.20
0 1 2 3 4 5 6 7
Mean index All students Boys Girls
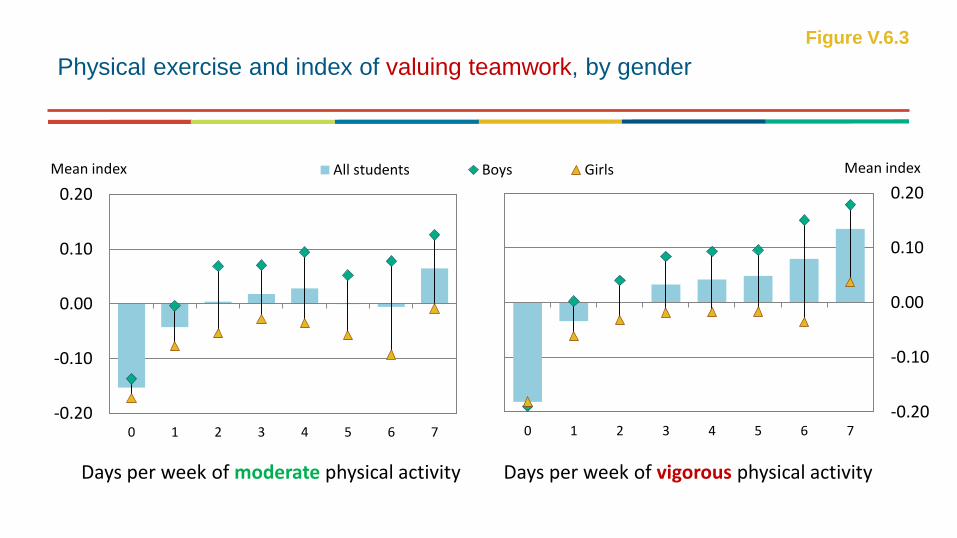
Physical exercise and index of valuing teamwork, by gender
Figure V.6.3
-0.20
-0.10
0.00
0.10
0.20
0 1 2 3 4 5 6 7
Mean index
Days per week of moderate physical activity Days per week of vigorous physical activity

-0.30
-0.25
-0.20
-0.15
-0.10
-0.05
0.00
Skipping a wholeday of school
Skipping someclasses
Arriving late forschool
Skipping a wholeday of school
Skipping someclasses
Arriving late forschool
Ch
ange
in in
dex
After accounting for gender and students' and schools' socio-economic profile
Before accounting for gender and students' and schools' socio-economic profile
Student truancy and attitudes towards collaborationFigure V.6.7
Index of valuing relationships Index of valuing teamwork
Students who play truant are more likelyto show negative attitudes
towards collaboration

0
1
2
3
I am a goodlistener
I enjoy seeingmy classmatesbe successful
I take intoaccount what
others areinterested in
I enjoyconsidering
differentperspectives
I prefer workingas part of a
team to workingalone
I find that teamsmake better
decisions thanindividuals
I find thatteamwork raises
my ownefficiency
I enjoy co-operating with
peers
Perc
enta
ge-p
oin
t d
iffe
ren
ce
After accounting for gender and students' and schools' socio-economic profile
Before accounting for gender and students' and schools' socio-economic profile
Student interaction in science class
and attitudes towards collaboration
Figure V.6.9
Items comprising the index of valuing relationships Items comprising the index of valuing teamwork
Students who reported that more communication-intensive activities take place in science class have more positive
attitudes towards collaboration
Students are given opportunities to explain their ideas; students spend time in the laboratory
carrying out practical experiments; students are required to argue about science questions; there
is a class debate about investigations
-8
-6
-4
-2
0
2
4
6
8
I take intoaccount what
others areinterested in
I enjoyconsidering
differentperspectives
I am a goodlistener
I enjoy seeingmy classmatesbe successful
I find thatteamwork raises
my ownefficiency
I prefer workingas part of a
team to workingalone
I find that teamsmake better
decisions thanindividuals
I enjoy co-operating with
peers
Perc
enta
ge-p
oin
t d
iffe
ren
ce(a
dv.
min
us
dis
adv.
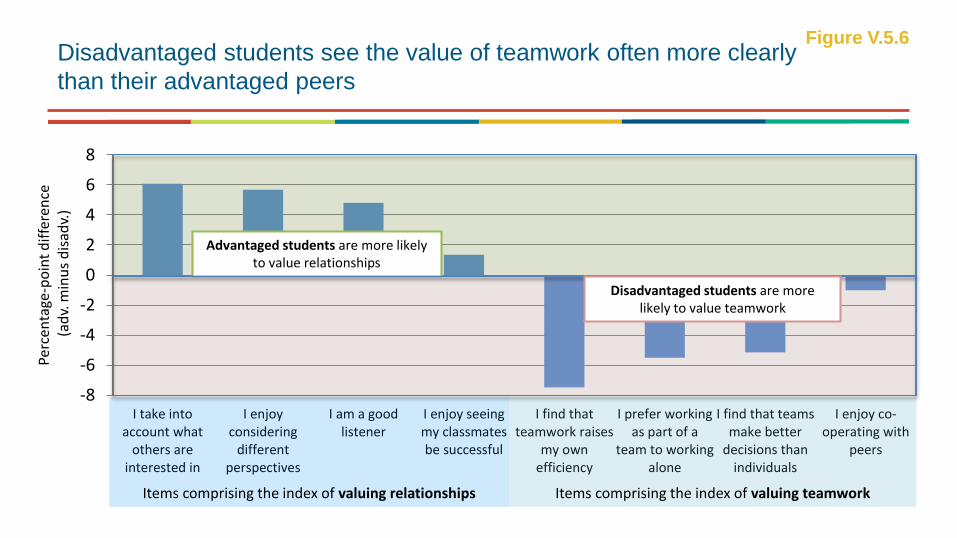
)Disadvantaged students see the value of teamwork often more clearly
than their advantaged peers
Figure V.5.6
Items comprising the index of valuing relationships Items comprising the index of valuing teamwork
Advantaged students are more likelyto value relationships
Disadvantaged students are more likely to value teamwork
-4
-2
0
2
4
6
8
10
12
14
Sw
ede
n
Ch
ile
Ne
w Z
eala
nd
Sin
gapo
re
Spain
Czech R
epu
blic
Esto
nia
Ne
therl
and
s
Belg
ium
Slo
ven
ia
Fra
nce
Austr
alia
Japa
n
La
tvia
Gre
ece
Lu
xe
mbo
urg
De
nm
ark
Ma
ca
o (
Ch
ina
)
Mo
nte
neg
ro
Port
ug
al
OE
CD
avera
ge
Tha
iland
Ho
ng K
on
g (
Chin
a)
B-S
-J-G
(C
hin
a)
Ch
ine
se
Taip
ei
Lithu
ania
Me
xic
o
Un
ite
d S
tate
s
Uru
guay
Fin
land
Tun
isia
Icela
nd
No
rwa
y
Austr
ia
Germ
any
Co
sta
Ric
a
Un
ite
d K
ing
dom
Hu
nga
ry
Turk
ey
Ru
ssia
Bra
zil
Un
ite
d A
rab E
mira
tes
Cro
atia
Peru
Slo
vak R
epub
lic
Co
lom
bia
Kore
a
Bulg
aria
Sco
re-p
oin
t d
iffe
ren
ce
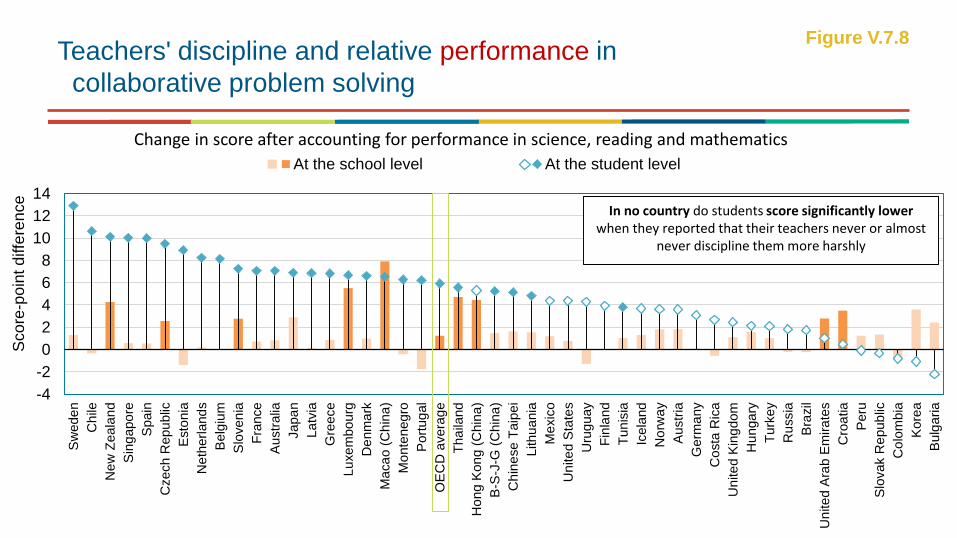
At the school level At the student level
Teachers' discipline and relative performance in
collaborative problem solving
Figure V.7.8
In no country do students score significantly lower when they reported that their teachers never or almost
never discipline them more harshly
Change in score after accounting for performance in science, reading and mathematics

-5
0
5
10
15
20
25
30
35
40
45
Lu
xe
mbo
urg
Gre
ece
Sin
gapo
re
Un
ite
d S
tate
s
No
rwa
y
Ma
ca
o (
Ch
ina
)
Spain
Ca
nad
a
Ne
w Z
eala
nd
De
nm
ark
Ch
ine
se
Taip
ei
Ho
ng K
on
g (
Chin
a)
Czech R
epu
blic
Fin
land
Esto
nia
Un
ite
d A
rab E
mira
tes
Austr
alia
Port
ug
al
B-S
-J-G
(C
hin
a)
Tha
iland
Sw
ede
n
OE
CD
avera
ge
Slo
ven
ia
Peru
Icela
nd
La
tvia
Ch
ile
Slo
vak R
epub
lic
Bra
zil
Mo
nte
neg
ro
Austr
ia
Co
lom
bia
Cro
atia
Japa
n
Bulg
aria
Lithu
ania
Un
ite
d K
ing
dom
Uru
guay
Ru
ssia
Belg
ium
Ne
therl
and
s
Hu
nga
ry
Me
xic
o
Turk
ey
Germ
any
Tun
isia
Fra
nce
Co
sta
Ric
a
Kore
a
Sco
re-p
oin
t d
iffe
ren
ce
At the school level At the student level
Students being threatened by other students and
performance in collaborative problem solving
Figure V.7.3
In most countries, students score higher when they reported not being threatened
by other students
Change in score after accounting for students' and schools' socio-economic profile
Diversity in classrooms
Exposure to diversity in the classroom can be associated with better collaboration skills
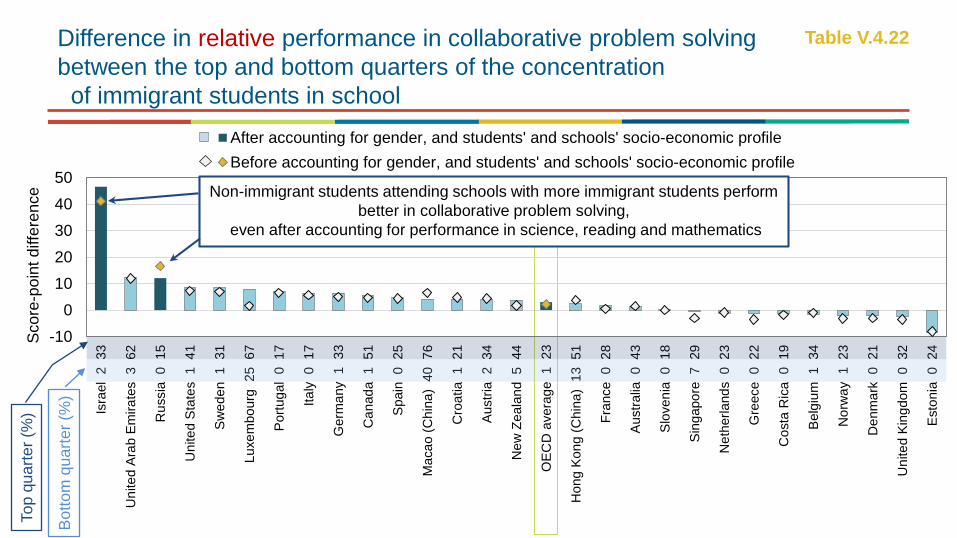
Difference in relative performance in collaborative problem solving
between the top and bottom quarters of the concentration
of immigrant students in school
Table V.4.22
-10
0
10
20
30
40
50
Isra
el 2
33
Un
ite
d A
rab E
mira
tes 3
62
Ru
ssia
0
15
Un
ite
d S
tate
s
1 4
1
Sw
ede
n 1
31
Lu
xe
mbo
urg
25
67
Port
ug
al 0
1
7
Ita
ly 0
17
Germ
any 1
33
Ca
nad
a 1
51
Spain
0
25
Ma
ca
o (
Ch
ina
) 4
0
76
Cro
atia
1
21
Austr
ia
2 3
4
Ne
w Z
eala
nd 5
44
OE
CD
avera
ge 1
23
Ho
ng K
on
g (
Chin
a)
13
51
Fra
nce
0 2
8
Austr
alia
0 4
3
Slo
ven
ia 0
18
Sin
gapo
re 7
29
Ne
therl
and
s
0 2
3
Gre
ece
0 2
2
Co
sta
Ric
a 0
19
Belg
ium
1
34
No
rwa
y
1 2
3
De
nm
ark
0
21
Un
ite
d K
ing
dom
0
32
Esto
nia
0
24
Sco
re-p
oin
t d
iffe
ren
ce
After accounting for gender, and students' and schools' socio-economic profile
Before accounting for gender, and students' and schools' socio-economic profile
Non-immigrant students attending schools with more immigrant students perform
better in collaborative problem solving,
even after accounting for performance in science, reading and mathematics
To
p q
ua
rte
r (%
)
Bo
tto
m q
ua
rte
r (%
)

Looking beyond school walls
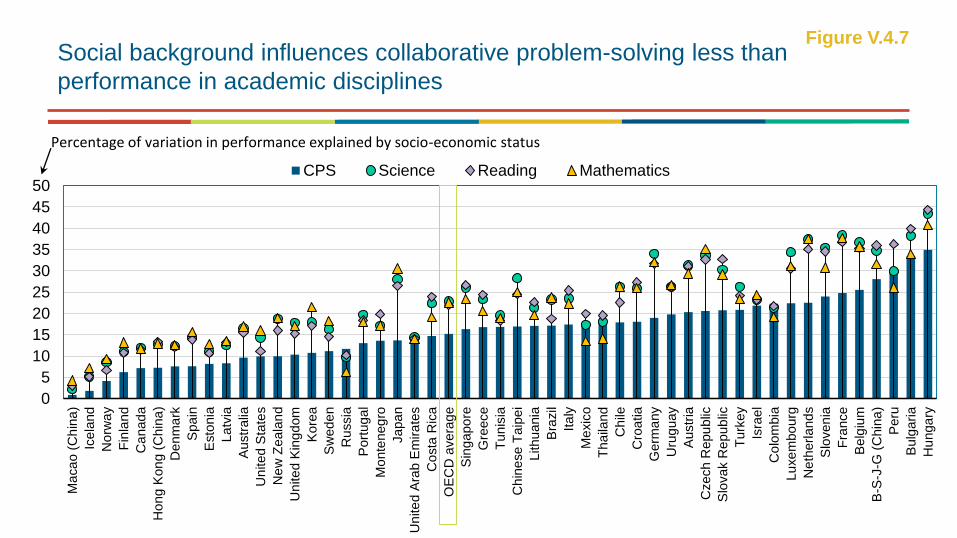
Only a quarter of the performance variation in collaborative problem-solving skills lies between schools,
much less than is the case in the school disciplines
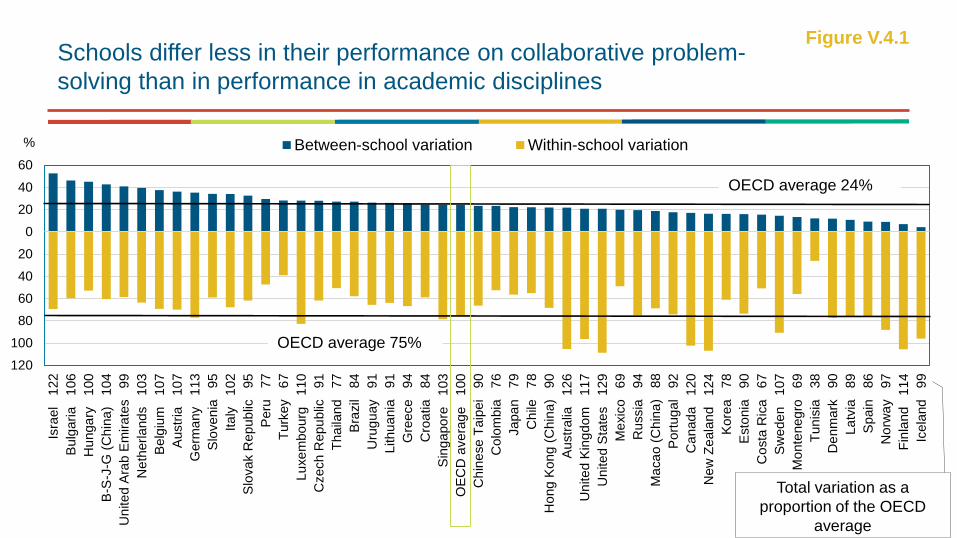
Schools differ less in their performance on collaborative problem-
solving than in performance in academic disciplines
Figure V.4.1
120
100
80
60
40
20
0
20
40
60
Isra
el 1
22
Bulg
aria
1
06
Hu
nga
ry 1
00
B-S
-J-G
(C
hin
a)
104
Un
ite
d A
rab E
mira
tes 9
9
Ne
therl
and
s
103
Belg
ium
1
07
Austr
ia
10
7
Germ
any 1
13
Slo
ven
ia 9
5
Ita
ly 1
02
Slo
vak R
epub
lic
95
Peru
7
7
Turk
ey 6
7
Lu
xe
mbo
urg
1
10
Czech R
epu
blic
9
1
Tha
iland
7
7
Bra
zil
84
Uru
guay 9
1
Lithu
ania
9
1
Gre
ece
94
Cro
atia
8
4
Sin
gapo
re 1
03
OE
CD
avera
ge 1
00
Ch
ine
se
Taip
ei 9
0
Co
lom
bia
7
6
Japa
n 7
9
Ch
ile 7
8
Ho
ng K
on
g (
Chin
a)
90
Austr
alia
1
26
Un
ite
d K
ing
dom
1
17
Un
ite
d S
tate
s
129
Me
xic
o 6
9
Ru
ssia
9
4
Ma
ca
o (
Ch
ina
) 88
Port
ug
al 92
Ca
nad
a 1
20
Ne
w Z
eala
nd 1
24
Kore
a
78
Esto
nia
9
0
Co
sta
Ric
a 6
7
Sw
ede
n 1
07
Mo
nte
neg
ro 6
9
Tun
isia
3
8
De
nm
ark
9
0
La
tvia
8
9
Spain
8
6
No
rwa
y
97
Fin
land
114
Icela
nd
9
9
% Between-school variation Within-school variation
Total variation as a
proportion of the OECD
average
OECD average 75%
OECD average 24%
0
5
10
15
20
25
30
35
40
45
50
Ma
ca
o (
Ch
ina
)
Icela
nd
No
rwa
y
Fin
land
Ca
nad
a
Ho
ng K
on
g (
Chin
a)
De
nm
ark
Spain
Esto
nia
La
tvia
Austr
alia
Un
ite
d S
tate
s
Ne
w Z
eala
nd
Un
ite
d K
ing
dom
Kore
a
Sw
ede
n
Ru
ssia
Port
ug
al
Mo
nte
neg
ro
Japa
n
Un
ite
d A
rab E
mira
tes
Co
sta
Ric
a
OE
CD
avera
ge
Sin
gapo
re
Gre
ece
Tun
isia
Ch
ine
se
Taip
ei
Lithu
ania
Bra
zil
Ita
ly
Me
xic
o
Tha
iland
Ch
ile
Cro
atia
Germ
any
Uru
guay
Austr
ia
Czech R
epu
blic
Slo
vak R
epub
lic
Turk
ey
Isra
el
Co
lom
bia
Lu
xe
mbo
urg
Ne
therl
and
s
Slo
ven
ia
Fra
nce
Belg
ium
B-S
-J-G
(C
hin
a)
Peru
Bulg
aria
Hu
nga
ry
CPS Science Reading Mathematics
Percentage of variation in performance explained by socio-economic status
Social background influences collaborative problem-solving less than
performance in academic disciplines
Figure V.4.7

Looking beyond school walls
Technology

-40
-30
-20
-10
0
10
Playing video games Meeting friends/talking to friendson the phone
Working in the household ortaking care of
other family members
Accessing the Internet/chat/social networks
Sco
re-p
oin
t d
iffe
ren
ce
After accounting for performance in the three core PISA subjects, gender, and students' and schools' socio-economic profile
Before accounting for performance in the three core PISA subjects, gender, and students' and schools' socio-economic profile
Activities before and after school, and performance in
collaborative problem solving
Figure V.6.5
Students who access the internet/chat/use social networksscore higher in collaborative problem solving
Students who play video games score lower in collaborative problem solving
400
440
480
520
560
600
Me
xic
o
Bra
zil
-2
4
Co
lom
bia
-1
6
Peru
-3
3
Co
sta
Ric
a -1
9
Tha
iland
-2
9
Uru
guay -4
7
Ch
ile -3
6
Slo
vak R
epub
lic
-35
Bulg
aria
-6
5
Lithu
ania
-5
3
Cro
atia
-3
8
Gre
ece
-68
Hu
nga
ry -4
8
Isra
el -
60
Ru
ssia
-4
0
Ita
ly -4
0
Spain
Fra
nce
-19
Belg
ium
-1
2
La
tvia
-5
1
Icela
nd
-2
5
Slo
ven
ia -2
8
Lu
xe
mbo
urg
-4
6
OE
CD
avera
ge -2
9
B-S
-J-G
(C
hin
a)
-3
3
Port
ug
al -
50
Austr
ia
-30
Ne
therl
and
s
-24
Czech R
epu
blic
-4
6
Ch
ine
se
Taip
ei
Austr
alia
14
Un
ite
d K
ing
dom
-1
4
Ma
ca
o (
Ch
ina
)
Sw
ede
n -3
9
De
nm
ark
-2
1
Fin
land
-29
Germ
any -2
2
Esto
nia
-4
2
Ne
w Z
eala
nd -2
9
Kore
a
-24
Ho
ng K
on
g (
Chin
a)
-3
4
Japa
n 1
4
Sin
gapo
re -1
8
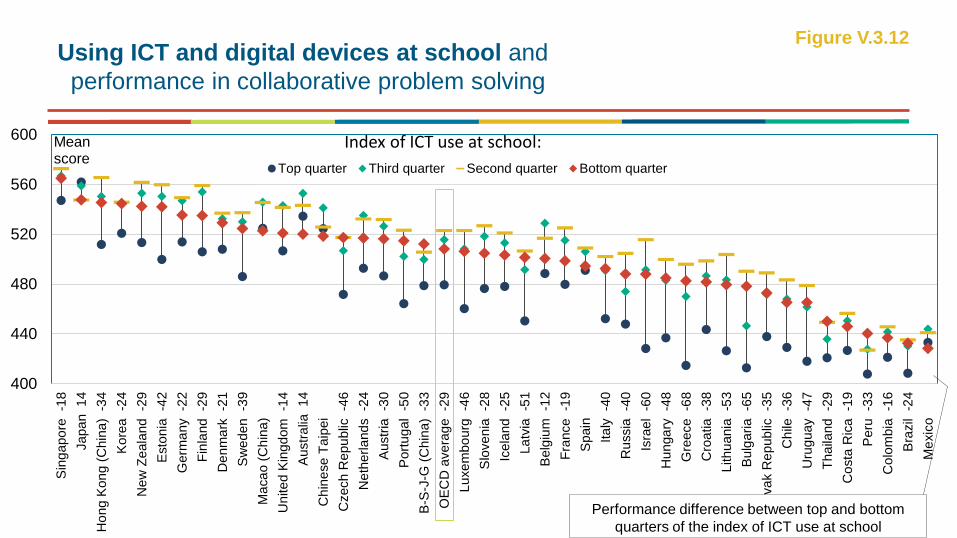
Mean score
Top quarter Third quarter Second quarter Bottom quarter
Index of ICT use at school:
Using ICT and digital devices at school and
performance in collaborative problem solving
Figure V.3.12
Performance difference between top and bottom
quarters of the index of ICT use at school
Looking beyond school walls
Parents have a major role to play
-20
-10
0
10
20
30
40
50
60
No
rwa
y
Icela
nd
Sw
ede
n
Lu
xe
mbo
urg
Port
ug
al
Japa
n
Austr
alia
La
tvia
Fin
land
Isra
el
Gre
ece
Un
ite
d S
tate
s
Esto
nia
Spain
Lithu
ania
Sin
gapo
re
Bulg
aria
Ita
ly
Ca
nad
a
OE
CD
avera
ge
Ne
w Z
eala
nd
Cro
atia
Turk
ey
Slo
vak R
epub
lic
Czech R
epu
blic
De
nm
ark
Ne
therl
and
s
Co
sta
Ric
a
Ch
ine
se
Taip
ei
Kore
a
Ma
ca
o (
Ch
ina
)
Germ
any
Un
ite
d A
rab E
mira
tes
Uru
guay
Mo
nte
neg
ro
Ru
ssia
Un
ite
d K
ing
dom
Ho
ng K
on
g (
Chin
a)
Tha
iland
Bra
zil
Austr
ia
Fra
nce
Belg
ium
Slo
ven
ia
Me
xic
o
Hu
nga
ry
Ch
ile
Peru
Co
lom
bia
B-S
-J-G
(C
hin
a)
Tun
isia
Sco
re-p
oin
t d
iffe
ren
ce
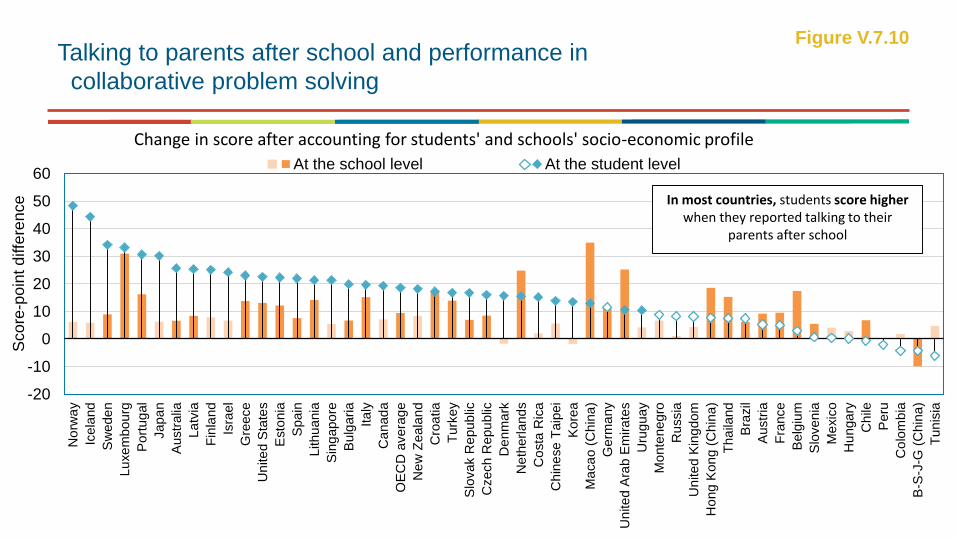
At the school level At the student level
Talking to parents after school and performance in
collaborative problem solving
Figure V.7.10
In most countries, students score higher when they reported talking to their
parents after school
Change in score after accounting for students' and schools' socio-economic profile
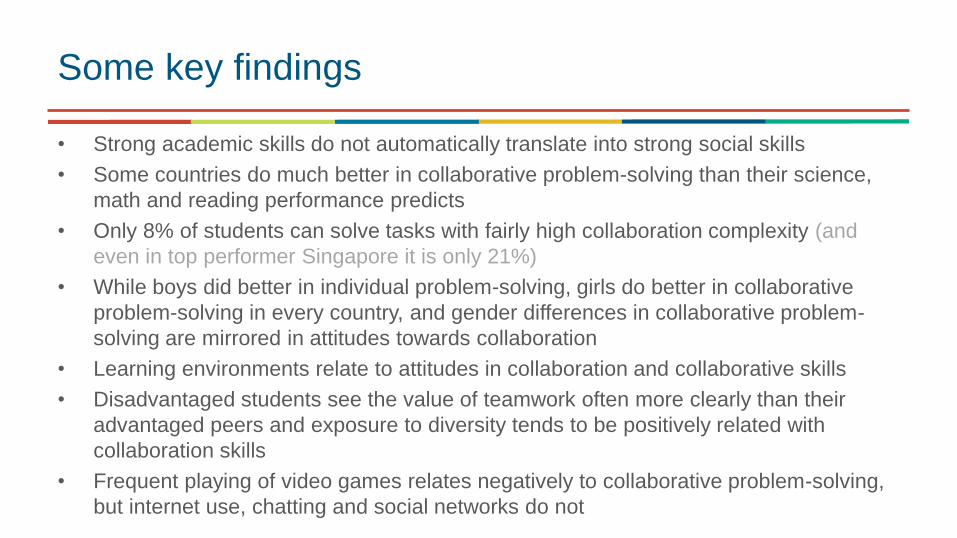
• Strong academic skills do not automatically translate into strong social skills
• Some countries do much better in collaborative problem-solving than their science,
math and reading performance predicts
• Only 8% of students can solve tasks with fairly high collaboration complexity (and
even in top performer Singapore it is only 21%)
• While boys did better in individual problem-solving, girls do better in collaborative
problem-solving in every country, and gender differences in collaborative problem-
solving are mirrored in attitudes towards collaboration
• Learning environments relate to attitudes in collaboration and collaborative skills
• Disadvantaged students see the value of teamwork often more clearly than their
advantaged peers and exposure to diversity tends to be positively related with
collaboration skills
• Frequent playing of video games relates negatively to collaborative problem-solving,
but internet use, chatting and social networks do not
Some key findings
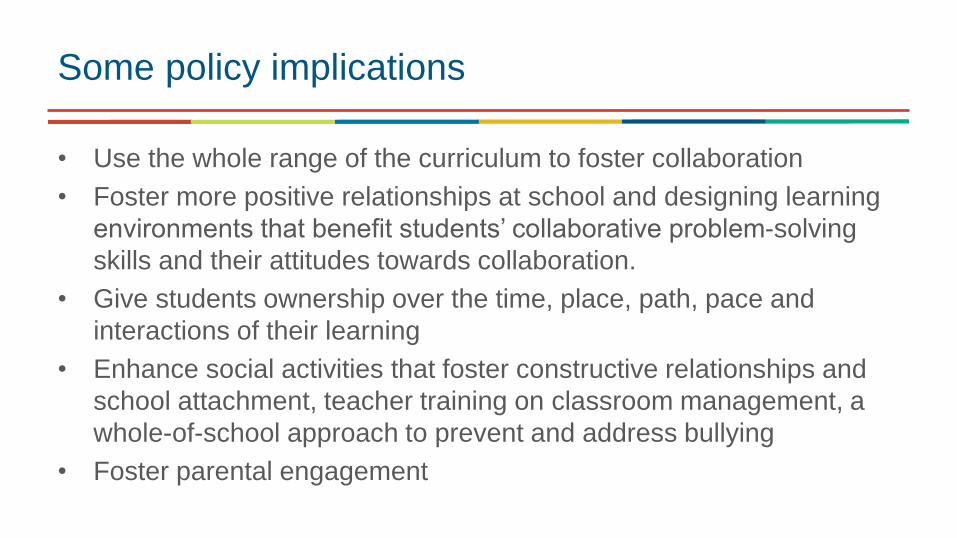
• Use the whole range of the curriculum to foster collaboration
• Foster more positive relationships at school and designing learning
environments that benefit students’ collaborative problem-solving
skills and their attitudes towards collaboration.
• Give students ownership over the time, place, path, pace and
interactions of their learning
• Enhance social activities that foster constructive relationships and
school attachment, teacher training on classroom management, a
whole-of-school approach to prevent and address bullying
• Foster parental engagement
Some policy implications
74
74 Thank you
Find out more about our work at www.oecd.org– All publications
– The complete micro-level database
Email: [email protected]
Twitter: SchleicherEDU
and remember:
Without data, you are just another person with an opinion