collection, management and use of observational data in ... · results of the parallel observations...
TRANSCRIPT

Collection, management and use of observational data
in Romania
Constanta BoroneantNational Meteorological Admnistration, Climate Research Group
Bucharest, RomaniaWMO CCl OPAG1 ET1.2- Expert Team on Observing Requirements and Standards for Climate
e-mail: [email protected]
UNFCCC Expert meeting on Methods and Tools and on Data and Observations under Nairobi Work Programme on Impacts, Vulnerability and Adaptation, 4-7 March 2008, Mexico City
NMA
Outline
Brief description of the Romanian Meteorological network (collection of data), database (management) and use of observational dataSynthesis results of the experiment on parallel observations with automatic and classical stationsHow can Romanian contribute to the implementation of the Nairobi Work Programme
Data and observationsMethods and toolsResearch
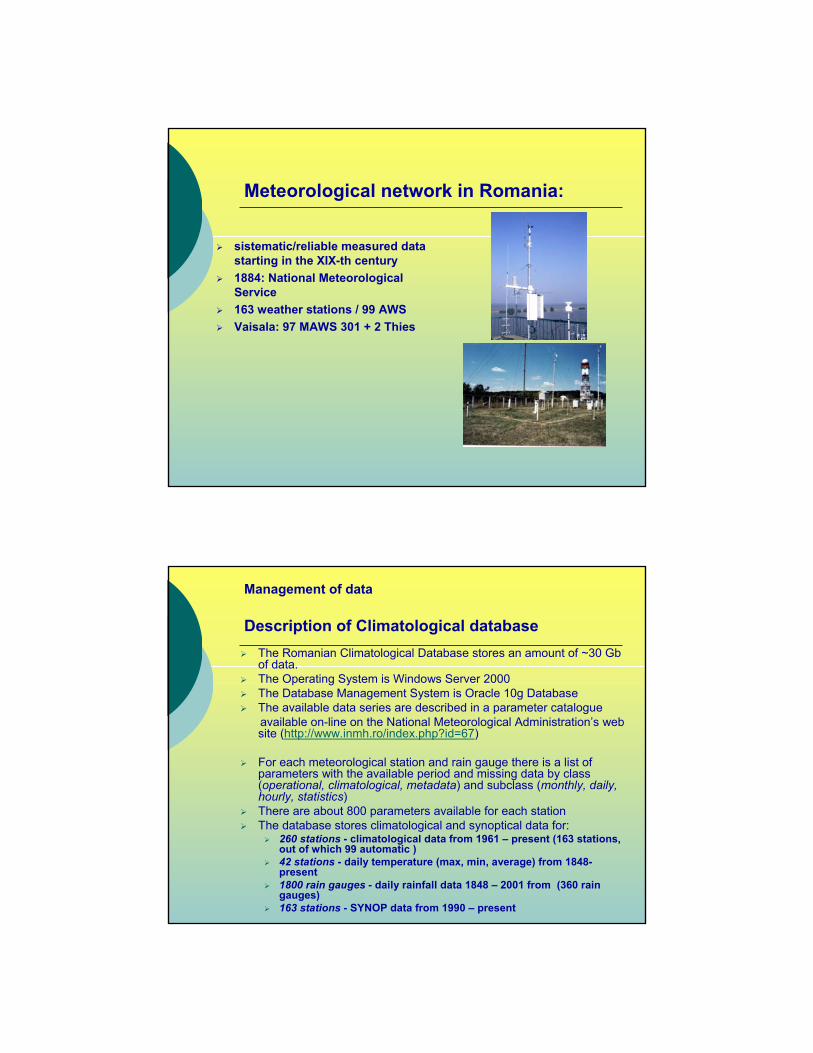
Meteorological network in Romania:
sistematic/reliable measured data starting in the XIX-th century1884: National Meteorological Service163 weather stations / 99 AWS Vaisala: 97 MAWS 301 + 2 Thies
Management of data
Description of Climatological databaseThe Romanian Climatological Database stores an amount of ~30 Gb of data.The Operating System is Windows Server 2000The Database Management System is Oracle 10g DatabaseThe available data series are described in a parameter catalogueavailable on-line on the National Meteorological Administration’s web site (http://www.inmh.ro/index.php?id=67)
For each meteorological station and rain gauge there is a list of parameters with the available period and missing data by class (operational, climatological, metadata) and subclass (monthly, daily, hourly, statistics)There are about 800 parameters available for each stationThe database stores climatological and synoptical data for:
260 stations - climatological data from 1961 – present (163 stations, out of which 99 automatic )42 stations - daily temperature (max, min, average) from 1848-present1800 rain gauges - daily rainfall data 1848 – 2001 from (360 rain gauges)163 stations - SYNOP data from 1990 – present
Availability and data exchange
According to the WMO Resolution 40/1992 + national policy on data exchangeData for 23 stations are freely available in the international network Processed data (statistics, etc) provided on request or as results of the national and/or international projects NMA research teams are involved
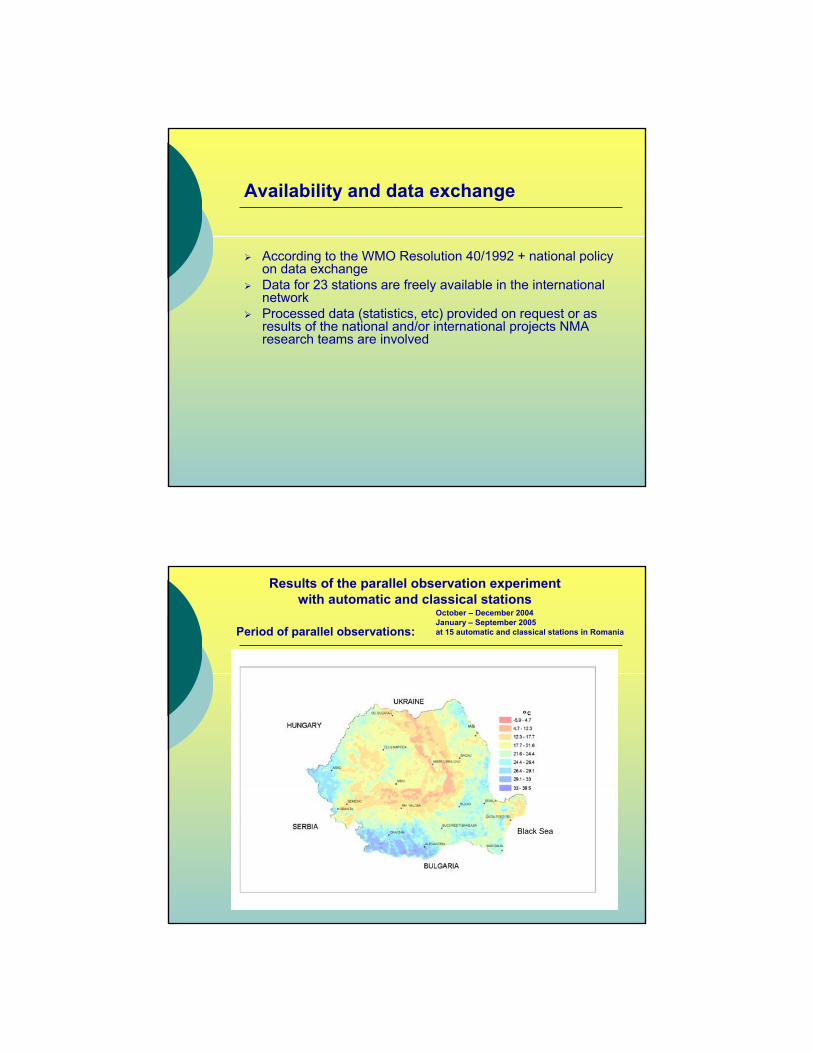
Results of the parallel observation experiment with automatic and classical stations
Black Sea
IASI
Period of parallel observations:October – December 2004January – September 2005at 15 automatic and classical stations in Romania
Results of the parallel observations experiment with automatic and classical stations
Hourly and daily data
characteristics of the differences CWS – AWS (magnitude, frequency, variability)causes of the differences CWS – AWSregionalization
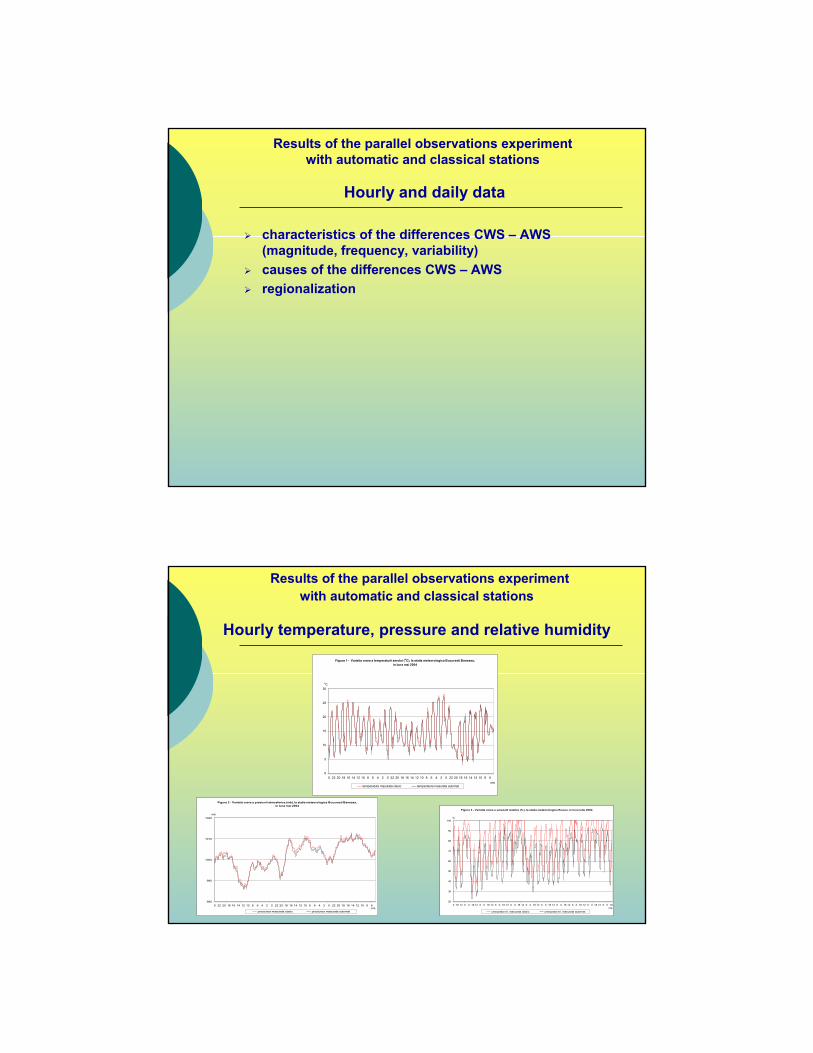
Results of the parallel observations experiment with automatic and classical stations
Hourly temperature, pressure and relative humidityFigura 1 - Variatia orara a temperaturii aerului (oC), la statia meteorologica Bucuresti Baneasa,
in luna mai 2004
0
5
10
15
20
25
30
0 22 20 18 16 14 12 10 8 6 4 2 0 22 20 18 16 14 12 10 8 6 4 2 0 22 20 18 16 14 12 10 8 6ora
oC
temperatura masurata clasic temperatura masurata automat
Figura 2 - Variatia orara a presiunii atmosferice (mb), la statia meteorologica Bucuresti Baneasa, in luna mai 2004
980
990
1000
1010
1020
0 22 20 18 16 14 12 10 8 6 4 2 0 22 20 18 16 14 12 10 8 6 4 2 0 22 20 18 16 14 12 10 8 6ora
mb
presiunea masurata clasic presiunea masurata automat
Figura 3 - Variatia orara a umezelii relative (%), la statia meteorologica Buzau, in luna iulie 2004
20
30
40
50
60
70
80
90
100
0 18 12 6 0 18 12 6 0 18 12 6 0 18 12 6 0 18 12 6 0 18 12 6 0 18 12 6 0 18 12 6 0 18 12 6 0 18 12 6 0 18ora
%
umezeala rel. masurata clasic umezeala rel. masurata automat

Results of the parallel observations experiment
with automatic and classical stations
Minimum and maximum temperature
Figura 4 - Variatia orara a temperaturi minime a aerului, la statia meteorologica Miercurea Ciuc,in luna iulie 2004
0
5
10
15
20
25
30
6 6 6 6 6 6 6 6 6 6 6 6 6 6 6 6 6 6 6 6 6 6 6 6 6 6 6 6 6 6 6ora
oC
temperatura minima masurata clasic temperatura minimia masurata automat
Figura 5 - Variatia orara a temperaturii maxime a aerului, la statia meteorologica Miercurea Ciuc, in luna iulie 2004
0
5
10
15
20
25
30
35
6 6 6 6 6 6 6 6 6 6 6 6 6 6 6 6 6 6 6 6 6 6 6 6 6 6 6 6 6 6 6ora
oC
temperatura maxima masurata clasic temperatura maxima masurata automat
Conclusions on the results of the parallel observation experiment with automatic and classical stations
Possible causes for the differences between CWS and AWS (hourly and daily data):
Human causes: observation errors, registration and/or transfer gaps etc.
Technical causes: different placement of the sensors, different sensibility of the sensors etc.
Results of the parallel observation experiment
with automatic and classical stations
Monthly dataEssential climatic elements
Mean temperatureMinimum temperature Maximum temperatureAir pressureRelative humidity
Monthly means calculated from daily means (24hrs and 1,7,13,19 local time)Standard deviation of the difference between classical and automatic records Correlation coefficient between classical and automatic recordsAmplitude of the difference between classical and automatic records
Results of the parallel observations experiment
with automatic and classical stations
Some statistical parameters

Summary of the resultsof the parallel observations experiment
with automatic and classical stations
Monthly average of the difference between classical and automatic observationsranges between
- 0.24ºC and 0.71ºC for mean temperature- 0.28ºC and 0.87ºC for minimum temperature- 0.01ºC and 0.55ºC for maximum temperature- 0.62 mbar and 2.01 mbar for air pressure- 4.85% and 13.29% for relative humidity
Std dev of the difference between classical and automatic observations ranges between- 0.51ºC and 1.10ºC – mean temperature- 0.43ºC and 2.03ºC – minimum temperature- 0.07ºC and 3.97ºC – maximum temperature- 0.41mbar and 1.37 mbar – air pressure- 6.95% and 8.51% - relative humidity
Summary of the results ( …cont.)
Difference between classical and automatic monthly mean calculated from daily means (1,7 ,13,19 local time)ranges between- 0.20ºC and 0.70ºC for mean temperature- 1.00 mbar and 2.0 mbar for air pressure- 3.30% and 10.00% for relative humidity
Difference between classical and automatic monthly mean calculated from daily means (24hrs)ranges between- 0.30ºC and 0.70ºC for mean temperature- 1.00 mbar and 2.0 mbar for air pressure- 2.80% and 11.00% for relative humidity

Ongoing activities
Need for quality control (daily data), filling gaps and homogenization of monthly, seasonal, annual data
This is an ongoing activity How are we doing that?
Using WMO recommendations in this respect Collaboration in COST Action ES601 - Advances in homogenisation methods of climate series: an integrated approach (HOME )
http://www.homogenisation.org/
Data and observations
Extending the AWS networkQuality control and homogenization of data
Operational activity using dedicated software http://www.climahom.eu/
Research activitiesCOST Action ES601 http://www.homogenisation.org/
Contribution to the European Climate Assessment &Dataset ECA&D projecthttp://eca.knmi.nl/

Methods and tools
Climate monitoringAnnual yearbook on the climatological status for essential climatic elements including specific indices for extremes (temperature and precipitation)Trends for essential climatic elements
Monitoring and warning the extreme events
Methods and tools (cont. )
Regional climate model RegCM3 – ICTP, Trieste, ItalyHigh resolution simulations (10 km) for impact studies 1961-2000; 2020-250; 2070-2100; A1B scenario (FP6 Project -Central and Eastern Europe Climate Change Impact and VulnerabiLIty Assessment – CECILIA (2006-2009)
http://www.cecilia-eu.org/
Statistical downscaling – various methods (CCA, conditional weather generator)
Extreme events (droughts, heat-waves, heavy precipitation) 131 specific indices
Dynamical and statistical downcaling
Impact studies on crop yield using CERES, HYDRUS1D, WOFOST models
Research (selected projects)
EU projects : FP5 - Statistical and regional dynamical downscaling of extremes for european regions STARDEX (2002-2005) http://www.cru.uea.ac.uk/projects/stardex/ACCRETE - Agriculture and Climate Changes: how to Reduce human Effects and Threats (2005-2007) http://www.accrete.eu/. FP6 Projects:
(Central and Eastern Europe Climate Change Impact and VulnerabiLIty Assessment – CECILIA, http://www.cecilia-eu.org/ENSEMBLE - based Predictions of Climate Changes and their Impacts
http://ensembles-eu.metoffice.com/
Bilateral Collaborations:Italy: Changes in the characteristics of extreme climate events in southern and
Southeastern Europe (2007-2008)Bulgaria : Observed changes in precipitation regime in the Danube river lower basin
in the context of climate change (2008-2010)
MonitoringMonitoring
Observed trends Observed trends in seasonal and annual in seasonal and annual
temperature and precipitationtemperature and precipitation
Some examples
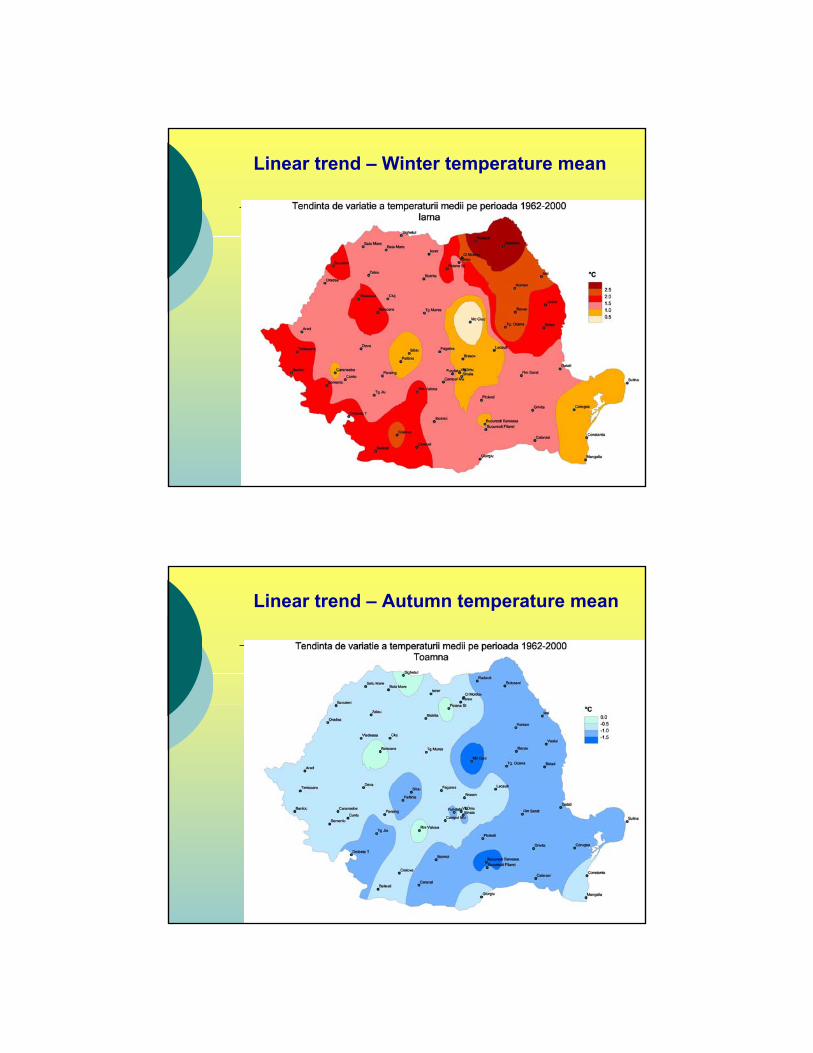
Linear trend – Winter temperature mean
Linear trend – Autumn temperature mean
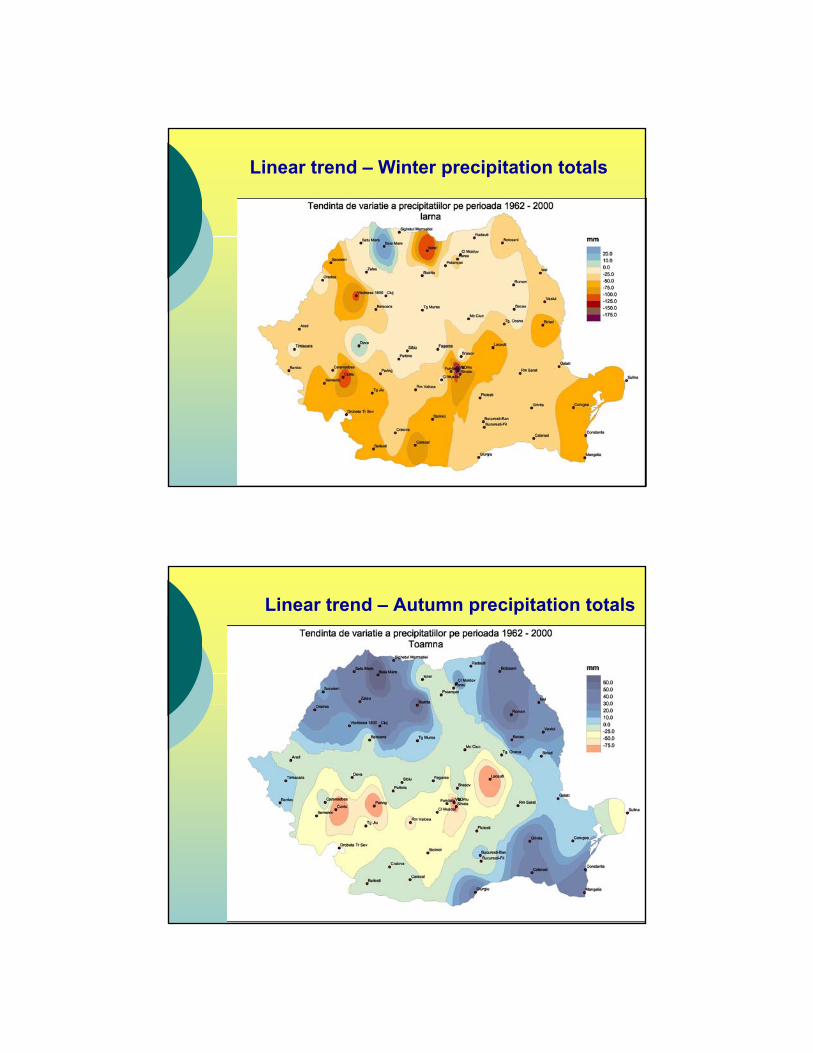
Linear trend – Winter precipitation totals
Linear trend – Autumn precipitation totals

Global mean temperatures are rising faster with time
150 0.045±0.012100 0.074±0.01850 0.128±0.02625 0.177±0.052
Warmest 12 years:1998,2005,2003,2002,2004,2006, 2001,1997,1995,1999,1990,2000
Period Rate
Years °/decade
Majour extreme eventsMajour extreme events
Heavy precipitation and floods 2005Heavy precipitation and floods 2005
Exceptionally warm year 2007
Heat waves 2007
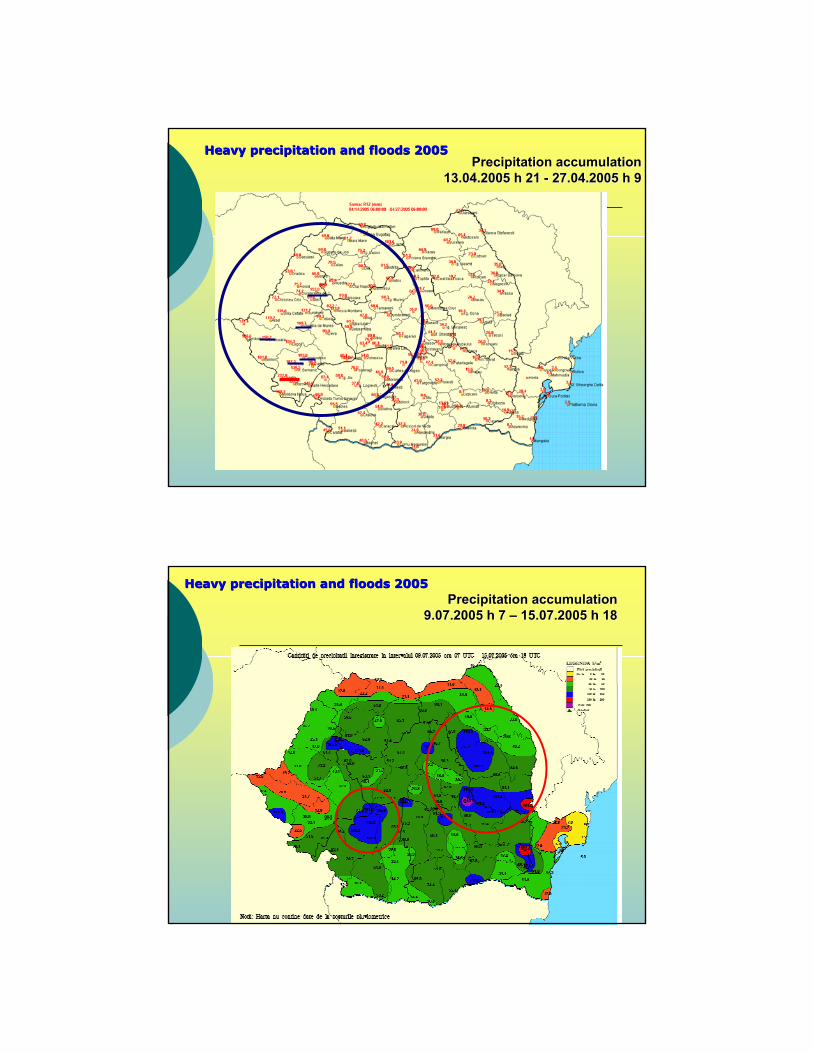
Precipitation accumulation Precipitation accumulation 13.04.2005 h 21 13.04.2005 h 21 -- 27.04.2005 h 927.04.2005 h 9
Heavy precipitation and floods 2005Heavy precipitation and floods 2005
Precipitation accumulation Precipitation accumulation 9.07.2005 h 7 9.07.2005 h 7 –– 15.07.2005 h 1815.07.2005 h 18
Heavy precipitation and floods 2005Heavy precipitation and floods 2005
The Extremes of The Extremes of 20072007
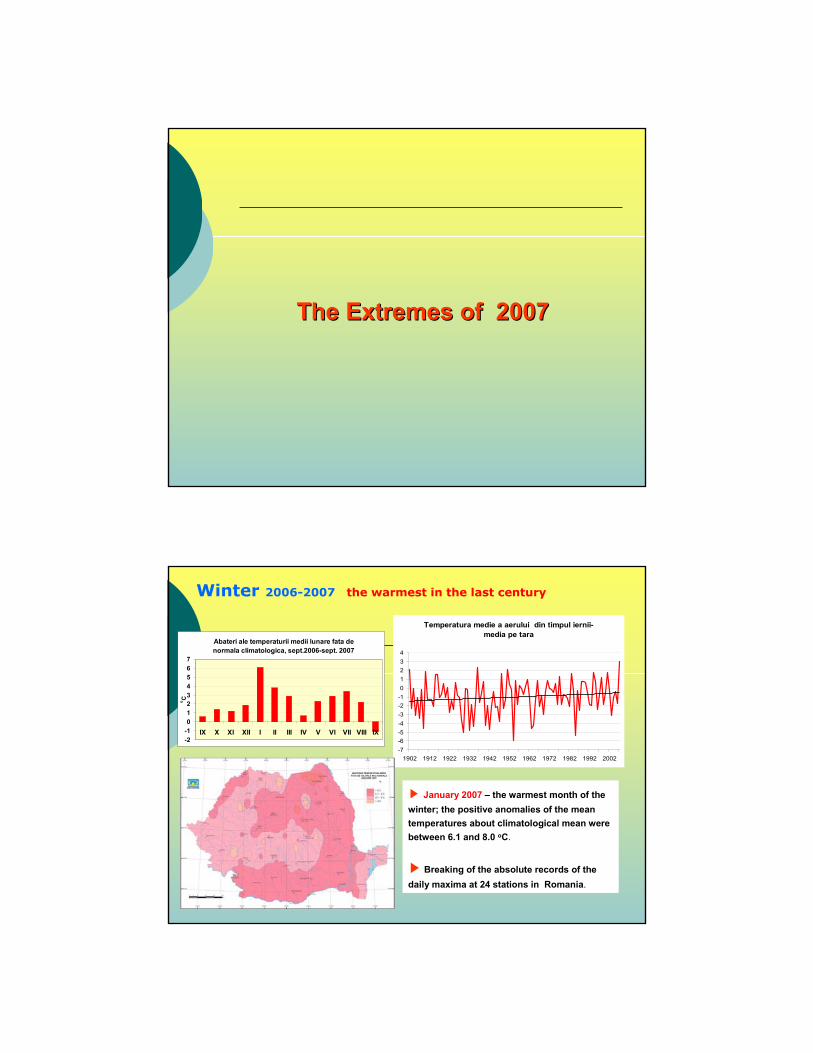
Winter 2006-2007 the warmest in the last century
Abateri ale temperaturii medii lunare fata de normala climatologica, sept.2006-sept. 2007
-2-101234567
IX X XI XII I II III IV V VI VII VIII IX
o C
Temperatura medie a aerului din timpul iernii-media pe tara
-7-6-5-4-3-2-101234
1902 1912 1922 1932 1942 1952 1962 1972 1982 1992 2002
▶ January 2007 – the warmest month of the winter; the positive anomalies of the mean temperatures about climatological mean were between 6.1 and 8.0 oC.
▶ Breaking of the absolute records of the daily maxima at 24 stations in Romania.
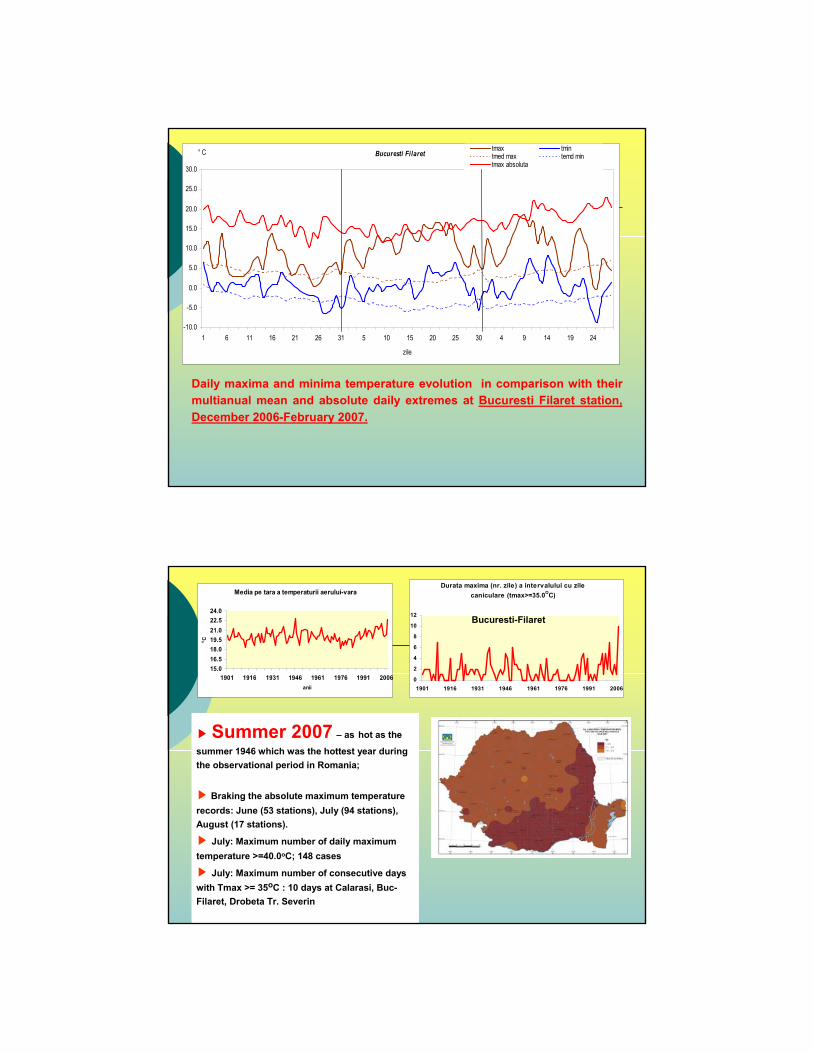
Bucuresti Filaret
-10.0
-5.0
0.0
5.0
10.0
15.0
20.0
25.0
30.0
1 6 11 16 21 26 31 5 10 15 20 25 30 4 9 14 19 24
zile
° C tmax tmintmed max temd mintmax absoluta
Daily maxima and minima temperature evolution in comparison with their multianual mean and absolute daily extremes at Bucuresti Filaret station, December 2006-February 2007.
Decembrie 2006
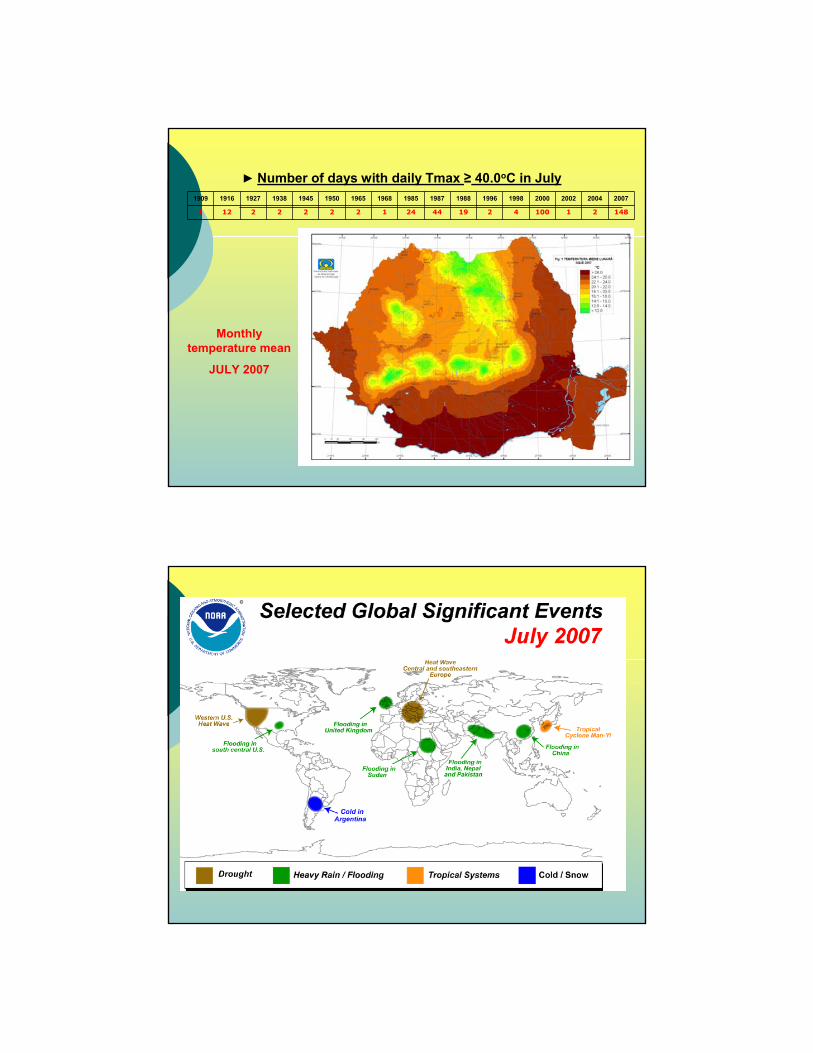
Media pe tara a temperaturii aerului-vara
15.016.518.019.521.022.524.0
1901 1916 1931 1946 1961 1976 1991 2006anii
o C
Durata maxima (nr. zile) a intervalului cu zile caniculare (tmax>=35.0OC)
0
2
4
6
8
10
12
1901 1916 1931 1946 1961 1976 1991 2006
▶Summer 2007 – as hot as the
summer 1946 which was the hottest year during the observational period in Romania;
▶ Braking the absolute maximum temperature records: June (53 stations), July (94 stations), August (17 stations).
▶ July: Maximum number of daily maximum temperature >=40.0oC; 148 cases
▶ July: Maximum number of consecutive days with Tmax >= 35oC : 10 days at Calarasi, Buc-Filaret, Drobeta Tr. Severin
Bucuresti-Filaret
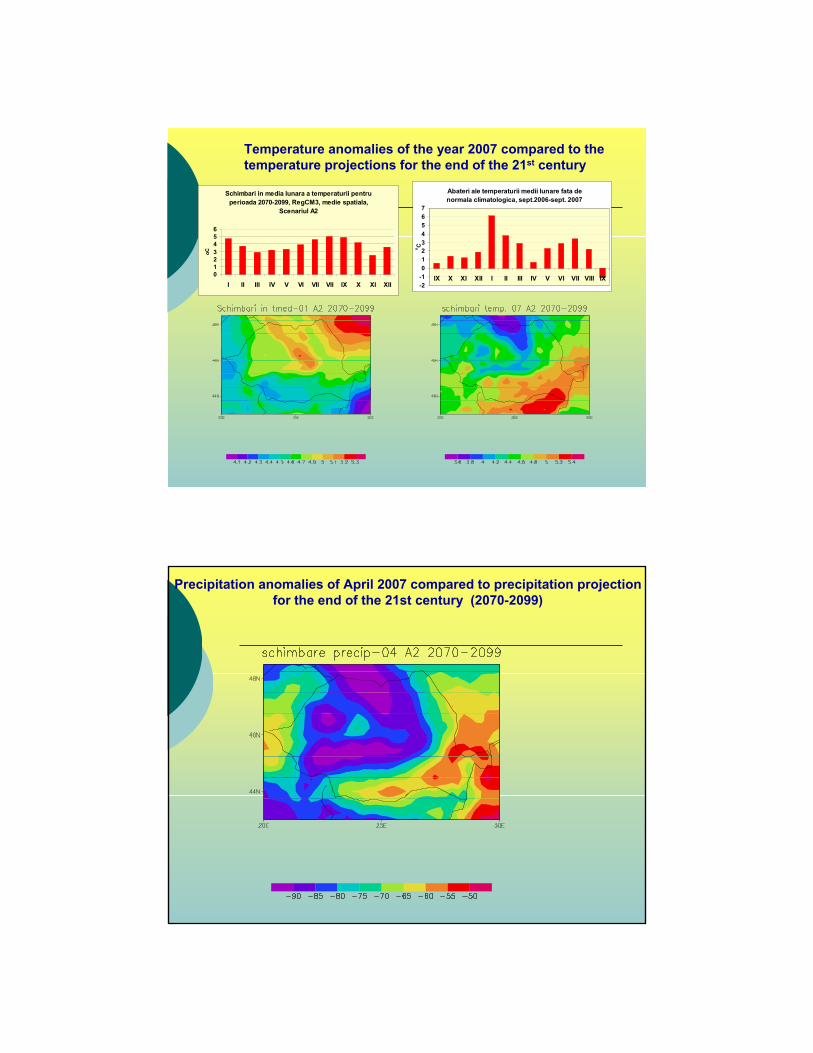
► Number of days with daily Tmax ≥ 40.0oC in July1909 1916 1927 1938 1945 1950 1965 1968 1985 1987 1988 1996 1998 2000 2002 2004 2007
1 12 2 2 2 2 2 1 24 44 19 2 4 100 1 2 148
Monthly temperature mean
JULY 2007
Temperature anomalies of the year 2007 compared to the temperature projections for the end of the 21st century
Schimbari in media lunara a temperaturii pentru perioada 2070-2099, RegCM3, medie spatiala,
Scenariul A2
0123456
I II III IV V VI VII VII IX X XI XII
oC
Abateri ale temperaturii medii lunare fata de normala climatologica, sept.2006-sept. 2007
-2-101234567
IX X XI XII I II III IV V VI VII VIII IX
o C
Precipitation anomalies of April 2007 compared to precipitation projectionfor the end of the 21st century (2070-2099)
