collectively agreed wages in finland
TRANSCRIPT

281
Collectivelyagreed wages
in Finland
Pekka Sauramo
� � � � � � � � � � � � � � � � � � � � � � � � � � � � � � � �� � � � � � � � � � � � � � � � � � � � � � � � � � � � � � � � � � ! � � � � � � � � � " � " � � �
# $ % & ' ( ) ' * + , *- . / 0 1 2 3 2 4 5 0 1 2 3 5 6 7 8 6 / 4 9 : ; < = 2 5 7 > 4 ? 6 @ A / 0 ? / / 3 1 B 4 4 C ? 7 D 7 5 E 0 C 3 6 4 E B F G < H : D I J K 4 L M 4 C 0 C ? 7 N N 3 B 7 5 3 6 0 7 CA 0 6 / 6 / 4 O 4 5 P 3 C G 3 C 1 Q R ? S N 4 5 T 7 L C E 3 6 0 7 C 3 C E ? 7 D U C 3 C ? 4 E B F 3 V 5 3 C 6 8 5 7 P 6 / 4 = L 5 7 2 4 3 C 9 7 P P 0 1 1 0 7 C W< 6 A 3 1 A 5 0 6 6 4 C 3 1 3 B 3 ? S V 5 7 L C E 2 3 2 4 5 8 7 5 3 ? 7 C 8 4 5 4 C ? 4 X 9 7 N N 4 ? 6 0 M 4 N F 3 V 5 4 4 E A 3 V 4 1 0 C = L 5 7 2 4 Y 9 / 3 N N 4 C V 4 10 C 6 / 4 1 6 3 6 0 1 6 0 ? 3 N 3 C E 2 7 N 0 6 0 ? 3 N U 4 N E Z / 4 N E 3 6 Q 5 L 1 1 4 N 1 @ [ \ ] 7 M 4 P B 4 5 [ ^ _ [ W < 7 A 4 1 2 4 ? 0 3 N 6 / 3 C S 1 6 7 G 3 5 5 0] L P P 0 N 3 3 C E : C C 0 C 3 ` 7 L M 0 C 4 C a b 6 3 6 0 1 6 0 ? 1 T 0 C N 3 C E c 8 7 5 E 3 6 3 3 C E E 4 6 3 0 N 4 E ? N 3 5 0 U ? 3 6 0 7 C 1 ? 7 C ? 4 5 C 0 C V 6 / 4T 0 C C 0 1 / 1 F 1 6 4 P 7 8 P 4 3 1 L 5 0 C V ? 7 N N 4 ? 6 0 M 4 N F 3 V 5 4 4 E A 3 V 4 1 W < 3 N 1 7 6 / 3 C S G 4 N 4 C 3 d 4 C 6 6 0 a 9 4 C 6 5 3 N e 5 V 3 C 0 1 3 6 0 7 C7 8 T 0 C C 0 1 / . 5 3 E 4 J C 0 7 C 1 @ P 4 P B 4 5 7 8 6 / 4 < C 8 7 5 P 3 6 0 7 C 9 7 P P 0 6 6 4 4 7 C 9 7 1 6 3 C E < C ? 7 P 4 f 4 M 4 N 7 2 P 4 C 6 1 c 3 C Eg 7 5 P 3 : C 6 0 N 3 a h 4 6 3 N A 7 5 S 4 5 1 Z J C 0 7 C @ P 4 P B 4 5 7 8 6 / 4 < C 8 7 5 P 3 6 0 7 C 9 7 P P 0 6 6 4 4 7 C 9 7 1 6 3 C E < C ? 7 P 4f 4 M 4 N 7 2 P 4 C 6 1 c 8 7 5 L 1 4 8 L N ? 7 P P 4 C 6 1 7 C 3 C 4 3 5 N 0 4 5 E 5 3 8 6 7 8 6 / 0 1 5 4 2 7 5 6 W . / 4 L 1 L 3 N E 0 1 ? N 3 0 P 4 5 3 2 2 N 0 4 1 W- - K 3 B 7 L 5 < C 1 6 0 6 L 6 4 8 7 5 = ? 7 C 7 P 0 ? ` 4 1 4 3 5 ? / @ d 0 6 S i C 1 0 N N 3 C 5 3 C 6 3 j : @ ^ ^ k j ^ G 4 N 1 0 C S 0 @ T 0 C N 3 C E @d 4 S S 3 W b 3 L 5 3 P 7 l K 3 B 7 L 5 W U
m n o p q p r s r t m q u v wx t y z { y y t | } p q p r s y u v wp ~ � � ~ � � ~ ~ � � � � � � � � � � � � � ~ � � � �p � � � � � � � � � ~ � � ~ � � ~ � q � � � � � � � � � � � � � �p � � � � � � u � � � � � � �y � � � � � � � � � � � � � � � � � � � � � � � � � � � � ~ � � � � � �� ~ � � � � t � � � � � � � � � � � r � � � � � � � s � � � ~ � � �p � � � � � � � � � ~ � � ~ � � ~ � q � � t � � � � � � � � � � � � � � � � � � ~ � ¡m � � � � � � � � ¢ � � v � u � � � � � � �r � ~ � � � � � � � � ~ � � � � � � � ~ � � � � ~ � � � � � �t y £ } � � v ¤ � � u ¤ u � � ¤ w w w ¤ ¥ ¦ � ¡ � §t y y } w � � � ¤ w v � w ¦ � ¡ � §
1
TIIVISTELMÄ
Sopimuspalkkojen muutoksia mitataan Suomessa indekseillä, jotka kuvaavat sopimuskorotusten
vaikutusta keskimääräiseen ansiotasoon. Tilastokeskus laskee sopimuspalkkaindeksiä osana ansio-
tasoindeksin laskemista. Ansiotaso on tärkein keskimääräisen ansiotason muutoksia kuvaava indek-
si. Sopimuspalkkaindeksiä laskiessaan Tilastokeskus ei hyödynnä tietoja taulukkopalkkojen tasosta.
Palkkaneuvottelujen korkean koordinaation takia sopimuskorotukset ovat olleet samankaltaisia ta-
louden eri sektoreilla. Palkkaliukumat ovat pysyneet suhteellisen vakaina ilman selkeitä muutos-
trendejä.
ABSTRACT
Collectively agreed wages in Finland are measured by indices which describe contributions of
collectively agreed wage increases to increases in average wages. Statistics Finland, which produces
the data, constructs the Index of Negotiated Wages and Salaries within the same methodological
framework as the Index of Wage and Salary Earnings, which is the most important index describing
developments in average wages. Statistics Finland does not utilize information on tariff wage levels
in the description of collectively agreed wage developments. Because of a high degree of
centralization and co-ordination, collectively agreed wage increases have been similar in various
sectors of the economy. Wage drift in the whole economy has been relatively stable without any
observed trends.
JEL classification: C80, J30, J52
Key words: collective bargaining, collectively agreed wages, wage drift
2
1. INTRODUCTION
This report is the Finnish contribution to the CAWIE project.1 The general aim of the project is to
improve knowledge of collectively agreed wages in Europe. This kind of knowledge is important in
order to understand the contribution of collectively agreed wages to overall wage developments in
Europe. Understanding the importance of collectively agreed wages to wage determination is an
essential prerequisite for the promotion of social dialogue in the EU.
The report includes two main parts: an investigation of the existing data and methods of data
collections on collectively agreed wages, and a descriptive analysis of the development of
collectively agreed wages and actual wages in Finland. The contribution of collectively agreed
wages to actual wages is analysed by examining the developments of wage drift.
Since methods of data collections may be heavily influenced by national collective bargaining
systems, the main features of the Finnish system are briefly described first of all. Special attention is
paid to those trends which may have influenced the developments of wage drift in Finland.
Following this, the Finnish approach to the production of data on collectively agreed wages is
introduced. Finland is a country where the collective bargaining system has strongly affected the
manner in which data on collectively agreed wages have been collected and measured.
The fourth section presents a descriptive analysis of the development of collectively agreed wages
in Finland during the period 1995-2010. The analysis is combined with the examination of the
evolution of wage drift by the major sectors of the economy.
Some concluding comments are presented in the final section.
1 The other reports are on Austria, Belgium, France, Germany, Italy, the Netherlands, Portugal, Spain and the UK.
3
2. THE COLLECTIVE BARGAINING SYSTEM IN FINLAND
Finland has a lengthy history of an incomes policy which has been based on centrally negotiated
incomes policy agreements. They have resulted from tripartite co-operation between employees’
and employers’ central confederations and the Government. The Finnish system can be
characterised as a three-level one, with three-partite negotiations constituting the highest level.
However, there has not been a formal legal basis for this kind of centralisation of nationwide wage
bargaining. The Finnish history of an incomes policy largely reflects the political history of Finland.
Finnish incomes policy agreements have been broader than ordinary wage agreements. They have
included, for example, major changes in earnings-related social security and in transfer payments in
general (Kiander, Sauramo & Tanninen, 2011).
Because centrally negotiated agreements have not been presuppposed by law, they have not legally
bound member trade unions or employer federations. Centrally negotiated agreements have
therefore been submitted to them for approval. If accepted, sectoral agreements have been
concluded by the use of comprehensive collective agreements as guidelines. If not accepted, sector-
level agreements have been concluded without such guidelines.
Sector-level agreements have set the legally enforceable minimum standards for companies
operating in the respective sector, minimum wages included. There is no minimum wage legislation
in Finland. A sectoral agreement is binding for all employers belonging to the signatory employer
organization. Furthermore, if a collective agreement covers about half of the employees in question,
the collective agreement has been interpreted as being universally binding (the so-called erga
omnes applicability).
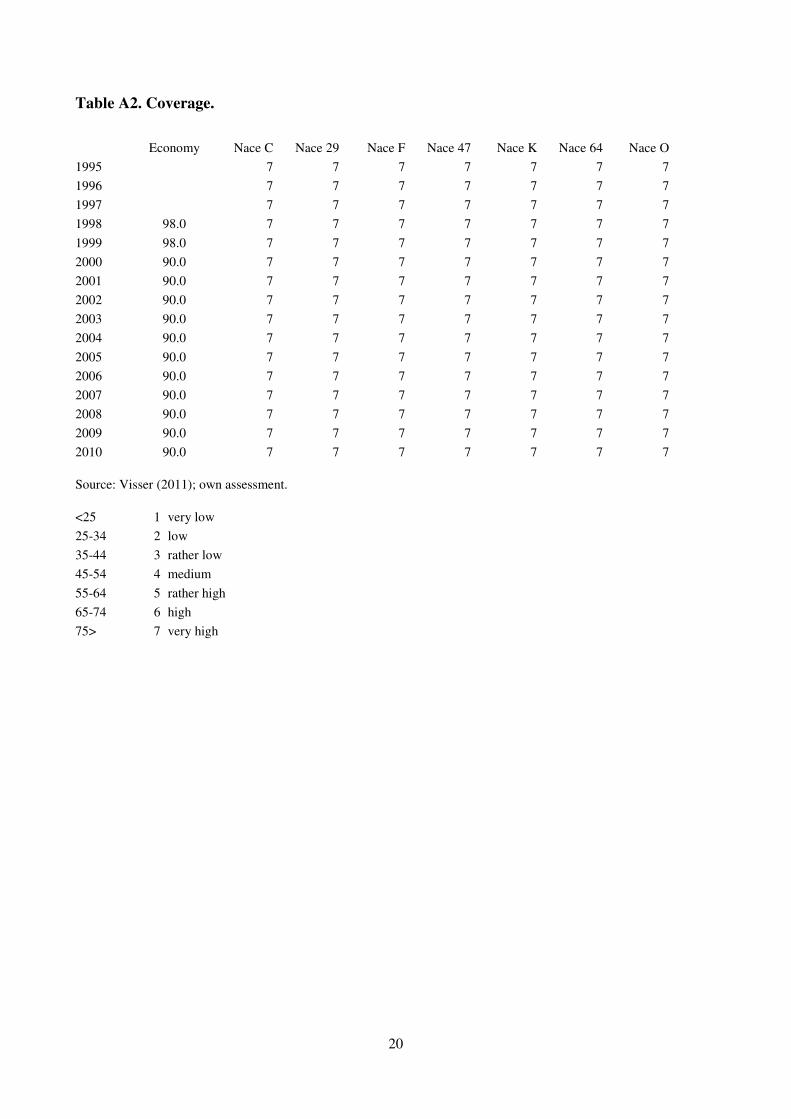
This is one reason for the high coverage of collective agreements in Finland. It has amounted to
some 90 per cent of the employed labour force without any noticeable decline (see Table A2).
In sectoral collective agreements some issues have normally been left for local-level negotiations
(the third level of negotiations). Alternatively, parties have allowed deviations of the basic
conditions of collective agreements.
Even though Finland has had a lengthy history of an incomes policy, pressures to change the
bargaining system have increased, especially during the past fifteen years. Among the participants
in tripartite co-operation, employers’ associations have been the most active ones in questioning the
benefits of centrally negotiated incomes policy agreements. Sectoral agreements in the mid-1990s
4
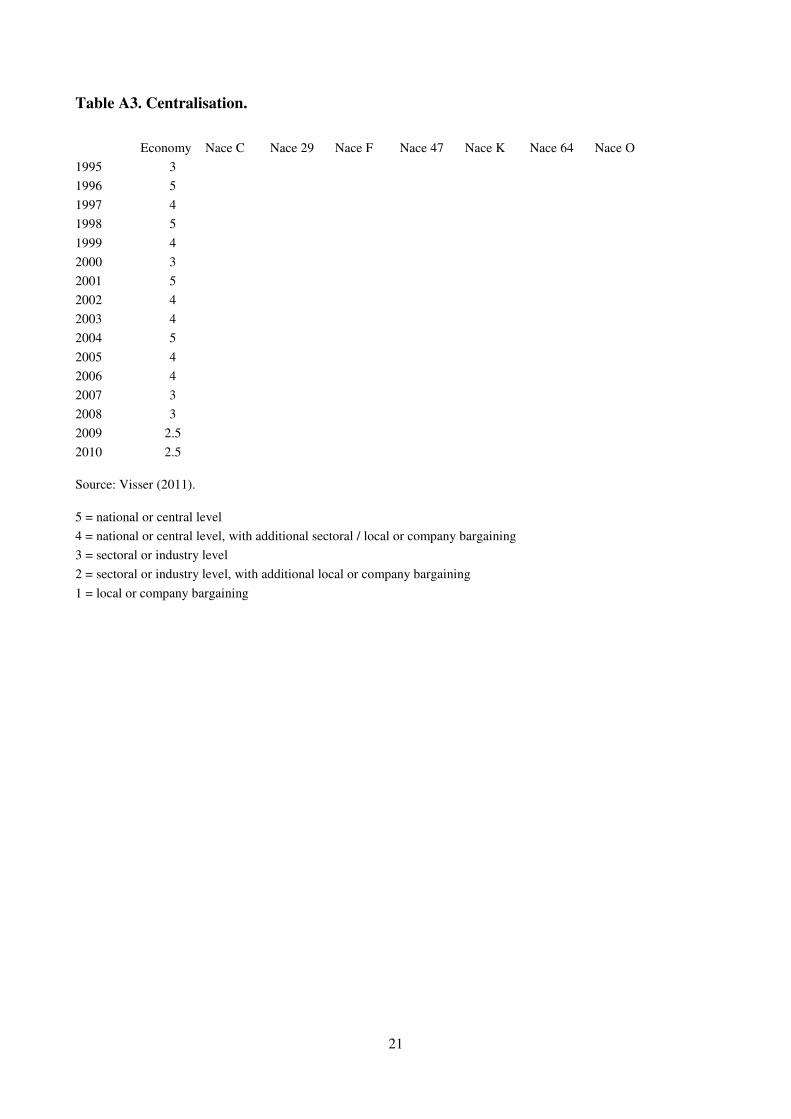
largely reflected employers’ attitudes to centrally negotiated agreements. They did not mark the end
of an incomes policy, however (see Table A3). One reason for the continuation of nationwide
centrally agreed comprehensive incomes policy agreements has been the fact that they have
delivered the wage moderation which employers have been pursuing (Uusitalo, 2005).
However, when the Confederation of Finnish Industries, which is the peak organization of Finnish
employers, declared in 2007 before the next round of wage negotiations that it would not take part
in the negotiations, it was commonly believed that it would be the end of comprehensive incomes
policy settlements in Finland. Sectoral agreements which were concluded after the declaration
confirmed that kind of view (see Table A3). Yet, the latest comprehensive framework agreement
concluded after tripartite negotiations in October 2011 easily fulfils the definition of a
comprehensive incomes policy agreement even though labour market partners, especially
employers, have avoided using that kind of expression.
Like employers’ associations in many countries, Finnish employers’ federations have aimed at
enhancing the role of the local or company level in wage determination. This aim has also been
realized. In addition, centrally negotiated agreements have included pay components, the so-called
sectoral allowances, which could have been concluded at the local level. During the past fifteen
years, the importance of performance-related pay has increased, too. This is one reason why wage-
setting has become more decentralized and more company-specific. It can be said that wage
bargains have kept co-ordinated control of the general rise in average wages, but otherwise the
importance of the local level has increased (Uusitalo and Vartiainen, 2009). In general, trade unions
have taken the view that local bargaining should be developed as part of the established system of
wage negotiations.
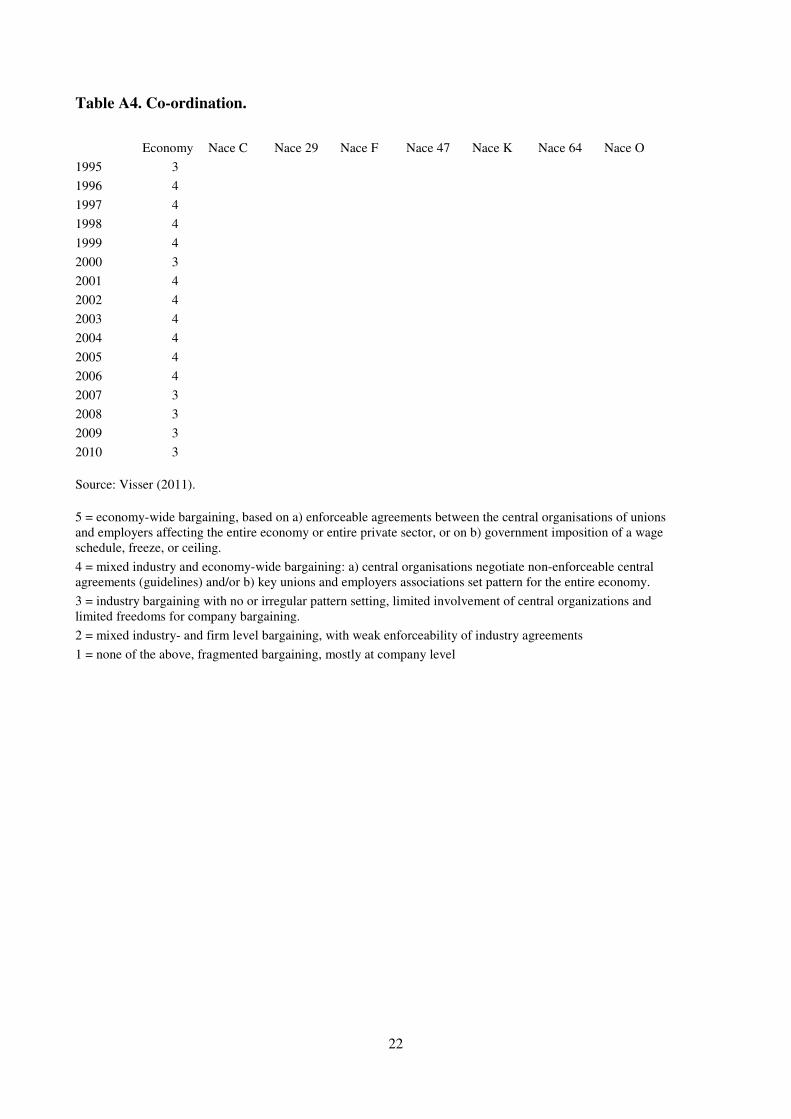
Despite the tendency towards decentralization and less co-ordination the degrees of centralisation
and bargaining co-ordination have still been high in Finland (Tables A3 and A4). A noteworthy
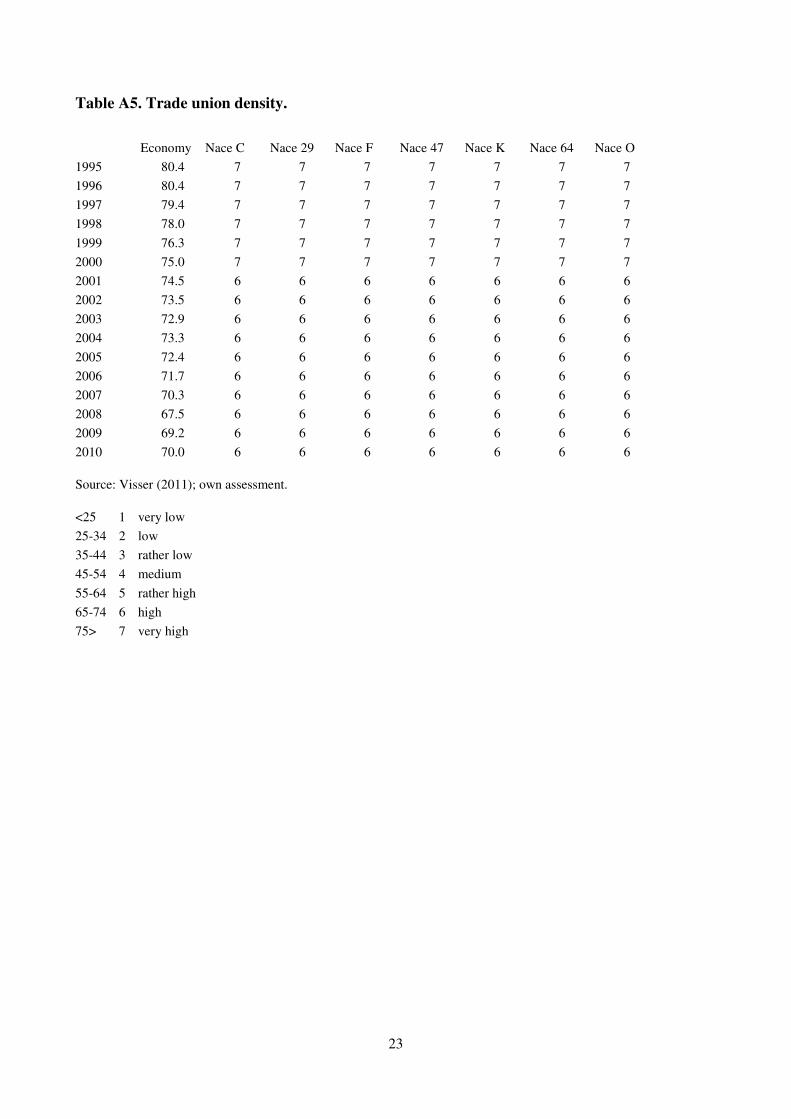
drop in trade union membership has taken place, however (Table A5). This has been mainly due to
the growth in the number of non-unionised unemployment fund members. Böckerman and Uusitalo
identify this factor as the most important reason for the over 10 percentage point decline in union
density (Böckerman and Uusitalo, 2006). Through trade unions, employees have also traditionally
been members of unemployment funds, but since the 1990s the opportunities to acquire
unemployment insurance through other funds too have increased.
5
3. HOW DATA ON COLLECTIVELY AGREED WAGES ARE
COLLECTED AND MEASURED IN FINLAND
3.1 Collectively agreed pay increases as a part of the measurement of average wages
As regards collecting data on collectively agreed wages, the Finnish system contains specific
features which reflect the tradition of concluding comprehensive nationwide incomes policy
agreements. Statistics Finland, which produces the data, measures the effects of collective
agreements on average pay increases in a manner that illustrates the special needs of negotiators
participating in incomes policy negotiations. They would normally have liked to know, among other
things, how large the contribution of collectively agreed wage increases was to the level of average
earnings for regular working hours. This is the question which the Finnish system gives answers to.
Statistics Finland measures the developments of average wage earnings and the contribution of
collectively agreed wage increases to them by indices. Of these, the indices measuring the
contribution of collectively agreed wages are relative indices. They directly describe the
contribution of collectively agreed wage increases to the level of the index which describes
developments of average wage earnings for regular working hours. Accordingly, wage drift can be
defined and measured by the use of indices in which the weight structure is the same for indices
describing the developments of average wages and the contributions of collectively agreed wage
increases to average wages.
This can be expressed formally as follows. Assume that a
tW stands for average wage level at time t
and that it consists of two components ca
tW and d
tW such that
1(1) (1 )a ca d ca a d
t t t t t tW W W w W W−
≡ + = + + .
1(1 )ca ca a
t t tW w W−
= +
describes the contribution of collectively agreed wage changes ca
tw to the
average wage level and the residual d
tW the contribution of wage drift, respectively. If the
proportional change of average wage level 1/ 1a a a
t t tw W W−
= − and ca
tw is known, wage drift is
obtained as follows:
1
(2)d
a catt ta
t
Ww w
W−
= −
6
In Finland changes in indices for collectively agreed wages measure contributions like ca
tw . Index
data on collectively agreed wages therefore describe collectively agreed pay increases but not
collectively agreed pay levels. The advantage of the Finnish system is that it allows for the
estimation of wage drift in a consistent and coherent manner. The drawback is that potentially
useful information included in data on developments of tariff wages are not documented nor
utilised. This is also the reason for omitting tariff wages in this report.
Since the 1980s the Ministry of Justice has maintained a collection of databases comprising the
essentials of Finnish legislation (the so-called FINLEX). As part of the section of secondary
legislation it has a database which contains those collective agreements with erga omnes
applicability. They include, of course, sector-specific pay schedules or pay scales in which, for
example, tariff wages for different jobs and grades of skill are specified. However, Statistics
Finland has not utilised data on tariff wages in order to construct longer series on collectively
agreed pay levels. The main reason has most probably been the fact that collectively agreed pay
increases have been far more important factors affecting the average level of earnings in Finland. In
particular, the across-the-board increases specified, for example, in comprehensive nationwide
incomes policy agreements have played a decisive role in shaping average wage developments.
3.1.1 Two indices: the Index of Negotiated Wages and Salaries and the Index of Wage and Salary
Earnings
Statistics Finland measures the contributions of collectively agreed wage increases to average
earnings (for regular working hours) by means of the Index of Negotiated Wages and Salaries. As
source data Statistics Finland uses collective agreements filed at the central employer
organisations.2 In compiling series of indices it utilizes their assessments of the contribution of
collectively agreed wages to average earnings.3 Table 1 summarizes the basic features of the index.
As outlined above, the index of negotiated wages and salaries is constructed within the same
methodological framework as the Index of Wage and Salary Earnings. This index is the most
important index in the measurement and description of developments of average earnings for the
regular working hours of full-time employees in Finland. It measures wage developments in four
2 Even though this kind of asymmetry between employers’ and employees’ organizations has not created serious
problems or disputes, employees’ organizations would like to have all collectively agreed wage increases compiled at
one (neutral) place like Statistics Finland. The Confederation of Finnish Industries has been reluctant to change the
current system.
3 There have been occasions when trade unions have interpreted collective agreements differently than Statistics
Finland, but usually the system has worked properly.
7
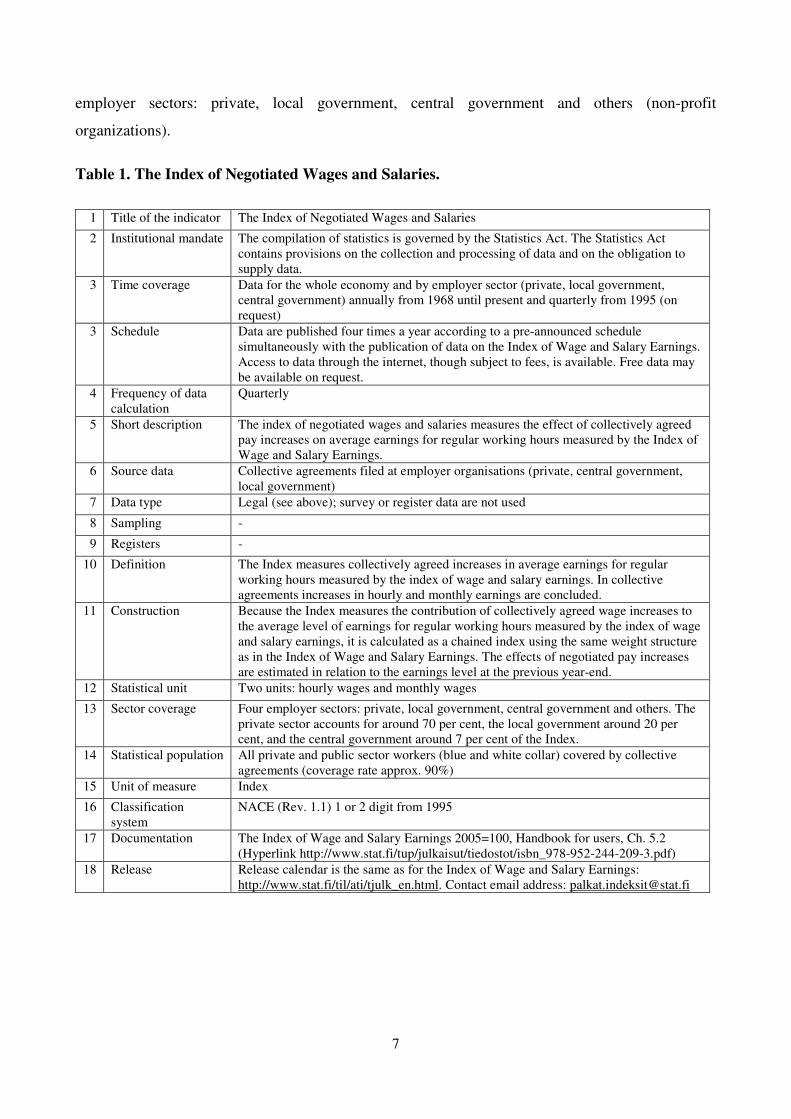
employer sectors: private, local government, central government and others (non-profit
organizations).
Table 1. The Index of Negotiated Wages and Salaries.
1 Title of the indicator The Index of Negotiated Wages and Salaries
2 Institutional mandate The compilation of statistics is governed by the Statistics Act. The Statistics Act
contains provisions on the collection and processing of data and on the obligation to
supply data.
3 Time coverage Data for the whole economy and by employer sector (private, local government,
central government) annually from 1968 until present and quarterly from 1995 (on
request)
3 Schedule Data are published four times a year according to a pre-announced schedule
simultaneously with the publication of data on the Index of Wage and Salary Earnings.
Access to data through the internet, though subject to fees, is available. Free data may
be available on request.
4 Frequency of data
calculation
Quarterly
5 Short description The index of negotiated wages and salaries measures the effect of collectively agreed
pay increases on average earnings for regular working hours measured by the Index of
Wage and Salary Earnings.
6 Source data Collective agreements filed at employer organisations (private, central government,
local government)
7 Data type Legal (see above); survey or register data are not used
8 Sampling -
9 Registers -
10 Definition The Index measures collectively agreed increases in average earnings for regular
working hours measured by the index of wage and salary earnings. In collective
agreements increases in hourly and monthly earnings are concluded.
11 Construction Because the Index measures the contribution of collectively agreed wage increases to
the average level of earnings for regular working hours measured by the index of wage
and salary earnings, it is calculated as a chained index using the same weight structure
as in the Index of Wage and Salary Earnings. The effects of negotiated pay increases
are estimated in relation to the earnings level at the previous year-end.
12 Statistical unit Two units: hourly wages and monthly wages
13 Sector coverage Four employer sectors: private, local government, central government and others. The
private sector accounts for around 70 per cent, the local government around 20 per
cent, and the central government around 7 per cent of the Index.
14 Statistical population All private and public sector workers (blue and white collar) covered by collective
agreements (coverage rate approx. 90%)
15 Unit of measure Index
16 Classification
system
NACE (Rev. 1.1) 1 or 2 digit from 1995
17 Documentation The Index of Wage and Salary Earnings 2005=100, Handbook for users, Ch. 5.2
(Hyperlink http://www.stat.fi/tup/julkaisut/tiedostot/isbn_978-952-244-209-3.pdf)
18 Release Release calendar is the same as for the Index of Wage and Salary Earnings:
http://www.stat.fi/til/ati/tjulk_en.html. Contact email address: [email protected]

8
Wage data for the private sector employees consist of datasets compiled by the major employer
organizations. They include, for example, datasets for manufacturing and service industries
compiled by the Confederation of Finnish Industries.4 These data are complemented by wage data
collected through Statistics Finland’s wage and salary surveys for those industries where the
proportion of organised employers is lower than average.
The index of wage and salary earnings is a Laspeyres unit value index with fixed weights at the
industry level. The base year has been changed every fifth year, the year 2005 being the latest base
year. The index series for the whole economy is obtained by weighting 70 industry-specific indices.
Industry weights are similar to the total wage sums reported in the National Accounts. When indices
are computed for the public sector, the structure and earnings survey is utilised.
The industry-specific series are obtained by weighting the so-called base series. Overall, the wage
and earnings index contains 216 base series. For the coherence of the measurement of average and
collectively agreed wage increases, it is important that the index of wage and salary earnings is
based on the use of the same weight structure as the index of negotiated wages and salaries.
Accordingly, base series have been constructed by taking into account the division of collective
agreements into different agreement areas. For example, the base series for manufacturing
industries correspond to the agreement areas in those industries. Yet, the division into 216 base
series is not identical to the division of collective agreements into different agreement areas.5
For industries where there are several base series, the average earnings for those series are
calculated by using the number of wage and salary earners to weight them together to the industry
level. Since there are no fixed weights in the base series, the changes taking place in the structure of
wage and salary earners within industries will influence the development of the index.
Thus, the aggregate index of wage and salary earnings is obtained in two stages. First, changing
weights are used in the aggregation of base series to industry-specific indices, and, second, fixed
weights are used in the aggregation of 70 industry-specific indices.
4 The employers’ and employees’ organizations have bolstered co-operation relating to wage statistics by agreements in
which some basic rules for the production of wage statistics are specified. According to the agreements, the
Confederation of Finnish Industries has to provide trade unions with some essential information about wage
developments. One aim of these agreements has been to create a common view about recent wage developments before
the start of the rounds of wage negotiations. In this respect, they have been successful. Still, there is room for
improvement. For example, it is difficult for trade unions to get access to micro data on which aggregate wage data are
based.
5 Over the years, the index of wage and salary earnings has become more industry-specific, and therefore the division of
collective agreements into different agreement areas has lost its importance in the description of wage developments.
9
Perhaps the most important feature that distinguishes the Finnish approach from the approaches
used in other countries of the CAWIE project is that the two indices are calculated by the use of the
same weight structure. Furthermore, both are Laspeyres unit value indices. Therefore, changes in
the index of negotiated wages and salaries, describing the contribution of negotiated wage changes
to changes in average wages, can be interpreted as contributions to the index of wage and salary
earnings. This was illustrated by equation (1). Consequently, wage drift can be measured in a
consistent manner. This was illustrated by equation (2). When the same weight structure is used in
the computation of these two indices, those sources of wage drift which are due to differing weight
structures are eliminated.
The same weight structure allows Statistics Finland to utilise the index of negotiated wages and
salaries in the production of preliminary information about the developments of the average wage
and salary index.6 The wage and salary earnings index is published quarterly, but the final wage
data on which the computation is based is not yet available when the quarterly data are published
for the first time. However, information about collectively agreed wage increases is available, and
therefore Statistics Finland utilizes it in combination with an estimate of wage drift in order to
produce preliminary information about developments of average wages in Finland.
Since the index of negotiated wages and salaries contains one-offs based on collective agreements,
Statistics Finland can also utilise that information in the estimation of quarterly developments of
average wages. Furthermore, in the production of preliminary information about the development of
the wage and salary index it uses an estimate of changes in performance rewards, because they are
included in the index.
Because of the same weight structure, the computation of the aggregate index of negotiated wages
and salaries is based on the weighting contributions of the 216 base series. As mentioned earlier,
Statistics Finland utilises the assessments of employers’ organisations in the production of index
data. Normally, preliminary information about the development of the index of negotiated wages
and salaries has also been final information.
It is important to recognize that the methodology which is used in Finland is based on the
traditionally high coverage of collective agreements. A high coverage rate is needed if, in the
computation of the developments of average wages, weights are largely based on the relative
importance of various agreements areas.
6 Preliminary data are preliminary in the sense that they may be subject to revision later when more information is
obtained and final data are constructed.
10
3.1.2 Quality assessment of the Index of Negotiated Wages and Salaries
a) Relevance
Originally, the index of negotiated wages and salaries was constructed as a tool for incomes policy
negotiations. Therefore, the main aim of the index was to meet the needs of the most important
users of the index, i.e. negotiators and experts participating in incomes policy negotiations. That is
why statistical outputs have traditionally been highly relevant. Nowadays Statistics Finland
cooperates with the Information Committee on Cost and Income Developments. It is a tripartite
committee which monitors how collective agreements are realised and assesses their impacts. It also
makes proposals in order to develop indices like the index of negotiated wages and salaries and the
index of wage and salary earnings.
One aspect that enhances the relevance of the index of negotiated wages and salaries is that it has
been produced as an organic part of the construction of the index of wage and salary earnings. Since
wage drift can be measured in a consistent manner, the index of negotiated wages and salaries has
been an indispensable tool in studies on wage determination in Finland. Furthermore, those
institutions that make short-term business cycle forecasts for the Finnish economy usually make
forecasts for the developments of the index of negotiated wages and salaries and the index of wage
and salary earnings.
b) Accuracy
Since the index of negotiated wages and salaries is not based on a sample of collective agreements,
sampling errors should not be problem. Because of the high coverage rate of collective agreements,
neither are large coverage errors likely to constitute a major problem. There have been some
sources of measurement errors, however. Because base series are not weighted by fixed weights in
order to get industry-level series, changes taking place in the structure of employees within
industries will also affect the index. Furthermore, base series may represent many agreement areas
whose importance may change over time. These factors may have given rise to composite errors if
collectively agreed wage increases have differed in differing agreement areas.7
Changing the base year every fifth year without taking into account the level of macroeconomic
activity may have affected accuracy, especially when negotiated wage increases have differed in
various sectors. For example, when the wage and salary earnings index 1990=100 was calculated,
7 In the new Index of Wage and Salary Earnings 2010=100 and the new index of negotiated wages, which will be
introduced in the near future, the share of each agreement area in the base series under consideration is estimated more
precisely than before. This will make the assessment of the seriousness of this kind of measurement error easier.
11
construction had, after the construction boom of the late 1980s, too great a weight in comparison to
the real situation. During the depression years of the early 1990s the share of the construction sector
collapsed. On the other hand, the divergence of collectively agreed wage increases between various
sectors has traditionally been small. In the 2000s, changes occurring in the weight structure have
been less pronounced, and therefore they have not been important enough to influence the accuracy
of the index.
c) Organisational quality
The index of negotiated wages and salaries is published quarterly, simultaneously with the
publication of the index of wage and salary earnings. As mentioned earlier, data on collective
agreements are an important source of information in the estimation of preliminary data of this
index. The simultaneous publication of these two indices therefore lengthens the publication lag of
the index of negotiated wages and salaries. The data are disseminated five to eight weeks after the
end of the quarter. The time lag is longer with the first and second quarter publications because of
the large amount of data. Normally, data have been disseminated on the target date on which they
have been scheduled for release.
The data in the index of wages and salary earnings is published in quarterly bulletins which are
downloadable. The index website also includes downloadable tables for recent developments of the
index. Unfortunately, even though downloadable tables on the developments of this index are
disseminated, these downloadable tables are not published for the index of negotiated wages and
salaries. Data are available for regular users who are paying for access to the relevant database
(ASTIKA), but currently they are not available free of charge through the internet (even though
they can be obtained most probably free of charge upon request). Obviously, access to the data on
the index of negotiated wages and salaries is a problem, and therefore there is a need for
improvements. The current situation reflects the fact that typical users of the data are experts having
access to ASTIKA. For a less professional or a foreign user, current conditions and clarity of access
to the data are not fully satisfactory.
Researchers often need data covering a long time period. Currently online data by employer sector
are available from 2000 and by industry from 2005. (Data for longer periods are available on
request, however.) So far, industry-level data which are classified only by NACE Rev.1.1 are
available, while data on the index of wages and salaries are also available by NACE Rev 2.
There is an obvious case for improvement in this respect.
12
4. DESCRIPTIVE ANALYSIS OF THE DEVELOPMENT OF
COLLECTIVELY AGREED WAGES AND WAGE DRIFT
FOR THE PERIOD 1995-2010
4.1 Development of collectively agreed pay
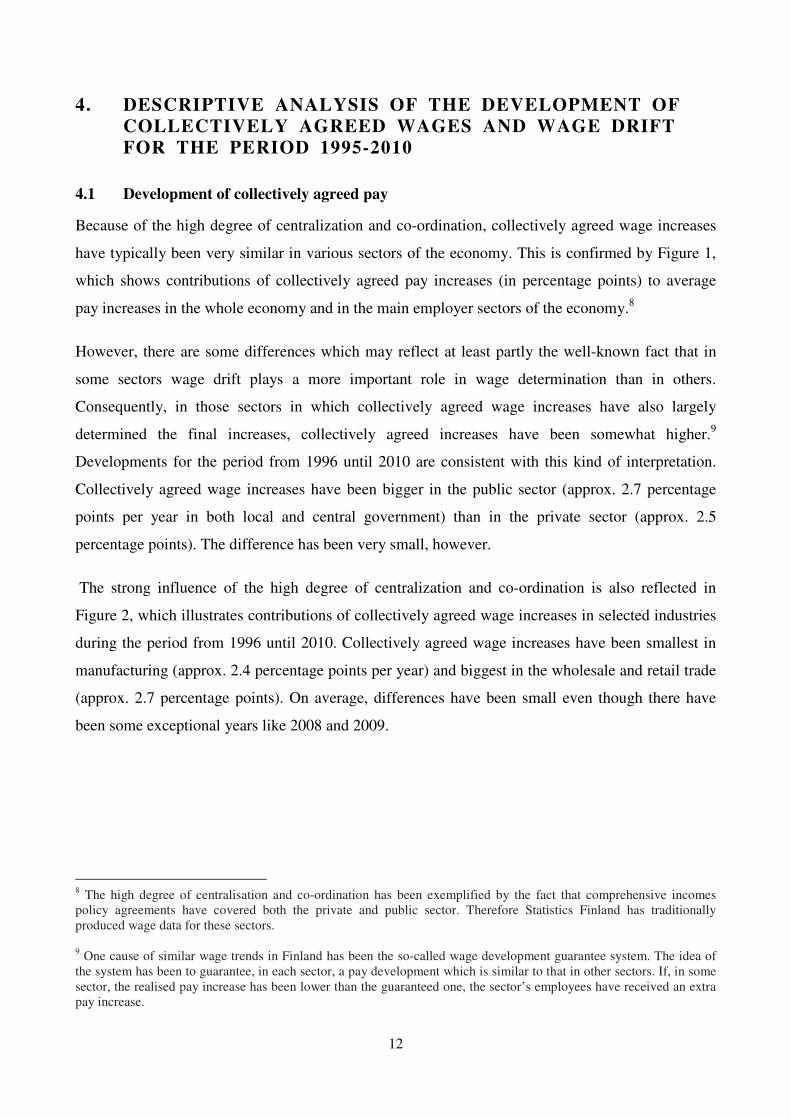
Because of the high degree of centralization and co-ordination, collectively agreed wage increases
have typically been very similar in various sectors of the economy. This is confirmed by Figure 1,
which shows contributions of collectively agreed pay increases (in percentage points) to average
pay increases in the whole economy and in the main employer sectors of the economy.8
However, there are some differences which may reflect at least partly the well-known fact that in
some sectors wage drift plays a more important role in wage determination than in others.
Consequently, in those sectors in which collectively agreed wage increases have also largely
determined the final increases, collectively agreed increases have been somewhat higher.9
Developments for the period from 1996 until 2010 are consistent with this kind of interpretation.
Collectively agreed wage increases have been bigger in the public sector (approx. 2.7 percentage
points per year in both local and central government) than in the private sector (approx. 2.5
percentage points). The difference has been very small, however.
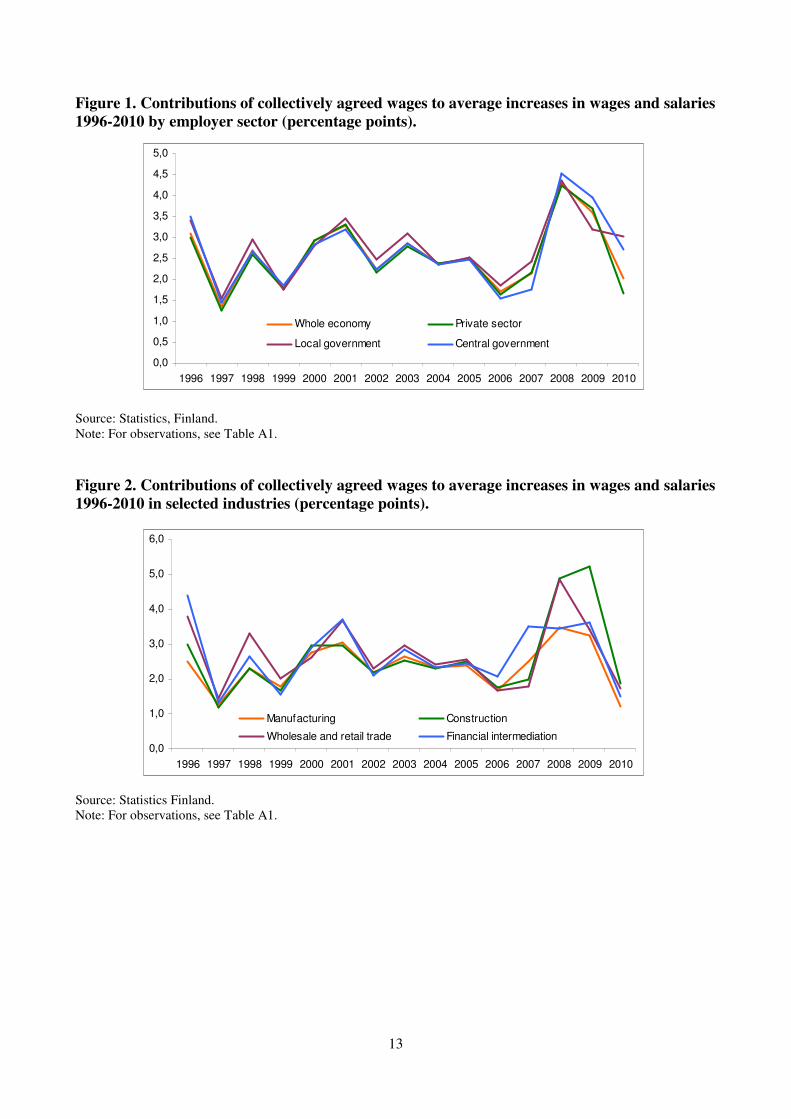
The strong influence of the high degree of centralization and co-ordination is also reflected in
Figure 2, which illustrates contributions of collectively agreed wage increases in selected industries
during the period from 1996 until 2010. Collectively agreed wage increases have been smallest in
manufacturing (approx. 2.4 percentage points per year) and biggest in the wholesale and retail trade
(approx. 2.7 percentage points). On average, differences have been small even though there have
been some exceptional years like 2008 and 2009.
8 The high degree of centralisation and co-ordination has been exemplified by the fact that comprehensive incomes
policy agreements have covered both the private and public sector. Therefore Statistics Finland has traditionally
produced wage data for these sectors.
9 One cause of similar wage trends in Finland has been the so-called wage development guarantee system. The idea of
the system has been to guarantee, in each sector, a pay development which is similar to that in other sectors. If, in some
sector, the realised pay increase has been lower than the guaranteed one, the sector’s employees have received an extra
pay increase.
13
Figure 1. Contributions of collectively agreed wages to average increases in wages and salaries 1996-2010 by employer sector (percentage points).
Source: Statistics, Finland.
Note: For observations, see Table A1.
Figure 2. Contributions of collectively agreed wages to average increases in wages and salaries 1996-2010 in selected industries (percentage points).
Source: Statistics Finland.
Note: For observations, see Table A1.
0,0
0,5
1,0
1,5
2,0
2,5
3,0
3,5
4,0
4,5
5,0
1996 1997 1998 1999 2000 2001 2002 2003 2004 2005 2006 2007 2008 2009 2010
Whole economy Private sector
Local government Central government
0,0
1,0
2,0
3,0
4,0
5,0
6,0
1996 1997 1998 1999 2000 2001 2002 2003 2004 2005 2006 2007 2008 2009 2010
Manufacturing Construction
Wholesale and retail trade Financial intermediation
14
4.2. Development of wage drift
As emphasized earlier, a most important feature of the Finnish approach is that the index of
negotiated wages and salaries is calculated by the use of the same weight structure as the index of
wage and salary earnings. It is therefore natural that wage drift in Finland is computed by the
utilization of these two indices.
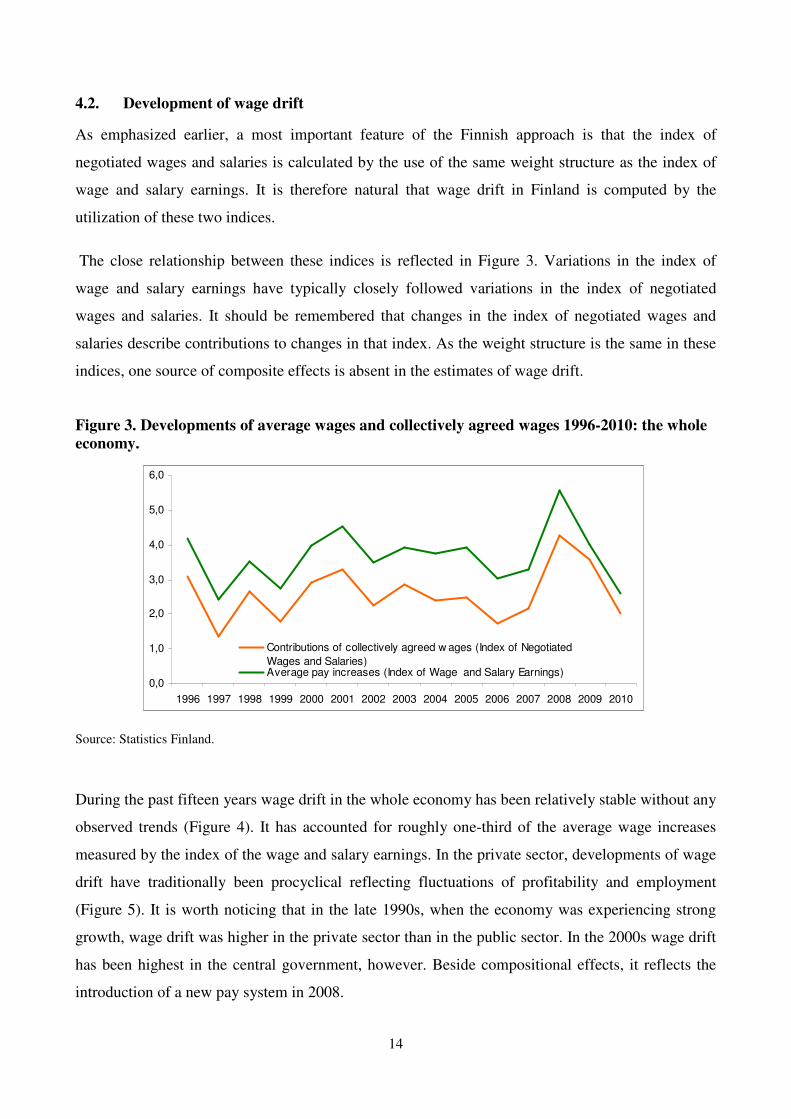
The close relationship between these indices is reflected in Figure 3. Variations in the index of
wage and salary earnings have typically closely followed variations in the index of negotiated
wages and salaries. It should be remembered that changes in the index of negotiated wages and
salaries describe contributions to changes in that index. As the weight structure is the same in these
indices, one source of composite effects is absent in the estimates of wage drift.
Figure 3. Developments of average wages and collectively agreed wages 1996-2010: the whole economy.
Source: Statistics Finland.
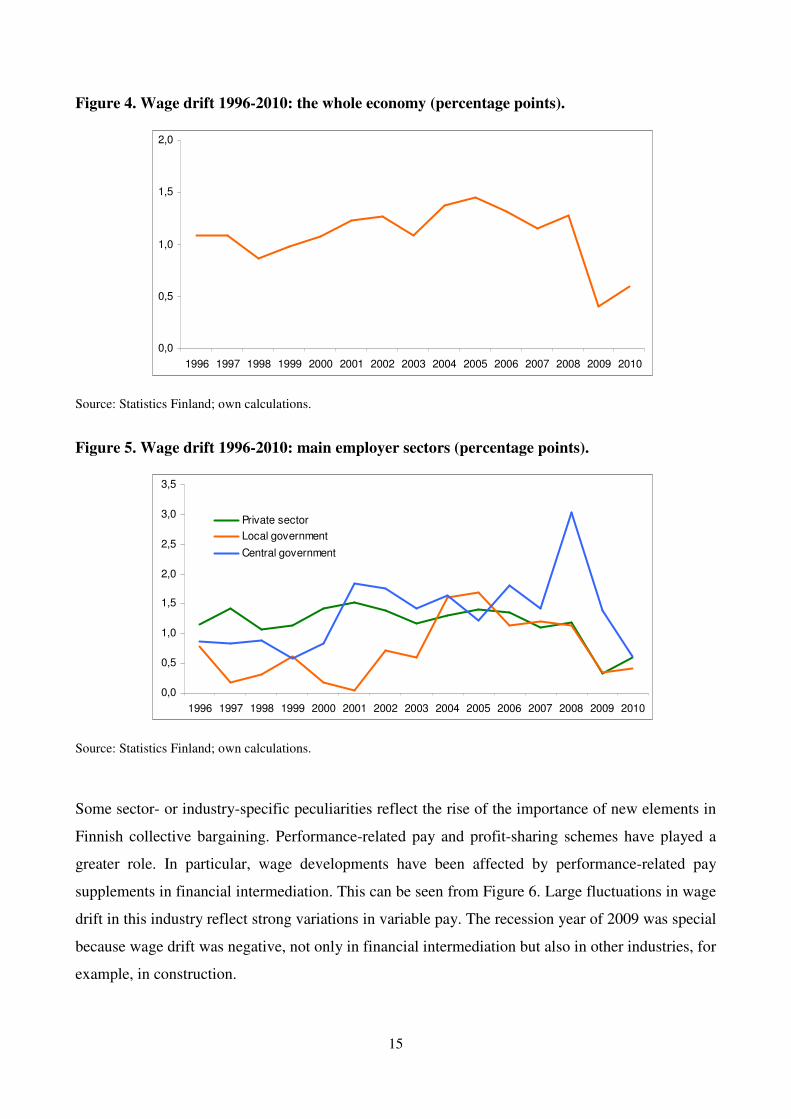
During the past fifteen years wage drift in the whole economy has been relatively stable without any
observed trends (Figure 4). It has accounted for roughly one-third of the average wage increases
measured by the index of the wage and salary earnings. In the private sector, developments of wage
drift have traditionally been procyclical reflecting fluctuations of profitability and employment
(Figure 5). It is worth noticing that in the late 1990s, when the economy was experiencing strong
growth, wage drift was higher in the private sector than in the public sector. In the 2000s wage drift
has been highest in the central government, however. Beside compositional effects, it reflects the
introduction of a new pay system in 2008.
0,0
1,0
2,0
3,0
4,0
5,0
6,0
1996 1997 1998 1999 2000 2001 2002 2003 2004 2005 2006 2007 2008 2009 2010
Contributions of collectively agreed w ages (Index of Negotiated
Wages and Salaries)Average pay increases (Index of Wage and Salary Earnings)
15
Figure 4. Wage drift 1996-2010: the whole economy (percentage points).
Source: Statistics Finland; own calculations.
Figure 5. Wage drift 1996-2010: main employer sectors (percentage points).
Source: Statistics Finland; own calculations.
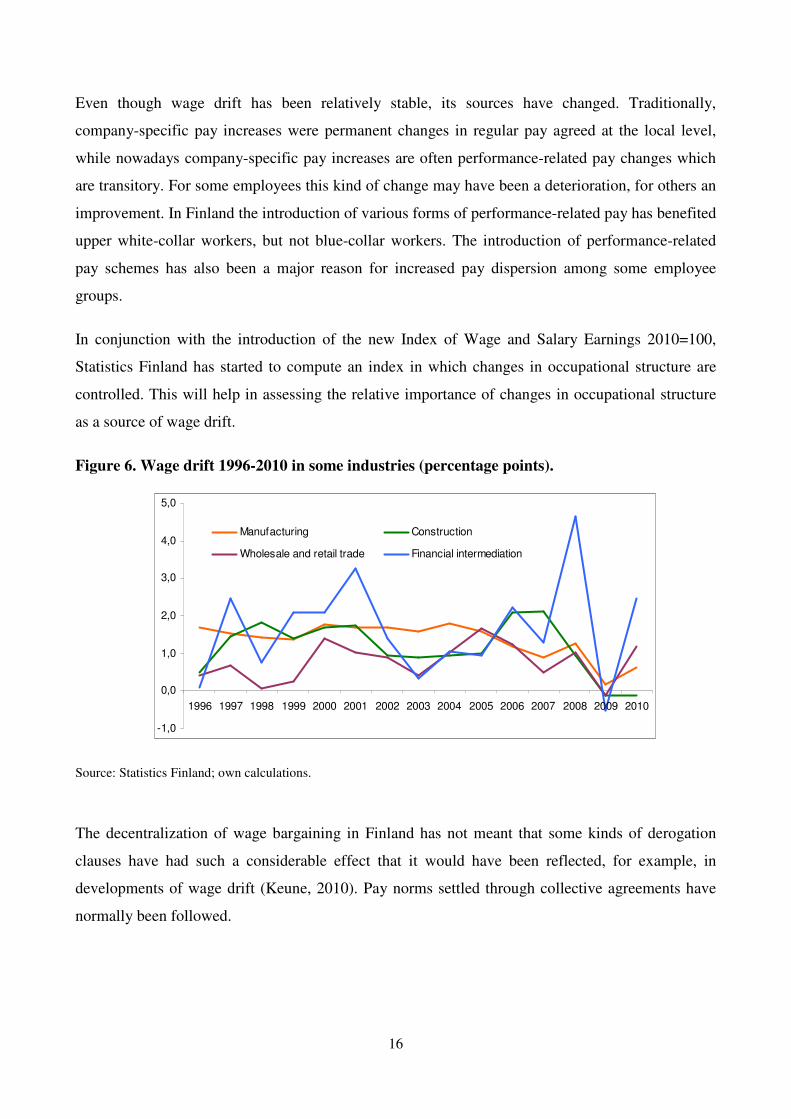
Some sector- or industry-specific peculiarities reflect the rise of the importance of new elements in
Finnish collective bargaining. Performance-related pay and profit-sharing schemes have played a
greater role. In particular, wage developments have been affected by performance-related pay
supplements in financial intermediation. This can be seen from Figure 6. Large fluctuations in wage
drift in this industry reflect strong variations in variable pay. The recession year of 2009 was special
because wage drift was negative, not only in financial intermediation but also in other industries, for
example, in construction.
0,0
0,5
1,0
1,5
2,0
1996 1997 1998 1999 2000 2001 2002 2003 2004 2005 2006 2007 2008 2009 2010
0,0
0,5
1,0
1,5
2,0
2,5
3,0
3,5
1996 1997 1998 1999 2000 2001 2002 2003 2004 2005 2006 2007 2008 2009 2010
Private sector
Local government
Central government
16
Even though wage drift has been relatively stable, its sources have changed. Traditionally,
company-specific pay increases were permanent changes in regular pay agreed at the local level,
while nowadays company-specific pay increases are often performance-related pay changes which
are transitory. For some employees this kind of change may have been a deterioration, for others an
improvement. In Finland the introduction of various forms of performance-related pay has benefited
upper white-collar workers, but not blue-collar workers. The introduction of performance-related
pay schemes has also been a major reason for increased pay dispersion among some employee
groups.
In conjunction with the introduction of the new Index of Wage and Salary Earnings 2010=100,
Statistics Finland has started to compute an index in which changes in occupational structure are
controlled. This will help in assessing the relative importance of changes in occupational structure
as a source of wage drift.
Figure 6. Wage drift 1996-2010 in some industries (percentage points).
Source: Statistics Finland; own calculations.
The decentralization of wage bargaining in Finland has not meant that some kinds of derogation
clauses have had such a considerable effect that it would have been reflected, for example, in
developments of wage drift (Keune, 2010). Pay norms settled through collective agreements have
normally been followed.
-1,0
0,0
1,0
2,0
3,0
4,0
5,0
1996 1997 1998 1999 2000 2001 2002 2003 2004 2005 2006 2007 2008 2009 2010
Manufacturing Construction
Wholesale and retail trade Financial intermediation
17
5. CONCLUDING COMMENTS
In Finland collectively agreed wages are measured by indices which describe contributions of
collectively agreed wage increases to increases in average wages. The Finnish system of collecting
data on collectively agreed wages reflects the lengthy history of concluding comprehensive
nationwide incomes policy agreements. The negotiators participating in incomes policy negotiations
would have liked to know how large the contribution of collectively agreed wage increases to the
level of average earnings was. The Finnish system answers this question.
Statistics Finland constructs the index of negotiated wages and salaries within the same
methodological framework as the index of wage and salary earnings, which is the most important
index describing the developments of average wages. This means, among other things, that the
same weight structure is used in the compilation of these two indices. Therefore the coherence
between data on collectively agreed wage increases and average wage increases has been very
good. However, the utilization of the Finnish system requires that the coverage of collective
agreements is high. This has been the case in Finland. The coverage rate has been around 90 per
cent without any signs of decline. This has been maintained by the erga omnes applicability of
collective agreements. If the coverage rate started to decline, accuracy problems, for example,
would start to arise.
Collectively agreed wage increases have typically been very similar in various sectors of the
economy. This has been due to the high degree of centralization and bargaining co-ordination.
During the past fifteen years developments of wage drift in the whole economy have been relatively
stable. It has accounted for roughly one-third of the average wage increases measured by the index
of the wage and salary earnings. Industry-specific changes in wage drift have been more volatile,
however. This has been at least partly the result of the introduction of new forms of company-
specific pay. Performance-related pay increases are typically transitory. This also reflects the fact
that the sources of wage drift have changed. Previously, company-specific pay increases were
mostly permanent changes in regular pay.
Even though wage determination has been highly centralized in Finland it has become more
decentralized. As part of decentralization, collective agreements have contained items which have
been agreed at the local level. It is highly likely that the increase in the share of these items makes
the compilation of the index of negotiated wages and salaries more difficult, because gathering
18
informational about these items may be cumbersome. Consequently, the decomposition of average
wage increases to the contributions of negotiated wage increases and wage drift may become more
difficult. Yet there have not been strong pressures to change the current system; it still seems to
meet the needs of its most important users, i.e. negotiators and experts who participate in wage
negotiations.
19
APPENDIX
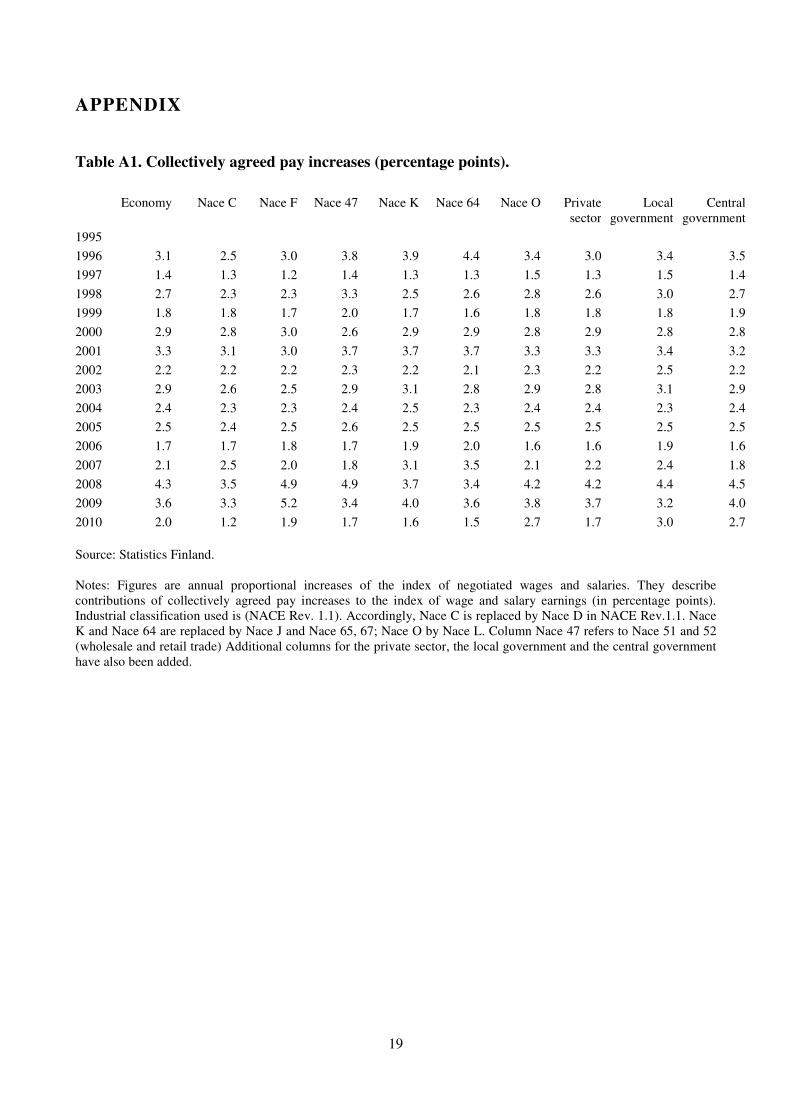
Table A1. Collectively agreed pay increases (percentage points).
Economy
Nace C Nace F Nace 47 Nace K Nace 64 Nace O Private
sector
Local
government
Central
government
1995
1996 3.1 2.5 3.0 3.8 3.9 4.4 3.4 3.0 3.4 3.5
1997 1.4 1.3 1.2 1.4 1.3 1.3 1.5 1.3 1.5 1.4
1998 2.7 2.3 2.3 3.3 2.5 2.6 2.8 2.6 3.0 2.7
1999 1.8 1.8 1.7 2.0 1.7 1.6 1.8 1.8 1.8 1.9
2000 2.9 2.8 3.0 2.6 2.9 2.9 2.8 2.9 2.8 2.8
2001 3.3 3.1 3.0 3.7 3.7 3.7 3.3 3.3 3.4 3.2
2002 2.2 2.2 2.2 2.3 2.2 2.1 2.3 2.2 2.5 2.2
2003 2.9 2.6 2.5 2.9 3.1 2.8 2.9 2.8 3.1 2.9
2004 2.4 2.3 2.3 2.4 2.5 2.3 2.4 2.4 2.3 2.4
2005 2.5 2.4 2.5 2.6 2.5 2.5 2.5 2.5 2.5 2.5
2006 1.7 1.7 1.8 1.7 1.9 2.0 1.6 1.6 1.9 1.6
2007 2.1 2.5 2.0 1.8 3.1 3.5 2.1 2.2 2.4 1.8
2008 4.3 3.5 4.9 4.9 3.7 3.4 4.2 4.2 4.4 4.5
2009 3.6 3.3 5.2 3.4 4.0 3.6 3.8 3.7 3.2 4.0
2010 2.0 1.2 1.9 1.7 1.6 1.5 2.7 1.7 3.0 2.7
Source: Statistics Finland.
Notes: Figures are annual proportional increases of the index of negotiated wages and salaries. They describe
contributions of collectively agreed pay increases to the index of wage and salary earnings (in percentage points).
Industrial classification used is (NACE Rev. 1.1). Accordingly, Nace C is replaced by Nace D in NACE Rev.1.1. Nace
K and Nace 64 are replaced by Nace J and Nace 65, 67; Nace O by Nace L. Column Nace 47 refers to Nace 51 and 52
(wholesale and retail trade) Additional columns for the private sector, the local government and the central government
have also been added.
20
Table A2. Coverage.
Economy Nace C Nace 29 Nace F Nace 47 Nace K Nace 64 Nace O
1995 7 7 7 7 7 7 7
1996 7 7 7 7 7 7 7
1997 7 7 7 7 7 7 7
1998 98.0 7 7 7 7 7 7 7
1999 98.0 7 7 7 7 7 7 7
2000 90.0 7 7 7 7 7 7 7
2001 90.0 7 7 7 7 7 7 7
2002 90.0 7 7 7 7 7 7 7
2003 90.0 7 7 7 7 7 7 7
2004 90.0 7 7 7 7 7 7 7
2005 90.0 7 7 7 7 7 7 7
2006 90.0 7 7 7 7 7 7 7
2007 90.0 7 7 7 7 7 7 7
2008 90.0 7 7 7 7 7 7 7
2009 90.0 7 7 7 7 7 7 7
2010 90.0 7 7 7 7 7 7 7
Source: Visser (2011); own assessment.
<25 1 very low
25-34 2 low
35-44 3 rather low
45-54 4 medium
55-64 5 rather high
65-74 6 high
75> 7 very high
21
Table A3. Centralisation.
Economy Nace C Nace 29 Nace F Nace 47 Nace K Nace 64 Nace O
1995 3
1996 5
1997 4
1998 5
1999 4
2000 3
2001 5
2002 4
2003 4
2004 5
2005 4
2006 4
2007 3
2008 3
2009 2.5
2010 2.5
Source: Visser (2011).
5 = national or central level
4 = national or central level, with additional sectoral / local or company bargaining
3 = sectoral or industry level
2 = sectoral or industry level, with additional local or company bargaining
1 = local or company bargaining
22
Table A4. Co-ordination.
Economy Nace C Nace 29 Nace F Nace 47 Nace K Nace 64 Nace O
1995 3
1996 4
1997 4
1998 4
1999 4
2000 3
2001 4
2002 4
2003 4
2004 4
2005 4
2006 4
2007 3
2008 3
2009 3
2010 3
Source: Visser (2011).
5 = economy-wide bargaining, based on a) enforceable agreements between the central organisations of unions
and employers affecting the entire economy or entire private sector, or on b) government imposition of a wage
schedule, freeze, or ceiling.
4 = mixed industry and economy-wide bargaining: a) central organisations negotiate non-enforceable central
agreements (guidelines) and/or b) key unions and employers associations set pattern for the entire economy.
3 = industry bargaining with no or irregular pattern setting, limited involvement of central organizations and
limited freedoms for company bargaining.
2 = mixed industry- and firm level bargaining, with weak enforceability of industry agreements
1 = none of the above, fragmented bargaining, mostly at company level
23
Table A5. Trade union density.
Economy Nace C Nace 29 Nace F Nace 47 Nace K Nace 64 Nace O
1995 80.4 7 7 7 7 7 7 7
1996 80.4 7 7 7 7 7 7 7
1997 79.4 7 7 7 7 7 7 7
1998 78.0 7 7 7 7 7 7 7
1999 76.3 7 7 7 7 7 7 7
2000 75.0 7 7 7 7 7 7 7
2001 74.5 6 6 6 6 6 6 6
2002 73.5 6 6 6 6 6 6 6
2003 72.9 6 6 6 6 6 6 6
2004 73.3 6 6 6 6 6 6 6
2005 72.4 6 6 6 6 6 6 6
2006 71.7 6 6 6 6 6 6 6
2007 70.3 6 6 6 6 6 6 6
2008 67.5 6 6 6 6 6 6 6
2009 69.2 6 6 6 6 6 6 6
2010 70.0 6 6 6 6 6 6 6
Source: Visser (2011); own assessment.
<25 1 very low
25-34 2 low
35-44 3 rather low
45-54 4 medium
55-64 5 rather high
65-74 6 high
75> 7 very high
24
REFERENCES
Böckerman, P. and Uusitalo, R. (2006), Erosion of the Ghent system and union membership
decline: Lessons from Finland, British Journal of Industrial Relations, 44(2), 283-303.
Keune, M. (2010), Derogation clauses on wages in sectoral collective agreements in seven
European countries, Eurofound Report, Dublin.
Kiander, J., Sauramo, P. & Tanninen, H. (2011), Finnish incomes policy as corporatist political
exchange: development of social capital and the social wage, Transfer, 17(4), 515-531.
Uusitalo, R. (2005), Do centralized bargains lead to wage moderation? Time-series evidence from
Finland, in Piekkola, H. and K. Snellman (eds), Collective Bargaining and Wage Formation –
Performance and Changes. Physica-Verlag: Heidelberg and New York, 121-132.
Uusitalo, R. and Vartiainen, J. (2009), Finland: firm factors in wages and wage changes, in Lazear
E. P. and Shaw K. L. (eds), The structure of wages: an international comparison. Chicago:
University of Chicago Press.
Visser, J. (2011), ICTWSS: Database on Institutional Characteristics of Trade Unions, Wage
Setting, State Intervention and Social Pacts in 34 countries between 1960 and 2007, version 3 –
May 2011 (downloadable from http://www.uva-aias.net/208).