collingwood wastewater treatment plant compliance 2015.pdf · hp horsepower kg kilograms kw...
TRANSCRIPT

Collingwood Wastewater Treatment Plant2015 Annual Compliance Report

Wastewater Treatment Annual Report 2015
1
Table of Contents
Definitions ............................................................................................................................................. 2 Executive Summary............................................................................................................................... 3 General ................................................................................................................................................. 4 Section 1.0 The Facility ...................................................................................................................... 5 Section 2.0 Annual Average Performance Evaluation ......................................................................... 6
2.1.1 Effluent Quality Assessment ................................................................................................... 6 2.1.2 Effluent Sampling Requirements Monitoring and Reporting .................................................... 7 2.1.3 Capacity Assessment .............................................................................................................. 8
Section 3.0 Biosolids Management ..................................................................................................... 9 Section 4.0 Bypass Occurrences ........................................................................................................ 9 Section 5.0 Maintenance .................................................................................................................... 9 Section 6.0 Complaints ..................................................................................................................... 10 Section 7.0 Undertaking Next Reporting Period ................................................................................ 10 Appendix A WWTP Offline Sampling Program .................................................................................. 11 Appendix B Monthly Flow and Process Quality Data ......................................................................... 13 Appendix C Sludge Management ...................................................................................................... 18 Appendix D Plant Certificate of Approval ........................................................................................... 41 Appendix E Calibration Reports ........................................................................................................ 60 Appendix F Bypass and Spills Report ............................................................................................... 68 Appendix G Out of Compliance – Letter from MOECC ...................................................................... 69

Wastewater Treatment Annual Report 2015
2
Definitions BOD Biochemical Oxygen Demand CBOD5 Carbonaceous Biochemical Oxygen Demand cfu Colony Forming Units COD Chemical Oxygen Demand DO Dissolved Oxygen ECA Environmental Compliance Approval Hg Mercury FP Filtered Phosphorous HP Horsepower kg Kilograms kW Kilowatt mg/l Milligrams per litre Ml/d Mega litres per day m3/d Cubic metres per day NH3 Ammonia NO2 Nitrites NO3 Nitrates SVI Sludge Volume Index TBOD Total Biochemical Oxygen Demand TKN Total Kjeldahl Nitrogen TP Total Phosphorous TS Total Solids TSS Total Suspended Solids UV Ultraviolet VFA Volatile Fatty Acids VS Volatile Solids WWTP Wastewater Treatment Plant

Wastewater Treatment Annual Report 2015
3
Executive Summary This report has been compiled in accordance with the reporting requirements of the ECA (formerly C of A)2639-5TLQB2 Section10 subsection(6). The report is broken down into sections for ease of consumption, and additional information, may be contained in each section over and above that which is required to support and substantiate the required content. If further clarification is required please do not hesitate to contact: Collingwood Wastewater Treatment Plant PO Box 157 97 Hurontario Street Collingwood, ON L9Y 3Z5 705-445-1581 www.collingwood.ca
2015 at a Glance
Total Flow to WWTP
4.999 Ml/d
Design average daily Flow
24548 m3/d 24.548 Ml/d
Average Daily Flow
13658 m3/d 13.658 Ml/d
Bypass events 1 13833 M3
Compliance Parameters
Actual Number of times criteria exceeded
Jan Feb Mar Apr May Jun Jul Aug Sep Oct Nov Dec
Annual average CBOD5
Objective 15 mg/l 2.9 0 0 0 0 0 0 0 0 0 0 0 0
Annual average CBOD5
Limit 25 mg/l 0 0 0 0 0 0 0 0 0 0 0 0
Annual average CBOD5
Loading 613.7kg/l 47.27 0 0 0 0 0 0 0 0 0 0 0 0
Annual average TSS
Objective 15mg/l 5.4 0 0 0 0 0 0 0 0 0 0 0 0
Annual average TSS
Limit 25mg/l 0 0 0 0 0 0 0 0 0 0 0 0
Annual average TSS
Loading 613.7kg/d 86.56 0 0 0 0 0 0 0 0 0 0 0 0
Monthly average TP
Objective 0.8mg/l 0.12 0 0 0 0 0 0 0 0 0 0 0 0
Monthly average TP
Limit 1.0mg/l 0 0 0 0 0 0 0 0 0 0 0 0
Monthly average TP
Loading 24.5kg/d 1.95 0 0 0 0 0 0 0 0 0 0 0 0
Monthly geomean E-Coli
Objective 100cfu/100ml
>1<133 0 0 0 0 0 1 0 0 0 0 0 0
Monthly geomean E-Coli
Limit 200cfu/100ml
0 0 0 0 0 1 0 0 0 0 0 0
.pH range Objective 6.5 to 9.0 0 0 0 0 0 0 0 0 0 0 0 0
.pH range Limit 6.0 to 9.0 6.9 to 7.8
0 0 0 0 0 0 0 0 0 0 0 0

Wastewater Treatment Annual Report 2015
4
General Plant Reporting: Collingwood WWTP MOE Works Number: 120000550 Plant Location: 3 Birch Street
Collingwood, Ontario L9Y 2T8 Tel. (705) 445-1581 Fax. (705) 445-0852
Plant Classification: III Plant Operating Authority: Town of Collingwood
P.O. Box 157 97 Hurontario St. Collingwood, Ontario L9Y 3Z5 Tel. (705) 445-1581 Fax. (705) 445-1286
Contact: Glenn Price Manager of Wastewater Treatment 705-445-1581 extension 3315 [email protected] Peggy Slama Manager of Environmental Services 705-445-1581 extension 3301 [email protected] Plant Personnel:
Name WWT Classification Licence No. Expiry Date Glenn Price 3 74063 September 30,2017 Paul Clark 4 11003 August 31, 2017
Jennifer Bell Adams 3 11169 August 31, 2016 Mark Service 4 17111 August 31, 2017 Tyler Barrette 3 73068 January 31, 2018
Evan Orser 3 56428 September 30,2017 Jason MacNicol OIT OT90347 July 30, 2018
Cathy Card 1 83840 March 31, 2017 Name WWC Classification Licence No. Expiry Date
Glenn Price OIT OT68560 December 31, 2016 Paul Clark 2 11004 November 30, 2017
Mark Service 1 64052 January 31, 2016 Evan Orser 2 67101 April 30, 2017
Tyler Barrette 1 73067 August 31, 2017 Cathy Card OIT OT65417 April 30, 2016
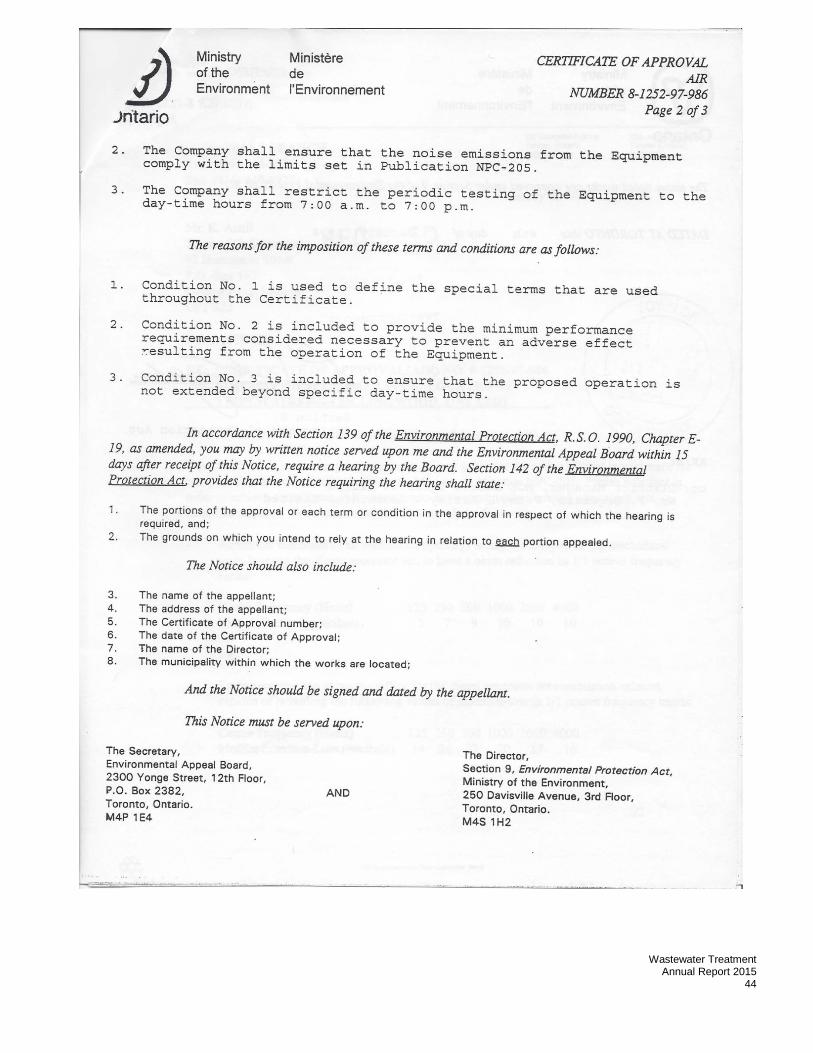
Plant Certificate of Approval & Amendments: The Plant operates under the Certificate of Approval Number 2639-5TLQB2 dated the 17th day of December 2003.

Wastewater Treatment Annual Report 2015
5
Section 1.0 The Facility The Collingwood WWTP, owned and operated by the Town of Collingwood, is a conventional activated sludge plant with alum addition for phosphorus removal. Treated effluent from the plant is discharged to Collingwood Harbour, which is situated in Georgian Bay on the south shore of Nottawasaga Bay. The plant was first constructed in 1958 to provide primary treatment of the Town's domestic and industrial wastewater. The primary plant was expanded in 1968. Secondary treatment was added in 1981. The rated flow capacity is 24,548 m3 /day with a peak flow rate of 60,900 m3/day. Wastewater from the serviced area flows to the plant by gravity, although seven (7) pumping stations at Minnesota Street, St. Clair St., Paterson Street, Cranberry Trail and Black Ash Creek, Pretty River Estates and Silver Glen boost the flow throughout the area. Major unit operations at the Collingwood WWTP include the following:
• Headworks - which provides the following preliminary process treatments: o Emergency plant bypass o Automated mechanical raked raw sewage screen o Manual raked bypass raw sewage screen o Raw sewage pumping station o Grit removal o Bio scrubber for headworks odour control o Septic/leachate handling
• Primary Sedimentation
• Activated Sludge with Alum addition for Phosphorus Removal
• Secondary Clarification
• Disinfection with UV
• Effluent discharge to Collingwood Harbour
• Thickening of waste activated sludge by Dissolved Air Flotation
• Anaerobic Sludge Digestion
• Liquid Digested Sludge Land Utilization Disposal
• Sludge Storage Lagoon (off site)
• Standby power source (diesel driven generator)
Data is summarized in Appendix A - Table 2.1

Wastewater Treatment Annual Report 2015
6
Section 2.0 Annual Average Performance Evaluation 2.1.1 Effluent Quality Assessment
1) Effluent Objectives - See Section 6 subsection(1) of Environmental Compliance Approval (ECA)
The effluent objectives concentration is summarized below in Table 1.
Table 1-Effluent Objectives Effluent Parameter Concentration Objectives
(milligrams per litre unless otherwise indicated)
CBOD5 15.0
Total Suspended Solids 15.0
Total Phosphorus 0.8
E.Coli
Monthly Geometric Mean Density 100 organisms per 100ml
pH of the effluent maintained between 6.5 to 9.5, inclusive, at all times
Table 2-Effluent Limits Effluent Parameter Average Concentration
(milligrams per litre unless otherwise indicated)
Average Waste Loading (kilograms per day unless otherwise
indicated) CBOD5 25.0 613.7
Total Suspended Solids
25.0 613.7
Total Phosphorus 1.0 24.5
pH of the effluent maintained between 6.0 to 9.5, inclusive, at all times
2) For the purposes of determining compliance with and enforcing concentrations and readings in
Table 2 see section 7 (subsection 2) of ECA.
a. The Annual Average Concentration of Carbonaceous Biochemical Oxygen Demand (CBOD5) and Total Suspended Solids named in Column 1 of Table 2 shall not exceed the corresponding maximum concentration set out in Column 3 of Table 2.
b. The Monthly Average Concentration of Total Phosphorus named in Column 1 of Table 2 shall not exceed the corresponding maximum concentration set out in Column 3 of Table 2.
c. The Annual Average Loading of a parameter named in Column 1 of Table 2 shall not exceed the corresponding maximum waste loading set out in Column 4 of Table 2.
d. The pH of the effluent shall be maintained within the limits outlined in Table 2 at all times.

Wastewater Treatment Annual Report 2015
7
3) Notwithstanding subsection (1), the Owner shall operate and maintain the Works such that the effluent is continuously disinfected so that the monthly Geometric Mean Density of E.Coli does not exceed 200 organisms per 100 millilitres of effluent discharged from the works.
4) Only those monitoring results collected during the corresponding time period shall be used in calculating the Annual Average Concentration/Monthly Average Concentration/Annual Average Loading for this Certificate.
• The annual average effluent concentrations for CBOD5, and TP fell within the applicable objectives.
• The monthly average effluent concentrations for TP fell within the applicable objective. • The annual average effluent concentrations for CBOD5, and SS fell within the applicable
compliance limit. • The monthly average effluent concentration for TP fell within the applicable compliance limit. • The annual average effluent loadings for CBOD5, SS, and TP, all fell within the applicable
compliance limits. • The pH values have fallen within the 6.0 to 9.5 range permitted under the certificate. • The monthly geometric mean densities of E-Coli bacteria in the final effluent met the compliance
criteria for all months. • The monthly geometric mean densities of E-Coli bacteria in the final effluent met the objective
criteria for all months except June.
2.1.2 Effluent Sampling Requirements Monitoring and Reporting
1.0 Compliance Testing and Analysis Monitoring requirements are specified under condition #9 (3) of the Certificate of Approval. Twenty–four (24) hour composite samples of raw sewage are required to be collected quarterly and analyzed for CBOD5, total SS, TP and TKN. Twenty–four (24) hour composite samples of final effluent are required to be collected monthly and analyzed for CBOD5, total SS. Twenty–four (24) hour composite samples of final effluent are required to be collected weekly for analysis for total phosphorus and total ammonia nitrogen. Grab samples of final effluent are required to be collected weekly for analysis for E-Coli bacteria. Lastly, the temperature and pH of the final effluent is required to be tested three times each week. The plant’s current regular monitoring program exceeds these minimum requirements. Compliance sampling and analysis of raw sewage is carried out quarterly. Twenty–four (24) hour composite samples are collected using an automatic sampler for analysis of CBOD5, total suspended solids, total phosphorus, and total Kjeldahl nitrogen. Compliance sampling and analysis of final effluent is carried out weekly. Twenty–four (24) hour composite samples are collected using a refrigerated automatic sampler for analysis of CBOD5, total suspended solids, total phosphorus, and total Kjeldahl nitrogen, total ammonia nitrogen, nitrite and nitrate. Grab samples of final effluent are also collected weekly for analysis of E.Coli bacteria. Lastly, grab samples are collected daily (Monday to Friday) and tested for pH and temperature. With the exception of the samples collected for pH and temperature testing, analysis for all compliance samples is carried out by our external contract laboratory, ALS Environmental Laboratory, in Waterloo. The plant also complies with Guideline F-10-1 concerning sampling and analysis requirements which satisfies condition 9 (4) (a).

Wastewater Treatment Annual Report 2015
8
The temperature and pH of the final effluent is taken in the field at the time of sampling for Total Ammonia Nitrogen so as we can calculate the concentration of un-ionized ammonia as set out in condition 9 (5). The Collingwood WWTP external sampling program is attached as Appendix A. All external laboratory analysis results are reported in the R1 and R2 Municipal Utility Monitoring forms which are submitted electronically to the Barrie District Office and are used in generating the annual plant performance report.
2.0 In-House Testing and Analysis for Process Control Twenty–four (24) hour composite samples are collected Monday thru Friday on influent, primary effluent & final effluent. Grab samples are also obtained for other process streams as required for process control purposes. All samples are analysed on-site using techniques in standard methods or using approved methods for HACH DR/2010 Spectrophotometer. The Collingwood WWTP internal sampling program is attached as Appendix A.
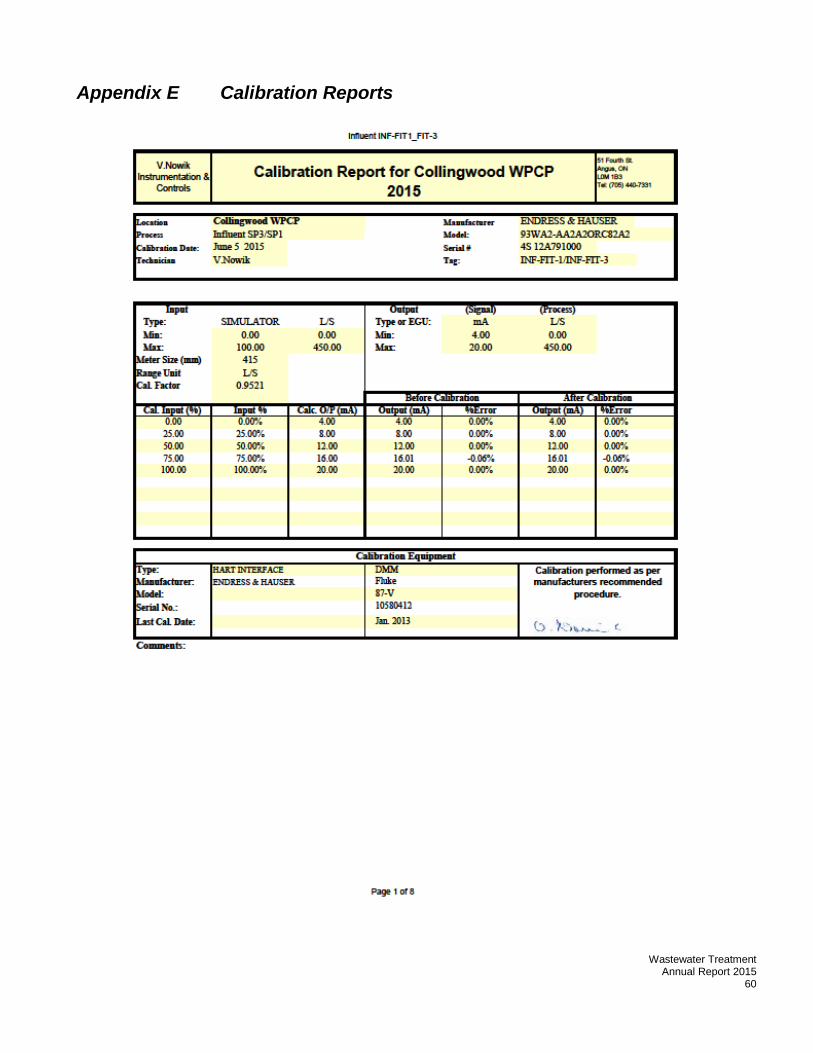
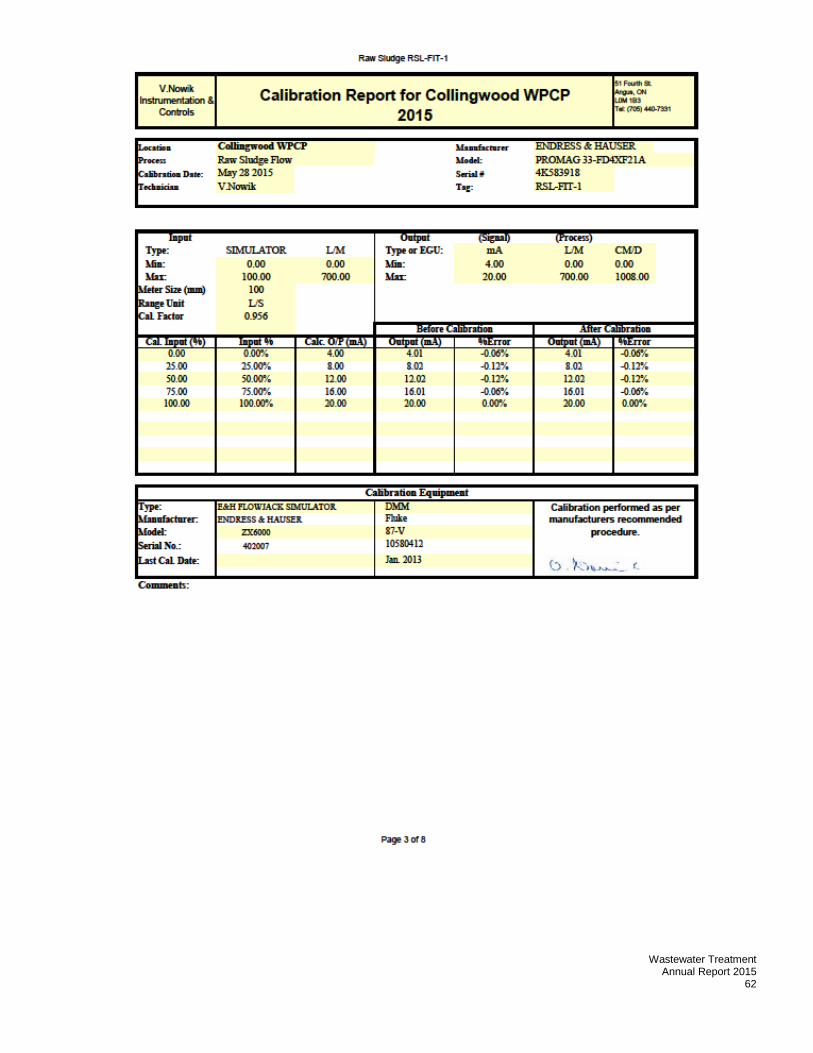
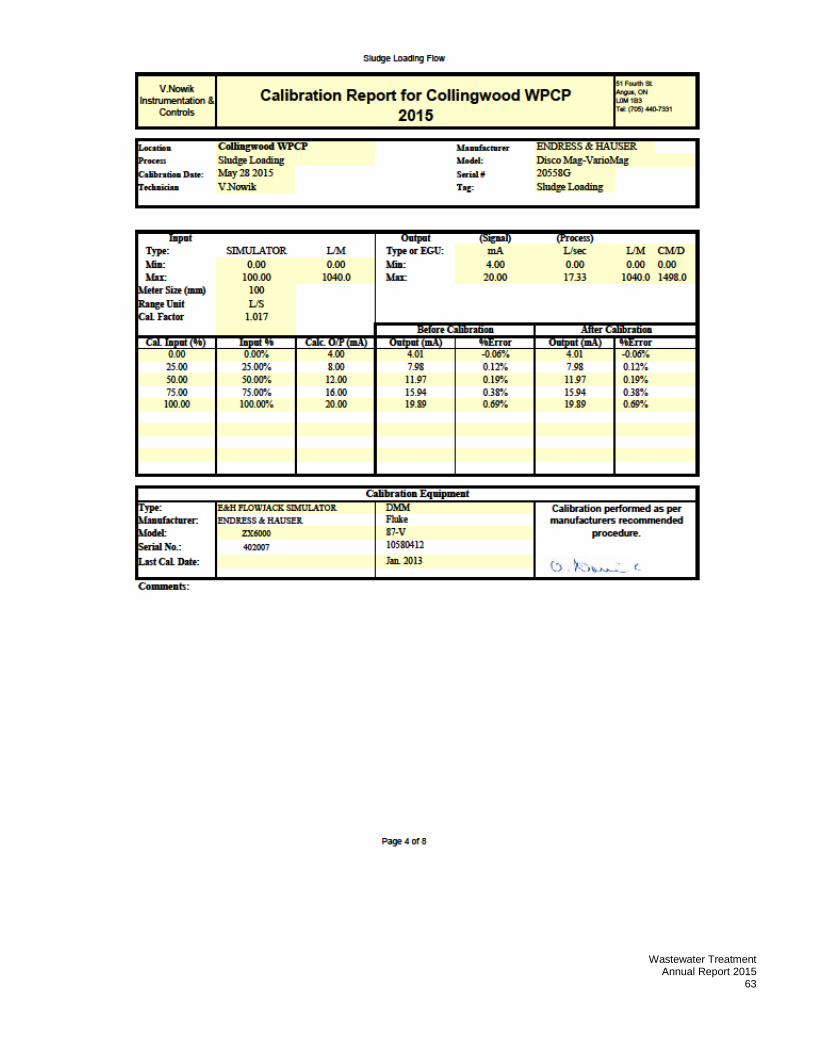
3.0 Flow Measurement Flows at the Collingwood WWTP are continuously measured at the raw sewage pumps and at the final effluent weir. Raw sewage flows are monitored by ultrasonic flow measuring devices on pumps 1 and 3 and an electromagnetic device (magmeter) on pump 2. All devices are installed on the discharge side of the pumps. Final effluent flows are continuously monitored by means of rectangular weir with an ultrasonic flow monitor. A 24-hour chart recorder records the final effluent flow. Both the influent and final effluent flows are trended through the Scada system. The meters are calibrated annually for accuracy (must be +/- 15%of flow rate) to satisfy condition 9 (7) of the C of A. The calibration reports are attached as Appendix E. 2.1.3 Capacity Assessment The Certificate of Approval specifies that the plant is rated to treat an average daily flow of 24,548 cubic meters/day and a peak flow of 60,900 cubic meters/day. Design Current year ADF in m3/d 24,548 13,658 Maximum daily flow in m3/d 60,900 31,500
The annual average daily flow has fallen within these limits for this reporting period. The peak single day max daily design flow was not exceeded. The annual average performance data is summarized in Appendix B.

Wastewater Treatment Annual Report 2015
9
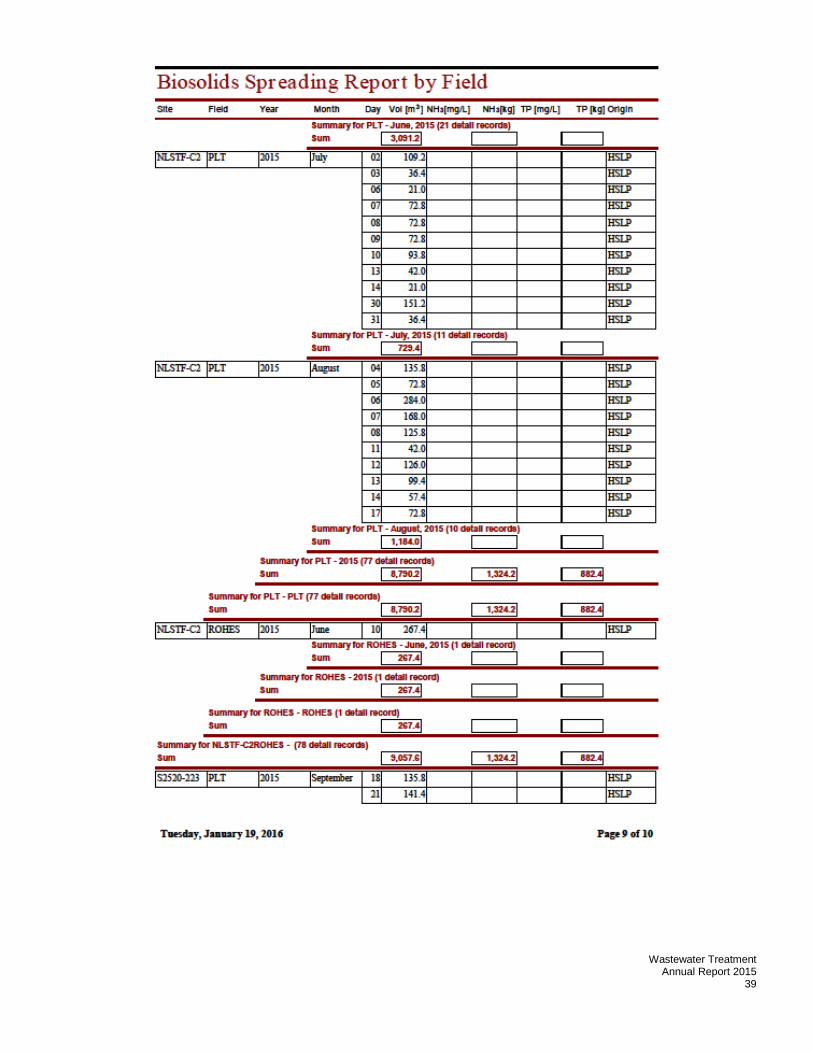
Section 3.0 Biosolids Management The WWTP currently stabilizes its biosolids (sludge) through anaerobic digestion comprised of 2 primary digesters, each with a capacity of 1,223m3, one (1) secondary digester for separation of digested sludge and collection and storage of gas, with a capacity of 1,223m3 and one (1) sludge holding tank with continuous air supply and a capacity of 990m3. A waste gas burner with a rated capacity of 560m3/hr. is connected to the system. Stabilized biosolids are spread on licensed agricultural land as a nutrient and soil conditioner. Sludge produced at the Collingwood WWTP meets the quality criteria specified in the Ontario Guidelines for Sewage Sludge Utilization on Agricultural Lands. Sludge is applied in accordance with these guidelines and the conditions set out in the site Certificate of Approvals. Sludge disposal through direct utilization on land is not practical during winter months, during periods of inclement weather and when agricultural fields are inaccessible. The provincial guidelines for biosolids utilization on land recommends municipalities provide 6 months sludge storage facilities. The Town of Collingwood currently owns & operates a 5,000 m3 STF located on Part Lot 48, Concession 12 in the Town of Collingwood and contracts two 6,800 m3 STF from Region of Huronia Environmental Services Ltd. to achieve this guideline. Sludge disposal operations are currently contracted to a private hauler, Region of Huronia Environmental Services Limited, R. R. #1, New Lowell, Ontario, L0M 1N0 A total volume of 24,064.4m3 of biosolids was disposed of from the Collingwood facility in 2015. Samples of anaerobic sludge are collected twice monthly and sent for metals, E.Coli, and nutrient analysis to ALS Environmental, Waterloo, Ontario, N2V 2C5. Appendix C provides a detailed summary report of sites utilized for sludge disposal in 2015. Original reporting analysis is available at the plant for viewing.
Section 4.0 Bypass Occurrences There was one bypass occurrence during this reporting period. Jan 22,2015, an issue with the UV unit control circuit board. See Appendix F.
Section 5.0 Maintenance A log is kept for each piece of equipment at the Collingwood plant. These logs are available for inspection at the plant. In 2015 we continued with the Continuous Service Program with Ainsworth Electric Co. Limited being the source provider. This program utilizes such tools as thermography, voltage, load and harmonic checks, vibrations analysis etc. and has been designed using predictive and preventative maintenance to increase safety, reduce down time, reduce maintenance costs, protect asset value and extend equipment life. Regarding electrical inspections, the WWTP and seven pumping stations are being reviewed under the Electrical Safety Authority. The associated logbook at the site is available for review.

Wastewater Treatment Annual Report 2015
10
All boiler and pressure vessels were inspected by personnel from the Boiler Inspection and Insurance Company of Canada - no concerns were reported. All primary and secondary clarifiers were taken out of service for inspection and repairs implemented as required (e.g. damaged flights replaced, drive chains changed, etc.). UV lamps on the disinfection system were changed out before the 5000 hour limit. Yearly inspection/maintenance was performed by Toromont CAT on standby power equipment at the main plant and pumping stations Gas monitoring equipment was calibrated and serviced as OEM recommendation.
Section 6.0 Complaints The report below outlines each complaint received in 2015. The documented versions of these complaints are held at the Collingwood WWTP and are available for review on request. Date Complaint Action/Observations May 1, 2015 Odour complaint from unknown in
the vicinity of first street. Waste gas flare extinguished. Relit.
June 11, 2015 Odour complaint from local business. (Beaver and Bulldog).
Transferring Sludge from Digester #3 to Digester #4. Stopped transfer.
Section 7.0 Undertaking Next Reporting Period Conestoga Rovers and Associates (CRA) (now operating as GHD Canada) have completed a Class Environmental Assessment (EA) related to the next expansion phase for the Collingwood Wastewater Treatment Plant.

Wastewater Treatment Annual Report 2015
11
Appendix A WWTP Offline Sampling Program Samples are analyzed using procedures from the most current edition of Standard Methods or HACH DR/2010 spectrophotometer methods. The time and day of the samples is determined by the Laboratory Technician so as to equalize the workload while maintaining representative operations data. The Technician is responsible for obtaining proper and sufficient samples through co-ordination with the process operators.
COLLINGWOOD EXTERNAL SAMPLING PROGRAM Unit Process Type Sample Parameters Tested Frequency Raw Sewage Composite CBOD5, TSS, TP, TKN Quarterly
Primary Effluent Composite NH3,TKN, VFA, NO3, CBOD5,
NO2, Biweekly
Final Effluent Composite Grab
NH3, TKN, TP, NO3, CBOD5, SS, TBOD5 NO2 Bacti (E-coli)
Weekly Weekly
Biosolids (Anaerobic sludge)
Grab when truck loaded
TS, anions, ICP, Hg, TKN, TP, VS & E-coli
2x/month
Influent 24 hr. composite pH, SS, TP, FP, Temperature, COD BOD5,
Daily M-F WTF
Primary Effluent 24 hr. composite SS, TP, FP, COD BOD5
Daily M-F W,Th,F
Final Effluent 24 hr. composite
pH, SS, TP, FP, Temperature. COD NH3 BOD5,
Daily M-F W,Th,F
Aeration (i) mixed liquor (ii) return sludge (iii) waste activated sludge
Grab Grab Grab
- half hour settling - SS - Calculate SVI - DO (as required to check against on-line readings)
SS SS
Daily M-F Daily M-F Daily M-F
Thickening Grab
TS, VS in thickened sludge 4 X/week
Raw Sludge Grab TS, VS 4 X/week Digested Sludge Grab TS, VS Weekly Digester Supernatant
Grab TS, VS, BOD5, TP, alkalinity Volatile acids, pH
As process requires

Wastewater Treatment Annual Report 2015
12
Table 2.1
Major Unit Process Data Headworks a) Mechanically cleaned bar screen & conveyor (manually raked bypass raw sewage screen) b) Wet Well Pumps
Number:3 - 100 HP - 14" Submersible angle flow pumps in a dry well application c) Grit Separators
(i) Primary Grit Separation 2 - 3200 mm diameter free standing Grit King Dynamic Separators - with automated control system
(ii) Secondary Grit Separation 1 - US Filter type SW grit classifier
Odour Control Within Building CMS Bio Scrub model B13-M175 tank c/w 23,500 square feet of bio scrub media Primary Sedimentation Number: 3 Rectangular Tanks Surface Area: 560m2 Total Volume: 1,846m3 Aeration Tanks Type: Conventional Activated Sludge Number: 2 Trains, 3 cells per train Cell Dimensions:14.6m x 14.6m x 4.6m Total Volume: 5,885m3 Aeration: 3 - 100 HP fine bubble diffused air Secondary Clarification Number: 2 Rectangular Tanks Dimensions: 12.2m x 61.0m x 3.2m Surface Area: 1,488m2 Disinfection System Ultraviolet light process Trojan - UV4000E Dissolved Air Flotation Unit Number: 1 (Komline-Sanderson) Surface Area: 13.9m2 Anaerobic Digesters Number: 2 Primaries, 1 Secondary, 1 Holding Tank
Total Primary Digester Volume: 2,466m3 Total Secondary Digester Volume: 1,223m3 Total Holding Tank Volume: 990m3 Standby Power Supply 1 - 725kW continuous rated diesel generator set

Wastewater Treatment Annual Report 2015
13
Appendix B Monthly Flow and Process Quality Data
Plant Collingwood WWTP Region CentralMunicipality Town of Collingwood District Simcoe CBOD5 15mg/LWorks Number Operating AuthoritMunicipal TSS 15mg/LTreatment Conventional Activated Sludge Watercourse Collingwood Harbour TP 0.8 mg/L
Phosphorus Removal Minor Basin Huron E-Coli 100 organisms/ 100mLDesign Capacity 24.548 (1000 m3/d) Major Basin Great Lakes pH 6.5 to 9.0
Population Served 19951Annual average Annual average Average
2015 Jan Feb Mar Apr May Jun Jul Aug Sept Oct Nov Dec concentration Loading daily flowFLOWS (m3/d) 13658Monthly ADF 14761 12065 20120 18435 13336 14362 12326 11348 10905 10507 11978 14540Month Total 457580 337810 623720 553050 413410 430850 382110 351790 327160 325710 359340 436210Max day 19440 13590 31500 23350 17670 24540 17890 20400 15600 12880 14740 18440Min day 11770 10870 11940 14480 11560 10370 10160 8930 9530 9310 9050 11080CBOD5 (mg/L) Compliance is Compliance isInfluent 148 25 mg/L 613.7 kg/dEffluent 5.68 4.33 4.43 3.3 2.9 11.7 6.3 2.1 2.3 2.0 2.6 2.1 4.1 56.40Final Effluent Objective concentration is 15 mg/LSS(mg/L) Compliance is Compliance isInfluent 144 25 mg/L 613.7 kg/dEffluent 3.7 4.8 5.2 4.2 3.7 20.5 16.8 4.1 3.7 3.0 4.9 4.8 6.6 90.11Final Effluent Objective concentration is 15 mg/LTP (mg/L) Compliance isInfluent 4.25 24.5 kg/dEffluent 0.13 0.21 0.25 0.29 0.32 0.75 0.44 0.46 0.26 0.27 0.25 0.13 0.31 4.28Monthly average concentration:objective is 0.8mg/L, compliance limit is1.0mg/L and an annual average loading of 24.5 kg/d TKN (mg/L)Influent 31.1Effluent 5.6 7.1 6.0 6.7 10.0 10.2 13.3 15.9 13.9 12.1 11.3 8.6
TAN (mg/L)InfluentEffluent 4.84 6.98 5.49 5.84 9.60 9.60 13.14 15.78 14.60 12.00 10.61 8.22
pH of Final EffluentMin (6.0) 6.7 7 6.8 7 7 7 7.1 7.1 7 6.9 7 6.9Max (9.5) 7.8 7.6 7.5 7.4 7.3 7.2 7.3 7.3 7.3 7.3 7.6 7Compliance means maintaining the the pH of the final effluent within the limits 6.0 to 9.5(objective is 6.5 to 9.0)E-ColiFinal effluent 15 15 29 83 7 285 64 29 68 69 3 24Monthly geometric mean density of E-Coli: objective is100organisms/100mL,compliance is 200 organisms /100mL
120000550
Effluent Objectives

Wastewater Treatment Annual Report 2015
14
Jan Feb Mar Apr May Jun Jul Aug Sept Oct Nov DecMonthly ADF 14761 12065 20120 18435 13336 14362 12326 11348 10905 10507 11978 14540
14761
12065
20120
18435
1333614362
1232611348 10905 10507
11978
14540
0
5000
10000
15000
20000
25000m
3/d
MONTH
TOWN of COLLINGWOOD WWTP 2015Monthly Average
Final Effluent Flow

Wastewater Treatment Annual Report 2015
15
Jan Feb Mar Apr May Jun Jul Aug Sept Oct Nov DecEffluent 5.68 4.33 4.43 3.3 2.9 11.7 6.3 2.1 2.3 2.0 2.6 2.1
0.00
5.00
10.00
15.00
20.00
25.00
30.00m
g/L
Month
TOWN of COLLINGWOOD WWTP2015 Monthly Average Concentration
Final Effluent CBOD5
MOE COMPLIANCE Final Effluent CBOD5Annual average concentration not to exceed 25 mg/L
OPERATING OBJECTIVE 15 mg/L

Wastewater Treatment Annual Report 2015
16
1 2 3 4 5 6 7 8 9 10 11 12Effluent 3.7 4.8 5.2 4.2 3.7 20.5 16.8 4.1 3.7 3.0 4.9 4.8
0.0
5.0
10.0
15.0
20.0
25.0
30.0
mg/
L
Month
TOWN of COLLINGWOOD WWTP2015 Monthly Average Concentration
Final EffluentTSS
MOE COMPLIANCE Final EffluentTSSAnnual average concentration not to exceed 25 mg/L
OPERATING OBJECTIVE 15 mg/L

Wastewater Treatment Annual Report 2015
17
Jan Feb Mar Apr May Jun Jul Aug Sept Oct Nov DecEffluent 0.13 0.21 0.25 0.29 0.32 0.75 0.44 0.46 0.26 0.27 0.25 0.13
0.00
0.10
0.20
0.30
0.40
0.50
0.60
0.70
0.80
0.90
1.00
mg/
L
Month
TOWN of COLLINGWOOD WWTP2015Monthly Average Concentration
Final Effluent TP
MOE COMPLIANCE Final Effluent TPMonthly average concentration not to exceed 1.0 mg/L
Operating objective is 0.8mg/L

Wastewater Treatment Annual Report 2015
18
Ontario
Ministry of the
Environment Municipal Utility Monitoring ProgramMechanical Plants R1
Municipality: Town of CCollingw ood Operating Authority:
Project Name: W.W.T.P. Address: Box 157, CollingwoodAddress: 3 Birch Street
File No. Works Number Data Month Period Year Discharge Type Update Code
46 120000550 Jan 2015 31 2 R 1 2 3 11 16 19 20 21 22 80
CP FLOWS PARAMETER CODE Dec. Monthly Results
01 Total Flow (10 3m3) 50010 3 12 13 Avg. Day Flow (10 3m3/d) 50015 3
Max. Day Flow (10 3m3/d) 50020 330 34 35 38 46
26 BYPASS No. of Occurences
12 13 Plant BypassVol. (10 3m3) 50026 3Duration (hrs) 80563 1Sec. Bypass Vol. (10 3m3) 50040 3Duration (hrs) 80565 1 48 51
30 34 35 38 46
03 RAW SEWAGE Monthly Average Results No. of Samples
12 13 BOD (mg/L) 00011 0 01SS (mg/L) 00006 0 01TKN (mg/L) 00020 0 01Total P. (mg/L) 00033 0 01
30 34 35 38 46 48 51
04 FINAL EFFLUENT 12 13 BOD (mg/L) 00001 1 04
SS (mg/L) 00006 1 04AMMONIA (mg/L) 00019 1 04TKN (mg/L) 00020 1 04Total P. (mg/L) 00033 1 04
30 34 35 38 46 48 51
07 DISINFECTION 12 13 Chlorine Used (kg as Cl2) 50100 1
Chlorine Dosage (mg/L as Cl2) 80410 1Chlorine Resid. (mg/L as Cl2) 80420 1
30 34 35 38 46 48 51
Operator's Comments: Return completed form to:
Don Green705-445-1631 Ministry of the [email protected] 54 Cedar Pointe DriveE-Coli 15 Unit 1203
Barrie, ONL4N 5R7
Town of Collingwood
457.58014.76119.440
00
0.000.0
5.73.74.845.640.13

Wastewater Treatment Annual Report 2015
19
Ontario
Ministry of the
Environment Municipal Utility Monitoring ProgramMechanical Plants R1
Municipality: Town of CCollingw ood Operating Authority:
Project Name: W.W.T.P. Address: Box 157, CollingwoodAddress: 3 Birch Street
File No. Works Number Data Month Period Year Discharge Type Update Code
46 120000550 Feb 2015 31 2 R 1 2 3 11 16 19 20 21 22 80
CP FLOWS PARAMETER CODE Dec. Monthly Results
01 Total Flow (10 3m3) 50010 3 12 13 Avg. Day Flow (10 3m3/d) 50015 3
Max. Day Flow (10 3m3/d) 50020 330 34 35 38 46
26 BYPASS No. of Occurences
12 13 Plant BypassVol. (10 3m3) 50026 3Duration (hrs) 80563 1Sec. Bypass Vol. (10 3m3) 50040 3Duration (hrs) 80565 1 48 51
30 34 35 38 46
03 RAW SEWAGE Monthly Average Results No. of Samples
12 13 BOD (mg/L) 00011 0 01SS (mg/L) 00006 0 01TKN (mg/L) 00020 0 01Total P. (mg/L) 00033 0 01
30 34 35 38 46 48 51
04 FINAL EFFLUENT 12 13 BOD (mg/L) 00001 1 04
SS (mg/L) 00006 1 04AMMONIA (mg/L) 00019 1 04TKN (mg/L) 00020 1 04Total P. (mg/L) 00033 1 04
30 34 35 38 46 48 51
07 DISINFECTION 12 13 Chlorine Used (kg as Cl2) 50100 1
Chlorine Dosage (mg/L as Cl2) 80410 1Chlorine Resid. (mg/L as Cl2) 80420 1
30 34 35 38 46 48 51
Operator's Comments: Return completed form to:
Don Green705-445-1631 Ministry of the [email protected] 54 Cedar Pointe DriveE-Coli 15 Unit 1203
Barrie, ONL4N 5R7
4.34.86.987.050.21
148144
31.104.3
Town of Collingwood
337.81012.06513.590
Wastewater Treatment Annual Report 2015
20
Ontario
Ministry of the
Environment Municipal Utility Monitoring ProgramMechanical Plants R1
Municipality: Town of CCollingw ood Operating Authority:
Project Name: W.W.T.P. Address: Box 157, CollingwoodAddress: 3 Birch Street
File No. Works Number Data Month Period Year Discharge Type Update Code
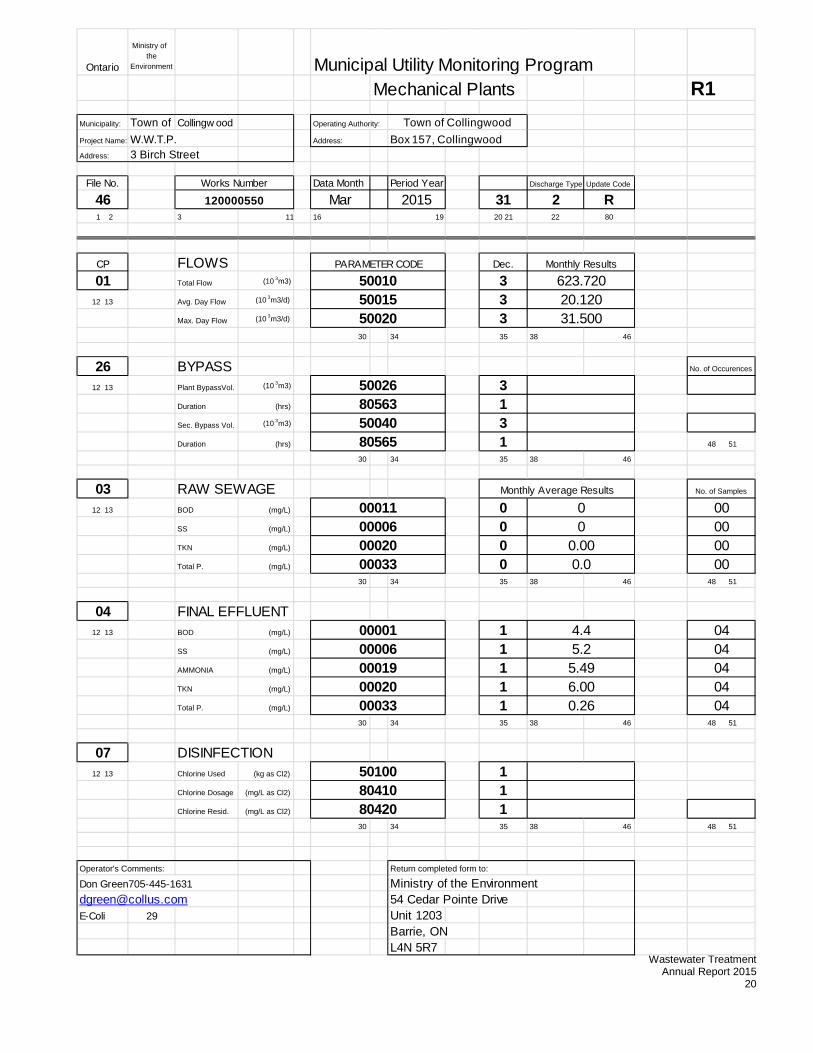
46 120000550 Mar 2015 31 2 R 1 2 3 11 16 19 20 21 22 80
CP FLOWS PARAMETER CODE Dec. Monthly Results
01 Total Flow (10 3m3) 50010 3 12 13 Avg. Day Flow (10 3m3/d) 50015 3
Max. Day Flow (10 3m3/d) 50020 330 34 35 38 46
26 BYPASS No. of Occurences
12 13 Plant BypassVol. (10 3m3) 50026 3Duration (hrs) 80563 1Sec. Bypass Vol. (10 3m3) 50040 3Duration (hrs) 80565 1 48 51
30 34 35 38 46
03 RAW SEWAGE Monthly Average Results No. of Samples
12 13 BOD (mg/L) 00011 0 00SS (mg/L) 00006 0 00TKN (mg/L) 00020 0 00Total P. (mg/L) 00033 0 00
30 34 35 38 46 48 51
04 FINAL EFFLUENT 12 13 BOD (mg/L) 00001 1 04
SS (mg/L) 00006 1 04AMMONIA (mg/L) 00019 1 04TKN (mg/L) 00020 1 04Total P. (mg/L) 00033 1 04
30 34 35 38 46 48 51
07 DISINFECTION 12 13 Chlorine Used (kg as Cl2) 50100 1
Chlorine Dosage (mg/L as Cl2) 80410 1Chlorine Resid. (mg/L as Cl2) 80420 1
30 34 35 38 46 48 51
Operator's Comments: Return completed form to:
Don Green705-445-1631 Ministry of the [email protected] 54 Cedar Pointe DriveE-Coli 29 Unit 1203
Barrie, ONL4N 5R7
Town of Collingwood
623.72020.12031.500
00
0.000.0
4.45.25.496.000.26

Wastewater Treatment Annual Report 2015
21
Ontario
Ministry of the
Environment Municipal Utility Monitoring ProgramMechanical Plants R1
Municipality: Town of CCollingw ood Operating Authority:
Project Name: W.W.T.P. Address: Box 157, CollingwoodAddress: 3 Birch Street
File No. Works Number Data Month Period Year Discharge Type Update Code
46 120000550 Apr 2015 31 2 R 1 2 3 11 16 19 20 21 22 80
CP FLOWS PARAMETER CODE Dec. Monthly Results
01 Total Flow (10 3m3) 50010 3 12 13 Avg. Day Flow (10 3m3/d) 50015 3
Max. Day Flow (10 3m3/d) 50020 330 34 35 38 46
26 BYPASS No. of Occurences
12 13 Plant BypassVol. (10 3m3) 50026 3Duration (hrs) 80563 1Sec. Bypass Vol. (10 3m3) 50040 3Duration (hrs) 80565 1 48 51
30 34 35 38 46
03 RAW SEWAGE Monthly Average Results No. of Samples
12 13 BOD (mg/L) 00011 0 00SS (mg/L) 00006 0 00TKN (mg/L) 00020 0 00Total P. (mg/L) 00033 0 00
30 34 35 38 46 48 51
04 FINAL EFFLUENT 12 13 BOD (mg/L) 00001 1 05
SS (mg/L) 00006 1 05AMMONIA (mg/L) 00019 1 05TKN (mg/L) 00020 1 05Total P. (mg/L) 00033 1 05
30 34 35 38 46 48 51
07 DISINFECTION 12 13 Chlorine Used (kg as Cl2) 50100 1
Chlorine Dosage (mg/L as Cl2) 80410 1Chlorine Resid. (mg/L as Cl2) 80420 1
30 34 35 38 46 48 51
Operator's Comments: Return completed form to:
Don Green705-445-1631 Ministry of the [email protected] 54 Cedar Pointe DriveE-Coli 83 Unit 1203
Barrie, ONL4N 5R7
3.34.25.846.750.29
00
0.000.0
Town of Collingwood
553.05018.43523.350

Wastewater Treatment Annual Report 2015
22
Ontario
Ministry of the
Environment Municipal Utility Monitoring ProgramMechanical Plants R1
Municipality: Town of CCollingw ood Operating Authority:
Project Name: W.W.T.P. Address: Box 157, CollingwoodAddress: 3 Birch Street
File No. Works Number Data Month Period Year Discharge Type Update Code
46 120000550 May 2015 31 2 R 1 2 3 11 16 19 20 21 22 80
CP FLOWS PARAMETER CODE Dec. Monthly Results
01 Total Flow (10 3m3) 50010 3 12 13 Avg. Day Flow (10 3m3/d) 50015 3
Max. Day Flow (10 3m3/d) 50020 330 34 35 38 46
26 BYPASS No. of Occurences
12 13 Plant BypassVol. (10 3m3) 50026 3Duration (hrs) 80563 1Sec. Bypass Vol. (10 3m3) 50040 3Duration (hrs) 80565 1 48 51
30 34 35 38 46
03 RAW SEWAGE Monthly Average Results No. of Samples
12 13 BOD (mg/L) 00011 0 01SS (mg/L) 00006 0 01TKN (mg/L) 00020 0 01Total P. (mg/L) 00033 0 01
30 34 35 38 46 48 51
04 FINAL EFFLUENT 12 13 BOD (mg/L) 00001 1 04
SS (mg/L) 00006 1 04AMMONIA (mg/L) 00019 1 04TKN (mg/L) 00020 1 04Total P. (mg/L) 00033 1 04
30 34 35 38 46 48 51
07 DISINFECTION 12 13 Chlorine Used (kg as Cl2) 50100 1
Chlorine Dosage (mg/L as Cl2) 80410 1Chlorine Resid. (mg/L as Cl2) 80420 1
30 34 35 38 46 48 51
Operator's Comments: Return completed form to:
Don Green705-445-1631 Ministry of the [email protected] 54 Cedar Pointe DriveE-Coli 7 Unit 1203
Barrie, ONL4N 5R7
2.93.79.6010.040.32
00
0.000.0
Town of Collingwood
413.41013.33617.670

Wastewater Treatment Annual Report 2015
23
Ontario
Ministry of the
Environment Municipal Utility Monitoring ProgramMechanical Plants R1
Municipality: Town of CCollingw ood Operating Authority:
Project Name: W.W.T.P. Address: Box 157, CollingwoodAddress: 3 Birch Street
File No. Works Number Data Month Period Year Discharge Type Update Code
46 120000550 Jun 2015 31 2 R 1 2 3 11 16 19 20 21 22 80
CP FLOWS PARAMETER CODE Dec. Monthly Results
01 Total Flow (10 3m3) 50010 3 12 13 Avg. Day Flow (10 3m3/d) 50015 3
Max. Day Flow (10 3m3/d) 50020 330 34 35 38 46
26 BYPASS No. of Occurences
12 13 Plant BypassVol. (10 3m3) 50026 3Duration (hrs) 80563 1Sec. Bypass Vol. (10 3m3) 50040 3Duration (hrs) 80565 1 48 51
30 34 35 38 46
03 RAW SEWAGE Monthly Average Results No. of Samples
12 13 BOD (mg/L) 00011 0 00SS (mg/L) 00006 0 00TKN (mg/L) 00020 0 00Total P. (mg/L) 00033 0 00
30 34 35 38 46 48 51
04 FINAL EFFLUENT 12 13 BOD (mg/L) 00001 1 04
SS (mg/L) 00006 1 04AMMONIA (mg/L) 00019 1 04TKN (mg/L) 00020 1 04Total P. (mg/L) 00033 1 04
30 34 35 38 46 48 51
07 DISINFECTION 12 13 Chlorine Used (kg as Cl2) 50100 1
Chlorine Dosage (mg/L as Cl2) 80410 1Chlorine Resid. (mg/L as Cl2) 80420 1
30 34 35 38 46 48 51
Operator's Comments: Return completed form to:
Don Green705-445-1631 Ministry of the [email protected] 54 Cedar Pointe DriveE-Coli 285 Unit 1203
Barrie, ONL4N 5R7
Town of Collingwood
430.85014.36224.540
00
0.000.0
11.720.59.6010.240.75

Wastewater Treatment Annual Report 2015
24
Ontario
Ministry of the
Environment Municipal Utility Monitoring ProgramMechanical Plants R1
Municipality: Town of CCollingw ood Operating Authority:
Project Name: W.W.T.P. Address: Box 157, CollingwoodAddress: 3 Birch Street
File No. Works Number Data Month Period Year Discharge Type Update Code
46 120000550 Jul 2015 31 2 R 1 2 3 11 16 19 20 21 22 80
CP FLOWS PARAMETER CODE Dec. Monthly Results
01 Total Flow (10 3m3) 50010 3 12 13 Avg. Day Flow (10 3m3/d) 50015 3
Max. Day Flow (10 3m3/d) 50020 330 34 35 38 46
26 BYPASS No. of Occurences
12 13 Plant BypassVol. (10 3m3) 50026 3Duration (hrs) 80563 1Sec. Bypass Vol. (10 3m3) 50040 3Duration (hrs) 80565 1 48 51
30 34 35 38 46
03 RAW SEWAGE Monthly Average Results No. of Samples
12 13 BOD (mg/L) 00011 0 01SS (mg/L) 00006 0 01TKN (mg/L) 00020 0 01Total P. (mg/L) 00033 0 01
30 34 35 38 46 48 51
04 FINAL EFFLUENT 12 13 BOD (mg/L) 00001 1 05
SS (mg/L) 00006 1 05AMMONIA (mg/L) 00019 1 05TKN (mg/L) 00020 1 05Total P. (mg/L) 00033 1 05
30 34 35 38 46 48 51
07 DISINFECTION 12 13 Chlorine Used (kg as Cl2) 50100 1
Chlorine Dosage (mg/L as Cl2) 80410 1Chlorine Resid. (mg/L as Cl2) 80420 1
30 34 35 38 46 48 51
Operator's Comments: Return completed form to:
Glenn Price705-445-1631 Ministry of the [email protected] 54 Cedar Pointe DriveE-Coli 64 Unit 1203
Barrie, ONL4N 5R7
6.316.813.1413.250.45
00
0.000.0
Town of Collingwood
382.11012.32617.890

Wastewater Treatment Annual Report 2015
25
Ontario
Ministry of the
Environment Municipal Utility Monitoring ProgramMechanical Plants R1
Municipality: Town of CCollingw ood Operating Authority:
Project Name: W.W.T.P. Address: Box 157, CollingwoodAddress: 3 Birch Street
File No. Works Number Data Month Period Year Discharge Type Update Code
46 120000550 Aug 2015 31 2 R 1 2 3 11 16 19 20 21 22 80
CP FLOWS PARAMETER CODE Dec. Monthly Results
01 Total Flow (10 3m3) 50010 3 12 13 Avg. Day Flow (10 3m3/d) 50015 3
Max. Day Flow (10 3m3/d) 50020 330 34 35 38 46
26 BYPASS No. of Occurences
12 13 Plant BypassVol. (10 3m3) 50026 3Duration (hrs) 80563 1Sec. Bypass Vol. (10 3m3) 50040 3Duration (hrs) 80565 1 48 51
30 34 35 38 46
03 RAW SEWAGE Monthly Average Results No. of Samples
12 13 BOD (mg/L) 00011 0 01SS (mg/L) 00006 0 00TKN (mg/L) 00020 0 01Total P. (mg/L) 00033 0 00
30 34 35 38 46 48 51
04 FINAL EFFLUENT 12 13 BOD (mg/L) 00001 1 04
SS (mg/L) 00006 1 04AMMONIA (mg/L) 00019 1 04TKN (mg/L) 00020 1 04Total P. (mg/L) 00033 1 04
30 34 35 38 46 48 51
07 DISINFECTION 12 13 Chlorine Used (kg as Cl2) 50100 1
Chlorine Dosage (mg/L as Cl2) 80410 1Chlorine Resid. (mg/L as Cl2) 80420 1
30 34 35 38 46 48 51
Operator's Comments: Return completed form to:
Glenn Price705-445-1631 Ministry of the [email protected] 54 Cedar Pointe DriveE-Coli 29 Unit 1203
Barrie, ONL4N 5R7
2.14.1
15.7815.880.46
00
0.000.0
Town of Collingwood
351.79011.34820.400

Wastewater Treatment Annual Report 2015
26
Ontario
Ministry of the
Environment Municipal Utility Monitoring ProgramMechanical Plants R1
Municipality: Town of CCollingw ood Operating Authority:
Project Name: W.W.T.P. Address: Box 157, CollingwoodAddress: 3 Birch Street
File No. Works Number Data Month Period Year Discharge Type Update Code
46 120000550 Sep 2015 31 2 R 1 2 3 11 16 19 20 21 22 80
CP FLOWS PARAMETER CODE Dec. Monthly Results
01 Total Flow (10 3m3) 50010 3 12 13 Avg. Day Flow (10 3m3/d) 50015 3
Max. Day Flow (10 3m3/d) 50020 330 34 35 38 46
26 BYPASS No. of Occurences
12 13 Plant BypassVol. (10 3m3) 50026 3Duration (hrs) 80563 1Sec. Bypass Vol. (10 3m3) 50040 3Duration (hrs) 80565 1 48 51
30 34 35 38 46
03 RAW SEWAGE Monthly Average Results No. of Samples
12 13 BOD (mg/L) 00011 0 00SS (mg/L) 00006 0 00TKN (mg/L) 00020 0 00Total P. (mg/L) 00033 0 00
30 34 35 38 46 48 51
04 FINAL EFFLUENT 12 13 BOD (mg/L) 00001 1 05
SS (mg/L) 00006 1 05AMMONIA (mg/L) 00019 1 05TKN (mg/L) 00020 1 05Total P. (mg/L) 00033 1 05
30 34 35 38 46 48 51
07 DISINFECTION 12 13 Chlorine Used (kg as Cl2) 50100 1
Chlorine Dosage (mg/L as Cl2) 80410 1Chlorine Resid. (mg/L as Cl2) 80420 1
30 34 35 38 46 48 51
Operator's Comments: Return completed form to:
Glenn Price705-445-1631 Ministry of the [email protected] 54 Cedar Pointe DriveE-Coli 68 Unit 1203
Barrie, ONL4N 5R7
2.33.7
14.6013.880.26
00
0.000.0
Town of Collingwood
327.16010.90515.600

Wastewater Treatment Annual Report 2015
27
Ontario
Ministry of the
Environment Municipal Utility Monitoring ProgramMechanical Plants R1
Municipality: Town of CCollingw ood Operating Authority:
Project Name: W.W.T.P. Address: Box 157, CollingwoodAddress: 3 Birch Street
File No. Works Number Data Month Period Year Discharge Type Update Code
46 120000550 Oct 2015 31 2 R 1 2 3 11 16 19 20 21 22 80
CP FLOWS PARAMETER CODE Dec. Monthly Results
01 Total Flow (10 3m3) 50010 3 12 13 Avg. Day Flow (10 3m3/d) 50015 3
Max. Day Flow (10 3m3/d) 50020 330 34 35 38 46
26 BYPASS No. of Occurences
12 13 Plant BypassVol. (10 3m3) 50026 3Duration (hrs) 80563 1Sec. Bypass Vol. (10 3m3) 50040 3Duration (hrs) 80565 1 48 51
30 34 35 38 46
03 RAW SEWAGE Monthly Average Results No. of Samples
12 13 BOD (mg/L) 00011 0 02SS (mg/L) 00006 0 02TKN (mg/L) 00020 0 02Total P. (mg/L) 00033 0 02
30 34 35 38 46 48 51
04 FINAL EFFLUENT 12 13 BOD (mg/L) 00001 1 04
SS (mg/L) 00006 1 04AMMONIA (mg/L) 00019 1 04TKN (mg/L) 00020 1 04Total P. (mg/L) 00033 1 04
30 34 35 38 46 48 51
07 DISINFECTION 12 13 Chlorine Used (kg as Cl2) 50100 1
Chlorine Dosage (mg/L as Cl2) 80410 1Chlorine Resid. (mg/L as Cl2) 80420 1
30 34 35 38 46 48 51
Operator's Comments: Return completed form to:
Glenn Price705-445-1631 Ministry of the [email protected] 54 Cedar Pointe DriveE-Coli 69 Unit 1203
Barrie, ONL4N 5R7
Town of Collingwood
325.71010.50712.880
00
0.000.0
2.03.0
12.0012.100.27

Wastewater Treatment Annual Report 2015
28
Ontario
Ministry of the
Environment Municipal Utility Monitoring ProgramMechanical Plants R1
Municipality: Town of CCollingw ood Operating Authority:
Project Name: W.W.T.P. Address: Box 157, CollingwoodAddress: 3 Birch Street
File No. Works Number Data Month Period Year Discharge Type Update Code
46 120000550 Nov 2015 31 2 R 1 2 3 11 16 19 20 21 22 80
CP FLOWS PARAMETER CODE Dec. Monthly Results
01 Total Flow (10 3m3) 50010 3 12 13 Avg. Day Flow (10 3m3/d) 50015 3
Max. Day Flow (10 3m3/d) 50020 330 34 35 38 46
26 BYPASS No. of Occurences
12 13 Plant BypassVol. (10 3m3) 50026 3Duration (hrs) 80563 1Sec. Bypass Vol. (10 3m3) 50040 3Duration (hrs) 80565 1 48 51
30 34 35 38 46
03 RAW SEWAGE Monthly Average Results No. of Samples
12 13 BOD (mg/L) 00011 0 00SS (mg/L) 00006 0 00TKN (mg/L) 00020 0 00Total P. (mg/L) 00033 0 00
30 34 35 38 46 48 51
04 FINAL EFFLUENT 12 13 BOD (mg/L) 00001 1 05
SS (mg/L) 00006 1 05AMMONIA (mg/L) 00019 1 05TKN (mg/L) 00020 1 05Total P. (mg/L) 00033 1 05
30 34 35 38 46 48 51
07 DISINFECTION 12 13 Chlorine Used (kg as Cl2) 50100 1
Chlorine Dosage (mg/L as Cl2) 80410 1Chlorine Resid. (mg/L as Cl2) 80420 1
30 34 35 38 46 48 51
Operator's Comments: Return completed form to:
Glenn Price705-445-1631 Ministry of the [email protected] 54 Cedar Pointe DriveE-Coli 3 Unit 1203
Barrie, ONL4N 5R7
Town of Collingwood
359.34011.97814.740
00
0.000.0
2.64.9
10.6111.260.25

Wastewater Treatment Annual Report 2015
29
Ontario
Ministry of the
Environment Municipal Utility Monitoring ProgramMechanical Plants R1
Municipality: Town of CCollingw ood Operating Authority:
Project Name: W.W.T.P. Address: Box 157, CollingwoodAddress: 3 Birch Street
File No. Works Number Data Month Period Year Discharge Type Update Code
46 120000550 Dec 2015 31 2 R 1 2 3 11 16 19 20 21 22 80
CP FLOWS PARAMETER CODE Dec. Monthly Results
01 Total Flow (10 3m3) 50010 3 12 13 Avg. Day Flow (10 3m3/d) 50015 3
Max. Day Flow (10 3m3/d) 50020 330 34 35 38 46
26 BYPASS No. of Occurences
12 13 Plant BypassVol. (10 3m3) 50026 3Duration (hrs) 80563 1Sec. Bypass Vol. (10 3m3) 50040 3Duration (hrs) 80565 1 48 51
30 34 35 38 46
03 RAW SEWAGE Monthly Average Results No. of Samples
12 13 BOD (mg/L) 00011 0 00SS (mg/L) 00006 0 00TKN (mg/L) 00020 0 00Total P. (mg/L) 00033 0 00
30 34 35 38 46 48 51
04 FINAL EFFLUENT 12 13 BOD (mg/L) 00001 1 04
SS (mg/L) 00006 1 04AMMONIA (mg/L) 00019 1 04TKN (mg/L) 00020 1 04Total P. (mg/L) 00033 1 04
30 34 35 38 46 48 51
07 DISINFECTION 12 13 Chlorine Used (kg as Cl2) 50100 1
Chlorine Dosage (mg/L as Cl2) 80410 1Chlorine Resid. (mg/L as Cl2) 80420 1
30 34 35 38 46 48 51
Operator's Comments: Return completed form to:
Glenn Price705-445-1631 Ministry of the [email protected] 54 Cedar Pointe DriveE-Coli 24 Unit 1203
Barrie, ONL4N 5R7
2.25.57.708.420.14
00
0.000.0
Town of Collingwood
418.73014.43918.440

Wastewater Treatment Annual Report 2015
30
Appendix C Sludge Management Overview
Contaminan Arsenic Cadmium Cobalt Chromium Copper Mercury Molybdenum Nickel Lead Selenium Zinc Ammonia Nitrate Nitrite Kjeldahl-N Phosphorus Potassium Total Solids E-Coli Volatile SolidsSampling As Cd Co Cr Cu Hg Mo Ni Pb Se Zn NH3 NO3 NO2 TKN TP K TS VS
Date mg / L mg / L mg / L mg / L mg / L mg / L mg / L mg / L mg / L mg / L mg / L mg / L mg / L mg / L mg / L mg / L mg / L % cfu/g %8-Jan-15 0.10 0.0195 0.061 0.3 21.3 0.0162 0.148 0.34 1.13 0.074 12.6 1190 2 2 2140 583 160 2.12 32100 61.2
21-Jan-15 0.12 0.0395 0.094 0.6 33.3 0.0197 0.26 0.58 2.23 0.118 22.1 1680 0.4 0.2 2290 743 200 2.95 6670 60.14-Feb-15 0.1 0.0191 0.061 0.4 22.3 0.0114 0.153 0.33 0.874 0.079 13.3 2150 0.4 0.2 2970 509 200 1.83 16900 60.3
18-Feb-15 0.1 0.0184 0.056 0.3 1.96 0.0166 0.138 0.29 0.958 0.067 12.2 1830 0.4 0.2 2560 699 200 1.83 6710 60.64-Mar-15 0.1 0.0112 0.05 0.2 11.4 0.00284 0.08 0.15 0.422 0.043 6.69 1940 0.4 0.2 2160 466 180 1.48 13500 63.2
18-Mar-15 0.1 0.0219 0.051 0.3 19.6 0.0154 0.138 0.24 0.674 0.064 11.6 1890 0.4 0.2 2620 809 210 1.67 8070 63.11-Apr-15 0.1 0.018 0.052 0.3 20.3 0.0129 0.139 0.25 0.666 0.062 11.3 1340 0.4 0.2 2730 690 220 1.7 44100 64
15-Apr-15 0.1 0.0267 0.066 0.5 28.1 0.023 0.182 0.49 0.971 0.084 16.4 1750 0.4 0.2 2760 725 210 2.48 23100 62.629-Apr-15 0.1 0.0229 0.064 0.5 26.8 0.0248 0.169 0.36 0.814 0.079 15.5 1370 0.4 0.2 2240 641 230 2.14 8100 62
13-May-15 0.1 0.0211 0.053 0.4 22.1 0.0166 0.137 0.31 1.68 0.058 22.5 1480 0.4 0.2 2530 617 190 1.87 35400 62.727-May-15 0.1 0.0237 0.052 0.4 21 0.00992 0.14 0.27 0.704 0.068 15.9 1480 0.4 0.2 2600 567 180 1.65 18400 6310-Jun-15 0.1 0.0251 0.056 0.4 24.1 0.0391 0.16 0.28 0.796 0.071 38.4 1570 0.4 0.2 2020 544 160 1.88 43700 63.424-Jun-15 0.1 0.0301 0.066 0.5 27.9 0.016 0.198 0.35 0.976 0.081 22.3 1100 0.4 0.2 2570 694 150 2.3 89900 58.3
8-Jul-15 0.1 0.0391 0.075 0.5 27.6 0.0382 0.227 0.36 1.23 0.096 25.5 1300 0.4 0.2 2290 637 160 0.28 4260 59.422-Jul-15 0.11 0.0421 0.078 0.6 31.4 0.0126 0.271 0.4 1.42 0.113 29.8 1500 0.4 0.2 3310 1050 140 2.6 2100 38.25-Aug-15 0.1 0.0298 0.082 0.4 22.8 0.0123 0.25 0.282 1.32 0.091 21.2 719 0.4 0.2 2350 615 150 1.95 18000 38.3
19-Aug-15 0.119 0.0507 0.095 0.6 32.5 0.0147 0.256 0.429 1.78 0.138 28.5 1320 0.4 0.2 2940 906 154 2.5 9580 58.82-Sep-15 0.14 0.0543 0.108 0.7 37.3 0.041 0.302 0.491 2.23 0.155 34.7 1250 0.4 0.2 3960 2860 143 3.38 12200 58.8
16-Sep-15 0.132 0.0499 0.105 0.7 34.3 0.0215 0.284 0.497 2.05 0.146 31.6 1170 0.4 0.2 2730 988 165 2.36 23100 61.230-Sep-15 0.07 0.023 0.055 0.3 16.5 0.0145 0.129 0.21 1.21 0.0772 14.4 1220 0.4 0.2 1740 427 147 1.68 53500 62.415-Oct-15 0.11 0.035 0.164 0.5 29.1 0.0101 0.22 0.396 2.11 0.107 26.8 1240 0.4 0.2 2400 830 175 2.89 33200 35.728-Oct-15 0.093 0.0374 0.171 0.4 24 0.02 0.204 0.347 1.74 0.105 22.8 1270 0.4 0.2 2340 674 173 1.86 132000 64.612-Nov-15 0.1 0.023 0.116 0.3 18.4 0.0104 0.173 0.242 1.22 0.0716 17.8 1140 0.4 0.2 1540 416 145 1.63 15600 64.925-Nov-15 0.067 0.0235 0.088 0.3 21.6 0.0091 0.177 0.253 2.69 0.0618 15.9 943 0.4 0.2 1240 290 116 1.44 122000 64.19-Dec-15 0.075 0.0266 0.095 0.5 20.4 0.0129 0.235 0.448 2.72 0.0747 18.6 1010 0.4 0.2 2630 787 118 1.89 29800 67.8
21-Dec-15 0.074 0.0259 0.09 0.4 19.4 0.0053 0.218 0.339 2.43 0.0699 19.9 1230 0.4 0.2 2530 688 148 1.63 16900 66.4

Wastewater Treatment Annual Report 2015
31

Wastewater Treatment Annual Report 2015
32

Wastewater Treatment Annual Report 2015
33

Wastewater Treatment Annual Report 2015
34

Wastewater Treatment Annual Report 2015
35

Wastewater Treatment Annual Report 2015
36

Wastewater Treatment Annual Report 2015
37

Wastewater Treatment Annual Report 2015
38
Wastewater Treatment Annual Report 2015
39

Wastewater Treatment Annual Report 2015
40

Wastewater Treatment Annual Report 2015
41
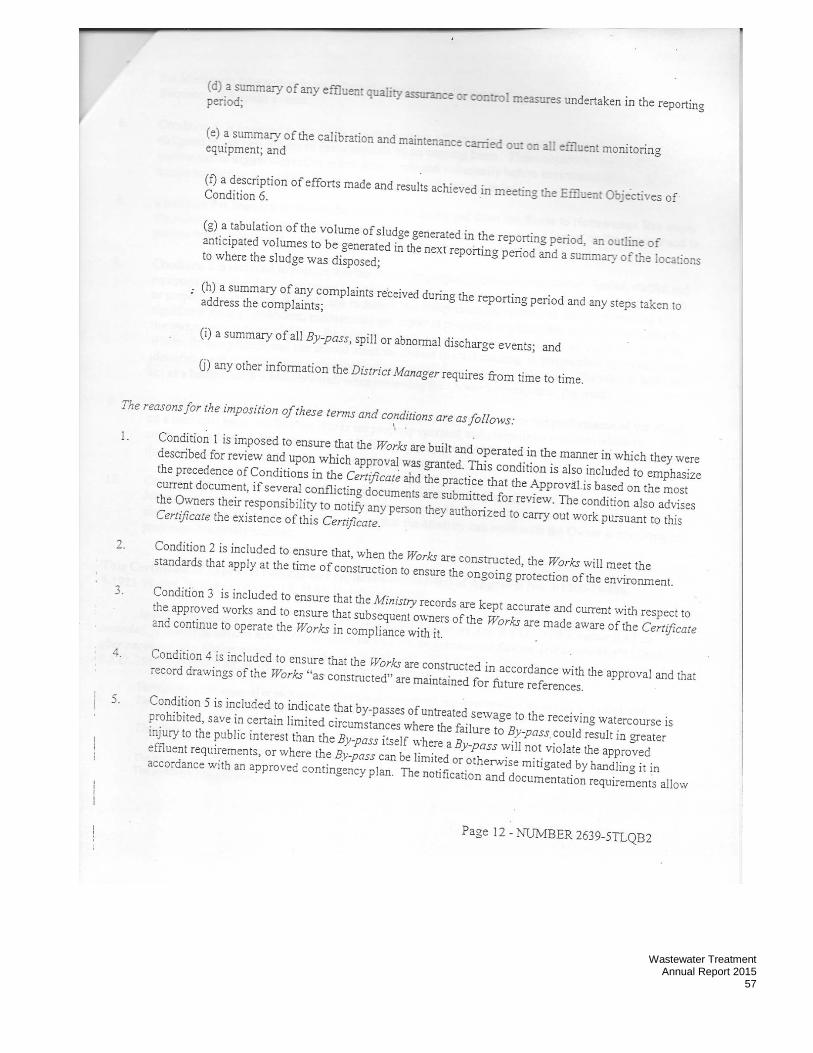
Appendix D Plant Certificate of Approval

Wastewater Treatment Annual Report 2015
42

Wastewater Treatment Annual Report 2015
43
Wastewater Treatment Annual Report 2015
44

Wastewater Treatment Annual Report 2015
45

Wastewater Treatment Annual Report 2015
46

Wastewater Treatment Annual Report 2015
47

Wastewater Treatment Annual Report 2015
48

Wastewater Treatment Annual Report 2015
49

Wastewater Treatment Annual Report 2015
50

Wastewater Treatment Annual Report 2015
51

Wastewater Treatment Annual Report 2015
52

Wastewater Treatment Annual Report 2015
53

Wastewater Treatment Annual Report 2015
54

Wastewater Treatment Annual Report 2015
55

Wastewater Treatment Annual Report 2015
56
Wastewater Treatment Annual Report 2015
57

Wastewater Treatment Annual Report 2015
58

Wastewater Treatment Annual Report 2015
59
Wastewater Treatment Annual Report 2015
60
Appendix E Calibration Reports

Wastewater Treatment Annual Report 2015
61
Wastewater Treatment Annual Report 2015
62
Wastewater Treatment Annual Report 2015
63

Wastewater Treatment Annual Report 2015
64

Wastewater Treatment Annual Report 2015
65

Wastewater Treatment Annual Report 2015
66

Wastewater Treatment Annual Report 2015
67

Wastewater Treatment Annual Report 2015
68
Appendix F Bypass and Spills Report The report below outlines any bypasses in 2015. The original document is held at the Collingwood WWTP and is available for review upon request.
Pumping Station And Plant Bypass Monthly Summary
Month
Primary Bypass Secondary Bypass
No. of days Duration (hrs)
Volume
(1,000 m3) No. of days Duration
(hrs) Volume
(1,000 m3)
Jan 0 1 24 13.8
Feb 0 0
Mar 0 0
Apr 0 0
May 0 0
Jun 0 0
Jul 0 0
Aug 0 0
Sep 0 0
Oct 0 0
Nov 0 0
Dec 0 0
Total 0 0
Volume of Bypass as a % of the
average daily flow 0.27%

Wastewater Treatment Annual Report 2015
69
Appendix G Out of Compliance – Letter from MOECC

Wastewater Treatment Annual Report 2015
70
All the information supply within this document is correct and complete to the best of the authors knowledge. If further information is required please do not hesitate to contact the author: Mr. Glenn Price, Manager of Wastewater Treatment