color-plus-depth level-of-detail in 3d tele-immersive ...jzwang/ustc13/mm2011/p13-wu.pdf · based...
TRANSCRIPT
Color-plus-Depth Level-of-Detail in 3D Tele-immersive
Video: A Psychophysical Approach
⇤
Wanmin Wu, Ahsan Arefin, Gregorij Kurillo
†, Pooja
Agarwal, Klara Nahrstedt, Ruzena Bajcsy
†
Department of Computer Science, University of Illinois at Urbana-Champaign, Urbana, IL, USA.
†Department of EECS, University of California at Berkeley, Berkeley, CA, USA.
{wwu23, marefin2, pagarwl, klara}@illinois.edu,
†{gregorij, bajcsy}@eecs.berkeley.edu
ABSTRACTThis paper presents a psychophysical study that measuresthe perceptual thresholds of a new factor called Color-plus-Depth Level-of-Detail peculiar to polygon-based 3D tele-immersive video. The results demonstrate the existence ofJust Noticeable Degradation and Just Unacceptable Degra-dation thresholds on the factor. In light of the results,we describe the design and implementation of a real-timeperception-based quality adaptor for 3D tele-immersive video.Our experimental results show that the adaptation schemecan reduce resource usage while considerably enhancing theoverall perceived visual quality.
Categories and Subject DescriptorsH.1.2 [Information Systems]: Models and Principles—human factors; H.4.3 [Information Systems Applica-
tions]: Communications Applications—Computer confer-encing, teleconferencing, and videoconferencing
General TermsDesign, Experiment, Human Factors, Measurement
KeywordsTele-immersive Video, Perception, Psychophysics, Color-plus-Depth, Level-of-Detail, Adaptation
1. INTRODUCTIONThe past few years have witnessed a surge of interest in
telepresence video collaboration technologies. Several in-dustrial systems have arisen [1][2], yet with a limited ap-plication domain as most are still concentrated solely on
⇤Area chair: Pal Halvorsen. This material is based uponwork supported by the National Science Foundation underGrant No. CNS 0834480. Any opinions, findings, and con-clusions or recommendations expressed in this material arethose of the author(s) and do not necessarily reflect the viewsof the National Science Foundation.
Permission to make digital or hard copies of all or part of this work for
personal or classroom use is granted without fee provided that copies are
not made or distributed for profit or commercial advantage and that copies
bear this notice and the full citation on the first page. To copy otherwise, to
republish, to post on servers or to redistribute to lists, requires prior specific
permission and/or a fee.
MM’11, November 28–December 1, 2011, Scottsdale, Arizona, USA.
Copyright 2011 ACM 978-1-4503-0616-4/11/11 ...$5.00.
desktop video-conferencing scenarios. Emerging is the 3Dtele-immersion technology that expands the horizon by sup-porting full-body interaction of physical activities in vir-tual reality environments. Applications have been found incyber-archeology, rehabilitation, collaborative dancing, andgaming (e.g., [28][29]).
Despite great potential, today’s tele-immersive systemsstill face significant challenges due to the high interactiv-ity requirement and resource demand. Great research ef-forts have been devoted to making the systems more e�-cient [5][21][28], with notable improvement, but the focushas been primarily on system-centric, algorithmic optimiza-tions. The systems still struggle with heavy temporal andspatial overheads and complexities, limiting their broaderdeployment.
Since the ultimate goal of tele-immersion is to deliver asatisfying experience to end users, we believe that takinga more human-centric perspective would be beneficial. It isknown that the Human Visual System (HVS) has perceptuallimitations, so the research question is whether it is possibleto exploit these limitations and reduce data load and/or ratewithout impairing much perceived quality. Similar ques-tions have been studied in traditional video-conferencingsystems for factors such as jitter [7], audio-visual sync [27],latency [11], and frame rate [3][16]. However, 3D tele-immersivevideo possesses unique characteristics whose perceptual im-pact is little understood.
Perhaps the most important trait that distinguishes 3Dtele-immersion from the traditional video-conferencing is itscolor-plus-depth video format as the visual representationsof users. Therefore, the density and accuracy of the textureand depth maps is a new and critical factor in tele-immersivevideo, which we combine and refer to as the Color-Plus-Depth Level-of-Detail (CZLoD). In this work, we make thefirst attempt to psychophysically study this factor in polygon-based 3D tele-immersive video. We employ the method oflimits from psychophysics [8] to examine two perceptualthresholds - Just Noticeable Degradation (JNDG) and JustUnacceptable Degradation (JUADG). We evaluate forty stim-uli in four varied conditions with di↵erent contents and pixelresolution settings. The results indicate that the thresh-old levels are actually fairly generous (i.e., a fair amount ofdegradation can be su↵ered) and are related to both activitytype and resolution. In general, fine motor activity exhibitslower threshold levels than gross motor activity, and lowerresolution video exhibits lower threshold levels than higherresolution levels.
In light of the results, we design and implement a perception-
13
based real-time adaptation scheme for CZLoD in 3D tele-immersion. Implemented as a closed feedback loop, theadaptor monitors various interdependent Quality-of-Service(QoS) parameters to determine the appropriate degradationratio for CZLoD. The actual degradation, nevertheless, isachieved by controlling a detailing parameter, whose map-ping to the degradation ratio is unpredictable as it varieswith environments and activities. Thus a learning algo-rithm is used to learn the quantitative model of the rela-tionship between the detailing parameter and the CZLoDdegradation ratios. We evaluate the adaptation scheme in areal-world 3D tele-immersive testbed, and the experimentalresults demonstrate that the proposed scheme can achieveconsiderable improvement in frame rate without impairingperceived detailing quality. We also record the generatedtele-immersive video with and without adaptation respec-tively and conduct a crowdsourcing subjective study to com-pare their overall quality. The collected responses show thatover 90% of users thought the video with adaptation wasbetter than the unimpaired video.
Our work is partly inspired by the level-of-detail conceptin 3D graphics [18]. Nevertheless, we believe there are fourmain factors that distinguish our work: (1) we are the firstto psychophysically measure perception thresholds of level-of-detail in 3D video. (2) Tele-immersion is a distributed,highly interactive pipeline, so almost all of our design choicesare made carefully for the interactive timing bounds (Sec-tion 5). (3) Since tele-immersion is about real-time videowhere scene complexity is unpredictable, the relationshipbetween the detailing parameter and the resulting CZLoDis unpredictable too; therefore, we learn a predictive modelabout their relations at run-time (Section 5.2.3). We alsoshow that the predictor can produce very high accuracy inreal time (Section 5.3). (4) We demonstrate how the per-ceptual thresholds obtained psychophysically can be appliedto practice for real-time resource management.
In this work, we develop an intra-stream data adapta-tion scheme that reduces level-of-detail within each streamat the sending side without users being aware of it. Thishuman-centric approach e↵ectively alleviates the data loadfor computation-intensive operations, thus improving thetemporal e�ciency of the systems. Yet even with intra-stream data reduced, spatial (bandwidth) e�ciency is stilla problem due to the multi-stream/multi-site nature of tele-immersive collaboration. In our other work [33], we have ac-tually addressed the spatial challenge with an inter-streamdata adaptation scheme at the networking phase that re-duces the number of streams with minimal disruption tovisual quality.
We begin by reviewing related work (Section 2), and thendiscuss tele-immersive video in greater depth (Section 3). Apsychophysical study of perceptual limitation and accept-ability on the detailing factor is then described (Section 4).We present the construction of our perception-based qualityadaptation scheme (Section 5). The paper concludes by dis-cussing the limitations of the study and implications of ourresearch (Section 6).
2. RELATED WORKThe ultimate goal of 3D tele-immersion is to enable peo-
ple to interact across distance just as if they were co-locatedphysically. This is achieved by fusing the 3D representationsof geographically distributed users into a virtual reality en-
vironment in real time. The history of 3D tele-immersioncan be traced back to about a decade ago, when researchersdemonstrated the first networked tele-immersive applicationthat could run at 2 to 3 frames per second (fps) [28]. Vari-ous e↵orts have been made to improve the e�ciency of thesystems in diverse components such as depth reconstruc-tion [15][34], coordinated data transport protocol [21], ren-dering [28], as well as real-time 3D video compression [35].Despite the notable improvement, tele-immersive systemsare still far from becoming a commodity due to the highinteractivity demand and heavy computational complexi-ties. In this paper, we tackle the challenge from a di↵er-ent perspective by examining data redundancy in terms ofpsychophysical principles. We believe our approaches areorthogonal to the system-centric algorithmic improvements,and thus can be combined to provide greater performancebenefits.
Psychophysics is not new to the multimedia community.The JPEG codecs [12], for example, compress images byeliminating high frequency details that are invisible to hu-man eyes. Audio compression algorithms, such as MP3, ex-ploit psychoacoustic principles to reduce information thatis less audible to human ears [9]. Recently, psychophysicsis also being applied to haptic feedback where the sam-ples with imperceptible changes are removed from networktransmission [26]. Perhaps the most relevant to our workis the recent psychophysical study conducted by De Silva etal. that considered the Just Noticeable Di↵erence in Depth(JNDD) in 3D video [24]. However, the context is very dif-ferent from this work in that the video content therein isfor o✏ine-generated 3D-TV. The real-time requirement ofpolygon-based tele-immersive video leads to the emergenceof a new definition of CZLoD that is not applicable in 3D-TV video (this will become more apparent in Section 3). Wealso develop (to our knowledge) the first perception-basedadaptation scheme for polygon-based 3D tele-immersion.
3. TELE-IMMERSIVE VIDEOTo avoid any confusion, we have to first point out that
tele-immersive video is di↵erent from the commonly knownstereoscopic video (as in 3D movies) which creates depthillusion with two o↵set imaging sequences for the two eyesof viewers respectively. Unlike such stereoscopic video, tele-immersive video refers to the color-plus-depth video, createdand visualized in real time.
3.1 Real-time AcquisitionThe acquisition pipeline in 3D tele-immersion mainly con-
sists of three stages: capture, transmission, and visualiza-tion. Tele-immersive video is often captured by an arrayof synchronized cameras surrounding the physical environ-ment. Unlike conventional multi-view video conferencing/lec-turing systems, each camera here is a stereo unit, typicallyequipped with binocular or trinocular lenses, and connectedto a host computer via IEEE 1394 (FireWire) interface.At interactive rates, the host computer grabs image framessynchronously from all lenses and produces color-plus-depthframes. A more detailed description of this 3D reconstruc-tion process is deferred to Section 3.2. After the 3D recon-struction is completed with some post-processing (filtering,smoothing, regularity enforcement), the 3D frame is sent tothe collaborating site(s) for visualization in a virtual-realityenvironment where all participants can seamlessly interact.
14

Figure 1: Hybrid depth and texture mapping process:
expensive depth cross-correlation is only performed on
vertices after meshing, and depths for the other pixels
are linearly interpolated (adapted from [29]).
3.2 Color-Plus-Depth Level-of-DetailIn this section, we describe the generation of color-plus-
depth frames in greater detail. As Figure 1 illustrates, afterthe raw frames are fetched from the stereo camera, they arefirst preprocessed (e.g., resizing, rectification). Then one ofthe images is used as the “reference frame” (e.g., the imagefrom the left eye of the camera as shown in Figure 1), wherebackground subtraction is performed. The next major stepnormally would be to reconstruct the 3D information of theframe for each foreground pixel. However, obtaining an ac-curate, dense (per pixel) depth map on commodity hardwareturns out to be very time-consuming. In addition, transmit-ting the full-sized texture information would be quite costlyin network bandwidth as well as in visualization latency,given the multi-site, multi-stream nature of tele-immersion.For these reasons, several tele-immersive systems use thepolygonal modeling approach [15][20][30], to alleviate bothtemporal and spatial overheads.
In this approach, after background subtraction the ref-erence frame is decomposed into polygons (e.g., triangles)based on texture homogeneity. This is done by recursivelyrefining bisection until the variance within every polygon isless than a threshold THvar. Importantly, afterwards theexpensive depth-correlation operation is only performed onmesh vertices [29]. The depth calculation for the other pixelscan thus be largely simplified by linear interpolation. Sim-ilar subdivision can be applied for textures as well. Sincenow only the coordinates and textures of vertices need to betransmitted (and those of the remaining pixels to be approx-imated at the receiving/rendering side), such region-basedrepresentations (and the accompanying hybrid depth andtexture mapping algorithms) lead to a reduction of framesize as well as data manipulation time in all stages of thetele-immersion pipeline, making them favorable for resource-intensive tele-immersion applications. Due to its clear bene-fits compared to the conventional point cloud approach (withsubstantially less data to process and transmit), this poly-gon modeling approach is very likely to become more widelyadopted in the future.
We can observe that the number of foreground verticesafter meshing regulates the color-plus-depth granularity of
Notations DescriptionsJNDG Just Noticeable Degradation Ratio
JUADG Just Unacceptable Degradation Ratio
p Probability for determining psychophysicalthresholds
fi 2D renfernce frame with frame number i
Fi Color-plus-depth frame reconstructed from fiCZLoD(Fi) Number of foreground vertices in Fi
W Size of running window for computing framerate
THvar Variance threshold (detailing parameter)
THhfr, TH
lfr Upper/lower limit of normal frame rate range
DRa(Fi) Actual degradation ratio of CZLoD in Fi
DRt(Fi) Target degradation ratio of CZLoD in Fi
N0(Fi) CZLoD of Fi when THvar = 0
Nv(Fi) CZLoD of Fi when THvar = v
F Mapping function from DRt to THvar
err(Fi) = |DRa(Fi)�DRt(Fi)|, error of degradationratio
THerr Threshold of err to trigger variance learning
�u,�d Decrease and increase sizes for DRt adjust-ment
Table 1: Notations.
the mesh. It also determines the density/accuracy of tele-immersive video due to the disparate treatment of verticesand non-vertices in 3D reconstruction and texture mapping.Hence, we refer to this metric as the Color-plus-Depth Level-of-Detail (CZLoD) metric, which characterizes the spatial(including z-axial) and textural richness and accuracy ofpolygon-based tele-immersive video. Clearly, it is largely im-pacted by the setting of the variance threshold THvar(2 Z).The smaller the variance threshold is, the finer the mesh-ing is, and the more dense/accurate the depth and texturemaps will be. Therefore, the variance threshold THvar is adetailing parameter for the CZLoD of tele-immersive video.
We are concerned about whether there are perceptual lim-its on the degradation of CZLoD for the purpose of datareduction. We thus mathematically formulate the metric ofdegradation ratio (DR). Suppose we denote the 2D referenceframe as fi (i is frame number), and the 3D frame generatedfrom it as Fi. Assume N0(Fi) 2 N0 is the number of fore-ground vertices computed on fi if THvar were set to 0, andNv(Fi) 2 N0 is the number of foreground vertices computedon fi if THvar were set to v (v >= 0), the degradation ratioof CZLoD on the frame Fi can then be expressed as
DR(Fi) = 1� Nv(Fi)N0(Fi)
(1)
where 0 DR(Fi) < 1. For convenience, Table 7 lists allthe notations used throughout the paper.
Obviously, the lower the degradation ratio, the more ver-tices the frame Fi will contain, resulting in higher defini-tion and accuracy in both texture and depth, and leadingto sharper and more stereoscopic images (depending on per-ceptual mechanisms).
3.3 Stimulus Generation EngineWhile 2D video quality studies can utilize a pool of 2D
video sequences o↵ered by the Video Quality Expert Group(VQEG) [32], there are no standard test data for tele-immersive
15

video. Since 3D tele-immersion is essentially a live pipelinefrom cameras to renderers, a naıve way of obtaining testsequences would be to record di↵erent test sequences mul-tiple times with di↵erent configurations of treatment factors(which refer to the sources of variation that are of partic-ular interest to the experimenter [19]). However, this ap-proach not only requires a large amount of e↵ort but also suf-fers from uncontrollable varying conditions such as capturedcontent and illuminance. Therefore, we propose a stimulusgeneration engine suitable for general tele-immersive videostudies. To ensure the treatment factors are only variedwithin homogeneous blocks [19], we decouple the capturingfrom the 3D reconstruction so that di↵erent configurationscan be applied during each phase, even on the exact imagesamples if desired.
Figure 2 depicts the three distinct stages of the engine. InStage 1, a number of frames of the experiment’s activitiesare synchronously captured, preprocessed, and stored. Nu-merous parameters can be configured at this stage, includingthe desired pixel resolution, whether to use rectification orbackground subtraction, the number of frames to take, etc.To generate lower pixel resolution images, the raw framescan be downscaled. In Stage 2, the engine retrieves thespecified 2D frames and repeatedly performs 3D reconstruc-tion with varying parameters such as the variance thresholdTHvar, whether to use trinocular or binocular stereo match-ing, etc. The host computers then send their reconstructedframes to a renderer that aggregates the frames and writesthem to disk storage. In the final stage, the 3D frames arereplayed as stimuli with possibly varying parameters suchas frame rate. In short, the systematic decomposition al-lows automatic generation of stimuli with the flexibility ofcontrolling desired treatment factors, while keeping blockingand nuisance factors (e.g., content) fixated [19].
Parametrized
Capture &
Preprocessing
Parametrized 3D
Reconstruction
& Rendering
Parametrized
Recording &
Replay
DiskStore: 3D
frames
Stage 1 Stage 2 Stage 3
Store:
video clips
Store: 2D
frames Disk Disk
Figure 2: Stimulus generation engine: in Stage 1, 2D
frames are taken, preprocessed, and stored; in Stage 2,
3D reconstruction is repeatedly applied with varied pa-
rameters; in Stage 3, the stored 3D frames are replayed
with parameterization to generate the final stimuli.
4. PSYCHOPHYSICAL EXPERIMENTThe purpose of the psychophysical experiment is to mea-
sure two perceptual thresholds of CZLoD degradation: (a)Just Noticeable Degradation (JNDG), and (b) Just Unac-ceptable Degradation (JUADG). Identification of these thresh-olds can guide us to develop perception-based CZLoD adap-tation mechanism for resource saving without impairing theperceived visual quality. We employed the Ascending Methodof Limits [8] as the experimental methodology. It is one ofthe oldest and most widely used approaches in psychophysicsfor determining thresholds of sensations. The methodol-ogy, originally designed to measure singular intensity such
Gross Motor Fine Motor
Low Res. 320x240 Exercise-L Lego-L
High Res. 640x480 Exercise-H Lego-H
Table 2: Stimulus block codes
as light luminance and sound frequency, was slightly modi-fied in order to measure degradation level by means of com-parison. In our study, CZLoD conditions were presented insequential pairs, one being an unimpaired reference, and onebeing the same video impaired. The magnitudes of impair-ment were presented in an ascending order.
4.1 StimuliWith the experimental methodology in mind, we gener-
ated forty stimuli. Below we discuss their conditions, prop-erties, and resource characteristics.
There are two factors that may impact the perception ofCZLoD impairment: sequence content and pixel resolutionof raw frames (called “blocking factors”). To explore theirrelationship with the treatment factor CZLoD, we created2 (contents) ⇥ 2 (pixel resolutions) groups (called “blocks”)of stimuli, each having a di↵erent configuration of block-ing factors. For the first factor (content), we categorizedthe most frequent tele-immersive activities into two typesand recorded a representative video for each type: (a) gross-motor activities such as Tai-Chi training, dancing, and phys-ical rehabilitation that involve large body movement; and(b) fine motor activities such as telemedicine, cyberarcheol-ogy, object/tool instructions that involve finer body move-ment (e.g., on hands), and manipulation of objects. Forthe former type, we recorded a person (performer) doingan elbow exercise (commonly used in telepresence physicaltherapies), while for the latter type, we recorded the per-former showing a small Lego house where details were notonly more demanding for the object but also for the fingermovement of the performer. For the second blocking factor(pixel resolution), we chose two levels that had been mostlyused in tele-immersive systems [28][31]: (a) high - 640⇥480,and (b) low - 320⇥240. The four stimulus blocks were codedas in Table 2.
The stimulus generation engine (Figure 2) was then em-ployed to generate 10 levels of stimuli in each block. In thefirst stage, the Dragonfly2 stereo camera (Point Grey Inc.)was employed for recording the 2D images for each of thefour block conditions. After 2D frames were acquired, 3Dframes were generated for each block by repeatedly runningbinocular stereo matching on the same stored images withvaried THvar for obtaining di↵erent CZLoD degradation set-tings. Finally, the 3D color-plus-depth frames were renderedwith a fixed frame rate 10 fps (chosen according to [16]) forthe subjects. Following the ITU-R BT.500 standard [13],each test sequence was 10 seconds long, so about 100 frameswere included.
The 10 stimuli for each block were coded as S0, S1, ...S9
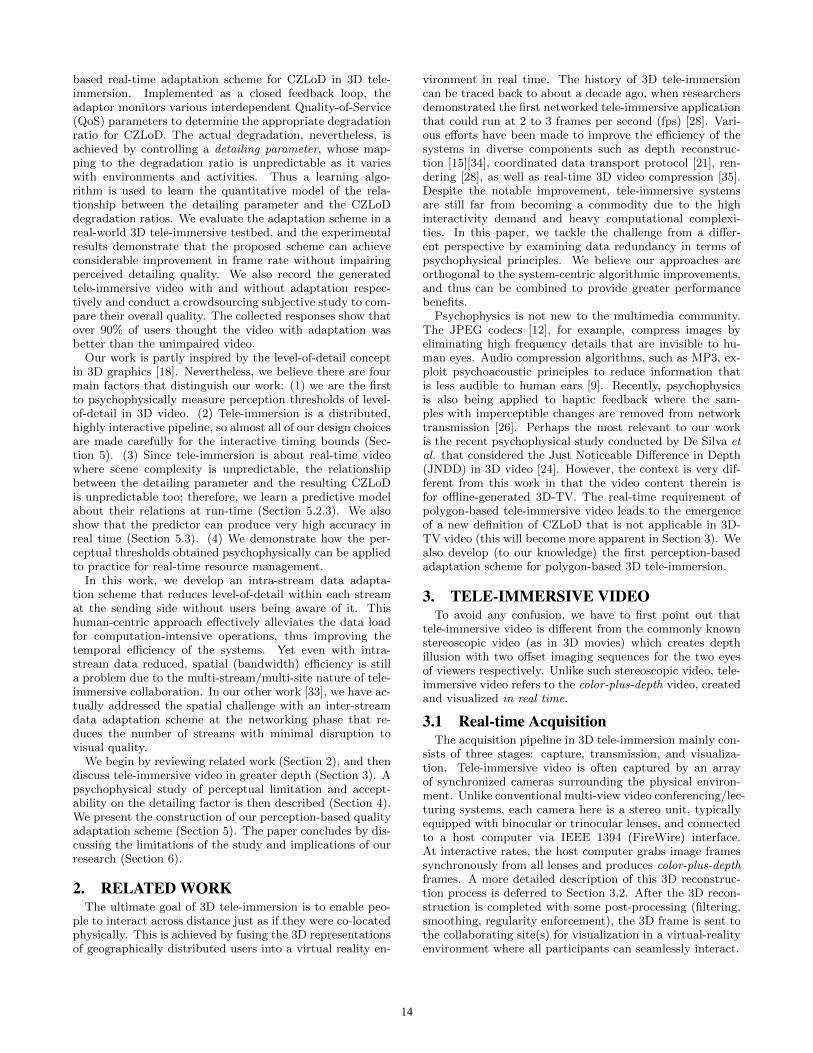
with increasing levels of degradation ratio in CZLoD (Fig-ure 3(a)), with an approximate step size of 10% (degradationratio). Figure 4 shows the snapshots of the lowest and high-est stimulus conditions for each block. For each stimulus,the degradation ratio was calculated by averaging across allframes (relative standard deviation measured to be 2.08% -2.83% for all stimuli). Therein, S0 was the unimpaired ref-erence stimulus (THvar = 0). The THvar values for other
16

0 0.1 0.2 0.3 0.4 0.5 0.6 0.7 0.8 0.9
1
S0 S1 S2 S3 S4 S5 S6 S7 S8 S9
De
gra
da
tion
Ra
tio
Stimuli
Exercise-LExercise-H
Lego-LLego-H
(a)
0
5
10
15
20
25
30
S0 S1 S2 S3 S4 S5 S6 S7 S8 S9
Nu
mb
er
of
Ve
rtic
es
(K)
Stimuli
Exercise-L #vExercise-H #v
Lego-L #vLego-H #v
(b)
Figure 3: Stimulus statistics: (a) the degradation ratios
gradually increase with the stimulus levels, (b) the actual
numbers of vertices (#v).
stimuli were manually chosen to approximately achieve theexpected degradation ratio (it was impossible to be exact).Two sets of THvar values were used, one for the lower pixelresolution blocks (Exercise-L/Lego-L), and the other for thehigher resolution blocks (Exercise-H/Lego-H). Figure 3(b)presents the actual number of vertices after the meshingprocess.
4.2 Participants and ProceduresWe followed the ITU standard in conducting the exper-
iment [13]. Sixteen adult participants were recruited fromUniversity of Illinois at Urbana-Champaign, primarily grad-uate students and sta↵ in the Department of Computer Sci-ence1. All had normal or corrected vision. Four partici-pants were Indian, three were American, two were Chinese,two were German, three were Bangladeshi, one was Mexi-can, and one was South African. The sample consisted of 6women (37.5%) and 10 men (62.5%). Regarding the level ofexperience with tele-immersive video, the sample consistedof 5 experts (31.25%) and 11 novices (68.75%).
S0
10 s
S1
10 s 2 s 10 s 2 s 10 s
S0 S2
Black Black
~10 s
Voting Voting
...
S0
2 s 10 s
S9
Black
~10 s
VotingStart Stop
10 s~10 s
Figure 5: Experimental procedure: sequential {unim-
paired, impaired} pairs of stimuli were shown, with as-
cending degradation ratios. Each stimulus was 10-sec
long, the interval showing a black screen was 2-sec long
within pair, and the voting period between pairs was
about 10-sec long [13].
The sequence of blocks presented was: Exercise-L, Exercise-H, Lego-L, and Lego-H. Figure 5 shows the experimentalprocess (adapted from [13]) within each block. Pairs of stim-uli were presented automatically using a script with the as-cending levels of degradation. For each pair, the first videowas the unimpaired reference video, shown to mitigate mem-ory e↵ect [22], and the second video was the impaired one.In between the pair, there was a 2-second interval with blackscreen [13]. The voting period after each pair was about 10seconds long, when the observer was asked if he/she couldtell any di↵erence between the two clips, and whether he/shethought any video had unacceptable quality. The subjects
1The exact age distribution is unknown because some sub-jects expressed unwillingness to disclose age.
were told that they could take a break at any time duringthe experiment.
4.3 ApparatusThe experiment was conducted in the MONET (Multi-
media Operating and Networking) laboratory at the Uni-versity of Illinois at Urbana-Champaign. Participants wereasked to be seated in front of a LCD monitor during theexperiment with a standard viewing distance [13]. The de-tailed specification of the monitor used is listed in Table 3.3D displays were available but not used mainly for usabilityconcerns. Despite their rapid growth, today’s state-of-the-art 3D displays are not yet ready to be deployed for tele-immersive activities. For example, typical stereoscopic dis-plays require observers to wear goggles to perceive the depthe↵ect, which is intrusive and thus unsuitable for physicalactivities often conducted in tele-immersive environments.The new autostereoscopic displays eliminate the need forwearing glasses; however our previous experience with themindicates that the technology was far from mature as theycaused considerable discomfort for viewers. Lambooij et al.gave a general review of the visual discomfort caused bystereoscopic and autostereoscopic displays [17]. Therefore,in this experiment we resorted to using conventional displaysfor visualization. However, it is still worth noting that 3Ddisplays are only designed to hypothetically improve depthperception [14], not to enable it. In fact, depth perceptionis achieved by a variety of visual cues (such as shading, tex-ture gradient, linear perspective, motion parallax, occlusion,etc.) that are still relevant in tele-immersive video regard-less of the type of display used [10]. We chose to trade thepossible increase of depth perception for the visual comfortof users, which was believed to be more important.
Table 3: Detailed specification of the monitor used.
LCD Monitor Model Acer X222W
Dimensions (WxDxH) 51.4 cm x 20.4 cm x 41.8 cm
Resolution 1680 x 1050 / 60 Hz
Dot Pitch 0.282 mm
Response Time 5 ms
Brightness 300 cd/m2
4.4 Evaluation ResultsIn psychophysics, perceptual thresholds are defined to be
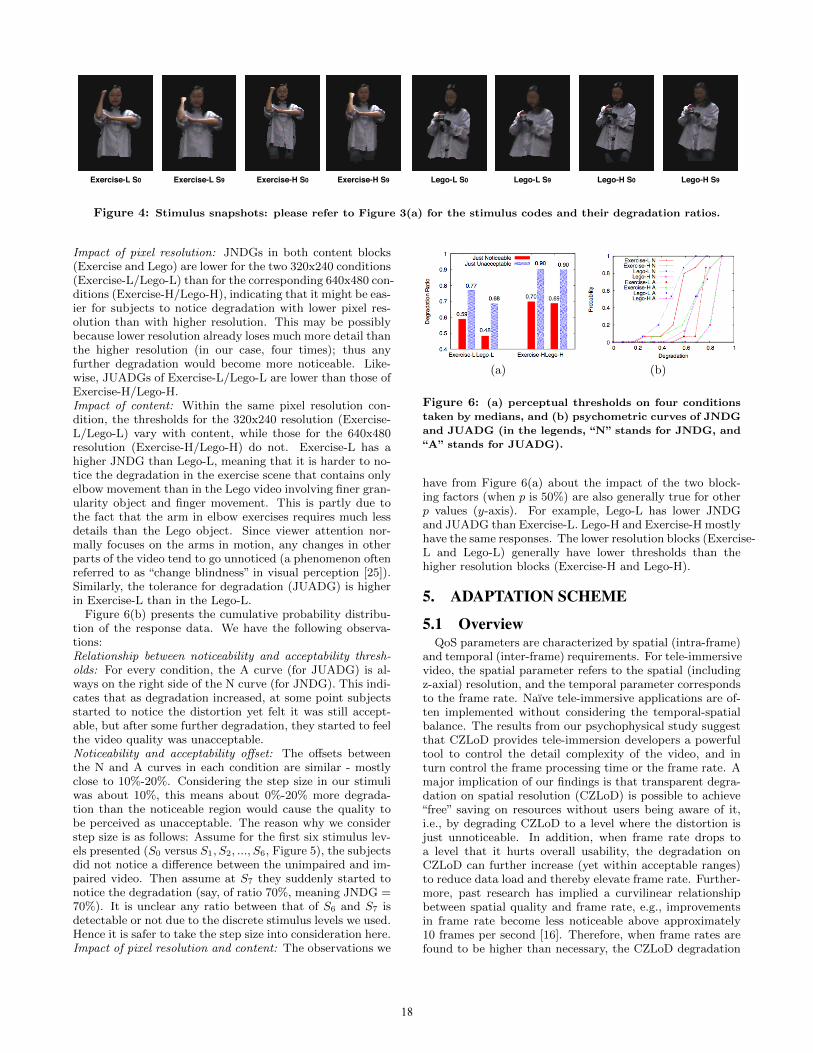
the stimulus intensities (in our case, CZLoD degradation ra-tios) that can be detected/accepted some p portion of thetime, with p = 50% often used [8]. Figure 6(a) shows themeasured JNDG and JUADG thresholds in four blockingconditions using probability 50% (equivalent to taking me-dians in the data). There are several observations:Existence of perceptual thresholds: There do exist percep-tual thresholds on the magnitude of CZLoD degradationthat viewers can detect and accept. The average JNDGacross all conditions is 61.5%, suggesting that degradationbelow 61.5% is not noticeable to average users. This impliesthat we can transparently reduce a considerable amount ofresource usage by degrading CZLoD without actually im-pairing the perceived quality. The existence of JUADG (av-erage 81.25%) indicates the degradation should be boundedby this upper limit otherwise it might make the overall qual-ity unacceptable.
17
Exercise-L S0 Exercise-L S9 Exercise-H S9Exercise-H S0 Lego-L S0 Lego-L S9 Lego-H S0 Lego-H S9
Figure 4: Stimulus snapshots: please refer to Figure 3(a) for the stimulus codes and their degradation ratios.
Impact of pixel resolution: JNDGs in both content blocks(Exercise and Lego) are lower for the two 320x240 conditions(Exercise-L/Lego-L) than for the corresponding 640x480 con-ditions (Exercise-H/Lego-H), indicating that it might be eas-ier for subjects to notice degradation with lower pixel res-olution than with higher resolution. This may be possiblybecause lower resolution already loses much more detail thanthe higher resolution (in our case, four times); thus anyfurther degradation would become more noticeable. Like-wise, JUADGs of Exercise-L/Lego-L are lower than those ofExercise-H/Lego-H.Impact of content: Within the same pixel resolution con-dition, the thresholds for the 320x240 resolution (Exercise-L/Lego-L) vary with content, while those for the 640x480resolution (Exercise-H/Lego-H) do not. Exercise-L has ahigher JNDG than Lego-L, meaning that it is harder to no-tice the degradation in the exercise scene that contains onlyelbow movement than in the Lego video involving finer gran-ularity object and finger movement. This is partly due tothe fact that the arm in elbow exercises requires much lessdetails than the Lego object. Since viewer attention nor-mally focuses on the arms in motion, any changes in otherparts of the video tend to go unnoticed (a phenomenon oftenreferred to as “change blindness” in visual perception [25]).Similarly, the tolerance for degradation (JUADG) is higherin Exercise-L than in the Lego-L.
Figure 6(b) presents the cumulative probability distribu-tion of the response data. We have the following observa-tions:Relationship between noticeability and acceptability thresh-olds: For every condition, the A curve (for JUADG) is al-ways on the right side of the N curve (for JNDG). This indi-cates that as degradation increased, at some point subjectsstarted to notice the distortion yet felt it was still accept-able, but after some further degradation, they started to feelthe video quality was unacceptable.Noticeability and acceptability o↵set: The o↵sets betweenthe N and A curves in each condition are similar - mostlyclose to 10%-20%. Considering the step size in our stimuliwas about 10%, this means about 0%-20% more degrada-tion than the noticeable region would cause the quality tobe perceived as unacceptable. The reason why we considerstep size is as follows: Assume for the first six stimulus lev-els presented (S0 versus S1, S2, ..., S6, Figure 5), the subjectsdid not notice a di↵erence between the unimpaired and im-paired video. Then assume at S7 they suddenly started tonotice the degradation (say, of ratio 70%, meaning JNDG =70%). It is unclear any ratio between that of S6 and S7 isdetectable or not due to the discrete stimulus levels we used.Hence it is safer to take the step size into consideration here.Impact of pixel resolution and content: The observations we
(a) (b)
Figure 6: (a) perceptual thresholds on four conditions
taken by medians, and (b) psychometric curves of JNDG
and JUADG (in the legends, “N” stands for JNDG, and
“A” stands for JUADG).
have from Figure 6(a) about the impact of the two block-ing factors (when p is 50%) are also generally true for otherp values (y-axis). For example, Lego-L has lower JNDGand JUADG than Exercise-L. Lego-H and Exercise-H mostlyhave the same responses. The lower resolution blocks (Exercise-L and Lego-L) generally have lower thresholds than thehigher resolution blocks (Exercise-H and Lego-H).
5. ADAPTATION SCHEME
5.1 OverviewQoS parameters are characterized by spatial (intra-frame)
and temporal (inter-frame) requirements. For tele-immersivevideo, the spatial parameter refers to the spatial (includingz-axial) resolution, and the temporal parameter correspondsto the frame rate. Naıve tele-immersive applications are of-ten implemented without considering the temporal-spatialbalance. The results from our psychophysical study suggestthat CZLoD provides tele-immersion developers a powerfultool to control the detail complexity of the video, and inturn control the frame processing time or the frame rate. Amajor implication of our findings is that transparent degra-dation on spatial resolution (CZLoD) is possible to achieve“free” saving on resources without users being aware of it,i.e., by degrading CZLoD to a level where the distortion isjust unnoticeable. In addition, when frame rate drops toa level that it hurts overall usability, the degradation onCZLoD can further increase (yet within acceptable ranges)to reduce data load and thereby elevate frame rate. Further-more, past research has implied a curvilinear relationshipbetween spatial quality and frame rate, e.g., improvementsin frame rate become less noticeable above approximately10 frames per second [16]. Therefore, when frame rates arefound to be higher than necessary, the CZLoD degradation
18

ratio can be lessened (if possible) to recover or promote thedetailing quality thereby reducing frame rate. In short, wecan manipulate the CZLoD degradation ratio to achieve abalance between the temporal quality (frame rate) and thespatial quality (CZLoD).
Based on these principles, we propose a novel, human-centric, real-time adaptation scheme (at the sender side) fortele-immersive video. We design the adaptor as a closedfeedback loop [4] for the control of detailing quality in tele-immersive video. Figure 7 illustrates the schematic processof the adaptation. It has three major components: QoSMonitor, Decision Engine, and Variance Calculator. QoSMonitor is responsible for collecting and analyzing time se-ries of QoS parameters (e.g., frame processing time, framesize, reconstruction time), and extracting meaningful infor-mation online to notify Decision Engine for triggering adap-tation. Decision Engine computes an appropriate targetCZLoD degradation ratio for the 3D reconstruction pro-cess. Since the degradation ratio is actually controlled bymanipulating the variance threshold (Section 3.2), a Vari-ance Calculator component is used to compute the correctvariance threshold given a target degradation ratio from De-cision Engine. Yet a challenge is that the mapping from adesired CZLoD degradation ratio to a variance threshold isunpredictable due to its dependency on scenes (e.g., cloth-ing texture, skin colors, presence of objects, lighting illumi-nance). Therefore, Variance Calculator dynamically learnsa quantitative model between the CZLoD degradation ra-tio and the appropriate variance threshold. Based on themodel, it computes the proper variance threshold given atarget degradation ratio, and feeds it into the 3D recon-struction pipeline for video quality adaptation.
Variance
Calculator
QoS Monitor
3D
Reconstruction
2D Capture/
Preprocessing
Decision Engine
[Measure] Actual Absolute
CZLoD, Reconstruction
TIme, Processing Time,
Frame Size
Abnormal Frame Rate,
Actual DR
Target DR, DR Error
[Decis
ion] V
ariance T
hreshold
Data Flow
Control Flow
Reference Frame (for computing actual DR)
2D
Fra
mes
3D
Fra
me
Reference Frame (for quantization learning)
Figure 7: Adaptation scheme overview: refer to Sec-
tion 5.1. DR stands for Degradation Ratio.
5.2 Design and Implementation
5.2.1 QoS Monitor
Various CZLoD-related QoS parameters are inter-dependentin tele-immersion. Figure 8 depicts the most relevant param-eters and their dependencies identified using the Granger-causality graphs [23] over profile data. QoS Monitor con-tinuously collects time-series meta-data of these parameters
Reconstruction
Time
Color-plus-
Depth Level-
of-Detail
Variance
ThresholdFrame Size
Frame Rate
Figure 8: Dependency graph of parameters.
for each frame, and performs online analysis and profiling.It then provides “feedback” to Decision Engine. The feed-back includes two types: (a) frame rate events (excessivelyhigh or low) for triggering increase or decrease of the degra-dation ratio, and (b) actual degradation ratio DRa(Fi) ofevery frame Fi.
Since providing real-time feedback in the control loop iskey, a simple yet e�cient range checking approach is used forevaluating frame rate. Essentially, if the frame rate drops be-low a lower-limit threshold (TH l
fr), Decision Engine is noti-fied to increase degradation ratio (for lower CZLoD quality);if the frame rate increases beyond an upper-limit threshold(THh
fr), Decision Engine is notified to decrease degradationratio (for higher CZLoD quality). The thresholds should beset according to the perceptual characteristics of the framerate [16]. Compared to the single threshold method whereTHl
fr = THhfr, range thresholding is important for avoid-
ing the flickering e↵ect that can occur when a parameterconstantly switches between low and high levels as it hov-ers near the threshold. For the same reason, the frame rateis not computed on a per frame basis, but averaged over arunning window of size W (frames).
Apart from the frame rate reports, QoS Monitor alsoevaluates the actual degradation ratio of each frame Fi,DRa(Fi), and reports it to Decision Engine for taking cor-rective measure. DRa(Fi) needs to be measured because thesequence complexity and resource condition are constantlychanging, meaning it is possible that a target degradationratio would not be achieved exactly as desired. It is worthpointing out that the precise computation of DRa(Fi) re-quires the original 2D frame fi be reconstructed by settingTHvar = 0 (refer to Equation 1). To facilitate the computa-tion, the 2D capture/preprocessing component of the live 3Dtele-immersion pipeline periodically sends a reference framefr to QoS Monitor, on which it applies 3D reconstructionwith THvar = 0 and computes the reference CZLoD ex-pressed as N0(Fr) (Section 3). Since this is a relativelyexpensive operation, it is only periodically performed. Webelieve this is reasonable considering that performer motioncannot change dramatically within a short period of time;i.e., N0(Fr) would be very close to N0(Fi) due to their tem-poral proximity2. Using the latest available N0(Fr) to ap-proximate N0(Fi), QoS Monitor can then compute DRa(Fi)(Equation 1) and report it to Decision Engine.
5.2.2 Decision Engine
The foundation of the adaptation logic in Decision Engineis based on the perceptual thresholds (JNDG and JUADG)on the color-plus-depth spatial resolution of the video. Thethresholds decompose the CZLoD quality of tele-immersive
2In this approximated computation, an out-of-range result(i.e., DRa(Fi) > 1) is theoretically possible, but very un-likely. If it does occur, DRa(Fi) is corrected to 1.
19

White Zone Gray Zone Black ZoneDegradation
Increasing
Unnoticeable Unacceptable
JNDG JUADGAdaptation Zone
Margin Margin
Figure 9: The Just Noticeable (JNDG) and Just Un-
acceptable (JUADG) thresholds decompose the range of
CZLoD degradation to three zones.
video into three zones: white zone, where distortion is min-imally noticeable; gray zone, where the distortion gradu-ally becomes noticeable yet still acceptable; and black zone,where the degradation is unacceptable. The basic idea ofDecision Engine is to dynamically adjust the target degra-dation ratio primarily in the gray zone, with some mar-gins (Figure 9). The margins are introduced to accountfor the step size in our psychophysical experiment (as dis-cussed in Section 4.4) as well as environmental and userdynamics. Hence, if we denote the margin size as Bn andBa (0 Bn, Ba 1) for noticeability and acceptabilitythresholds respectively, the adaptation zone can be definedas [JNDG � Bn, JUADG � Ba] in terms of degradationratio.
As mentioned above, Decision Engine receives two typesof information from QoS Monitor: (a) abnormal frame rate,and (b) DRa of every frame. Upon receiving alarms of ab-normal frame rate, Decision Engine computes an appropri-ate target degradation ratio. For this purpose, a linear con-trol mechanism is used. Basically, an abnormally low framerate (FRi < THl
fr) means the need for lower CZLoD qual-ity (or higher degradation ratio). Thus the engine computesthe target degradation ratio as DRt(Fi) = DRa(Fi�1)+�d
where DRt(Fi) denotes the target degradation ratio (greaterDR means more degradation), DRa(Fi�1) denotes the ac-tual degradation ratio of the last frame Fi�1 (reported byQoS Monitor), and� d denotes the adjustment size for in-creasing DR. This ratio is then used for all frames untilthe next time adaptation is triggered. Similarly, an un-necessarily high frame rate (FRi > THh
fr) triggers the en-gine to produce a desired degradation ratio as DRt(Fi) =DRa(Fi�1) � �u where� u is the adjustment size for de-creasing DR.
The settings of� d and� u can follow various protocols,e.g., AIMD (Addictive Increase Multiplicative Decrease), orproportional to frame rate deviation from normal mean. Al-though much more complicated or aggressive changes mayresult in faster reaction time, they may also incur more over-head or abrupt changes in the detailing resolution of thevideo. We find that simple constant small sizes are su�-ciently e↵ective in responding to frame rate anomalies whilemaintaining a gradual and graceful change that is less notice-able. Further, simple models provide superior performancebenefits that are critical in such real-time environments. Weutilize the measured thresholds from Section 4 to guide theadaptation zone (Figure 9). When the frame rate is ex-cessively low (i.e., to increase DR), if DRt(Fi) reaches theupper limit of the adaptation zone (close to the black zonein Figure 9),� d is set to 0; i.e., no further degradation isallowed otherwise the quality would become unacceptable.Likewise, when the frame rate is excessively high (i.e., to de-
crease DR), if DRt(Fi) reaches the lower limit of the adap-tation zone (close to white zone),� u is set to 0; i.e., furtherimprovement on the detailing quality would not be notice-able anyway thus is unnecessary. Besides the calculation ofthe target degradation ratio, Decision Engine also computesthe adaptation error between the actual and target degrada-tion which will be used for Variance Calculator (as explainedbelow).
5.2.3 Variance Calculator
Given the target CZLoD degradation ratio DRt, VarianceCalculator is responsible for determining the proper valuefor the detailing parameter THvar in the 3D reconstruction.However, the mapping F from DRt to THvar is nontriv-ial because it highly depends on external conditions suchas scene complexities. Therefore, we dynamically learn aquantitative model in order to predict the correct THvar
value for a desired DRt. The learning process is performedonly when Decision Engine finds that the adaptation errorerr = |DRa(Fi) � DRt(Fi)| is larger than some thresholderr > THerr, meaning that significant changes in scenesmight have happened that make the previous model less ap-plicable. To learn a new model, Variance Calculator repeat-edly applies 3D reconstruction on the frame fi with exponen-tially increasing THvar values, and the resultant DRa(Fi)values are logged. This process runs in parallel with theactual 3D tele-immersion pipeline and is thus unobtrusive.The THvar values and their resultant DRa(Fi) values arethen fed into a least-square regression module to develop anexponential model as follows [6]:
F : THvar = ea·DRt+b (2)
where e is the Euler number, and a and b are constants. Thechoice of the above exponential model comes from our ex-tensive curve-fitting experiments with TI video, where theirrelationships are all a form of Equation 2. With this sim-ple model we are able to achieve a high accuracy (medianresidual of 0.022%) with as few as 10 training points (referto Section 5.3). With the model available, Variance Calcu-lator is then able to set a proper variance threshold after2D preprocessing and before 3D reconstruction for a desireddegradation ratio.
5.3 Performance EvaluationWe evaluated the adaptation scheme in a real-world 3D
tele-immersive system. The Bumblebee2 stereo camera (PointGrey Inc.) was used. It was connected to a host com-puter (Intel Xeon quad-core CPU 2.8GHz and 2GB RAM)via an IEEE 1394b card. The pixel resolution used was320x240. Two professional lamps (Brightline SeriesONE)were employed to produce soft and di↵used lighting con-dition. The rendering machine had an Intel Xeon CPU2.3GHz, 2GB RAM, and an NVIDIA GeForce 9800 graph-ics card. The scene was an experimenter performing armexercises in front of the camera. We compared two condi-tions — with and without adaptation, using the same ex-perimental setup. Both objective and subjective measure-ments were collected. The technical metrics such as framerate, frame size, target and actual degradation ratios werelogged, and the rendered video was recorded on the ren-derer for subjective evaluation. Settings for the algorithmicparameters were: W = 5, THl
fr = 8, THhfr = 12, Bn =
20

-3 -2 -1 0 +1 +2 +3
Much Worse Slightly The Slightly Better Much
Worse Worse Same Better Better
Table 4: Rating scale used to compare videos with and
without adaptation.
Ba = 10%, JNDG = 59%, JUADG = 77%,�u = �d = 5%(Table 1).
Figure 10(a) shows the frame rate comparison. In thiscase, the adaptation scheme achieved an average of 27% im-provement on frame rate from about 8 fps to 10 fps. Accord-ing to [16], any improvement below a frame rate of 10 fps isconsiderably noticeable to users. It is also worth noting thateven with the adaptation mechanisms added, the frame rateimproves and real-time performance is guaranteed, meaningthat the overhead of our algorithms is minimal. We alsocompared the frame rate with some CPU stress. For this, aprocess was run together with 3D tele-immersion that tookat peak 16% of the CPU load. This simulates conditionswhere the CPU is less powerful or higher pixel resolution isconfigured. As Figure 10(b) shows, the frame rates withoutadaptation dropped to about 6-7 fps with several suddendips to 3 fps. On the other hand, the frame rates achievedwith adaptation (with the same conditions) remained rela-tively stable around 9 fps (with average improvement being39.6%). Figure 10(c) shows the actual degradation ratiosused with the projected target ratios. The prediction ac-curacy was high, with a median residual of 0.022%. Theaverage degraded ratio was 22.7%, with a standard devia-tion of 0.063%. Considering that the JNDG is around 60%(Figure 6), there was still room for much more reduction ifthe frame rates were below desired thresholds.
We also conducted a user study to compare the visualquality of the recorded video. The crowdsourcing method-ology was used due to the simplicity of the experiment. Fol-lowing the ITU standard for double stimuli video compar-ison study [13], we made a short video with the followingstructure (in sequential order): (a) five seconds of text il-lustrating the purpose of the study, (b) two seconds of textindicating “Video 1” to be shown, (c) ten seconds of Video1, (d) two seconds of text indicating “Video 2” to be shown,and (e) ten seconds of Video 2, and (f) ten seconds of textasking the rating question: “Compared to Video 1’s qual-ity, Video 2’s quality is: [the scale shown in Table 4]?” [13].The video was uploaded to Youtube and was advertised toa mailing list (containing graduate students, sta↵, and pro-fessors in Department of Computer Science). The rankingdata were collected anonymously through an online GoogleDoc Form. A total of 81 responses were collected. Three ofthem were discarded because respondents notified the exper-imenter that they submitted by mistake. Figure 10(d) showsthe collected ratings. Among the 78 responses, 96.2% of theusers thought the video with adaptation turned on was bet-ter quality than the video with adaptation turned o↵, and3.8% thought they were the same. 12.8% (of total) gavea “(+1) Slightly Better” ranking, 51.3% gave a “(+2) Bet-ter” ranking, and 32.1% gave a “(+3) Much Better” ranking.Clearly, our adaptation scheme not only saves system re-sources (i.e., CPU load), but also improves subjective videoquality.
6. CONCLUDING REMARKSThis paper identifies a new critical quality factor called
Color-plus-Depth Level-of-Detail (CZLoD) in 3D tele-immersivevideo. A psychophysical study of the perceptual thresh-olds of CZLoD is performed and presence of two percep-tual thresholds - Just Noticeable Degradation (JNDG) andJust Unacceptable Degradation (JUADG) is demonstrated.Taking CZLoD as a guiding parameter, we design an onlinehuman-centric QoS adaptation scheme to dynamically adaptthe video quality. Our experiments show that the adaptationscheme considerably reduces the resource demands while en-hancing the perceived visual quality.
Future Work. Currently, N0 is only periodically eval-uated in our adaptation scheme (Section 5.2.1); we will in-vestigate real-time statistical approaches for predicting N0.Also, we employ a simple constant adaptation model for ad-justing degradation ratio due to its e�ciency (Section 5.2.2),but complex models are worth investigating. As hardwareadvances, it is possible that the increasing number of corescould run more complex models with demanded time bounds.Further, we measure the perception thresholds on 2D dis-play, and we will perform the study on 3D displays as theymature. Finally, as we have stated previously, we only con-sider the temporal challenge in this work and address thespatial challenge in our previous work [33]. In future work,we will study their seamless integration.
Discussion. Subjective video quality research su↵ers fromthe limitation that the results might vary with the sequencecontent, and this study is no exception. While we attemptto be representative in choosing the tele-immersive activi-ties for the psychophysical study, we do not intend to drawany general conclusion about the specific values of JNDGand JUADG in all tele-immersive applications. Rather, themain contribution of our study is the identification of the ex-istence of perceptual thresholds on a unique factor that has(to our best knowledge) never been explored in real-timecolor-plus-depth video. The measurements of the thresh-olds provide practical guidelines on their estimation in thefield. We also demonstrate that by applying these thresholdsto practice, we can adapt the detailing quality and achieveconsiderable resource saving as well as enhancement on theperceived video quality.
7. REFERENCES[1] Cisco TelePresence,
http://www.cisco.com/en/us/products/ps7060/index.html.[2] Polycom Telepresence,
http://www.polycom.com/telepresence.[3] R. Apteker, J. Fisher, V. Kisimov, and H. Neishlos.
Video acceptability and frame rate. IEEE Multimedia,2(3):32–40, 1995.
[4] K. J. Astrom and R. M. Murray. Feedback Systems:An Introduction for Scientists and Engineers.Princeton University Press, 2008.
[5] H. H. Baker, N. Bhatti, D. Tanguay, I. Sobel, D. Gelb,M. E. Goss, W. B. Culbertson, and T. Malzbender.Understanding performance in Coliseum, animmersive videoconferencing system. ACMTOMCCAP, 1(2):190–210, 2005.
[6] A. BjAorc. Numerical Methods for Least SquaresProblems. SIAM, 1996.
[7] Y.-C. Chang, T. Carney, S. A. Klein, D. G.
21

5
6
7
8
9
10
11
0 50 100 150 200
Fra
me
Ra
te (
FP
S)
Time
Without adaptationWith adaptation
(a)
3 4 5 6 7 8 9
10 11
0 50 100 150 200
Fra
me
Ra
te (
FP
S)
Time
Without adaptationWith adaptation
(b)
0
0.2
0.4
0.6
0.8
1
0 50 100 150 200
De
gra
da
tion
Ra
tio
Time
Actual DRsTarget DRs
(c) (d)
Figure 10: Adaptation performance: (a) the frame rates with and without adaptation where the CPU has no additional
load other than tele-immersion, (b) the same comparison with a 16% CPU stress, (c) the degradation ratios (DRs) are
well below the just noticeable threshold, with high prediction rate regarding variance threshold, and (d) the subjective
evaluation results comparing the quality of the adapted video against the unimpaired video.
Messerschmitt, and A. Zakhor. E↵ects of temporaljitter on video quality: Assessment usingpsychophysical methods. In Proc. of SPIE HVIP’98,1998.
[8] G. Gescheider. Psychophysics: The Fundamentals.Psychology Press, 3rd edition, 1997.
[9] S. Hacker. MP3: The Definitive Guide. O’Reilly, 1stedition, 2000.
[10] I. Howard. Seeing in Depth. Volume 2: DepthPerception. I Porteous, 2002.
[11] S. Iai, T. Kurita, and N. Kitawaki. Qualityrequirements for multimedia communication servicesand terminals - interaction of speech and video delays.In Proc. of GLOBECOM ’93, 1993.
[12] ITU. Information technology - digital compression andcoding of continuous-tone still images - requirementsand guidelines. In Rec. T.81, 1992.
[13] ITU. Methodology for the subjective assessment of thequality of television pictures. In Rec. BT.500, 2009.
[14] Z. X. Jin, Y. J. Zhang, X. Wang, and T. Plocher.Evaluating the usability of an auto-stereoscopicdisplay. Proc. of HCI’07, pages 605–614, 2007.
[15] T. Kanade, P. Rander, and P. Narayanan. Virtualizedreality: Constructing virtual worlds from real scenes.IEEE MultiMedia, 4(1):43–54, 1997.
[16] J. K. Kies. Empirical methods for evaluatingvideo-mediated collaborative work. PhD thesis, VirginiaPolytechnic Institute and State University, 1997.
[17] M. Lambooij and W. IJsselsteijn. Visual discomfortand visual fatigue of stereoscopic displays: A review.In JIST, volume 53, 2009.
[18] D. Luebke, M. Reddy, J. Cohen, A. Varshney,B. Watson, and R. Huebner. Level of Detail for 3DGraphics. Morgan Kaufmann, 2002.
[19] D. C. Montgomery. Design and Analysis ofExperiments. Wiley, 7 edition, 2008.
[20] P. J. Narayanan, P. W. Rander, and T. Kanade.Constructing virtual worlds using dense stereo. InProc. of ICCV’98, pages 3–10, 1998.
[21] D. E. Ott and K. Mayer-Patel. A mechanism forTCP-friendly transport-level protocol coordination. InProc. of USENIX’02, pages 147–159, 2002.
[22] M. Pinson and S. Wolf. Comparing subjective videoquality testing methodologies. In Proc. of SPIEVCIP’03, pages 573–582, 2003.
[23] M. E. R. Dahlhaus. Causality and graphical models fortime series. University Press, Oxford, 2003.
[24] D. D. Silva, W. Fernando, G. Nur, E.Ekmekcioglu,and S. Worrall. 3D video assessment with justnoticeable di↵erence in depth evaluation. In Proc. ofICIP’10, pages 4013–4016, 2010.
[25] D. J. Simons and R. A. Rensink. Change blindness:Past, present, and future. Trends in CognitiveSciences, 9(1):16–20, 2005.
[26] E. Steinbach, S. Hirche, J. Kammerl, I. Vittorias, andR. Chaudhari. Haptic data compression andcommunication. IEEE SPM, 2011.
[27] R. Steinmetz. Human perception of jitter and mediasynchronation. IEEE JSAC, 14(1):61–72, 1996.
[28] H. Towles, W. chao Chen, R. Yang, S. uok Kum,H. F. N. Kelshikar, J. Mulligan, K. Daniilidis,H. Fuchs, C. C. Hill, N. K. J. Mulligan, L. Holden,B. Zeleznik, A. Sadagic, and J. Lanier. 3Dtele-collaboration over Internet2. In ITP, 2002.
[29] R. Vasudevan, G. Kurillo, E. Lobaton, T. Bernardin,O. Kreylos, R. Bajcsy, and K. Nahrstedt. High qualityvisualization for geographically distributed 3dteleimmersive applications. In IEEE Transactions onMultimedia, volume 13, pages 573–584, 2011.
[30] R. Vasudevan, G. Kurillo, E. Lobaton, T. Bernardin,O. Kreylos, R. Bajcsy, and K. Nahrstedt. High qualityvisualization for geographically distributed 3dteleimmersive applications. IEEE ToM, 2012.
[31] R. Vasudevan, E. Lobaton, G. Kurillo, R. Bajcsy,T. Bernardin, B. Hamann, and K. Nahrstedt. Amethodology for remote virtual interaction inteleimmersive environments. In Proc. of ACMMMSys’10, pages 281–292, 2010.
[32] VQEG. http://www.its.bldrdoc.gov/vqeg/.[33] W. Wu, Z. Yang, I. Gupta, and K. Nahrstedt.
Towards multi-site collaboration in 3d tele-immersiveenvironments. In IEEE ICDCS’08, 2008.
[34] S. Wurmlin, E. Lamboray, and M. Gross. 3D videofragments: Dynamic point samples for real-timefree-viewpoint video. Technical report, Institute ofScientific Computing, 2003.
[35] Z. Yang, Y. Cui, Z. Anwar, R. Bocchino, N. Kiyanclar,K. Nahrstedt, R. H. Campbell, and W. Yurcik.Real-time 3D video compression for tele-immersiveenvironments. In Proc. of MMCN, 2006.
22