colorvision cones and color coding in the cortex
TRANSCRIPT

http://nro.sagepub.com/The Neuroscientist
http://nro.sagepub.com/content/15/3/274The online version of this article can be found at:
DOI: 10.1177/1073858408331369
2009 15: 274NeuroscientistBevil R. Conway
Color Vision, Cones, and Color-Coding in the Cortex
Published by:
http://www.sagepublications.com
can be found at:The NeuroscientistAdditional services and information for
http://nro.sagepub.com/cgi/alertsEmail Alerts:
http://nro.sagepub.com/subscriptionsSubscriptions:
http://www.sagepub.com/journalsReprints.navReprints:
http://www.sagepub.com/journalsPermissions.navPermissions:
http://nro.sagepub.com/content/15/3/274.refs.htmlCitations:
What is This?
- May 12, 2009Version of Record >>
at OCCIDENTAL COLLEGE LIBRARY on October 7, 2013nro.sagepub.comDownloaded from at OCCIDENTAL COLLEGE LIBRARY on October 7, 2013nro.sagepub.comDownloaded from at OCCIDENTAL COLLEGE LIBRARY on October 7, 2013nro.sagepub.comDownloaded from at OCCIDENTAL COLLEGE LIBRARY on October 7, 2013nro.sagepub.comDownloaded from at OCCIDENTAL COLLEGE LIBRARY on October 7, 2013nro.sagepub.comDownloaded from at OCCIDENTAL COLLEGE LIBRARY on October 7, 2013nro.sagepub.comDownloaded from at OCCIDENTAL COLLEGE LIBRARY on October 7, 2013nro.sagepub.comDownloaded from at OCCIDENTAL COLLEGE LIBRARY on October 7, 2013nro.sagepub.comDownloaded from at OCCIDENTAL COLLEGE LIBRARY on October 7, 2013nro.sagepub.comDownloaded from at OCCIDENTAL COLLEGE LIBRARY on October 7, 2013nro.sagepub.comDownloaded from at OCCIDENTAL COLLEGE LIBRARY on October 7, 2013nro.sagepub.comDownloaded from at OCCIDENTAL COLLEGE LIBRARY on October 7, 2013nro.sagepub.comDownloaded from at OCCIDENTAL COLLEGE LIBRARY on October 7, 2013nro.sagepub.comDownloaded from at OCCIDENTAL COLLEGE LIBRARY on October 7, 2013nro.sagepub.comDownloaded from at OCCIDENTAL COLLEGE LIBRARY on October 7, 2013nro.sagepub.comDownloaded from at OCCIDENTAL COLLEGE LIBRARY on October 7, 2013nro.sagepub.comDownloaded from at OCCIDENTAL COLLEGE LIBRARY on October 7, 2013nro.sagepub.comDownloaded from at OCCIDENTAL COLLEGE LIBRARY on October 7, 2013nro.sagepub.comDownloaded from
274
Color Vision, Cones, and Color-Coding in the Cortex
Bevil R. Conway
The NeuroscientistVolume 15 Number 3
June 2009 274-290© 2009 Sage Publications
10.1177/1073858408331369http://nro.sagepub.com
hosted athttp://online.sagepub.com
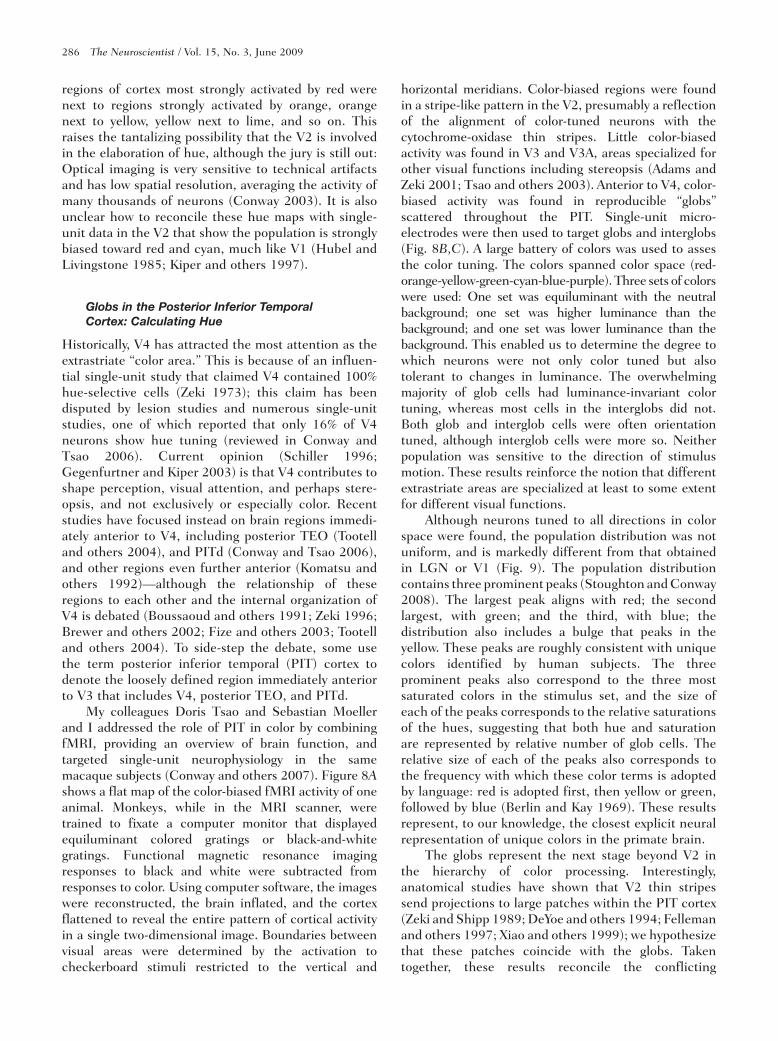
Color processing begins with the absorption of light by cone photoreceptors, and progresses through a series of hierarchical stages: Retinal signals carrying color information are transmit-ted through the lateral geniculate nucleus of the thalamus (LgN) up to the primary visual cortex (V1). From V1, the signals are processed by the second visual area (V2); then by cells located in subcompartments (“globs”) within the posterior inferior temporal (PIT) cortex, a brain region that encompasses area V4 and brain regions immediately anterior to V4. Color signals are then processed by regions deep within the inferior temporal (IT) cortex including area Te. as a heuristic, one can consider each of these stages to be involved in constructing a distinct aspect of the color percept. The three cone types are the basis for trichromacy; retinal ganglion cells that respond in an
opponent fashion to activation of different cone classes are the basis for color opponency (these “cone-opponent” cells increase their firing rate above baseline to activation of one cone class and decrease their firing rate below baseline to activation of a different cone class); double-opponent neurons in the V1 gen-erate local color contrast and are the building blocks for color constancy; glob cells elaborate the perception of hue; and IT integrates color perception in the context of behavior. Finally, though nothing is known, these signals presumably interface with motor programs and emotional centers of the brain to mediate the widely acknowledged emotional salience of color.
Keywords: retina; primary visual cortex; extrastriate; neuro-physiology; primate
What Is Color Good For?
among the mammals, old-world primates like macaque monkeys, gorillas, and humans have the best color vision. But our color abilities pale in comparison to some fish, birds, and insects (Bowmaker and Hunt 2006). Color is useful in disambiguating surfaces viewed under ambiguous luminance levels, such as rocks viewed under rippling water or fruit in dappled light. among primates, color is useful for discriminat-ing objects (gegenfurtner and Rieger 2000) including faces (Russell and Sinha 2007). Trichromats should theoretically be at an advantage if color vision assists in detecting ripe fruit. a common belief is that color vision evolved to help detect ripe fruit or nutritious young leaves (Caine and Mundy 2000; Regan and oth-ers 2001; Smith and others 2003; Stoner and others 2005), although this idea is not supported by studies showing that trichromatic New-World monkeys do not differ from their dichromatic conspecifics in fruit or energy acquisition rates (Melin and others 2007; Vogel and others 2007). Color is also used for nonverbal communication—flushed cheeks, for example, provide an instant indication of embarrassment or aggression. and red-shirted teams win more often (Rowe and
others 2005; attrill and others 2008). Color may have evolved to facilitate communication of emotion (Changizi and others 2006); alternatively, communica-tion may have capitalized on preexisting color-vision ability (Fernandez and Morris 2007). In any event, we enjoy color, although color preferences differ between the sexes—a recent study found that girls do in fact prefer pink (Hurlbert and Ling 2007). It is the enig-matic emotional salience of color that makes it so com-pelling and drives curiosity about the underlying neural mechanisms.
So what is color vision? It is the ability to distinguish surfaces or lights on the basis of the spectral distribution received by the eye. The neural computations required to bring about color are more involved than simply encoding each wavelength or set of wavelengths as a particular color. In the next section, we consider color phenomena that illustrate aspects of the color computations that must be implemented by the brain. The neural basis for these phenomena is discussed in subsequent sections.
Color Phenomena
Metamers
White light split by a prism reveals a spectrum. Certain wavelengths near the middle of the rainbow appear yel-low, a “monochromatic” yellow because it comprises a restricted portion of the visible spectrum centered on a single wavelength. an identical yellow can be produced
From the Neuroscience Program, Wellesley College, Wellesley, Massachusetts.
address correspondence to: Bevil R. Conway, 106 Central St, Wellesley, Ma 02481; e-mail: [email protected].
Review
Color Vision, Cones, and Color-Coding / Conway 275
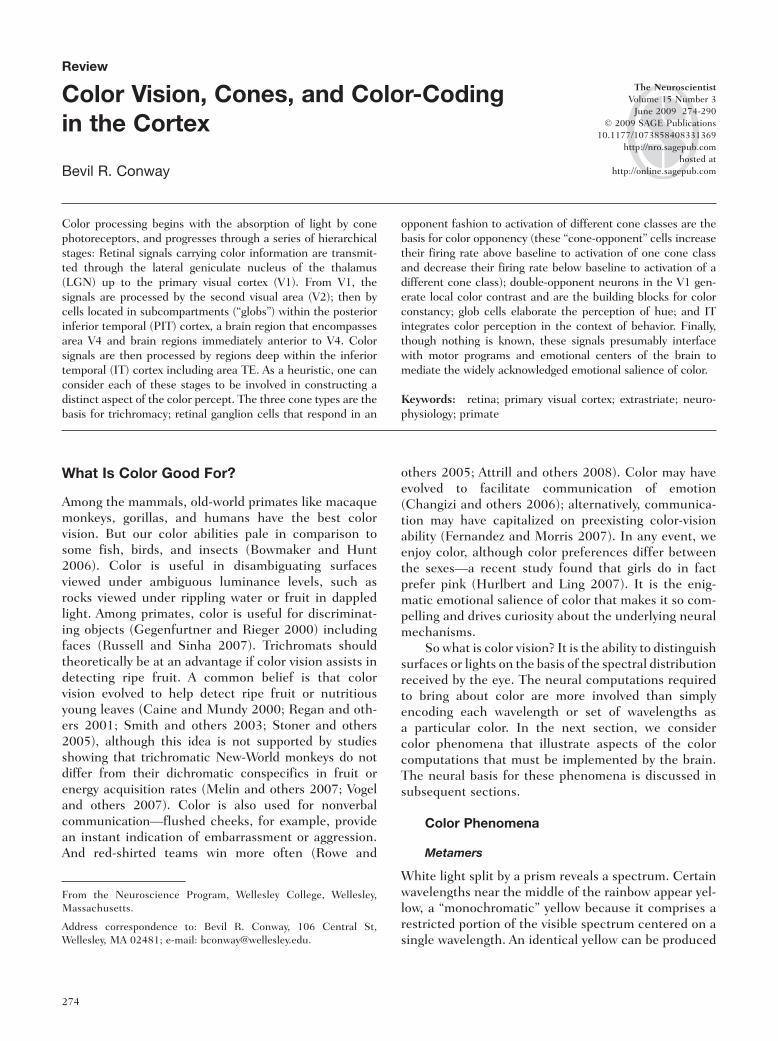
Figure 1. A rainbow (left) and additive color mixing (right). Left photo credit, the author (Tanglewood, MA, 2008).
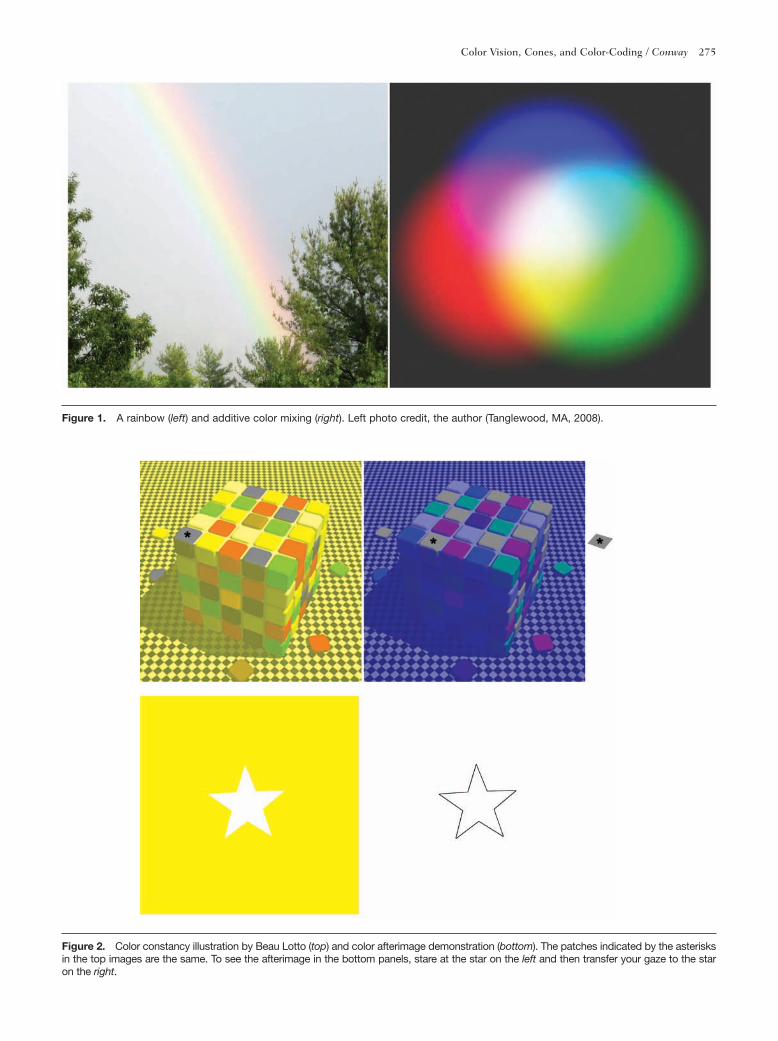
Figure 2. Color constancy illustration by Beau Lotto (top) and color afterimage demonstration (bottom). The patches indicated by the asterisks in the top images are the same. To see the afterimage in the bottom panels, stare at the star on the left and then transfer your gaze to the star on the right.

276 The Neuroscientist / Vol. 15, No. 3, June 2009
by mixing monochromatic red with monochromatic green (Fig. 1). Pairs of physically distinct stimuli that appear the same color, like these two yellows, are metamers. almost every color you perceive in the natu-ral world could be generated by multiple physical stimuli. as described below, color percepts are based on a comparison of the responses of the three cone classes; different physical stimuli that generate the same com-bination of cone activation are metamers and, like the two yellows shown in Figure 1, will appear the same.
Color Contrast and Color Constancy
The color of a given physical stimulus can be changed by altering the context in which it appears. The top of Figure 2 shows a striking example in which the same physical patch appears yellow when the scene appears to be illuminated by blue light but appears blue when the scene appears to be illuminated by yellow light. Surrounded by white, the patch appears gray. This example illustrates the potency of color contrast in generating color perception. The bottom of Figure 2 shows an example in which the afterimage to a white star is a yellow star. You are probably familiar with color afterimages, in which adaptation to one color produces an afterimage of a complementary color—for example, red produces a bluish-green afterimage. One might have thought that the star afterimage would be black, the complement of white. The yellow field surrounding the star presumably makes the star appear a weak blue, and the yellow afterimage is to the induced blue (Conway and others 2002). Figure 2 shows that the neural networks responsible for color take into account both spatial and temporal context.
One might wonder what selective pressure has driven the evolution of this aspect of the brain’s color circuitry. Consider the following. The spectral light reflected from an object is a product of two variables, the spectral content of the illuminant (the light source) and the absorptive properties of the object. a tungsten light bulb has more intense long wavelengths than natural daylight; a green apple absorbs more long wavelengths than a red apple. If color were determined solely by the physical light reflected from the object, then the color of the object would change with a change in lighting conditions. Color would then be an unreliable cue to object identity. Fortunately our visual systems achieve fairly good color constancy under different natural illuminants (Land 1977); under some testing conditions, constancy is almost perfect (Hansen and others 2007; Ling and Hurlbert 2008; Reeves and others 2008). Constancy is achieved because the brain determines an object’s color from a local comparison of the light reflected from the object with the light reflected from adjacent regions of the scene (Hurlbert and Wolf 2004; Danilova and Mollon 2006). The spectral bias of a light source will affect all regions of
the scene and be canceled, which explains why uniform color ganzfelds appear nearly colorless (gur 1989). Local calculations are also critical for color contrast (red is redder against green) suggesting that the same neural circuitry that provides for color constancy also generates color contrast (abrams and others 2007).
Color Assimilation
Figure 2 shows how powerful color contrast can be. The patch indicated by the asterisk appears gray when against white, but when embedded in a predominantly yellow scene, the patch takes on the complementary hue, blue. Figure 3 illustrates a somewhat contradictory phenom-enon, color assimilation. The “C,” “l,” and “r” of Color consist of the same turquoise (indicated by the swatch at the left) and either purple (C, r) or yellow (l) stripes. When paired with yellow, the turquoise appears yellow-ish. This is contrary to what is predicted by color contrast, which would predict that the yellow should enhance the blue of the turquoise stripes, rather than reduce it. The critical ingredient in determining whether colors are
Figure 3. Color assimilation demonstration, adapted from Shevell and Kingdom (2008)
Figure 4. Color vision helps defeat camouflage by detecting the location of the color boundaries that demarcate objects indepen-dent of the hue forming the boundaries.

Color Vision, Cones, and Color-Coding / Conway 277
contrasted or assimilated is scale: From further viewing distances, the spatial frequency of the stripes of “Color” is increased and the assimilation becomes more striking. Similarly, the color contrast effect of Figure 2 is reduced at greater viewing distances. The scale of these effects hints at the scale of the local comparisons that the brain uses to construct hue and reflects the low spatial acuity of color perception relative to Vernier acuity.
Camouflage
although the most salient aspect of color is hue (the feature of color we describe as red, green, blue, etc.), color can also be used for image segmentation. This is illustrated by our ability to defeat camouflage (Fig. 4), in which the critical information is the location of the boundary between two colors, not the hues of the col-ors. In fact, the hues are distracting (Morgan and others 1992). Unlike hue discrimination (and color contrast), defeating camouflage is easily accomplished when the spatial scale of the colored patches that make up the scene are small (i.e., high spatial frequency). This sug-gests that color signals can be used for two distinct tasks—detecting hue and image segmentation—that operate over different ranges of spatial scale.
Neural Mechanisms of Color
Cones: Trichromacy
artists have known for centuries that many colors can be produced by mixing three primary colors.1 In addi-tive color mixture (mixing lights), a set of primaries is any three lights that are unique, in which none of the primaries can be mixed from the remaining two. There are many possible sets of primaries, not just the conven-tional red, blue, and green used in TV monitors, although these provide the largest possible gamut on a cathode ray tube (computer monitor) display. Inspired by artists’ color mixing, Thomas Young, and later Hermann Helmoltz, proposed that color was subserved by three classes of sensors, each maximally sensitive to a different part of the visible spectrum. This trichromatic theory resolved a problem: although we can see millions of dif-ferent colors, our retinas simply do not have enough space to accommodate a separate detector for every color at every retinal location. It is now clear that humans with normal color vision have three types of retinal cone cell, termed L, M, and S to reflect their absorption curves, which peak in the long, middle, and short wavelength regions of the spectrum (Fig. 5). The cones do not correspond to our sensations of “red,” “green,” and “blue”: Note that the peaks do not align with these colors in the spectrum. and curiously, even different cells of the same cone class can bring about different color sensations when stimulated in isolation with identical tiny light flashes restricted to the single cone cell (Hofer and others 2005b).
Organisms that possess a single photoreceptor class cannot see in color, even though the photoreceptor may have a peak in its absorption spectrum. In fact, people are colorblind under very dim lighting conditions when there is insufficient light to drive the cones and we are left with only one type of functioning photoreceptor, the rods. Organisms with only one functional class of photoreceptor (like humans in dim light) are effectively colorblind because photoreceptor activation is affected not only by the wavelength of the stimulus but also by the intensity (amplitude) of it. a suboptimal wavelength could be made sufficiently intense to generate the same activation as a low-intensity optimal-wavelength stimulus. To overcome this “Principle of Univariance,” in order to compute color, the brain must compare photoreceptor responses from two different classes of photoreceptor within roughly the same retinal location. Because two photoreceptors cannot physically occupy the exact same retinal location, the spatial
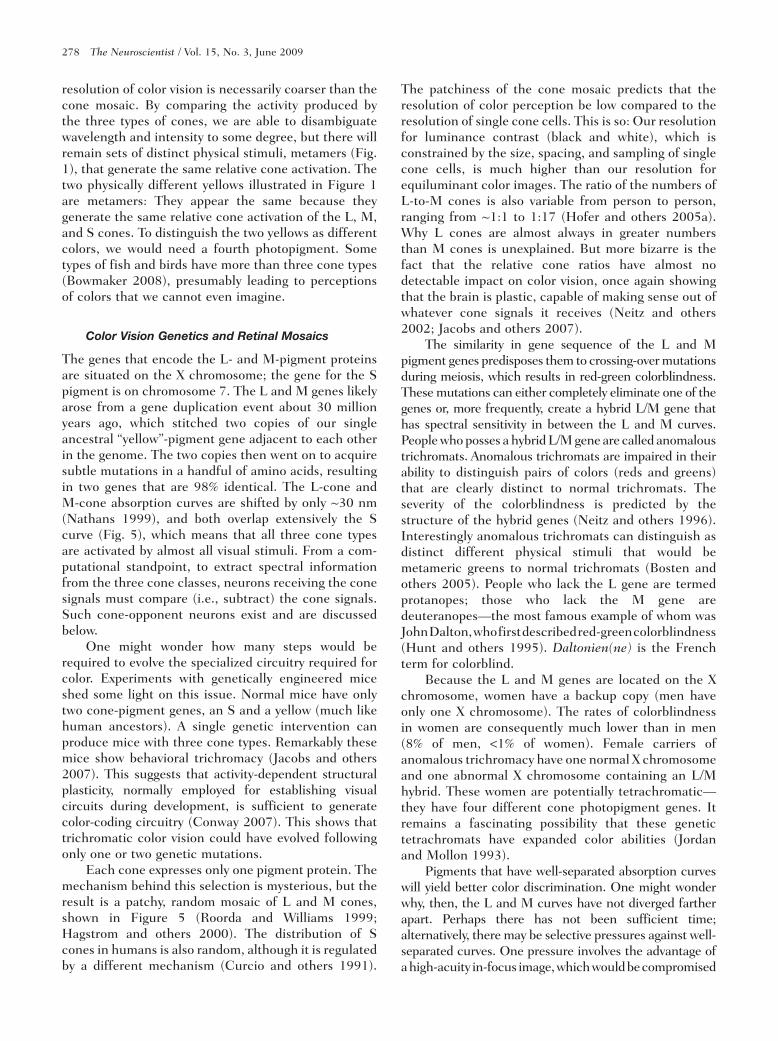
Figure 5. Absorption spectra of the three cone types (top) and patches of retina from two people with normal color vision (bottom). Bottom adapted from (Roorda and Williams 1999). Cone outer seg-ments are 1 to 5 µm in diameter, with foveal cones smaller than peripheral cones. Scale bar corresponds to 5 arcmin of visual angle.
1. Color mixing does not capture colors produced by surface properties (think of red velvet, purple suede, and colored glass), opacity (important for getting pink), fluorescent colors, or iridescent colors. In addition, to achieve brown as opposed to orange, one must be able to adjust the luminance of the region surrounding the test patch.
278 The Neuroscientist / Vol. 15, No. 3, June 2009
resolution of color vision is necessarily coarser than the cone mosaic. By comparing the activity produced by the three types of cones, we are able to disambiguate wavelength and intensity to some degree, but there will remain sets of distinct physical stimuli, metamers (Fig. 1), that generate the same relative cone activation. The two physically different yellows illustrated in Figure 1 are metamers: They appear the same because they generate the same relative cone activation of the L, M, and S cones. To distinguish the two yellows as different colors, we would need a fourth photopigment. Some types of fish and birds have more than three cone types (Bowmaker 2008), presumably leading to perceptions of colors that we cannot even imagine.
Color Vision Genetics and Retinal Mosaics
The genes that encode the L- and M-pigment proteins are situated on the X chromosome; the gene for the S pigment is on chromosome 7. The L and M genes likely arose from a gene duplication event about 30 million years ago, which stitched two copies of our single ancestral “yellow”-pigment gene adjacent to each other in the genome. The two copies then went on to acquire subtle mutations in a handful of amino acids, resulting in two genes that are 98% identical. The L-cone and M-cone absorption curves are shifted by only ~30 nm (Nathans 1999), and both overlap extensively the S curve (Fig. 5), which means that all three cone types are activated by almost all visual stimuli. From a com-putational standpoint, to extract spectral information from the three cone classes, neurons receiving the cone signals must compare (i.e., subtract) the cone signals. Such cone-opponent neurons exist and are discussed below.
One might wonder how many steps would be required to evolve the specialized circuitry required for color. experiments with genetically engineered mice shed some light on this issue. Normal mice have only two cone-pigment genes, an S and a yellow (much like human ancestors). a single genetic intervention can produce mice with three cone types. Remarkably these mice show behavioral trichromacy (Jacobs and others 2007). This suggests that activity-dependent structural plasticity, normally employed for establishing visual circuits during development, is sufficient to generate color-coding circuitry (Conway 2007). This shows that trichromatic color vision could have evolved following only one or two genetic mutations.
each cone expresses only one pigment protein. The mechanism behind this selection is mysterious, but the result is a patchy, random mosaic of L and M cones, shown in Figure 5 (Roorda and Williams 1999; Hagstrom and others 2000). The distribution of S cones in humans is also random, although it is regulated by a different mechanism (Curcio and others 1991).
The patchiness of the cone mosaic predicts that the resolution of color perception be low compared to the resolution of single cone cells. This is so: Our resolution for luminance contrast (black and white), which is constrained by the size, spacing, and sampling of single cone cells, is much higher than our resolution for equiluminant color images. The ratio of the numbers of L-to-M cones is also variable from person to person, ranging from ~1:1 to 1:17 (Hofer and others 2005a). Why L cones are almost always in greater numbers than M cones is unexplained. But more bizarre is the fact that the relative cone ratios have almost no detectable impact on color vision, once again showing that the brain is plastic, capable of making sense out of whatever cone signals it receives (Neitz and others 2002; Jacobs and others 2007).
The similarity in gene sequence of the L and M pigment genes predisposes them to crossing-over mutations during meiosis, which results in red-green colorblindness. These mutations can either completely eliminate one of the genes or, more frequently, create a hybrid L/M gene that has spectral sensitivity in between the L and M curves. People who posses a hybrid L/M gene are called anomalous trichromats. anomalous trichromats are impaired in their ability to distinguish pairs of colors (reds and greens) that are clearly distinct to normal trichromats. The severity of the colorblindness is predicted by the structure of the hybrid genes (Neitz and others 1996). Interestingly anomalous trichromats can distinguish as distinct different physical stimuli that would be metameric greens to normal trichromats (Bosten and others 2005). People who lack the L gene are termed protanopes; those who lack the M gene are deuteranopes—the most famous example of whom was John Dalton, who first described red-green colorblindness (Hunt and others 1995). Daltonien(ne) is the French term for colorblind.
Because the L and M genes are located on the X chromosome, women have a backup copy (men have only one X chromosome). The rates of colorblindness in women are consequently much lower than in men (8% of men, <1% of women). Female carriers of anomalous trichromacy have one normal X chromosome and one abnormal X chromosome containing an L/M hybrid. These women are potentially tetrachromatic—they have four different cone photopigment genes. It remains a fascinating possibility that these genetic tetrachromats have expanded color abilities (Jordan and Mollon 1993).
Pigments that have well-separated absorption curves will yield better color discrimination. One might wonder why, then, the L and M curves have not diverged farther apart. Perhaps there has not been sufficient time; alternatively, there may be selective pressures against well-separated curves. One pressure involves the advantage of a high-acuity in-focus image, which would be compromised

Color Vision, Cones, and Color-Coding / Conway 279
by having photoreceptors with different absorption curves. The eye can only keep in focus one region of the spectrum at any given time because each region of the spectrum has a different focal length. The focal length is determined by how much the light is bent by the focusing apparatus of the eye—recall that short-wavelength light bends more than long-wavelength light (blue is also on the inside curve of a rainbow). The eye keeps in focus middle-wavelength yellow light straddling the peak sensitivities of the L and M cones, providing the L and M cones with a more-or-less in-focus image. Unfortunately this means that the image provided to the S cone is unfocussed. The region of the retina corresponding to the center of gaze, called the fovea, has extremely high acuity in comparison with the periphery (try reading this text with your peripheral vision). The selective pressures driving high acuity in the fovea would oppose the expression of S cones in the fovea. In fact S cones constitute only about 10% of all cones throughout the retina,2 and the very center of the fovea, called the foveola, is devoid of S cones (Curcio and others 1991). In addition, a region of the retina centered on and extending beyond the fovea is covered with a yellow substance called macular pigment, which is derived from plants we eat. By filtering out blurry short-wavelength light, the pigment is thought to increase foveal acuity and may be involved in maintaining the health of the retina by neutralizing free radicals produced on exposure to short-wavelength light (Stringham and others 2006; Whitehead and others 2006; but see engles and others 2007).
Retina and LGN: Color Opponency
The cone signals are processed by several classes of retinal ganglion cells (Masland 2001). Most retinal ganglion cells send their axons to the lateral geniculate
nucleus (LgN). LgN cells then send their axons up to the visual cortex. For the most part, receptive fields in the LgN are very similar to those of the retinal ganglion cells that provide input to the LgN. The role of the LgN in the elaboration of color signals is unclear. Here we focus on cone-opponent cells in the retina and LgN. These cells increase their firing rate above some baseline rate in response to activation of one cone class and decrease their firing rate when a different cone class is activated. Two types of cone-opponent cells have been described: those that compare L activation to M activation, loosely called red-green cells, and those that compare S activation to some combination of L and M activation, loosely called blue-yellow cells (De Valois and others 1958; Wiesel and Hubel 1966; Dacey and Lee 1994; Reid and Shapley 2002; Field and others 2007). a cell that is excited by activation of the L cones is sometimes called a “red-on” cell; one activated by M cones is called a “green-on” cell, and so on. Such cone-opponent cells perform the sort of calculation that is necessary to disambiguate wavelength and intensity, and are the building blocks for color vision.
each visual neuron receives input from a restricted patch of retina corresponding to a region in the visual field. This region is called the neuron’s receptive-field. Color contrast (Fig. 2) requires a comparison of the relative cone activations across visual space, so one question hinges on the spatial organization of cone-opponent receptive fields. are cone-opponent cells capable of comparing the amount of L activation in one part of visual space with the amount of L activation in an adjacent region of visual space? Such spatial antagonism is the heart of color-contrast and color-constancy models (Hurlbert and Wolf 2004; Vladusich 2007). a neuron with a spatially structured antagonistic receptive field would fire more to a spatially structured stimulus, like a red spot on a green background, rather than a uniform color ganzfeld. The firing patterns of
Figure 6. Responses of a single lateral geniculate nucleus (LGN) cone-opponent cell to spots of different colors and sizes (A), and cone inputs to a population of LGN cells (B). The diagram on the left side of panel A shows a schematic summary of the receptive field of the cell. The cone weights in B are defined as follows. L-cone weight = (response to L-cone stimulation) / [(response to L-cone stimulation) + (response to M-cone stimulation) + (response to S-cone stimulation)]. S-cone weight indicated by distance from the diagonals. A adapted from Wiesel and Hubel (1966); B adapted from Derrington and others (1984).
2. Because of the scarcity of S cones, even if our eyes were optimally focused for short-wavelength light, the image would be of low acuity.

280 The Neuroscientist / Vol. 15, No. 3, June 2009
such neurons would correlate with color perception: red appears more salient when on a green background than when on a red background. In fact, uniform red ganzfelds appear almost colorless.
Receptive fields of cone-opponent cells in the retina and LgN are not capable of color contrast. Retinal blue-yellow cells, which are infrequent, tend to have large receptive fields that lack spatial structure: The retinal region in which S-cone activation causes activation of a blue-on cell is coextensive with the region in which L+M activation causes suppression (Wiesel and Hubel 1966; Chichilnisky and Baylor 1999; Field and others 2007). Red-green cells, which constitute the majority of neurons in the LgN, have spatially structured receptive fields but are wired up to detect luminance contrast, not color contrast (Fig. 6A). The LgN cell shown in Figure 6A, recorded by Wiesel and
Hubel (1966), was excited by a small spot of red light (activating the L cones more than any other cone class) positioned on the receptive-field center. The cell gave the same response to a large red spot that encompassed both receptive-field center and surround, indicating that the surround was not chromatically opponent to the center—the surround was not sensitive to long-wavelength light (i.e., it was not broad band). The cell was also activated by a small white spot, showing that the center was not chromatically opponent—if it were, the blue-green component of the white light would have canceled the activation produced by the red component of the white light and the cell would not have responded. To a large white spot the cell gave little response, showing that the surround was chromatically opposed to the center. Consistent with this, a large blue spot (activating the M and S cones more than the L cones)
Figure 7. Organization of cone inputs to a V1 double-opponent cell (A and B), and anatomical clustering of color cells in V1 (C and D). A, Spatial receptive-field map. Scale of the grid is 0.75° of visual angle. B, Spike-triggered average traces. The receptive-field center (central region of each panel in A) was excited by an increase in L-cone activity (L+) or a decrease in M or S activity (M–, S–), and suppressed by a decrease in L (L–) or an increase in M or S (M+, S+); the receptive-field surround gave the opposite pattern of chromatic tuning. Responses are summarized by the receptive-field diagram at the right. Adapted from Conway and Livingstone (2006). C, Section encompassing V1 and V2, taken parallel to the cortical surface, stained for the metabolic enzyme cytochrome oxidase. Blobs in V1 are indicated by white arrows; thick and thin stripes in V2 are indicated by arrow heads and arrows, respectively. D, Optical imaging map of the same piece of tissue; darker activity indicates higher response to color than to black and white. Scale bar 1 mm. C and D adapted from Lu and Roe (2008).

Color Vision, Cones, and Color-Coding / Conway 281
suppressed the cell’s firing rate and did so more than a small blue spot. The optimal stimulus for this cell was therefore a bright white (or red) spot on a dark black (or burgundy) surround. The optimal stimulus for a color-contrast cell, on the other hand, would be a red spot on a green background. Thus these LgN cells can contribute to color opponency so long as the stimuli are large enough to encompass both receptive-field center and surround, but they cannot resolve color contrast.
The wiring of red-green cells seems at odds with the physiology of these cells. anatomical investigations suggest that the surrounds sample cones randomly with respect to cone class (Dacey and Packer 2003), which predicts that the surrounds would be broad band. But, as described above, physiological studies show that the surrounds are pure (Reid and Shapley 2002; Solomon and others 2005; Vakrou and others 2005). Models implicating random wiring and a functional bias have been proposed to reconcile the anatomy and the physiology (Buzas and others 2006), but there are still significant gaps in our understanding of the anatomical basis for color opponency. What is certain is that these neurons show cone opponency to large spots and luminance sensitivity to small spots. Thus, these cells show both low-pass color tuning and high-pass luminance tuning, suggesting they are capable of subserving both color vision, which has relatively low spatial resolution, and form vision, which has relatively high spatial resolution and is largely determined by luminance edges. One possibility is that different populations of V1 neurons receiving LgN signals extract either the color or the high-acuity form signals.
The cone opponency of LgN cells was initially taken as neural evidence for Hering’s opponent-colors theory, in which color is defined by the relative activity of two psychologically defined color axes, “red-green” and “blue-yellow,” along with an achromatic black-white axis (Hurvich 1981). The poles of Hering’s color axes are the four nonreducible unique hues red, green, blue, and yellow (Regier and others 2005), from which all other colors can be described (for example, orange is reddish yellow). The population of LgN cells is strongly biased in its color tuning, especially if the responses are plotted in cone-weight coordinates (Fig. 6B) (Derrington and others 1984). But the color tuning of LgN cells does not correspond to the unique hues (Webster and others 2000; Wuerger and others 2005). Instead, LgN cells are tuned to red versus cyan, and lavender versus lime; these cardinal axes are perhaps better described as complementary pairs. Despite this, it is still common practice to call cone-opponent neurons by color-opponent names, to the consternation of many (Hardin and Maffi 1997).
Primary Visual Cortex: Calculating Color Contrast
LgN projections arrive in the V1 (striate cortex) along anatomically segregated streams that keep red-green
signals separate from blue-yellow signals (Chatterjee and Callaway 2003). In V1, “double-opponent” neu-rons compare color signals across visual space (Fig. 7A,B) (Livingstone and Hubel 1984; Conway 2001). Double-opponent receptive fields were first described in the goldfish retina (Daw 1968) but, despite intensive searching, have not been found in monkey retina or LgN. Double-opponent neurons are so named because their receptive fields are both chromatically and spa-tially opponent—the optimal stimulus for a red-on double-opponent cell is a red spot on a green back-ground. Because of their specialized receptive-field structure, double-opponent cells are candidates for the neural basis for color contrast and color constancy (Danilova and Mollon 2006; Kentridge and others 2007) and may account for color-contrast effects reported in V1 (Wachtler and others 2003). Double-opponent receptive fields match the filters produced by independent-component analysis of color in natural scenes, suggesting that these cells are an efficient means of encoding color (Hoyer and Hyvarinen 2000; Tailor and others 2000; Doi and others 2003; Caywood and others 2004).
Initial reports of V1 double-opponent cells were hotly contested—in fact, a description of double-opponent cells is still relegated to little more than a footnote in influential textbooks (Lennie 2000). But their existence has now been confirmed by a number of independent investigators (Conway 2001; Johnson and others 2001; Horwitz and others 2007). The 2-dimensional spatial structure of double-opponent receptive fields has been mapped under neutral adapting conditions using small spots of cone-isolating light and reverse-correlation (Conway and Livingstone 2006b). Cone-isolating stimuli take advantage of the principle of univariance: a cone-isolating stimulus involves two colors; the colors cause the same relative activation of two cone types and modulate the activity of the remaining cone type. Cone-isolating stimuli are advantageous because they deliver maximum contrast along the dimension on which the brain constructs color (Conway and Livingstone 2005). Neural responses to the alternation between the colors can therefore be attributed selectively to the remaining cone type. Reverse correlation involves presenting stimuli at random locations in and around the receptive field while recording a continuous history of neural activity. after the recording session, each action potential can then be reverse-correlated with the location of the stimulus at various times before the spike took place. Following thousands of spikes and a dense sampling of stimulus locations, one can recover a response map that reflects the underlying receptive field (Conway and Livingstone 2006a). These maps have produced a wealth of information about the way in which double-opponent cells process the cone signals.
The most important feature that emerges with double-opponent cells is a spatially transformed

282 The Neuroscientist / Vol. 15, No. 3, June 2009
receptive field capable of color contrast. Curiously the receptive fields of double-opponent cells are rarely circularly symmetric (Fig. 7A). Instead they comprise a central region and a crescent-shaped surrounding region; the receptive fields of some cells reach an extreme in which the two subregions are better described as two parallel subfields. This spatial structure accounts for the orientation tuning of many double-opponent cells.
Double-opponent neurons, which constitute ~5% to 10% of V1 cells, come in two flavors, L versus M+S (“red-cyan”) and S versus L+M (“blue-yellow”). The red-cyan population is fairly homogenous, receiving more-or-less balanced L and M+S input. The blue-yellow cells are less frequent and much more heterogeneous, showing pronounced nonlinearities (Horwitz and others 2005) that are consistent with perception (giulianini and eskew 2007). The S contribution to L versus M cells and the asymmetries of blue-yellow cells found in V1 have since been found in the LgN (Tailby and others 2008), suggesting that cone-opponent cells in V1 simply inherit the cone weights of the LgN.
Double-opponent neurons should respond to colored stimuli that lack luminance contrast—imagine red and green stripes that appear a uniform gray in a black-and-white reproduction. Such “equiluminant” stimuli are difficult to define because luminance perception varies from person to person. Operationally, one can perform an equiluminance-sensitivity test by measuring responses to a series of stimuli constituting a range of luminance ratios: bright red and dark green stripes, through equiluminant red and green stripes, to dark red and bright green stripes. a neuron that is sensitive to color contrast should respond throughout this range without a null. Double-opponent neurons respond to equiluminant stimuli (Conway and others 2002) and do not have an equiluminant null (Johnson and others 2004).
a response to equiluminant colored gratings has been proposed as “a major test” of double opponency (Shapley and Hawken 2002; Solomon and others 2004). although such a test probes a necessary feature of double opponency, it is by itself insufficient to prove double opponency: neurons could respond to equiluminant stimuli without having double-opponent receptive fields, just as complex cells can show orientation tuning without having spatially structured simple receptive fields. In fact, more than half of V1 cells, many more than are found to be double-opponent, show band-pass spatial frequency tuning to equiluminant colored gratings (gouras and Kruger 1979; Hubel and Livingstone 1990; Johnson and others 2001). This strong equiluminance response has been confirmed with fMRI in both human and monkey (engel and others 1997; Conway and Tsao 2006).
Which neurons are responsible for the strong equiluminance response in V1 if double-opponent cells
are insufficient? as described above, red-green LgN cells are equipped not only for color vision but also for high-acuity form vision. Most V1 neurons besides the double-opponent cells are orientation selective, each cell responding to a bar of light of a particular orientation. Orientation selectivity is constructed by precise wiring of LgN inputs. Single orientation-tuned cells probably do not discriminate between red and green LgN cells because red-on and green-on cells do not form separate retinal mosaics (Lee 1996). LgN cells respond poorly to color contrast, but the particular color contrast that nulls the response varies widely from cell to cell (Hubel and Livingstone 1990). In an equiluminance-sensitivity test, most orientation-selective neurons would therefore be expected to respond across the full range of stimuli: a luminance ratio that nulls one LgN input would activate a different input and the various inputs would compensate for each other. Unlike double-opponent cells, these “complex-equiluminance cells” could subserve high spatial acuity, be sensitive to luminance contrast, and be able to detect colored boundaries regardless of the configuration of the colors forming the boundary. Complex-equiluminance cells would be especially useful in defeating camouflage (Fig. 4) because they would not be confounded by selectivity to the colors forming the boundaries. Recall that color vision makes defeating camouflage more difficult (Morgan and others 1992). Double-opponent cells, on the other hand, are wired in such a way as to preserve the color tuning of the inputs, yielding relatively coarse receptive fields that would be sensitive to the colors forming color boundaries. The coarse size, and the small percentage of double-opponent cells in the cortex, matches the poor spatial resolution of color vision.
The different properties of the two color-sensitive channels in V1, the double-opponent cells and the complex-equiluminant cells, can be distinguished with human fMRI (engel 2005) and revealed with psychophysical tests (Stockman and Plummer 2005); they may also account for the assimilation effects shown in Figure 3. The high-acuity complex-equiluminance cells can easily distinguish the stripes that form the image, whereas the low-acuity double-opponent cells cannot. as a result, double-opponent cells blur the red-and-blue components of the left “o” resulting in a purple percept, and the red-and-yellow components of the right “o” resulting in orange. at the same time, the double-opponent cells contribute to low-resolution spatial color contrast, making the center of the left “o” appear more yellow than the center of the right “o” even though both are physically identical. Double-opponent cells could also help achieve the color-contrast effects of Figure 2.
Much debate has centered on the segregation of color, form, and motion—in its strong form, segregation demands a different population of neurons to subserve

Color Vision, Cones, and Color-Coding / Conway 283
Figure 8. Flat map of color-biased brain activity in alert macaque monkey revealed with fMRI (A), and single-unit electrodes targeting a color glob (B) and inter-glob (C). Scale bar in A, 1 cm. Bottom panels of B and C show responses from a single glob cell and an inter-glob cell, respectively, to a complete set of colors.
form, stereoscopic depth, motion, and color (Livingstone and Hubel 1988; for review, see gegenfurtner and Kiper 2003). Double-opponent cells are not sensitive to the direction of moving stimuli, unlike some V1 neurons, and are therefore unlikely to contribute to
motion perception (Conway and others 2002; Horwitz and albright 2005). The hottest contention centers on “form.” By virtue of their spatially structured receptive fields, double-opponent cells contribute to form. Moreover, double-opponent cells can show orientation
284 The Neuroscientist / Vol. 15, No. 3, June 2009
tuning and are often responsive to luminance. But their large receptive fields imply that they would not contribute to form with nearly as much precision as would most other V1 cells with their finer receptive fields. Depending on how “form” is defined, one could argue either for or against the segregation model. What would seem uncontroversial is the specialization shown by some classes of V1 cell, namely, the double-opponent cells and the direction-selective cells.
Many have attempted to stitch together a coherent account of the neurophysiology of V1 (De Valois and De Valois 1993; Zeki 1993; Conway and Livingstone 2002; gegenfurtner and Kiper 2003; Lennie and Movshon 2005; Sincich and Horton 2005). How can one reconcile these different opinions? It is worth taking a step back and considering the challenge of neurophysiology. In the first instance, one needs to determine the degree to which the neurophysiology of the neurons under consideration correlates with and predicts color phenomena. If a pattern of firing does not correspond to color perception, then one can either conclude that the neuron is not involved in color or, alternatively, that a subsequent stage of processing is required. But even once cells whose responses correlate with color perception are found, there is no guarantee that these cells are necessary and sufficient for color perception. In an influential survey of V1 color properties, Lennie
and others (1990) concluded that most V1 neurons show some degree of color tuning and that the population contained representatives with color biases for every perceivable color. at first Lennie and others’ results seemed to indicate that a transformation had occurred between LgN and V1 to bring about color tuning corresponding to color perception. But the color biases of most V1 neurons are weak, and it has since been shown that most V1 neurons do not show color tuning that is stable to changes in luminance and contrast, unlike color perception (Solomon and Lennie 2005). Double-opponent cells, which were overlooked by Lennie and others, show more or less luminance-invariant responses, although they show a limited range of color tuning that is similar to that found in the LgN. My hunch is that the double-opponent cells are the V1 basis for color perception and that cells in downstream areas compare the activity in the population of double-opponent neurons to compute hue. What, then, of the majority of (not double-opponent) cells described by Lennie and others? One distinct possibility is that the color biases of these cells arise simply as an artifact of limited sampling of a patchy cone mosaic and are not relevant for hue discrimination.
Color in V2: Toward Hue?
In a landmark discovery, Livingstone and Hubel (1984) discovered that color-tuned neurons in the V1 coin-cided with cytochrome-oxidase blobs and that blobs send projections specifically to cytochrome-oxidase thin-stripes of the second visual area, V2. One would therefore predict that the thin stripes are enriched for color-selective neurons; despite some controversy, there is now consensus that this is the case (Hubel and Livingstone 1987; Tootell and others 1988; Roe and Ts’o 1999; Shipp and Zeki 2002; Sincich and Horton 2002; gegenfurtner 2003; Xiao and others 2003; Lu and Roe 2008). The functional specialization of the thin stripes is even evident with fMRI (Conway and others 2007). There is substantially less information on the chromatic properties of single neurons in the V2 as compared to the V1. On first pass there seem to be no major differ-ences of color-coding in V1 and V2 (Kiper and others 1997; Moutoussis and Zeki 2002; Solomon and Lennie 2005); one exception is the emergence of a new class of color-complex cell (Hubel and Livingstone 1985). Using optical imaging, one group has reported hue maps within the thin stripes (Xiao and others 2003). Xiao and others measured the activity in the V2 using a very sensitive camera that detects activity-dependent changes in the optical density of tissue. They measured the responses to different colors—red, orange, yellow, lime, green, aqua, blue, and purple—presented as equi-luminant color-and-gray gratings. The locations of peak activity for each color were sequentially shifted, so that
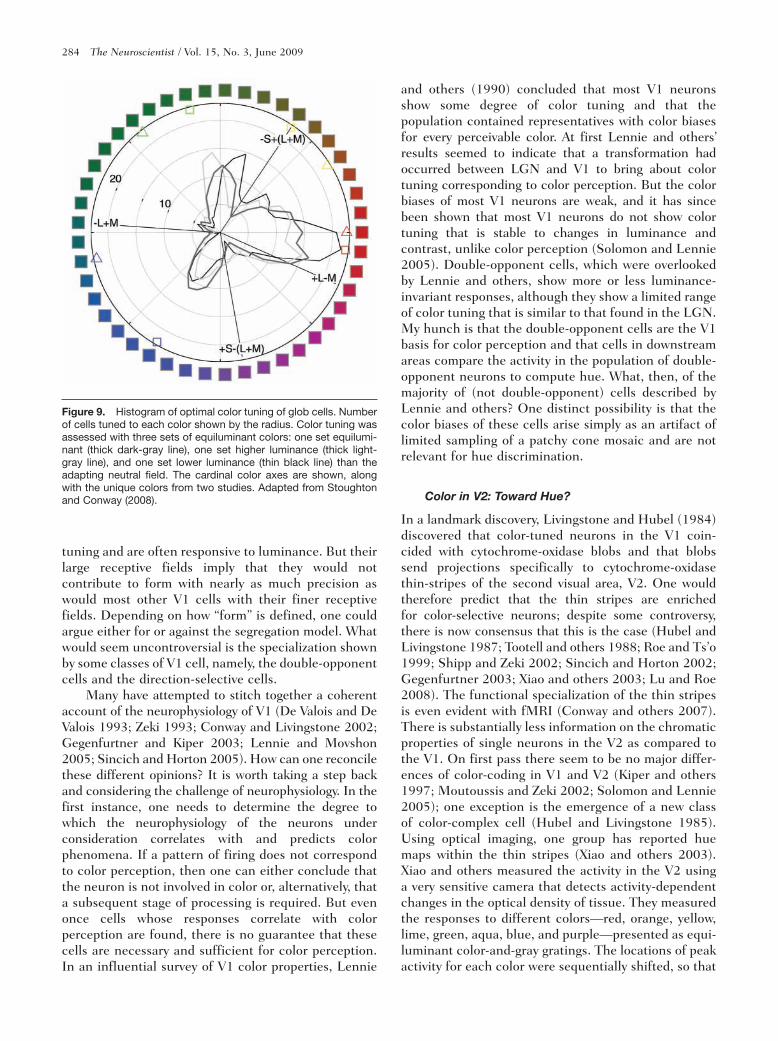
Figure 9. Histogram of optimal color tuning of glob cells. Number of cells tuned to each color shown by the radius. Color tuning was assessed with three sets of equiluminant colors: one set equilumi-nant (thick dark-gray line), one set higher luminance (thick light-gray line), and one set lower luminance (thin black line) than the adapting neutral field. The cardinal color axes are shown, along with the unique colors from two studies. Adapted from Stoughton and Conway (2008).
Color Vision, Cones, and Color-Coding / Conway 285
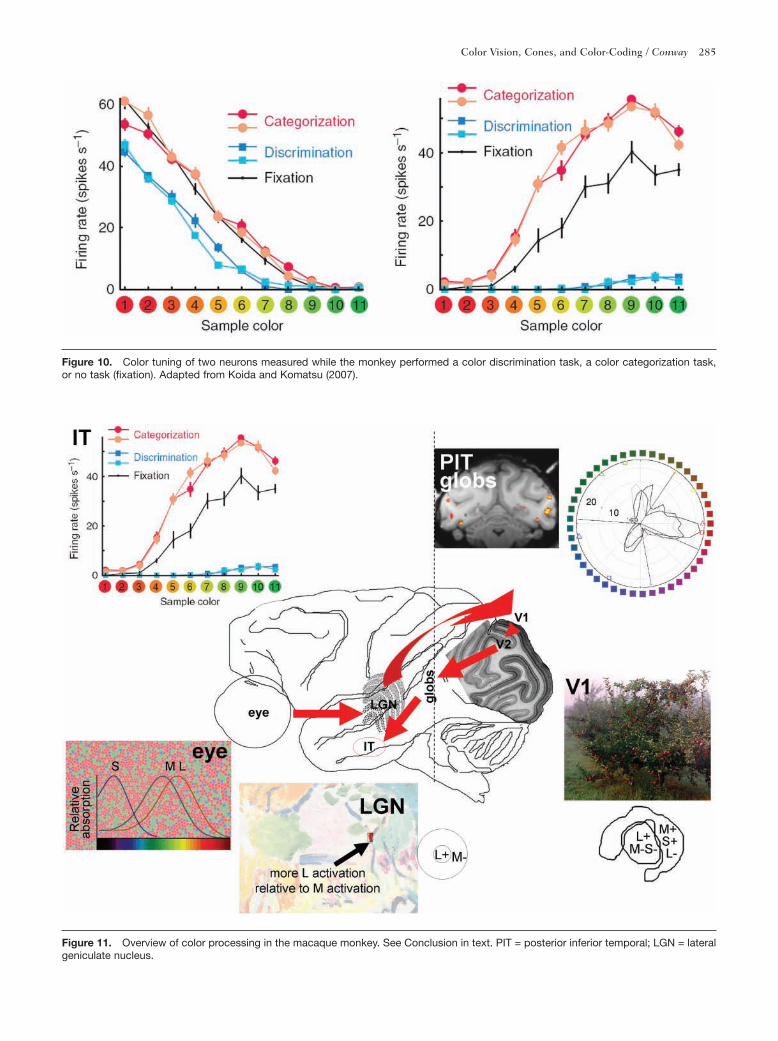
Figure 10. Color tuning of two neurons measured while the monkey performed a color discrimination task, a color categorization task, or no task (fixation). Adapted from Koida and Komatsu (2007).
Figure 11. Overview of color processing in the macaque monkey. See Conclusion in text. PIT = posterior inferior temporal; LGN = lateral geniculate nucleus.
286 The Neuroscientist / Vol. 15, No. 3, June 2009
regions of cortex most strongly activated by red were next to regions strongly activated by orange, orange next to yellow, yellow next to lime, and so on. This raises the tantalizing possibility that the V2 is involved in the elaboration of hue, although the jury is still out: Optical imaging is very sensitive to technical artifacts and has low spatial resolution, averaging the activity of many thousands of neurons (Conway 2003). It is also unclear how to reconcile these hue maps with single-unit data in the V2 that show the population is strongly biased toward red and cyan, much like V1 (Hubel and Livingstone 1985; Kiper and others 1997).
Globs in the Posterior Inferior Temporal Cortex: Calculating Hue
Historically, V4 has attracted the most attention as the extrastriate “color area.” This is because of an influen-tial single-unit study that claimed V4 contained 100% hue-selective cells (Zeki 1973); this claim has been disputed by lesion studies and numerous single-unit studies, one of which reported that only 16% of V4 neurons show hue tuning (reviewed in Conway and Tsao 2006). Current opinion (Schiller 1996; gegenfurtner and Kiper 2003) is that V4 contributes to shape perception, visual attention, and perhaps stere-opsis, and not exclusively or especially color. Recent studies have focused instead on brain regions immedi-ately anterior to V4, including posterior TeO (Tootell and others 2004), and PITd (Conway and Tsao 2006), and other regions even further anterior (Komatsu and others 1992)—although the relationship of these regions to each other and the internal organization of V4 is debated (Boussaoud and others 1991; Zeki 1996; Brewer and others 2002; Fize and others 2003; Tootell and others 2004). To side-step the debate, some use the term posterior inferior temporal (PIT) cortex to denote the loosely defined region immediately anterior to V3 that includes V4, posterior TeO, and PITd.
My colleagues Doris Tsao and Sebastian Moeller and I addressed the role of PIT in color by combining fMRI, providing an overview of brain function, and targeted single-unit neurophysiology in the same macaque subjects (Conway and others 2007). Figure 8A shows a flat map of the color-biased fMRI activity of one animal. Monkeys, while in the MRI scanner, were trained to fixate a computer monitor that displayed equiluminant colored gratings or black-and-white gratings. Functional magnetic resonance imaging responses to black and white were subtracted from responses to color. Using computer software, the images were reconstructed, the brain inflated, and the cortex flattened to reveal the entire pattern of cortical activity in a single two-dimensional image. Boundaries between visual areas were determined by the activation to checkerboard stimuli restricted to the vertical and
horizontal meridians. Color-biased regions were found in a stripe-like pattern in the V2, presumably a reflection of the alignment of color-tuned neurons with the cytochrome-oxidase thin stripes. Little color-biased activity was found in V3 and V3a, areas specialized for other visual functions including stereopsis (adams and Zeki 2001; Tsao and others 2003). anterior to V4, color-biased activity was found in reproducible “globs” scattered throughout the PIT. Single-unit micro-electrodes were then used to target globs and interglobs (Fig. 8B,C). a large battery of colors was used to asses the color tuning. The colors spanned color space (red-orange-yellow-green-cyan-blue-purple). Three sets of colors were used: One set was equiluminant with the neutral background; one set was higher luminance than the background; and one set was lower luminance than the background. This enabled us to determine the degree to which neurons were not only color tuned but also tolerant to changes in luminance. The overwhelming majority of glob cells had luminance-invariant color tuning, whereas most cells in the interglobs did not. Both glob and interglob cells were often orientation tuned, although interglob cells were more so. Neither population was sensitive to the direction of stimulus motion. These results reinforce the notion that different extrastriate areas are specialized at least to some extent for different visual functions.
although neurons tuned to all directions in color space were found, the population distribution was not uniform, and is markedly different from that obtained in LgN or V1 (Fig. 9). The population distribution contains three prominent peaks (Stoughton and Conway 2008). The largest peak aligns with red; the second largest, with green; and the third, with blue; the distribution also includes a bulge that peaks in the yellow. These peaks are roughly consistent with unique colors identified by human subjects. The three prominent peaks also correspond to the three most saturated colors in the stimulus set, and the size of each of the peaks corresponds to the relative saturations of the hues, suggesting that both hue and saturation are represented by relative number of glob cells. The relative size of each of the peaks also corresponds to the frequency with which these color terms is adopted by language: red is adopted first, then yellow or green, followed by blue (Berlin and Kay 1969). These results represent, to our knowledge, the closest explicit neural representation of unique colors in the primate brain.
The globs represent the next stage beyond V2 in the hierarchy of color processing. Interestingly, anatomical studies have shown that V2 thin stripes send projections to large patches within the PIT cortex (Zeki and Shipp 1989; DeYoe and others 1994; Felleman and others 1997; Xiao and others 1999); we hypothesize that these patches coincide with the globs. Taken together, these results reconcile the conflicting

Color Vision, Cones, and Color-Coding / Conway 287
conclusions regarding color processing in and around V4: Reports asserting that V4 is specialized for color (Zeki 1973; Kusunoki and others 2006) probably targeted globs, whereas reports denying V4 color specialization likely recorded from inter-globs.
Anterior Color Areas: Integrating Color and Behavior
at some stage, color signals must interface with behav-ioral programs. The prefrontal cortex is thought to be important in decision making and has strong reciprocal connections with the anterior inferior temporal (IT) cortex (Webster and others 1994), the final stage of the color pathway. In a seminal single-unit recording study, Komatsu (Komatsu and others 1992) discovered pock-ets of color-tuned neurons in the IT cortex. These pock-ets of color-selective IT neurons are even visible with fMRI (Conway and others 2007). Komatsu and his col-leagues have now gone one step further to show that the activity of these neurons is influenced by the behavioral tasks performed by the animal during stimulus presen-tation (Koida and Komatsu 2007) and that the patterns of activity of color-tuned IT cells predict color discrimi-nation in behavioral tasks (Matsumora and others 2008) (Fig. 10). Presumably the globs connect to the pockets of IT color-tuned neurons, although this remains unknown. There are many other questions remaining, for example: What are the cellular computations that bring about the color tuning of a single cell? Which neurons or groups of neurons are necessary and suffi-cient for color perception? How can we account for the profound effect of scene complexity on color percep-tion? Is the behavioral modulation of IT neuronal activ-ity a cause or a consequence of behavior? What mediates the strong interaction between luminance edges and color? How is color bound with motion and form to bring about a cohesive visual experience? Finally, we have developed a feed-forward heuristic, but it is known that all cortical areas are richly connected by feedback; What is the role of feedback in color processing?
Conclusion
Color processing involves a series of hierarchical steps that begin in the retina with the three classes of cones (Fig. 11). Cone activity is compared by specialized cone-opponent retinal ganglion cells, establishing the basis for color opponency; these color signals are transmitted through the LgN to V1. V1 employs spe-cialized double-opponent neurons, which compare cone-opponent responses across visual space to com-pute color contrast and color constancy. Color cells in the LgN and V1 are restricted to color tuning along two color axes, roughly red-cyan and blue-yellow. V1 color cells are clustered within cytochrome-oxidase
blobs; the blobs project to the cytochrome-oxidase thin stripes of V2, which in turn project to “globs” in PIT. The color tuning of the population of glob cells is biased toward red, green, blue, and to some extent yel-low, the four unique hues. The final stage of color processing takes place in the IT cortex, which inter-faces with behavioral programs that presumably help shape decision making.
Acknowledgments
This work was funded by the Whitehall Foundation. I am grateful to David Hubel and alexandra Smolyanskaya for comments on the manuscript, and to Beau Lotto for Figure 2 (top).
References
abrams aB, Hillis JM, Brainard DH. 2007. The relation between color discrimination and color constancy: when is optimal adaptation task dependent? Neural Comput 19(10):2610–37.
adams DL, Zeki S. 2001. Functional organization of macaque V3 for stereoscopic depth. J Neurophysiol 86(5):2195–203.
attrill MJ, gresty Ka, Hill Ra, Barton Ra. 2008. Red shirt colour is associated with long-term team success in english football. J Sports Sci 26(6):577–82.
Berlin B, Kay P. 1969. Basic color terms: their universality and evolution. Berkeley: University of California Press.
Bosten JM, Robinson JD, Jordan g, Mollon JD. 2005. Multidimensional scaling reveals a color dimension unique to ‘color-deficient’ observers. Curr Biol 15(23):R950–2.
Boussaoud D, Desimone R, Ungerleider Lg. 1991. Visual topography of area TeO in the macaque. J Comp Neurol 306(4):554–75.
Bowmaker JK. 2008. evolution of vertebrate visual pigments. Vision Res 48(20)2022–41.
Bowmaker JK, Hunt DM. 2006. evolution of vertebrate visual pigments. Curr Biol 16(13):R484–9.
Brewer aa, Press Wa, Logothetis NK, Wandell Ba. 2002. Visual areas in macaque cortex measured using func-tional magnetic resonance imaging. J Neurosci 22(23):10416–26.
Buzas P, Blessing eM, Szmajda Ba, Martin PR. 2006. Specificity of M and L cone inputs to receptive fields in the parvocellular pathway: random wiring with functional bias. J Neurosci 26(43):11148–61.
Caine Ng, Mundy NI. 2000. Demonstration of a foraging advantage for trichromatic marmosets (Callithrix geoffroyi) dependent on food colour. Proc Biol Sci 267(1442):439–44.
Caywood MS, Willmore B, Tolhurst DJ. 2004. Independent components of color natural scenes resemble V1 neurons in their spatial and color tuning. J Neurophysiol 91(6):2859–73.
Changizi Ma, Zhang Q, Shimojo S. 2006. Bare skin, blood and the evolution of primate colour vision. Biol Lett 2(2):217–21.
288 The Neuroscientist / Vol. 15, No. 3, June 2009
Chatterjee S, Callaway eM. 2003. Parallel colour-opponent pathways to primary visual cortex. Nature 426(6967): 668–71.
Chichilnisky eJ, Baylor Da. 1999. Receptive-field micro-structure of blue-yellow ganglion cells in primate retina. Nat Neurosci 2(10):889–93.
Conway BR. 2001. Spatial structure of cone inputs to color cells in alert macaque primary visual cortex (V-1). J Neurosci 21(8):2768–83.
Conway BR. 2003. Colour vision: a clue to hue in V2. Curr Biol 13(8):R308–10.
Conway BR. 2007. Color vision: mice see hue too. Curr Biol 17(12):R457–60.
Conway BR, Hubel DH, Livingstone MS. 2002. Color con-trast in macaque V1. Cereb Cortex 12(9):915–25.
Conway BR, Livingstone MS. 2002. The neural basis for colour vision. In: Nadel L, editor. encyclopedia of cogni-tive science. London: Nature Publishing group. p 568–76.
Conway BR, Livingstone MS. 2005. a different point of hue. Proc Natl acad Sci U S a 102(31):10761–2.
Conway BR, Livingstone M. 2006a. Reverse correlation methods. In: Heckenlively JR, arden gB, editors. Principles and practice of clinical electrophysiology. 2nd ed. Boston: MIT Press: 461-71.
Conway BR, Livingstone MS. 2006b. Spatial and temporal properties of cone signals in alert macaque primary visual cortex. J Neurosci 26(42):10826–46.
Conway BR, Moeller S, Tsao DY. 2007. Specialized color modules in macaque extrastriate cortex. Neuron 56(3):560–73.
Conway BR, Tsao DY. 2006. Color architecture in alert macaque cortex revealed by FMRI. Cereb Cortex 16(11):1604–13.
Curcio Ca, allen Ka, Sloan KR, Lerea CL, Hurley JB, Klock IB, and others. 1991. Distribution and morphology of human cone photoreceptors stained with anti-blue opsin. J Comp Neurol 312(4):610–24.
Dacey DM, Lee BB. 1994. The ‘blue-on’ opponent pathway in primate retina originates from a distinct bistratified ganglion cell type. Nature 367(6465):731–5.
Dacey DM, Packer OS. 2003. Colour coding in the primate retina: diverse cell types and cone-specific circuitry. Curr Opin Neurobiol 13(4):421–7.
Danilova MV, Mollon JD. 2006. The comparison of spatially separated colours. Vision Res 46(6–7):823–36.
Daw N. 1968. goldfish retina: organization for simultaneous color contrast. Science 158:942–4.
De Valois RL, De Valois KK. 1993. a multi-stage color model. Vision Res 33(8):1053–65.
De Valois RL, Smith CJ, Kitai ST, Karoly aJ. 1958. Response of single cells in monkey lateral geniculate nucleus to monochromatic light. Science 127:238–9.
Derrington aM, Krauskopf J, Lennie P. 1984. Chromatic mechanisms in lateral geniculate nucleus of macaque. J Physiol 357:241–65.
DeYoe ea, Felleman DJ, Van essen DC, McClendon e. 1994. Multiple processing streams in occipitotemporal visual cortex. Nature 371(6493):151–4. [erratum appears in Nature 1994 Oct 27;371(6500):812].
Doi e, Inui T, Lee TW, Wachtler T, Sejnowski TJ. 2003. Spatiochromatic receptive field properties derived from information-theoretic analyses of cone mosaic responses to natural scenes. Neural Comput 15(2):397–417.
engel S, Zhang X, Wandell B. 1997. Colour tuning in human visual cortex measured with functional magnetic reso-nance imaging. Nature 388(6637):68–71.
engel Sa. 2005. adaptation of oriented and unoriented color-selective neurons in human visual areas. Neuron 45(4):613–23.
engles M, Wooten B, Hammond B. 2007. Macular pigment: a test of the acuity hypothesis. Invest Ophthalmol Vis Sci 48(6): 2922–31.
Felleman DJ, Xiao Y, McClendon e. 1997. Modular organiza-tion of occipito-temporal pathways: cortical connections between visual area 4 and visual area 2 and posterior inferotemporal ventral area in macaque monkeys. J Neurosci 17(9):3185–200.
Fernandez aa, Morris MR. 2007. Sexual selection and trichromatic color vision in primates: statistical support for the preexisting-bias hypothesis. am Nat 170(1):10–20.
Field gD, Sher a, gauthier JL, greschner M, Shlens J, Litke aM, and others. 2007. Spatial properties and functional organization of small bistratified ganglion cells in primate retina. J Neurosci 27(48):13261–72.
Fize D, Vanduffel W, Nelissen K, Denys K, Chef d’Hotel C, Faugeras O, and others. 2003. The retinotopic organization of primate dorsal V4 and surrounding areas: a functional magnetic resonance imaging study in awake monkeys. J Neurosci 23(19):7395–406.
gegenfurtner KR. 2003. Cortical mechanisms of colour vision. Nat Rev Neurosci 4(7):563–72.
gegenfurtner KR, Kiper DC. 2003. Color vision. annu Rev Neurosci 26:181–206.
gegenfurtner KR, Rieger J. 2000. Sensory and cognitive con-tributions of color to the recognition of natural scenes. Curr Biol 10(13):805–8.
giulianini F, eskew RT Jr. 2007. Theory of chromatic noise masking applied to testing linearity of S-cone detection mechanisms. J Opt Soc am a Opt Image Sci Vis 24(9):2604–21.
gouras P, Kruger J. 1979. Responses of cells in foveal visual cortex of the monkey to pure color contrast. J Neurophysiol 42(3):850-60.
gur M. 1989. Color and brightness fade-out in the ganzfeld is wavelength dependent. Vision Res 29(10): 1335–41.
Hagstrom Sa, Neitz M, Neitz J. 2000. Cone pigment gene expression in individual photoreceptors and the chro-matic topography of the retina. J Opt Soc am a Opt Image Sci Vis 17(3):527–37.
Hansen T, Walter S, gegenfurtner KR. 2007. effects of spa-tial and temporal context on color categories and color constancy. J Vis 7(4)(2):1–15.
Hardin CL, Maffi L. 1997. Color categories in thought and language. Cambridge (UK): University of Cambridge Press.
Hofer H, Carroll J, Neitz J, Neitz M, Williams DR. 2005a. Organization of the human trichromatic cone mosaic. J Neurosci 25(42):9669–79.
Color Vision, Cones, and Color-Coding / Conway 289
Hofer H, Singer B, Williams DR. 2005b. Different sensations from cones with the same photopigment. J Vis 5(5):444–54.
Horwitz gD, albright TD. 2005. Paucity of chromatic linear motion detectors in macaque V1. J Vis 5(6):525–33.
Horwitz gD, Chichilnisky eJ, albright TD. 2005. Blue-yellow signals are enhanced by spatiotemporal luminance con-trast in macaque V1. J Neurophysiol 93(4):2263–78.
Horwitz gD, Chichilnisky eJ, albright TD. 2007. Cone inputs to simple and complex cells in V1 of awake macaque. J Neurophysiol 97(4):3070–81.
Hoyer PO, Hyvarinen a. 2000. Independent component analysis applied to feature extraction from colour and stereo images. Network 11(3):191–210.
Hubel DH, Livingstone MS. 1985. Complex-unoriented cells in a subregion of primate area 18. Nature 315(6017):325–7.
Hubel DH, Livingstone MS. 1987. Segregation of form, color, and stereopsis in primate area 18. J Neurosci 7(11):3378–415.
Hubel DH, Livingstone MS. 1990. Color and contrast sensi-tivity in the lateral geniculate body and primary visual cortex of the macaque monkey. J Neurosci 10(7):2223–37.
Hunt DM, Dulai KS, Bowmaker JK, Mollon JD. 1995. The chemistry of John Dalton’s color blindness. Science 267(5200):984–8.
Hurlbert a, Wolf K. 2004. Color contrast: a contributory mechanism to color constancy. Prog Brain Res 144:147–60.
Hurlbert aC, Ling Y. 2007. Biological components of sex dif-ferences in color preference. Curr Biol 17(16):R623–5.
Hurvich LM. 1981. Color vision. Sunderland (Ma): Sinauer associates.
Jacobs gH, Williams ga, Cahill H, Nathans J. 2007. emergence of novel color vision in mice engineered to express a human cone photopigment. Science 315:1723–5.
Johnson eN, Hawken MJ, Shapley R. 2001. The spatial transformation of color in the primary visual cortex of the macaque monkey. Nat Neurosci 4(4):409–16.
Johnson eN, Hawken MJ, Shapley R. 2004. Cone inputs in macaque primary visual cortex. J Neurophysiol 91(6):2501–14.
Jordan g, Mollon JD. 1993. a study of women heterozygous for colour deficiencies. Vision Res 33(11):1495–508.
Kentridge RW, Heywood Ca, Weiskrantz L. 2007. Color con-trast processing in human striate cortex. Proc Natl acad Sci U S a 104(38):15129–31.
Kiper DC, Fenstemaker SB, gegenfurtner KR. 1997. Chromatic properties of neurons in macaque area V2. Vis Neurosci 14(6):1061–72.
Koida K, Komatsu H. 2007. effects of task demands on the responses of color-selective neurons in the inferior tem-poral cortex. Nat Neurosci 10(1):108–16.
Komatsu H, Ideura Y, Kaji S, Yamane S. 1992. Color selectiv-ity of neurons in the inferior temporal cortex of the awake macaque monkey. J Neurosci 12(2):408–24.
Kusunoki M, Moutoussis K, Zeki S. 2006. effect of back-ground colors on the tuning of color-selective cells in monkey area V4. J Neurophysiol 95(5):3047–59.
Land eH. 1977. The retinex theory of color vision. Sci am 237(6):108–28.
Lee BB. 1996. Receptive field structure in the primate retina. Vision Res 36(5):631–44.
Lennie P. 2000. Color vision. In: Kandel eR, Schwartz JH, Jessel TM, editors. Principles of neural science. 4th ed. Columbus (OH): Mcgraw Hill.
Lennie P, Krauskopf J, Sclar g. 1990. Chromatic mecha-nisms in striate cortex of macaque. J Neurosci 10(2):649–69.
Lennie P, Movshon Ja. 2005. Coding of color and form in the geniculostriate visual pathway. J Opt Soc am a Opt Image Sci Vis 22(10):2013–33.
Ling Y, Hurlbert a. 2008. Role of color memory in successive color constancy. J Opt Soc am a Opt Image Sci Vis 25(6):1215–26.
Livingstone M, Hubel D. 1988. Segregation of form, color, movement, and depth: anatomy, physiology, and percep-tion. Science 240(4853):740–9.
Livingstone MS, Hubel DH. 1984. anatomy and physiology of a color system in the primate visual cortex. J Neurosci 4(1):309–56.
Lu HD, Roe aW. 2008. Functional organization of color domains in V1 and V2 of macaque monkey revealed by optical imaging. Cereb Cortex 18(3):516–33.
Masland RH. 2001. The fundamental plan of the retina. Nat Neurosci 4(9):877–86.
Matsumora T, Koida K, Komatsu H. 2008. Relationship between color discrimination and neural responses in the inferior temporal cortex of the monkey. J Neurophysiol 100(6):3361–74.
Melin aD, Fedigan LM, Hiramatsu C, Sendall CL, Kawamura S. 2007. effects of colour vision phenotype on insect capture by a free-ranging population of white-faced capuchins, Cebus capucinus. anim Behav 73(1): 205–14.
Morgan MJ, adam a, Mollon JD. 1992. Dichromats detect colour-camouflaged objects that are not detected by trichromats. Proc Biol Sci 248(1323):291–5.
Moutoussis K, Zeki S. 2002. Responses of spectrally selective cells in macaque area V2 to wavelengths and colors. J Neurophysiol 87(4):2104–12.
Nathans J. 1999. The evolution and physiology of human color vision: insights from molecular genetic studies of visual pigments. Neuron 24(2):299–312.
Neitz J, Carroll J, Yamauchi Y, Neitz M, Williams DR. 2002. Color perception is mediated by a plastic neural mecha-nism that is adjustable in adults. Neuron 35(4): 783–92.
Neitz J, Neitz M, Kainz PM. 1996. Visual pigment gene struc-ture and the severity of color vision defects. Science 274(5288):801–4.
Reeves aJ, amano K, Foster DH. 2008. Color constancy: phenomenal or projective? Percept Psychophys 70(2):219–28.
Regan BC, Julliot C, Simmen B, Vienot F, Charles-Dominique P, Mollon JD. 2001. Fruits, foliage and the evolution of primate colour vision. Philos Trans R Soc Lond B Biol Sci 356(1407):229–83.
Regier T, Kay P, Cook RS. 2005. Focal colors are universal after all. Proc Natl acad Sci U S a 102(23):8386–91.
290 The Neuroscientist / Vol. 15, No. 3, June 2009
Reid RC, Shapley RM. 2002. Space and time maps of cone photoreceptor signals in macaque lateral geniculate nucleus. J Neurosci 22(14):6158–75.
Roe aW, Ts’o DY. 1999. Specificity of color connectivity between primate V1 and V2. J Neurophysiol 82(5):2719–30.
Roorda a, Williams DR. 1999. The arrangement of the three cone classes in the living human eye. Nature 397(6719):520–2.
Rowe C, Harris JM, Roberts SC. 2005. Sporting contests: seeing red? Putting sportswear in context. Nature 437(7063):e10.
Russell R, Sinha P. 2007. Real-world face recognition: the importance of surface reflectance properties. Perception 36(9):1368–74.
Schiller PH. 1996. On the specificity of neurons and visual areas. Behav Brain Res 76(1–2):21–35.
Shapley R, Hawken M. 2002. Neural mechanisms for color perception in the primary visual cortex. Curr Opin Neurobiol 12(4):426–32.
Shevell SK, Kingdom Fa. 2008. Color in complex scenes. annu Rev Psychol 59:143-66.
Shipp S, Zeki S. 2002. The functional organization of area V2, I: specialization across stripes and layers. Vis Neurosci 19(2):187–210.
Sincich LC, Horton JC. 2002. Divided by cytochrome oxi-dase: a map of the projections from V1 to V2 in macaques. Science 295(5560):1734–7.
Sincich LC, Horton JC. 2005. The circuitry of V1 and V2: integration of color, form, and motion. annu Rev Neurosci 28:303–26.
Smith aC, Buchanan-Smith HM, Surridge aK, Osorio D, Mundy NI. 2003. The effect of colour vision status on the detection and selection of fruits by tamarins (Saguinus spp.). J exp Biol 206(Pt 18):3159–65.
Solomon Sg, Lee BB, White aJ, Ruttiger L, Martin PR. 2005. Chromatic organization of ganglion cell receptive fields in the peripheral retina. J Neurosci 25(18): 4527–39.
Solomon Sg, Lennie P. 2005. Chromatic gain controls in visual cortical neurons. J Neurosci 25(19):4779–92.
Solomon Sg, Peirce JW, Lennie P. 2004. The impact of sup-pressive surrounds on chromatic properties of cortical neurons. J Neurosci 24(1):148–60.
Stockman a, Plummer DJ. 2005. Long-wavelength adapta-tion reveals slow, spectrally opponent inputs to the human luminance pathway. J Vis 5(9):702–16.
Stoner Ke, Riba-Hernandez P, Lucas PW. 2005. Comparative use of color vision for frugivory by sympatric species of platyrrhines. am J Primatol 67(4):399–409.
Stoughton CM, Conway BR. 2008. Neural basis for unique hues. Curr Biol 18(16):R698–9.
Stringham JM, Hammond BR, Wooten BR, Snodderly DM. 2006. Compensation for light loss resulting from filtering by macular pigment: relation to the S-cone pathway. Optom Vis Sci 83(12):887–94.
Tailby C, Solomon Sg, Lennie P. 2008. Functional asymme-tries in visual pathways carrying S-cone signals in macaque. J Neurosci 28(15):4078–87.
Tailor DR, Finkel LH, Buchsbaum g. 2000. Color-opponent receptive fields derived from independent component analysis of natural images. Vision Res 40(19):2671–6.
Tootell RB, Nelissen K, Vanduffel W, Orban ga. 2004. Search for color ‘center(s)’ in macaque visual cortex. Cereb Cortex 14(4):353–63.
Tootell RB, Silverman MS, Hamilton SL, De Valois RL, Switkes e. 1988. Functional anatomy of macaque striate cortex. III. Color. J Neurosci 8(5):1569–93.
Tsao DY, Vanduffel W, Sasaki Y, Fize D, Knutsen Ta, Mandeville JB, and others. 2003. Stereopsis activates V3a and caudal intraparietal areas in macaques and humans. Neuron 39(3):555–68.
Vakrou C, Whitaker D, Mcgraw PV, McKeefry D. 2005. Functional evidence for cone-specific connectivity in the human retina. J Physiol 566(Pt 1):93–102.
Vladusich T. 2007. Chromatic aberration and the roles of double-opponent and color-luminance neurons in color vision. Neural Netw 20(2):153–5.
Vogel eR, Neitz M, Dominy NJ. 2007. effect of color vision phenotype on the foraging of wild white-faced capuchins, Cebus capucinus. Behav ecol 18:292–7.
Wachtler T, Sejnowski TJ, albright TD. 2003. Representation of color stimuli in awake macaque primary visual cortex. Neuron 37(4):681–91.
Webster Ma, Miyahara e, Malkoc g, Raker Ve. 2000. Variations in normal color vision. II. Unique hues. J Opt Soc am a Opt Image Sci Vis 17(9):1545–55.
Webster MJ, Bachevalier J, Ungerleider Lg. 1994. Connections of inferior temporal areas TeO and Te with parietal and frontal cortex in macaque monkeys. Cereb Cortex 4(5):470–83.
Whitehead aJ, Mares Ja, Danis RP. 2006. Macular pigment: a review of current knowledge. arch Ophthalmol 124(7):1038–45.
Wiesel TN, Hubel DH. 1966. Spatial and chromatic interac-tions in the lateral geniculate body of the rhesus monkey. J Neurophysiol 29:1115–56.
Wuerger SM, atkinson P, Cropper S. 2005. The cone inputs to the unique-hue mechanisms. Vision Res 45(25–26):3210–23.
Xiao Y, Wang Y, Felleman DJ. 2003. a spatially organized representation of colour in macaque cortical area V2. Nature 421:535–9.
Xiao Y, Zych a, Felleman DJ. 1999. Segregation and conver-gence of functionally defined V2 thin stripe and interstripe compartment projections to area V4 of macaques. Cereb Cortex 9(8):792–804.
Zeki S. 1993. a vision of the brain. Cambridge (Ma): Blackwell Scientific.
Zeki S. 1996. are areas TeO and PIT of monkey visual cortex wholly distinct from the fourth visual complex (V4 com-plex)? Proc R Soc Lond B Biol Sci 263(1376):1539–44.
Zeki S, Shipp S. 1989. Modular connections between areas V2 and V4 of macaque monkey visual cortex. eur J Neurosci 1(5):494–506.
Zeki SM. 1973. Colour coding in rhesus monkey prestriate cortex. Brain Res 53(2):422–7.