column major pattern: how users process spatially fixed...
TRANSCRIPT

Column Major Pattern: How Users Process Spatially Fixed Itemson Large, Tiled Displays
Anton SigitovBonn-Rhein-Sieg Univ. of Applied Sciences
Sankt Augustin, [email protected]
Oliver StaadtUniversity of RostockRostock, Germany
André HinkenjannBonn-Rhein-Sieg Univ. of Applied Sciences
Sankt Augustin, [email protected]
Ernst KruijffBonn-Rhein-Sieg Univ. of Applied Sciences
Sankt Augustin, [email protected]
ABSTRACTLarge, high-resolution displays demonstrated their effectiveness inlab settings for cognitively demanding tasks in single user and col-laborative scenarios. The effectiveness is mostly reached throughinherent displays’ properties - large display real estate and highresolution - that allow for visualization of complex datasets, andsupport of group work and embodied interaction. To raise users’efficiency, however, more sophisticated user support in the form ofadvanced user interfaces might be needed. For that we need pro-found understanding of how large, tiled displays impact users workand behavior. We need to extract behavioral patterns for differenttasks and data types. This paper reports on study results of howusers, while working collaboratively, process spatially fixed itemson large, tiled displays. The results revealed a recurrent patternshowing that users prefer to process documents column wise ratherthan row wise or erratic.
CCS CONCEPTS•Human-centered computing→User studies;Empirical stud-ies in HCI;
KEYWORDSFixed spatial data; Information interaction; Tiled displays; Co-locatedwork; User Study
ACM Reference Format:Anton Sigitov, Oliver Staadt, André Hinkenjann, and Ernst Kruijff. 2018.Column Major Pattern: How Users Process Spatially Fixed Items on Large,Tiled Displays. In CHIIR ’18: 2018 Conference on Human Information Interac-tion & Retrieval, March 11–15, 2018, New Brunswick, NJ, USA. ACM, NewYork, NY, USA, 4 pages. https://doi.org/10.1145/3176349.3176870
Permission to make digital or hard copies of all or part of this work for personal orclassroom use is granted without fee provided that copies are not made or distributedfor profit or commercial advantage and that copies bear this notice and the full citationon the first page. Copyrights for components of this work owned by others than ACMmust be honored. Abstracting with credit is permitted. To copy otherwise, or republish,to post on servers or to redistribute to lists, requires prior specific permission and/or afee. Request permissions from [email protected] ’18, March 11–15, 2018, New Brunswick, NJ, USA© 2018 Association for Computing Machinery.ACM ISBN 978-1-4503-4925-3/18/03. . . $15.00https://doi.org/10.1145/3176349.3176870
1 INTRODUCTIONLarge display environments like high-resolution, tiled displays arehighly suitable for co-located collaboration. The enlarged displayreal estate provides enough room to accommodate synchronousactivities of multiple users. While approaching complex tasks, userscan fluidly adjust the tightness of collaboration through allocation,shifting, merging, and splitting of physical and virtual workspaceareas. The vast number of pixels allows for visualization of complexdatasets making it possible to display high-resolution details inthe context of an overview. Promoting embodied interaction bymeans of physical navigation and gestures, the displays enable (a)establishment and maintenance of correspondences between users’spatial position/orientation and visualized data elements, (b) the useof virtual and physical landmarks for objects finding, as well as (c)increasing of workspace awareness for better work coordination [1,8]. Finally, systems incorporating large displays often implement awhiteboard or tabletop metaphor with novel interaction techniquesand devices to resemble well-known collaboration principles usedin real-life communication [6, 12].
Yet, datasets continue to grow in all application domains makinganalysis and sense making tasks even more complex, while displays’size and pixel density reach the limits of humans’ visual acuity. Thisraises the need for new approaches of user support. One possibilityto ensure such support is to improve user interfaces. For instance,intelligent user interfaces [10] driven by an artificial intelligencecould be utilized. These interfaces will understand user activitiesin the context of the task and predict users’ intentions. Based onthe prediction, the system can pre-calculate complex visualizations,load necessary data, or pre-calculate possible next steps of the userand execute them beforehand. To build better interfaces for large,tiled displays, however, we need to acquire understanding of howsuch displays and their properties (e.g. display size, bezels, curva-ture, etc.) affect users’ work, users’ behavior, and user-informationinteraction.
In our study, we observed users working collaboratively on fixed-position data in front of a large, tiled display. Among other find-ings, we detected a virtual navigation pattern of how users processspatially fixed items. The analysis revealed that users navigatedsignificantly more often column wise in comparison to row wiseor erratic navigation. We believe this insight might help softwareengineers to implement better intelligent interfaces.
2 RELATEDWORKIn this section we provide a brief overview of related studies thatinvestigated effects of large, tiled displays on users’ effectiveness,efficiency, and behavior.
Ball et. al [3] investigated what effect different display sizeshave on users’ behavior and task performance. They found thatincreased display size caused increase in physical navigation andbetter performance time, thus having impact on users’ behavior.
Andrews et. al [1] compared how users conduct a sense makingtask in front of large, tiled displays and in front of a common desktopdisplay. They observed that users made extensive use of space formanagement of documents and applications.
Liu et. al [9] investigated what effects display size and naviga-tion type have on a classification task. They compared physicalnavigation in front of a large display with virtual navigation ona common desktop display. The study revealed that desktop dis-plays are more suitable for easy tasks, while large, high-resolutiondisplays is significantly more efficient for difficult tasks.
Bi et. al [4] investigated effects of tiled display interior bezels onuser performance and behavior by visual search, straight-tunnelsteering, and target selection tasks. Three types of large displayswere simulated and compared with each other: 1x1 - display with nointerior tiles; 2x2 - large, tiled display consisting of four 40" displayunits; 3x3 - large, tiled display consisting of nine 26" display units.They found that interior bezels did not have impact on visual search,and target selection performance. Both tasks utilized fixed-positionitems. On the other hand, interior bezels hindered straight-tunnelsteering performance and affected steering behavior.Moreover, theyobserved that users tend to apply a grid-by-grid search strategy, asan entire surface was divided into grids.
Wallace et. al [15] investigated how bezels impact magnitudejudgement, an important aspect of perception especially for ap-plications with spatially fixed data. They detected an increase injudgement error for conditions where bezels were wider that 0.5 cm.In a subsequent study, Wallace et. al [14] investigated how the pres-ence and width of interior bezels impacts visual search performanceacross tiled displays. They could not detect significant differences invisual search time, though, they found that participants were moreaccurate in test conditions where targets were split across a bezel.They hypothesized that this improved performance was ascribed toa change in the user’s behavior: the participants performed moreaccurate two-phase search.
Ball and North [2] observed and analyzed users’ actions in frontof a high-resolution tiled display. They detected that most usershave found bezels inconvenient and irritating. Yet, users tendedto use bezels to partition the display into regions with specificsemantics and dedicated these regions for certain applications.
There are several other studies that investigated effects of large,high-resolution displays on users’ performance at different tasks(e.g. [13, 16]). In our study, however, we were more interestedin how users interact with data so we could extract behavioralpatterns. Such behavioral patterns might be useful for improvinguser interfaces that in a trivial case will provide a more thorougharrangement of visual elements, and in an advanced case will beable to predict users’ next move.
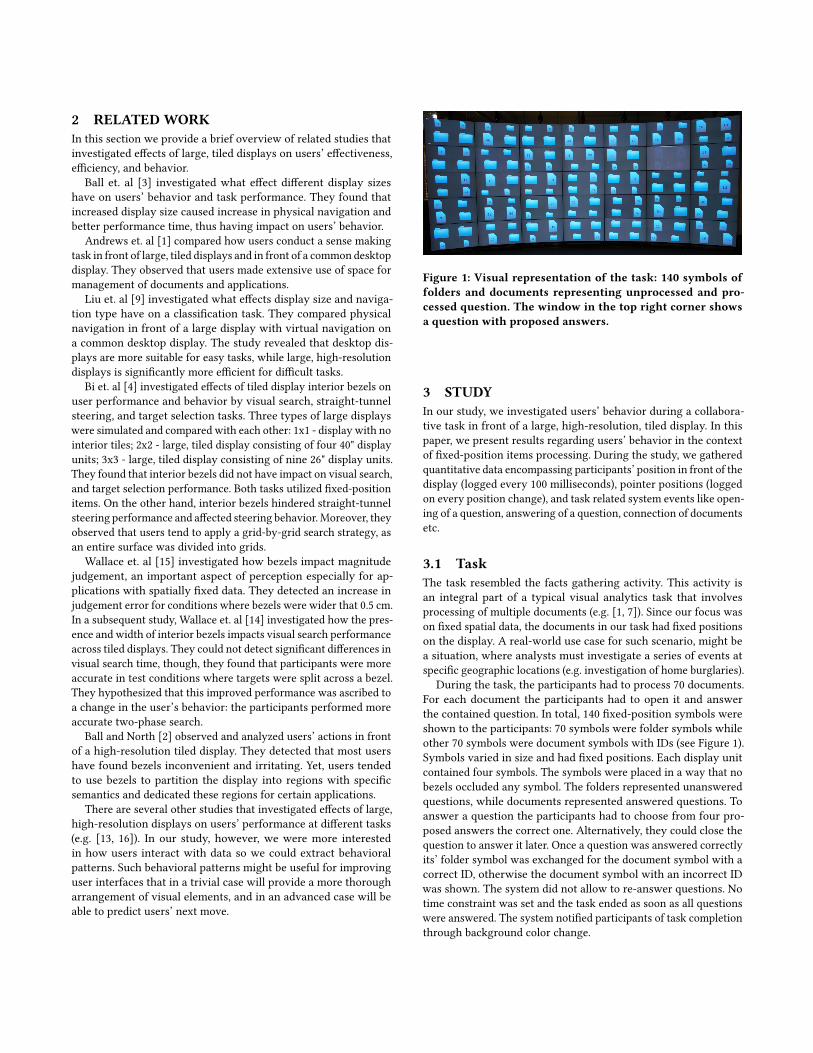
Figure 1: Visual representation of the task: 140 symbols offolders and documents representing unprocessed and pro-cessed question. The window in the top right corner showsa question with proposed answers.
3 STUDYIn our study, we investigated users’ behavior during a collabora-tive task in front of a large, high-resolution, tiled display. In thispaper, we present results regarding users’ behavior in the contextof fixed-position items processing. During the study, we gatheredquantitative data encompassing participants’ position in front of thedisplay (logged every 100 milliseconds), pointer positions (loggedon every position change), and task related system events like open-ing of a question, answering of a question, connection of documentsetc.
3.1 TaskThe task resembled the facts gathering activity. This activity isan integral part of a typical visual analytics task that involvesprocessing of multiple documents (e.g. [1, 7]). Since our focus wason fixed spatial data, the documents in our task had fixed positionson the display. A real-world use case for such scenario, might bea situation, where analysts must investigate a series of events atspecific geographic locations (e.g. investigation of home burglaries).
During the task, the participants had to process 70 documents.For each document the participants had to open it and answerthe contained question. In total, 140 fixed-position symbols wereshown to the participants: 70 symbols were folder symbols whileother 70 symbols were document symbols with IDs (see Figure 1).Symbols varied in size and had fixed positions. Each display unitcontained four symbols. The symbols were placed in a way that nobezels occluded any symbol. The folders represented unansweredquestions, while documents represented answered questions. Toanswer a question the participants had to choose from four pro-posed answers the correct one. Alternatively, they could close thequestion to answer it later. Once a question was answered correctlyits’ folder symbol was exchanged for the document symbol with acorrect ID, otherwise the document symbol with an incorrect IDwas shown. The system did not allow to re-answer questions. Notime constraint was set and the task ended as soon as all questionswere answered. The system notified participants of task completionthrough background color change.

Figure 2: Apparatus: a curved display built of 35 Full HD dis-plays with 7 tracking cameras on it that allow for trackingin front of the display within an area of around 20 squaremeters.
3.2 ApparatusThe study was performed at a large curved tiled display (henceforthdisplay) comprising 35 LCD displays (henceforth display units)ordered through a seven (column) by five (row) grid. Each columnhad a relative angle difference of 10 degrees along the Y-axis toadjacent columns, as such creating a slight curvature (see Figure2). Each display unit had a bezel of less than three millimeters,minimizing the visual rim effect. The displays units were 46" panelswith a 1080p resolution, resulting in a total of 72 megapixels.
We used an array of seven infrared cameras (see Figure 2) to-gether with head-worn helmets to track user positions within anarea of around 20 square meters directly in front of the display. Forinteraction purposes, two available smartphones (LG Nexus 5X andAcer Liquid E700) with similar performance characteristics wereutilized.
3.3 ParticipantsThe experiment was performed with 12 groups with two randomlyassigned participants each, aged between 18 and 39 years (M = 25.08;SD = 4.90), with normal or corrected-to-normal vision. There were11 female participants and 13 male participants. The participantswere paid for taking part in the experiment.
3.4 ResultsAt the beginning of the task, 2 out of 12 groups decided to worktightly and process the documents mutually. Both groups startedon a random display unit, switched, however, soon to the mostleft/right column, and proceeded the documents in a column bycolumn manner. Figure 3 (bottom) exemplifies the behavior, sincethe participants opened documents alternately the pointer positionmaps of individual users complement each other. The remaining10 out of 12 groups went for divide and conquer strategy, andpartitioned the display into the "left" and the "right" regions. Eachparticipant oversaw one region depending on his spatial positionrelative to the display and to the partner. No distinct boundariesbetween these two regions were observed.Within the region. Figure3 (top) depicts the behavior.
While participants proceeded with solving questions, we couldrecognize a recurrent behavior. Multiple participants tried to solveall questions inside one display unit before moving to the next one.
Figure 3: Logged pointers’ positions during OpenTask-Events, each line connects two consecutive events: (top) par-ticipants A (left) and B (right) working loosely; (bottom) par-ticipants A (left) and B (right) working tightly.
a
b
c d
Figure 4: Transition types: (a) direct vertical neighbor; (b) di-rect horizontal neighbor; (c) indirect neighbor; (d) jump.
Moreover, movement between display units was column oriented.For example, the participant started with the topmost display unitof the leftmost column, solved all the questions inside it, and movedthe pointer to the display unit beneath the current one. Workingin this manner the column was processed. Next, the participantmoved the pointer to the column on the right and continued in thesame manner, starting either again from the top or staying at thebottom and working upwards.
However, within the groups that worked loosely the workflowdid not last to the end of the task, but rather until participantsmet in the middle of the display. From there, participants eitherswitched the sides to answer the questions left by their partner, orstarted to work tightly-coupled and answered remained questionsmutually. To compare different strategies for virtual navigation welogged what documents on what display units and at what timewere opened. We classified each transition from one display unit toanother into four groups (see Figure 4):
• Direct vertical neighbor - the participant transitioned to adisplay unit direct above or beneath the current display unit.
• Direct horizontal neighbor - the participant transitioned toa display unit direct to the left or direct to the right of thecurrent display unit.
• Indirect neighbor - the participant transitioned to a diago-nally adjacent display unit.
• Jump - the participant transitioned to a non-adjacent displayunit.
To examine if there are any differences between occurrences ofindividual virtual navigation strategies, a Friedman test was carriedout. The result showed a significant difference, χ2(3)=40.269, p <0.001. Dunn-Bonferroni post hoc tests were carried out and revealedsignificant differences between the types: indirect neighbor andjump (p = 0.026), indirect neighbor and direct vertical neighbor (p
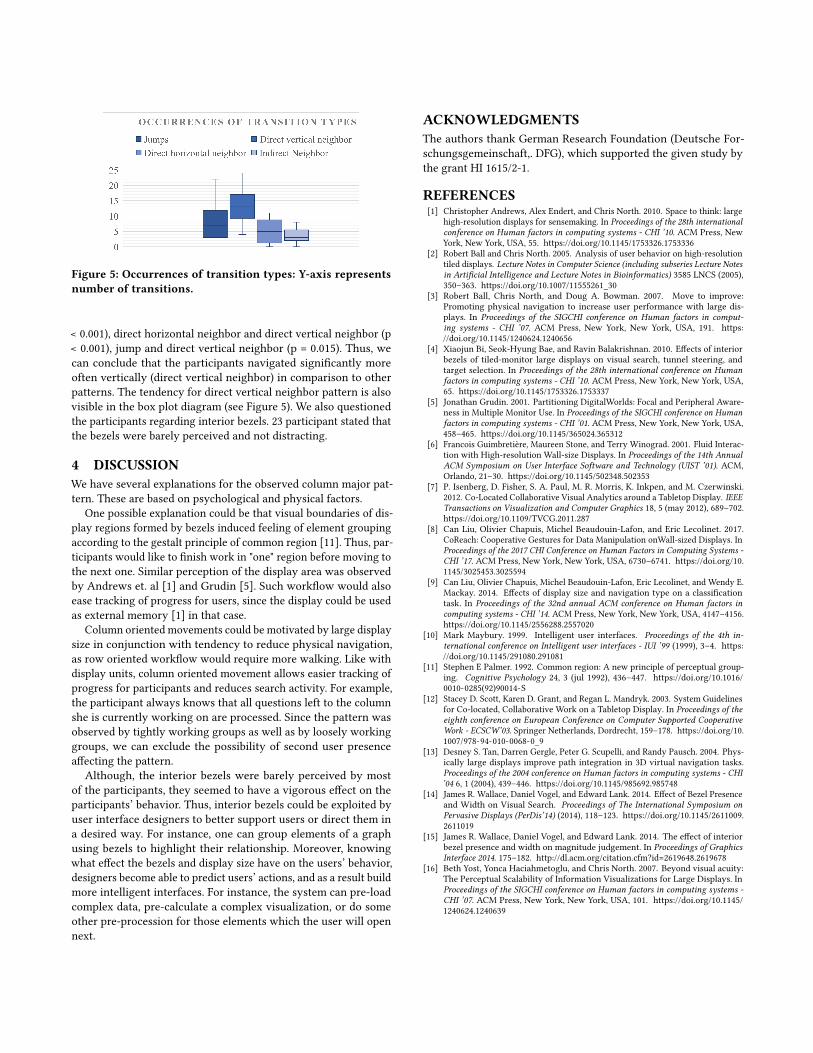
Figure 5: Occurrences of transition types: Y-axis representsnumber of transitions.
< 0.001), direct horizontal neighbor and direct vertical neighbor (p< 0.001), jump and direct vertical neighbor (p = 0.015). Thus, wecan conclude that the participants navigated significantly moreoften vertically (direct vertical neighbor) in comparison to otherpatterns. The tendency for direct vertical neighbor pattern is alsovisible in the box plot diagram (see Figure 5). We also questionedthe participants regarding interior bezels. 23 participant stated thatthe bezels were barely perceived and not distracting.
4 DISCUSSIONWe have several explanations for the observed column major pat-tern. These are based on psychological and physical factors.
One possible explanation could be that visual boundaries of dis-play regions formed by bezels induced feeling of element groupingaccording to the gestalt principle of common region [11]. Thus, par-ticipants would like to finish work in "one" region before moving tothe next one. Similar perception of the display area was observedby Andrews et. al [1] and Grudin [5]. Such workflow would alsoease tracking of progress for users, since the display could be usedas external memory [1] in that case.
Column oriented movements could be motivated by large displaysize in conjunction with tendency to reduce physical navigation,as row oriented workflow would require more walking. Like withdisplay units, column oriented movement allows easier tracking ofprogress for participants and reduces search activity. For example,the participant always knows that all questions left to the columnshe is currently working on are processed. Since the pattern wasobserved by tightly working groups as well as by loosely workinggroups, we can exclude the possibility of second user presenceaffecting the pattern.
Although, the interior bezels were barely perceived by mostof the participants, they seemed to have a vigorous effect on theparticipants’ behavior. Thus, interior bezels could be exploited byuser interface designers to better support users or direct them ina desired way. For instance, one can group elements of a graphusing bezels to highlight their relationship. Moreover, knowingwhat effect the bezels and display size have on the users’ behavior,designers become able to predict users’ actions, and as a result buildmore intelligent interfaces. For instance, the system can pre-loadcomplex data, pre-calculate a complex visualization, or do someother pre-procession for those elements which the user will opennext.
ACKNOWLEDGMENTSThe authors thank German Research Foundation (Deutsche For-schungsgemeinschaft,. DFG), which supported the given study bythe grant HI 1615/2-1.
REFERENCES[1] Christopher Andrews, Alex Endert, and Chris North. 2010. Space to think: large
high-resolution displays for sensemaking. In Proceedings of the 28th internationalconference on Human factors in computing systems - CHI ’10. ACM Press, NewYork, New York, USA, 55. https://doi.org/10.1145/1753326.1753336
[2] Robert Ball and Chris North. 2005. Analysis of user behavior on high-resolutiontiled displays. Lecture Notes in Computer Science (including subseries Lecture Notesin Artificial Intelligence and Lecture Notes in Bioinformatics) 3585 LNCS (2005),350–363. https://doi.org/10.1007/11555261_30
[3] Robert Ball, Chris North, and Doug A. Bowman. 2007. Move to improve:Promoting physical navigation to increase user performance with large dis-plays. In Proceedings of the SIGCHI conference on Human factors in comput-ing systems - CHI ’07. ACM Press, New York, New York, USA, 191. https://doi.org/10.1145/1240624.1240656
[4] Xiaojun Bi, Seok-Hyung Bae, and Ravin Balakrishnan. 2010. Effects of interiorbezels of tiled-monitor large displays on visual search, tunnel steering, andtarget selection. In Proceedings of the 28th international conference on Humanfactors in computing systems - CHI ’10. ACM Press, New York, New York, USA,65. https://doi.org/10.1145/1753326.1753337
[5] Jonathan Grudin. 2001. Partitioning DigitalWorlds: Focal and Peripheral Aware-ness in Multiple Monitor Use. In Proceedings of the SIGCHI conference on Humanfactors in computing systems - CHI ’01. ACM Press, New York, New York, USA,458–465. https://doi.org/10.1145/365024.365312
[6] Francois Guimbretière, Maureen Stone, and Terry Winograd. 2001. Fluid Interac-tion with High-resolution Wall-size Displays. In Proceedings of the 14th AnnualACM Symposium on User Interface Software and Technology (UIST ’01). ACM,Orlando, 21–30. https://doi.org/10.1145/502348.502353
[7] P. Isenberg, D. Fisher, S. A. Paul, M. R. Morris, K. Inkpen, and M. Czerwinski.2012. Co-Located Collaborative Visual Analytics around a Tabletop Display. IEEETransactions on Visualization and Computer Graphics 18, 5 (may 2012), 689–702.https://doi.org/10.1109/TVCG.2011.287
[8] Can Liu, Olivier Chapuis, Michel Beaudouin-Lafon, and Eric Lecolinet. 2017.CoReach: Cooperative Gestures for Data Manipulation onWall-sized Displays. InProceedings of the 2017 CHI Conference on Human Factors in Computing Systems -CHI ’17. ACM Press, New York, New York, USA, 6730–6741. https://doi.org/10.1145/3025453.3025594
[9] Can Liu, Olivier Chapuis, Michel Beaudouin-Lafon, Eric Lecolinet, and Wendy E.Mackay. 2014. Effects of display size and navigation type on a classificationtask. In Proceedings of the 32nd annual ACM conference on Human factors incomputing systems - CHI ’14. ACM Press, New York, New York, USA, 4147–4156.https://doi.org/10.1145/2556288.2557020
[10] Mark Maybury. 1999. Intelligent user interfaces. Proceedings of the 4th in-ternational conference on Intelligent user interfaces - IUI ’99 (1999), 3–4. https://doi.org/10.1145/291080.291081
[11] Stephen E Palmer. 1992. Common region: A new principle of perceptual group-ing. Cognitive Psychology 24, 3 (jul 1992), 436–447. https://doi.org/10.1016/0010-0285(92)90014-S
[12] Stacey D. Scott, Karen D. Grant, and Regan L. Mandryk. 2003. System Guidelinesfor Co-located, Collaborative Work on a Tabletop Display. In Proceedings of theeighth conference on European Conference on Computer Supported CooperativeWork - ECSCW’03. Springer Netherlands, Dordrecht, 159–178. https://doi.org/10.1007/978-94-010-0068-0_9
[13] Desney S. Tan, Darren Gergle, Peter G. Scupelli, and Randy Pausch. 2004. Phys-ically large displays improve path integration in 3D virtual navigation tasks.Proceedings of the 2004 conference on Human factors in computing systems - CHI’04 6, 1 (2004), 439–446. https://doi.org/10.1145/985692.985748
[14] James R. Wallace, Daniel Vogel, and Edward Lank. 2014. Effect of Bezel Presenceand Width on Visual Search. Proceedings of The International Symposium onPervasive Displays (PerDis’14) (2014), 118–123. https://doi.org/10.1145/2611009.2611019
[15] James R. Wallace, Daniel Vogel, and Edward Lank. 2014. The effect of interiorbezel presence and width on magnitude judgement. In Proceedings of GraphicsInterface 2014. 175–182. http://dl.acm.org/citation.cfm?id=2619648.2619678
[16] Beth Yost, Yonca Haciahmetoglu, and Chris North. 2007. Beyond visual acuity:The Perceptual Scalability of Information Visualizations for Large Displays. InProceedings of the SIGCHI conference on Human factors in computing systems -CHI ’07. ACM Press, New York, New York, USA, 101. https://doi.org/10.1145/1240624.1240639