combinations of retinoic acid with either sodium butyrate ... · combinations of retinoic acid with...
TRANSCRIPT
(CANCER RESEARCH 50, 6268-6273. October 1. 1990]
Combinations of Retinoic Acid with Either Sodium Butyrate, Dimethyl Sulfoxide,or Hexamethylene Bisacetamide Synergistically Induce Differentiation of theHuman Myeloid Leukemia Cell Line HL60Theodore R. Breitman1 and Ruyi He
Laboratory of Biological Chemistry, Division of Cancer Treatment, Developmental Therapeutics Program, National Cancer Institute, National Institutes of Health,Bethesda, Maryland 20892
ABSTRACT
All-fra/iî-retinoicacid (RA), sodium /i-butyrate (NaB), hexamethylenebisacetamide (HMBA), and dimethyl sulfoxide (DMSO) induce differentiation of the human acute myeloid leukemia cell line I II ,60. In theclinic, RA, NaB, or HMBA induce complete or partial remissions.However, the achievement and maintenance of effective plasma concentrations and toxicity have been problems. These difficulties led us tostudy the interaction of RA with these inducers. We found that combinations of RA with either NaB, HMBA, or DMSO Synergisticallyinduced terminal differentiation of I II .60. A measure of the effectivenessof these combinations was that the doses of NaB, HMBA, and DMSOrequired alone to induce half-maximal differentiation were decreasedabout 4-fold in combination with normal plasma concentrations of about30 IIMRA. RA or NaB alone did not enhance the growth of 111.60 cells.In contrast, HMBA or DMSO alone increased growth of I II .60 cellseven at concentrations that did not induce differentiation. The addition ofRA reduced the promotion of growth and increased the extent of terminaldifferentiation seen with HMBA and DMSO alone. These data suggestthat treatment of some malignancies with combinations of RA withHMBA or NaB may maintain differentiation-inducing effects and decrease the problems associated with the achievement and maintenance ofeffective plasma concentrations as single agents.
INTRODUCTION
Clinical trials of differentiation-inducing agents in patientswith leukemia, myelodysplastic syndromes, and solid tumorshave included the use of RA2, 13-cw-RA, NaB, and HMBA.These agents induce complete or partial remissions ( 1-8). However, toxicity and the difficulty of achieving and maintainingeffective plasma concentrations complicate this therapy. Thisled us to investigate the interaction of RA with other inducersin short-term liquid culture of the human myeloid leukemia cellline HL60.
For a wide spectrum of biological phenomena, includingtreatment of various bacterial infections, cancer chemotherapy,and carcinogenesis, combinations of agents are often moreeffective than single agents. Our studies show that combinationsof RA with either NaB, HMBA, or DMSO are synergistic forinducing differentiation of HL60 cells. These results suggestcombinations of agents that may have utility for differentiation-inducing therapy in the clinic.
HMBA and DMSO were from Aldrich Chemical Co. (Milwaukee, WI).Cells. Maintenance of HL60 cells (passages 18-50) was in suspension
culture in RPMI 1640 (GIBCO, Grand Island, NY) supplemented with10 mM 4-(2-hydroxyethyl)-l-piperazineethane sulfonic acid and 10%(v/v) fetal bovine serum (GIBCO). The cell cultures were grown at 37°C
in a humidified atmosphere of 5% CO2 in air and subcultured every 7days. We determined cell number on an electronic particle counter(Coulter Electronics, Hialeah, FL) and estimated viability by trypanblue dye exclusion.
Induction and Measurement of Differentiation. We induced HL60cells to differentiate with RA, NaB, DMSO, and HMBA alone andwith combinations of RA and each of the other three inducers. Weharvested exponentially growing cells by centrifugation and resus-pended them in the growth medium at a cell density of 2 x 10'/ml.
Stock solutions of RA (1 mivi) were in ethanol. DMSO and the stockRA solution were serially diluted in ethanol before addition to theculture medium. The final concentration of ethanol was <0.1%. Stocksolutions of both NaB and HMBA were in phosphate-buffered saline(1.5 mM KH2PO„-8.1mM Na2HPO4-136.9 HIMNaCl, pH 7.2). For thecombination experiments, mixtures of the two compounds were madeat a predetermined molar ratio and then serially diluted. The capacityof HL60 to reduce NBT was assessed as the percentage of cells withformazan deposits as described previously (9) and corrected for viability.
Analysis of Combined Drug Effects. The median effect principledescribed by Chou and Talalay (10) was the basis for analyzing combined drug effects. The principle is described by the median effectequation:
F./F. = (D/EDwr
where f, is the fraction affected and Fu is the fraction unaffected bythe dose D, ED«,is the median effect dose required for 50% differentiation, and m is the slope of a log dose versus log (fraction affected/fraction unaffected) which signifies the sigmoidicity of an arithmeticdose-effect curve. Dose effects were determined for each agent and formultiple dilutions of a fixed ratio combination. We determined thevalues of ID-.,, and m with the ALLFIT computer program (11). Thisprogram uses the four-parameter logistic equation to analyze familiesof dose-response curves. We set the value for the response when thedose is zero to 5% and the value for the response when the dose is atinfinite concentration to 100%. The interaction of two inducers wasquantified by determining a CI for each fixed concentration ratioaccording to the conservative isobologram equation (12):
MATERIALS AND METHODS
Chemicals. RA and NBT were from Sigma Chemical Co. (St. Louis,MO). NaB was from J. T. Baker Chemical Co. (Phillipsburg, NJ).
Received 3/12/90; accepted 6/26/90.The costs of publication of this article were defrayed in part by the payment
of page charges. This article must therefore be hereby marked advertisement inaccordance with 18 U.S.C. Section 1734 solely to indicate this fact.
1To whom requests for reprints should be addressed, at NIH, Building 37,Room 5D-02. Bethesda. MD 20892.
' The abbreviations used are: RA. all-rrans-retinoic acid; NaB, sodium n-butyrate; HMBA. hexamethylene bisacetamide; DMSO. dimethyl sulfoxide; 13-cij-RA. 13-c/j-retinoic acid; NBT. nitrobluc tetrazolium; ED,o, the median effectdose; m, the slope of a log dose versus log effect curve; Cl. combination index.
(Dx)2
where D»is the dose required to produce x% effect alone and (D), and(D)2 are the doses of agents 1 and 2 in the mixture that produce thesame effect. The relationship between £>»and x% was determined fromthe parameters, m, ED50, and the median effect equation using acommercially available computer program (13) to calculate the CIvalues for each fixed concentration ratio of agents. This analysis generates the combination effect as: summation is indicated when CI = 1;synergism is indicated when CI < 1; antagonism is indicated when CI> 1.
Calculation of Dose Reduction Index. The dose reduction index nidi
6268
on April 25, 2020. © 1990 American Association for Cancer Research. cancerres.aacrjournals.org Downloaded from

SYNERGISTIC INDUCTION OF HL60 DIFFERENTIATION
cates how many folds of dose reduction are needed to achieve a giveneffect in combination compared with each agent alone (12). This wascalculated by dividing the Ml)..,,value for a single differentiation agentby the dose of the same agent required in combination with anotheragent to produce the same effect.
RESULTS
RA in Combination with NaB, DMSO, and HMBA. Fig. 1shows dose-effect curves for the induction of differentiation ofHL60 by RA, NaB, HMBA, or DMSO as single agents and bycombinations of NaB, HMBA, or DMSO with RA. These datashow the relative potency of the four inducers of differentiationand that, compared to RA, the other inducers alone had muchsteeper concentration-dependent responses. A measure of thissteepness is m, the slope of a log dose versus log effect curve.The larger the value of m the greater the steepness of the dose-effect curve and, therefore, the more narrow the range ofconcentrations over which the agent or combination of agentsshow a graded effect. An alternative parameter is a ratio ofdoses required to produce two effects, e.g., ED80/ED2o. Thehigher the value of this ratio the greater is the concentration
-2-101 23456Log Concentration, ^M
Fig. 1. The induction of differentiation of HL60 by RA, NaB, HMBA, andDMSO alone and by combinations of NaB, HMBA, and DMSO with RA. A,NaB (O) and RA (•)alone and at a molar ratio of NaB:RA of 2.000:1 (•).B,HMBA (O) and RA (•)alone and at molar ratios of HMBA:RA of 500:1 (D) and25,000:1 (•).C, DMSO (O) and RA (•)alone and at molar radios of DMSO:RAof 100:1 (D), 1 x 10': 1 (A), and 2 x 10': 1 (•).All curves were plotted with the
ALLFIT computer program (II). The numbers of independent experiments foreach conditions were: RA alone, 13; NaB alone. 6; HMBA alone. 10; DMSOalone, 9; NaB:RA of 2,000, 6; HMBA:RA of 500, 3; HMBA:RA of 25,000, 1;and DMSO:RA, 3 at each of the three ratios. Numbers in parentheses, concentrations (nM) of RA where the broken lines intersect the dose-response curves.
range for the agent alone or in combination to increase differentiation from 20-80%. Table 1 lists values for ED50, m, andED80/ED2o for each of the inducers alone and in combinationwith RA. NaB, HMBA, and DMSO had similar values of mand ED80/ED20, although they had markedly different potencies(ED5Uvalues). Based on the ED50 values, NaB was about 300-fold more potent than DMSO and about 6-fold more potentthan HMBA. RA was about 3000-fold more potent than NaBand, compared to the other three inducers, had a shallow dose-response curve, reflected by a low m value and a high ED80/ED2Uratio.
A major effect of combining RA with either NaB, HMBA,or DMSO was a decrease in the steepness of the dose-effectcurve (Fig. 1; Table 1). The dose-effect curve for the combination of two agents when only one is present at effective concentrations would be parallel with the curve for the active agentalone and displaced to higher concentrations (the same m anda greater ED50). The dose-effect curves shown in Fig. 1 for thecombinations of HMBA and RA (molar ratio, 500:1) andDMSO and RA (molar ratio, 100:1) illustrated this phenomenon. The broken lines at RA concentrations of 10, 30, 50, and100 nM showed that the extent of differentiation with thesecombinations were what we expected based only on the concentration of RA in the mixture. At higher molar ratios ofHMBA:RA or DMSO:RA the extent of differentiation wasgreater than what we expected based only on the concentrationof RA in the mixture.
The CI and the dose reduction index are useful for assessingthe effect of combinations at various effect levels (12). Table 1shows the CI values for mixtures calculated at the 50% differentiation level. We saw relatively strong synergism (CI < 0.6)with combinations of RA with NaB, HMBA, and DMSO. Inaddition, we saw marked reductions in the doses of each agentthat were needed in combination to achieve the same effect assingle agents (Table 2). For example, as single agents, 444 ^MNaB and 0.13 fi\\ RA induced half-maximal differentiation.When the two agents were combined at a molar ratio of 3000:1,74 n\i NaB plus 0.025 UMRA induced half-maximal differentiation. The decreases were reflected in dose reduction indexvalues of about 5 for RA and 6 for NaB (Table 2).
Enhancement of Growth by DMSO and HMBA. Two goalsof differentiation therapy are that tumor cells gain functionalattributes of their normal counterpart and either terminallydifferentiate or, at least, have a lower proliferative capacity. Anincrease in proliferative capacity of about 20% is seen at 48 hin HL60 culture grown with either 1.5 mM NaB, 210 mMDMSO, or 4 mM HMBA (14).We also found that HMBA andDMSO enhanced the growth of HL60 cells (Fig. 2). The extentof the enhancement of growth was both dose and time dependent. The increase in cell growth was significant [paired / test, P< 0.05 (two tailed)] at HMBA concentrations of 0.5-2.5 mMon Day 1, 0.5-3 mM on Day 2, 0.5-2.5 mM on Day 3, and 0.5-2 mM on Day 4. The maximal enhancement of cell growth wasabout 30% at 1.5 mM HMBA. We saw similar results withDMSO (Fig. 2) with significant increases in cell growth atDMSO concentrations of 100 mM on Day 1, 50-200 mM onDays 2 and 3, and 50-150 mM on Day 4. With either HMBAor DMSO maximal growth enhancement at Day 4 was at aconcentration slightly higher than the threshold concentrationfor inducing differentiation.
In contrast to HMBA and DMSO we saw essentially noenhancement of growth by either RA or NaB (Fig. 2). With RAthere were no growth values significantly greater than the
6269
on April 25, 2020. © 1990 American Association for Cancer Research. cancerres.aacrjournals.org Downloaded from

SYNERGISTIC INDUCTION OF HL60 DIFFERENTIATION
Table 1 Parameters for combinations of RA with NaB, HMBA, and DMSO derived from NET assay results"
Inducer combination(molarratio)RA(13/NaB
(6)HMBA(10)DMSO(9)NaB:RA2.000:
1(6)3.000:1(2)4.000:1
(2)HMBA:RA500:1
(3)5.000:1(1)10.000:1(3)20,000:1(3)25.000:1
(1)DMSO:RA100:1
(3)1x 10':1(3)2x 10':1 (3)ED50(iiM
±%SE)0.13±
15444±5.42,483±3.2138.540
±2.270
±1174±2083
±1770
±14300±12585±9619±9727
±1010.4
±174,149±1035,130±9RA
at ED50of combination(„M*)0.0350.0250.0210.130.060.0580.030.030.1030.0410.018m'
±%SE0.85
±144.50±204.34±144.72±111.45
±161.52±221.69
±280.87
±171.22±162.40±172.19±172.02±160.82
±241.36±162.50±18ED,/ED2026.551.851.891.806.776.205.1624.199.713.183.553.9427.867.673.03CI«,'
±%SD0.47
±130.34±180.37±141.08
±140.64±160.79±90.54±90.58±100.95
±120.36±220.42±12
" Values were calculated from data shown in Fig. 1 and other experiments. The values for m. ED50, and %SE were obtained from the ALLFIT computer program
(11).The concentration of RA in the mixture inducing half-maximal differentiation calculated by dividing the I IK, value of the combination by the molar ratio. In
the experiments with combinations, the concentration of RA is so low that the ID..,, value represents the concentration of the other agent.'Slope of the median effect plot [a plot with log dose versus log (fraction affected/fraction unaffected)] (10) which signifies the sigmoidicity of an arithmetic dose-
effect curve.Ratio of concentrations of single agents or of combinations inducing 80 and 20% of maximal effect.
'Combination index at ED50. CI values for each fixed concentration ratio of agents were calculated with a commercially available computer program (13) usingthe mutually nonexclusive assumption. We used the values for EDso + SE. ED50 —SE, m + SE. and m —SE to calculate four values of CIso. The mean ±%SD ofthese four values is listed. When CI = 1, summation is indicated; when CI <1, synergism is indicated; when CI > 1, antagonism is indicated.
^Number of independent experiments. In each experiment at least four concentrations of the inducer alone or of the combination were tested.
Table 2 Dose reductions by combinations of RA with NaB, HMBA, and DMSO
Inducercombination(molarratio)NaB:RA2.000:13.000:14.000:1HMBA:RA500:15.000:110,000:120.000:125.000:1DMSO:RA100:11
x10':12x 10':1RA3.75.26.212.12.24.34.31.23.27.2Dose
reductionindex"NaB
HMBA6.36.05.38.34.24.03.4(folds)DMSO33.43.9
* The number of folds of dose reduction needed to achieve half-maximaldifferentiation in combination compared with each drug alone. The values usedfor the calculations are the IT).,, of the combination and the RA concentrationin the combination shown in Table 1. Thus, for NaB:RA, 2000:1. drug reductionindex for NaB is calculated by 444/70 = 6.3 and the drug reduction index for RAis calculated by 0.13/0.035 = 3.7.
control. With NaB, growth increases of about 5% for 0.6 and0.8 mM NaB on Day 1 were the only values significantly greaterthan the control.
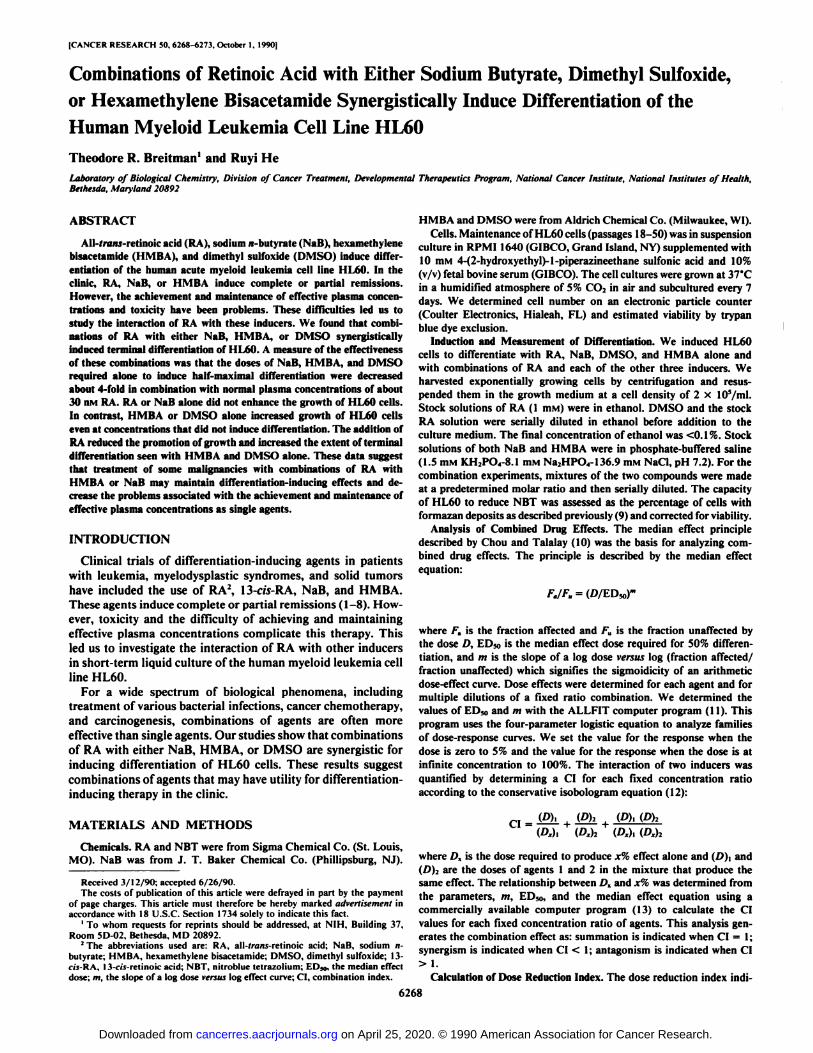
The enhancement of growth seen during a 4-day period withrelatively low concentrations of either HMBA or DMSO (Fig.2) persisted for at least 21 days in the presence of 0.5 mMHMBA (Fig. 3) or 25 mM DMSO (data not shown). At Day21, viabilities were >95%, the percentage of NBT-positive cellswas <15%, and the cultures containing either HMBA or DMSOhad cell concentrations about 2-fold greater than the control.The population-doubling times were about 33 h in the presence
04080120160200 1 2 3 4DMSO Concentration, HMBA Concentration,
mM mM
':..•.-»'I Il .1.1 In
-1 O 1 2 3 0.2 0.4 0.6 0.8 1.0
Log RA Concentration, NaB Concentration,nM mM
Fig. 2. Relative growth as a function of concentration of RA, NaB, HMBA,or DMSO. The cell concentrations are relative to an initial cell number of 2 xIO5 cells/ml. », Day 1; O, Day 2; • Day 3; D, Day 4; A. the extent ofdifferentiation (%NBT) at Day 4; bars, SE of 6-13 independent experiments. RAconcentrations are plotted on a log scale. Viability was >90% under all conditions.
of 0.5 mM HMBA, 34 h in the presence of 25 mM DMSO, and36 h for the control during these 21 days. Thus, the growth-promoting effects of HMBA or DMSO persisted during theequivalent of a >20,000-fold increase in cell concentration.However, in cultures containing 0.5 mM HMBA we saw a RA
6270
on April 25, 2020. © 1990 American Association for Cancer Research. cancerres.aacrjournals.org Downloaded from
10-
SYNERGISTIC INDUCTION OF HL60 DIFFERENTIATION
1 I T T T~T
14
16 20
Time, day
Fig. 3. Cumulative long-term growth of HL60 cells in the presence of 0.5 HIMHMBA. HL60 cells (initial density 2 x 10' cells/ml) were grown in the presence
(•)or absence (O) of 0.5 mM HMBA. On Days 4. 8, 12. and 16 a portion of eachculture was diluted in fresh medium to a density of 2 x 10*cells/ml. The results
shown were from one experiment. Essentially the same results »ereseen in twoother experiments. Viability was >90Tc.
Time, days
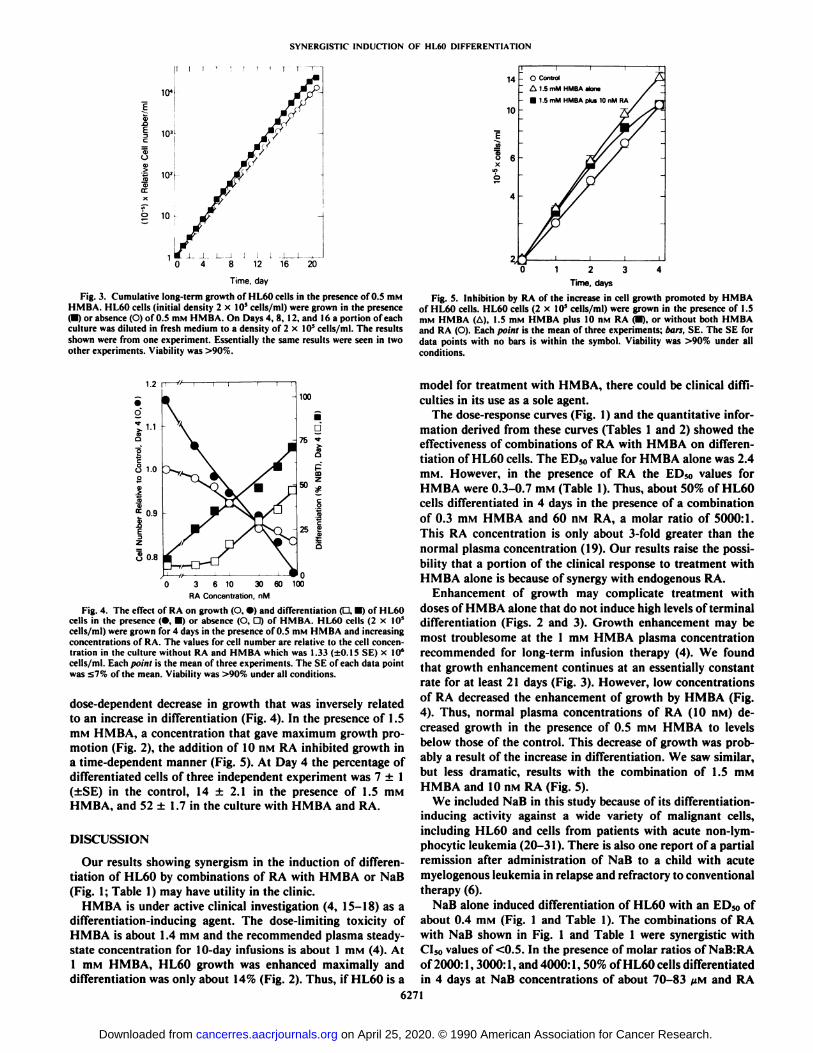
Fig. 5. Inhibition by RA of the increase in cell growth promoted by HMBAof HL60 cells. HL60 cells (2 x 10' cells/ml) were grown in the presence of 1.5
mM HMBA (A), 1.5 mM HMBA plus 10 nM RA (•),or without both HMBAand RA (O). Each point is the mean of three experiments; bars, SE. The SE fordata points with no bars is within the symbol. Viability was >90% under allconditions.
1.2 r
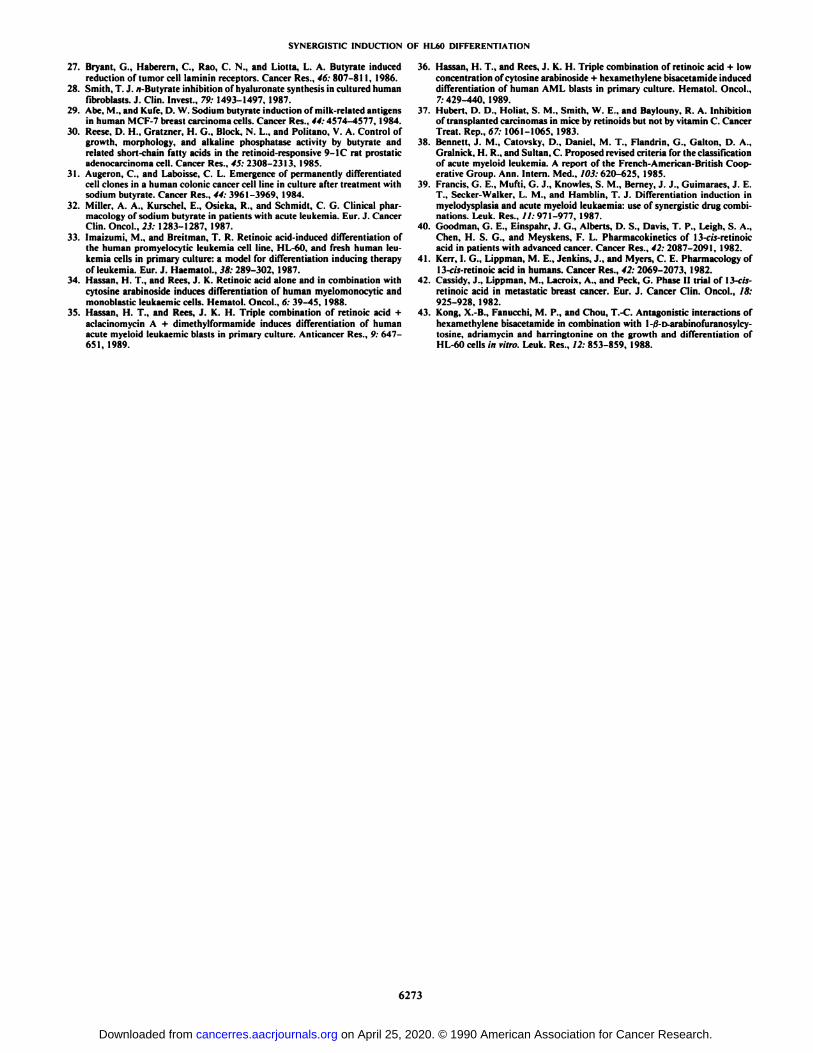
0 3 6 10 30 60 100
RA Concentration, nM
Fig. 4. The effect of RA on growth (O. •)and differentiation (D. •)of HL60cells in the presence (•,•)or absence (O. D) of HMBA. HL60 cells (2 x 10*
cells/ml) were grown for 4 days in the presence of 0.5 mM HMBA and increasingconcentrations of RA. The values for cell number are relative to the cell concentration in the culture without RA and HMBA which was 1.33 (±0.15SE) x 10*
cells/ml. Each point is the mean of three experiments. The SE of each data pointwas £7%of the mean. Viability was >90?Ãunder all conditions.
dose-dependent decrease in growth that was inversely relatedto an increase in differentiation (Fig. 4). In the presence of 1.5mM HMBA, a concentration that gave maximum growth promotion (Fig. 2), the addition of 10 HMRA inhibited growth ina time-dependent manner (Fig. 5). At Day 4 the percentage ofdifferentiated cells of three independent experiment was 7 ±1(±SE) in the control, 14 ±2.1 in the presence of 1.5 mMHMBA, and 52 ±1.7 in the culture with HMBA and RA.
DISCUSSION
Our results showing synergism in the induction of differentiation of HL60 by combinations of RA with HMBA or NaB(Fig. 1; Table 1) may have utility in the clinic.
HMBA is under active clinical investigation (4, 15-18) as adifferentiation-inducing agent. The dose-limiting toxicity ofHMBA is about 1.4 mM and the recommended plasma steady-state concentration for 10-day infusions is about 1 mM (4). At1 mM HMBA, HL60 growth was enhanced maximally anddifferentiation was only about 14% (Fig. 2). Thus, if HL60 is a
model for treatment with HMBA, there could be clinical difficulties in its use as a sole agent.
The dose-response curves (Fig. 1) and the quantitative infor
mation derived from these curves (Tables 1 and 2) showed theeffectiveness of combinations of RA with HMBA on differentiation of HL60 cells. The ED50 value for HMBA alone was 2.4mM. However, in the presence of RA the ED50 values forHMBA were 0.3-0.7 mM (Table 1). Thus, about 50% of HL60cells differentiated in 4 days in the presence of a combinationof 0.3 mM HMBA and 60 nM RA, a molar ratio of 5000:1.This RA concentration is only about 3-fold greater than thenormal plasma concentration (19). Our results raise the possibility that a portion of the clinical response to treatment withHMBA alone is because of synergy with endogenous RA.
Enhancement of growth may complicate treatment withdoses of HMBA alone that do not induce high levels of terminaldifferentiation (Figs. 2 and 3). Growth enhancement may bemost troublesome at the 1 mM HMBA plasma concentrationrecommended for long-term infusion therapy (4). We foundthat growth enhancement continues at an essentially constantrate for at least 21 days (Fig. 3). However, low concentrationsof RA decreased the enhancement of growth by HMBA (Fig.4). Thus, normal plasma concentrations of RA (10 nM) decreased growth in the presence of 0.5 mM HMBA to levelsbelow those of the control. This decrease of growth was probably a result of the increase in differentiation. We saw similar,but less dramatic, results with the combination of 1.5 mMHMBA and 10 nM RA (Fig. 5).
We included NaB in this study because of its differentiation-inducing activity against a wide variety of malignant cells,including HL60 and cells from patients with acute non-lym-phocytic leukemia (20-31). There is also one report of a partialremission after administration of NaB to a child with acutemyelogenous leukemia in relapse and refractory to conventionaltherapy (6).
NaB alone induced differentiation of HL60 with an ED50 ofabout 0.4 mM (Fig. 1 and Table 1). The combinations of RAwith NaB shown in Fig. 1 and Table 1 were synergistic withClfiovalues of <0.5. In the presence of molar ratios of NaB:RAof 2000:1,3000:1, and 4000:1,50% of HL60 cells differentiatedin 4 days at NaB concentrations of about 70-83 ^M and RA
6271
on April 25, 2020. © 1990 American Association for Cancer Research. cancerres.aacrjournals.org Downloaded from

SYNERGISTIC INDUCTION OF HL60 DIFFERENTIATION
concentrations of about 21-35 nM (Table 1). Thus, the presenceof about 28 nM RA reduced the ED50 value for NaB from about400 to about 75 ^M (a dose reduction index value of about 6-fold).
In a clinical study using a continuous i.v. infusion of 4.55mmol NaB/kg/day for 10 days there was no clinical efficacyand no toxicity in nine patients with acute myeloid leukemias(32). The mean plasma concentration of NaB was about 50 nM.This concentration of NaB is about 6-fold higher than thenormal plasma concentration. We do not know of any resultson increasing plasma concentrations further.
Based on our results with HL60 (Fig. 2), and many studieswith other cell lines, there is minimal induction of differentiation and no growth inhibition at 50 /¿MNaB. Our data showedthat a combination of 60 /¿MNaB and 30 nM RA induceddifferentiation of about 40% of HL60 cells (Fig. 1). Higherconcentrations of NaB or RA or both increased the extent ofdifferentiation still further. Thus, it is possible that combinations of NaB and RA can be used in the clinic at concentrationsthat are effective and not toxic.
RA and its isomer 13-c/s-RA induce complete remissions inpatients with acute promyelocytic leukemia (1-3, 7). RA induces differentiation in primary culture of fresh leukemia cellsfrom patients with acute promyelocytic leukemia (1, 3, 7, 20,33-36). Based on results with cells from one patient, RA is 10-fold more potent than 13-c/s-RA (7). It is of interest that RA isactive and 13-c/s-RA is inactive in the suppression of growth oftransplantable carcinomas in animals (37). In the same studyoral administration of RA was more effective than i.p. injection.
RA induces differentiation in primary culture of cells frompatients with acute myeloid leukemias classified according tothe French-American-British scheme (38) as subtypes acutemyeloid leukemia (M2), acute myelomonocytic leukemia (M4),and acute monocytic leukemia (M<) in addition to acute promyelocytic leukemia, subtype (M3) (20, 35, 36, 39). Cells frompatients with subtype MI are resistant (36). Clinical pharmacological studies with 13-c/s-RA show that oral dosages increaseplasma concentrations to about l UM(40, 41). The degree andnature of the toxicity occurring in patients (42) is similar towhat is seen for RA at similar oral dosages (3, 7). These resultsindicate that the plasma concentrations of RA can be increasedto levels that we have shown in this study to be synergistic withHMBA and NaB.
Based on the data presented in the current study, we suggestthat RA may be useful in combination with other agents in thetreatment of some leukemias. Although we saw similar resultswith HMBA and NaB, NaB may have an advantage clinicallybecause of its greater potency (Fig. 1; Table 1) and its lack ofgrowth-enhancing activity (Fig. 2). The finding that fresh cellsfrom patients with various subtypes of acute myeloid leukemiadifferentiate in primary culture in response to RA and otheragents suggests the possibility that a patient's leukemic cells
can be tested in vitro for differentiation response before orduring treatment. Our data may support the suggestion inprevious studies (12, 43) that analysis of potential drug combinations with the median effect principle can provide usefulguidelines for drug dosing. Based on this analysis combinationsof HMBA with either 1-0-D-arabinofuranosylcytosine, Adria-mycin, or harringtonine are weakly synergistic or antagonisticfor HL60 differentiation (43).
REFERENCES
10.
11.
12.
13.
14.
15.
16.
17.
18.
19.
20.
21.
22.
23.
24.
25.
26.1. Fontana, J. A., Rogers, J. S. II, and Durham, J. P. The role of 13 c/s-retinoic
acid in the remission induction of a patient with acute promyelocytic leuke-
6272
mia. Cancer (Philadelphia), 57: 209-217, 1986.Daenen, S., Vellenga, E., van Dobbenburgh. O. A., and Halie, M. R. Retinoicacid as antileukemic therapy in a patient with acute promyelocytic leukemiaand Aspergillus pneumonia. Blood, 67: 559-561, 1986.Huang, M.-E., Ye, Y.-C, Chen, S.-R., Chai, J.-R., Lu, J.-X., Zhoa, L., Gu,L.-J., and Wang, Z.-Y. Use of a\\-irans retinole acid in the treatment of acutepromyelocytic leukemia. Blood, 72: 567-572, 1988.Young, C. W., Fanucchi, M. P., Walsh. T. D., Baltzer, L., Yaldaei, S.,Stevens, Y.-W., Gordon, C., Tong, W., Rifkind, R. A., and Marks, P. A.Phase I trial and clinical pharmacological evaluation of hexamethylenebisacetamide administration by ten-day continuous intravenous infusion attwenty-eight-day intervals. Cancer Res., 48: 7304-7309, 1988.Flynn, P. J., Miller, W. J., Weisdorf, D. J., Arthur, D. C., Brunning, R., andBranda, R. F. Retinoic acid treatment of acute promyelocytic leukemia: invitro and in vivo observations. Blood, 62: 1211-1217, 1983.Novogrodsky, A., Dvir, A., Ravid, A., Shkolnik, T., Stenzel, K. H., Rubin,A. L., and Zaizov, R. Effect of polar organic compounds on leukemic cells.Butyrate-induced partial remission of acute myelogenous leukemia in a child.Cancer (Philadelphia). SI: 9-14, 1983.Chomienne, C., Ballerini, P., Balitrand, N., Amar, M., Bernard, J. F., Boivin,P., Daniel, M. T., Berger, R., Castaigne, S., and Degos, L. Retinoic acidtherapy for promyelocytic leukemia. Lancet, 2: 746-747, 1989.Hassan, H. T., and Rees, J. Differentiation induction therapy of myelodys-plastic syndromes. Leuk. Res., 13: 633-637, 1989.Breitman, T. R., Keene, B. R., and I lemmi. H. Studies of growth anddifferentiation of human myelomonocytic leukemia cell lines in serum-freemedium. In: D. W. Barnes, D. A. Sirbasku, and G. H. Sato (eds.). Methodsfor Serum-Free Culture of Neuronal and Lymphoid Cells, pp. 215-236. NewYork: Alan R. Liss, 1984.Chou, T. C. and Talalay, P. Quantitative analysis of dose-effect relationships:the combined effects of multiple drugs or enzyme inhibitors. Adv. EnzymeRegul., 22: 27-55, 1984.DeLean, A., Munson, P. J., and Rodbard, D. Simultaneous analysis offamilies of sigmoidal curves: application to bioassay, radioligand assay, andphysiological dose-response curves. Am. J. Physiol., 235: E97-E102, 1978.Ik-mum. E., Duigou-Osterndorf, R., Krown, S. E., Fanucchi, M. P., Chou,J., Hirsch, M. S., Clarkson, B. D., and Chou, T.-C. Synergistic cytotoxiceffect of azidothymidine and recombinant Interferon alpha on normal humanbone marrow progenitor cells. Blood, 74: 1281-1286, 1989.Chou, J., and Chou, T.-C. Dose-«ffectanalysis with microcomputers: quan-titation of ED50, LD50, synergism, antagonist, low-dose risk, receptor ligandbinding and enzyme kinetics. Software: Dose, Effect, Binding and Kinetics.Amsterdam: Elsevier/North-Holland BiomédicalPress, 1985.Fibach, E., Trêves,A., Peled, T., and Rachmilewitz, E. A. Changes in cellkinetics associated with differentiation of a human promyelocytic cell line(HL60). Cell Tissue Kinet., 15: 423-429, 1982.Chun, H. G.. Leyland-Jones, B., Hoth, D., Shoemaker, D., Wolpert-De-Filippes, M., Grieshaber, C., Cradock, J., Davignon, P.. Moon, R., Rifkind,R., and Wittes, R. E. Hexamethylene bisacetamide: a polar-planar compoundentering clinical trials as a differentiating agent. Cancer Treat. Rep., 70:991-996, 1986.Egorin, M. J., Zuhowski. E. G., Cohen, A. S., Geelhaar, L. A., Callery, P.S., and Van Echo, D. A. Plasma pharmacokinetics and urinary excretion ofhexamethylene bisacetamide metabolites. Cancer Res., 47:6142-6146,1987.Callery, P. S., Egorin, M. J., Geelhaar, L. A., and Nayar. M. S. B. Identification of metabolites of the cell-differentiating agent hexamethylene bisacetamide in humans. Cancer Res., 46: 4900-4903, 1986.Conley, B. A., Forrest, A., Egorin, M. J., Zuhowski, E. G., Sinibaldi, V., andVan Echo, D. A. Phase I trial using adaptive control dosing of hexamethylenebisacetamide (NSC 95580). Cancer Res., 49: 3436-3440, 1989.Napoli, J. L., Parmanik, B. C., Williams, J. B., Dawson, M. I., and Hobbs.P. D. Quantification of retinole acid by gas-liquid chromatography-massspectrometry: total versus all-fra/ii-retinoic acid in human plasma. J. LipidRes., 26: 387-392, 1985.Honma, Y., Fujita, Y., Kasukabe, T., Hozumi, M., Sampi, K., Sakurai, M.,Tsushima. S., and Nomura. H. Induction of differentiation of human acutenon-lymphocytic leukemia cells in primary culture by inducers of differentiation of human myeloid leukemia cell line III. 60 Eur. J. Cancer Clin. Oncol.,/ 9: 251-261, 1983.Honma, Y., Fujita, Y., Kasukabe. T., Hozumi, M., Sampi, K., Sakurai, M.,Tsushima, S., and Nomura, H. Differentiation in vitro of human myelogenousleukemia cells from patients in relapse. Gann, 75: 518-524, 1984.Boyd, A. W., and Metcalf, D. Induction of differentiation in HL60 leukaemiccells: a cell cycle dependent all-or-none event. Leuk Res., *: 27-43, 1984.Leder, A., Orkin, S., and Leder, P. Differentiation of erythroleukemic cellsin the presence of inhibitors of DNA synthesis. Science (Washington DC),/90: 893-894, 1975.Kim, S. H., He, S. Q., and Kim. J. H. Modification of thermosensitivity ofHeLa cells by sodium butyrate, dibutyryl cyclic adenosine 3':5'-monophos-phate. and retinole acid. Cancer Res., 44: 697-702, 1984.Cook, J. R., Schwartz, C. E., Fausel, E. D., and Chiù,J.-F. Effect of sodiumbutyrate on alpha-fetoprotein gene expression in rat hepatoma cells in vitro.Cancer Res., 45: 3215-3219, 1985.de Haan, J. B., Gevers, W., and Parker, M. I. Effects of sodium butyrate onthe synthesis and methylation of DNA in normal cells and their transformedcounterparts. Cancer Res., 46: 713-716, 1986.
on April 25, 2020. © 1990 American Association for Cancer Research. cancerres.aacrjournals.org Downloaded from
SYNERGISTIC INDUCTION OF HL60 DIFFERENTIATION
27. Bryant, G., Haberern. C., Rao, C. N., and Liotta. L. A. Butyrate inducedreduction of tumor cell laminiti receptors. Cancer Res.. 46: 807-811,1986.
28. Smith, T. J. n-Butyrate inhibition of hyaluronate synthesis in cultured humanfibroblasts. J. Clin. Invest., 79: 1493-1497, 1987.
29. Abe, M., and Kufe. D. W. Sodium butyrate induction of milk-related antigensin human MCF-7 breast carcinoma cells. Cancer Res., 44:4574-4577, 1984.
30. Reese, D. H., Gratzner, H. G., Block, N. L., and Politano, V. A. Control ofgrowth, morphology, and alkaline phosphatase activity by butyrate andrelated short-chain fatty acids in the relinoid-responsive 9-1C rat prostaticadenocarcinoma cell. Cancer Res., 45: 2308-2313, 1985.
31. Augeron, C, and Laboisse, C. L. Emergence of permanently differentiatedcell clones in a human colonie cancer cell line in culture after treatment withsodium butyrate. Cancer Res., 44: 3961-3969, 1984.
32. Miller, A. A., Kurschel, E., Osieka, R.. and Schmidt, C. G. Clinical pharmacology of sodium butyrate in patients with acute leukemia. Eur. J. CancerClin. Oncol., 23: 1283-1287, 1987.
33. Imaizumi, M., and Breitman. T. R. Retinoic acid-induced differentiation ofthe human promyelocytic leukemia cell line. HL-60. and fresh human leukemia cells in primary culture: a model for differentiation inducing therapyof leukemia. Eur. J. Haematol., 38: 289-302, 1987.
34. Hassan, H. T.. and Rees, J. K. Retinoic acid alone and in combination withcytosine arabinoside induces differentiation of human myelomonocytic andmonoblastic leukaemic cells. Hematol. Oncol.. 6: 39-45, 1988.
35. Hassan. H. T.. and Rees. J. K. H. Triple combination of retinoic acid +aclacinomycin A + dimethylformamide induces differentiation of humanacute myeloid leukaemic blasts in primary culture. Anticancer Res.. 9: 647-651. 1989.
36. Hassan. H. T., and Rees, J. K. H. Triple combination of retinoic acid + lowconcentration of cytosine arabinoside + hexamethylene bisacetamide induceddifferentiation of human \MI blasts in primary culture. Hematol. Oncol.,7.-429-440. 1989.
37. Hubert, D. D., Holiat, S. M., Smith. W. E.. and Baylouny, R. A. Inhibitionof transplanted carcinomas in mice by retinoids but not by vitamin C. CancerTreat. Rep., 67: 1061-1065, 1983.
38. Bennett, J. M., Catovsky, D., Daniel. M. T.. Flandrin, G., Galton, D. A.,Gralnick. H. R., and Sultan. C. Proposed revised criteria for the classificationof acute myeloid leukemia. A report of the French-American-Brilish Cooperative Group. Ann. Intern. Med.. 103: 620-625. 1985.
39. Francis, G. E., Mufti, G. J., Knowles, S. M., Berney, J. J., Guimaraes, J. E.T., Seeker-Walker, L. M., and Hamblin, T. J. Differentiation induction inmyelodysplasia and acute myeloid leukaemia: use of synergistic drug combinations. Leuk. Res.. //: 971-977, 1987.
40. Goodman. G. E., Einspahr. J. G., Alberts. D. S.. Davis, T. P.. Leigh, S. A.,Chen. H. S. G., and Meyskens, F. L. Pharmacokinetics of 13-c/i-retinoicacid in patients with advanced cancer. Cancer Res., 42: 2087-2091, 1982.
41. Kerr. 1. G.. Lippman, M. E., Jenkins. J., and Myers, C. E. Pharmacology of13-cis-retinoic acid in humans. Cancer Res., 42: 2069-2073, 1982.
42. Cassidy, J., Lippman, M., Lacroix, A., and Peck, G. Phase II trial of 13-c/s-retinoic acid in metastatic breast cancer. Eur. J. Cancer Clin. Oncol., IS:925-928. 1982.
43. Kong. X.-B., Fanucchi, M. P.. and Chou, T.-C. Antagonistic interactions ofhexamethylene bisacetamide in combination with 1-rf-n arabinofuranosylcy-tosine, adriamycin and harringtonine on the growth and differentiation ofHL-60 cells in vitro. Leuk. Res., 12: 853-859, 1988.
6273
on April 25, 2020. © 1990 American Association for Cancer Research. cancerres.aacrjournals.org Downloaded from

1990;50:6268-6273. Cancer Res Theodore R. Breitman and Ruyi He Leukemia Cell Line HL60Synergistically Induce Differentiation of the Human MyeloidDimethyl Sulfoxide, or Hexamethylene Bisacetamide Combinations of Retinoic Acid with Either Sodium Butyrate,
Updated version
http://cancerres.aacrjournals.org/content/50/19/6268
Access the most recent version of this article at:
E-mail alerts related to this article or journal.Sign up to receive free email-alerts
Subscriptions
Reprints and
To order reprints of this article or to subscribe to the journal, contact the AACR Publications
Permissions
Rightslink site. Click on "Request Permissions" which will take you to the Copyright Clearance Center's (CCC)
.http://cancerres.aacrjournals.org/content/50/19/6268To request permission to re-use all or part of this article, use this link
on April 25, 2020. © 1990 American Association for Cancer Research. cancerres.aacrjournals.org Downloaded from