combustion optimization for coal-fired boilers optimization for coal-fired boilers 2nd u.s.-china...
TRANSCRIPT

Combustion Optimization for Coal-Fired Boilers
2nd U.S.-China NOx WorkshopDalian, ChinaAugust 2005
James TobinNeil Widmer
GE Energy
The problem …

3GE Energy
August 2005
Poor combustion result in many performance issues.
Reduced Througput (Load)
High Metal Temperatures
Increased FEGT(Furnace Exit Gas Temperature)
Reduced Efficiency
~CoalSupply
CoalCrusher
Mill
CoalSilos Boiler
AirHeater
Stack
IDFan
FDFan Turbine Generator
Local Fouling
Increased Steam Spray
Local Slagging
Local Hot Spots
Increased Excess O2
High COHigh CO
Combustion profile as monitored by Spatial Sensors
Economizer O2 Imbalance
Local Corrosion
High Carbon in Ash, eg. LOI(Loss on Ignition)
High NOx
4GE Energy
August 2005
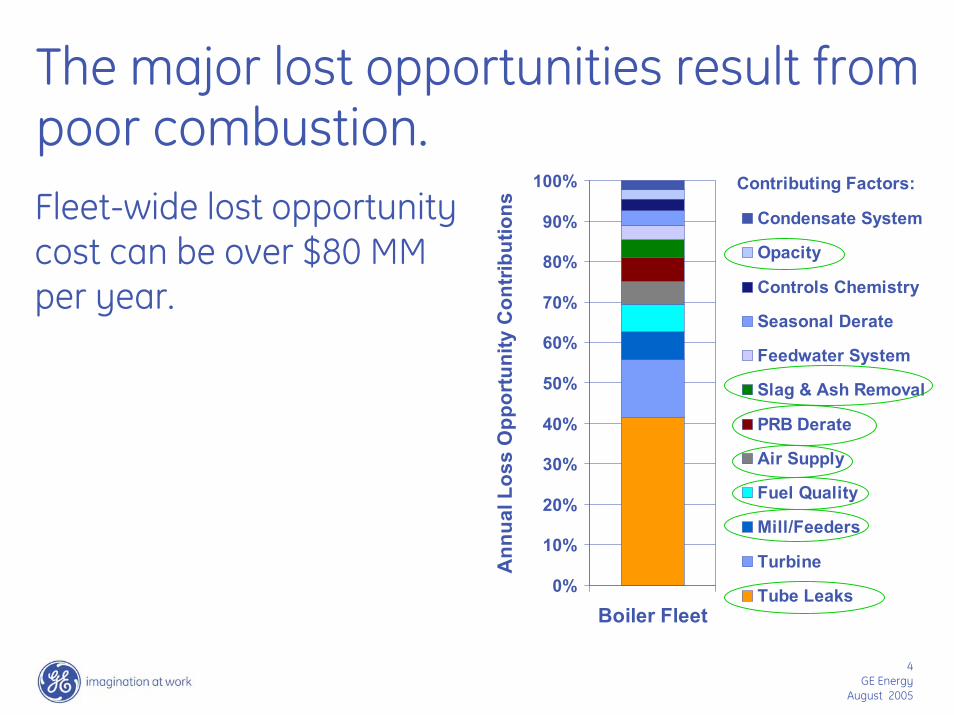
The major lost opportunities result from poor combustion.Fleet-wide lost opportunity cost can be over $80 MM per year.
0%
10%
20%
30%
40%
50%
60%
70%
80%
90%
100%
Boiler Fleet
Ann
ual L
oss
Opp
ortu
nity
Con
trib
utio
ns Condensate System
Opacity
Controls Chemistry
Seasonal Derate
Feedwater System
Slag & Ash Removal
PRB Derate
Air Supply
Fuel Quality
Mill/Feeders
Turbine
Tube Leaks
Contributing Factors:

5GE Energy
August 2005
Improved burner operation drives performance gains.
Fuel SavingsCo
mfo
rtZo
ne
Initial A/F Initial A/F σσ
FEGT
Improved Improved A/F A/F σσ
High CO Burners Limit Performance
Emissions CreditsAvailability & Peak Power
Output (Throughput)

Solutions …

7GE Energy
August 2005
Zonal™ combustion control system
Combustion (O2/CO) Monitors
Output
NOx
Availability
Burner Airflow
Controls
Combustion Tuning Controls
Efficiency
Combustion Diagnostic
Zonal Fuel and Air Optimization
Burner Adjustments 1
2
3
object
Burner Coal Flow Controls

8GE Energy
August 2005
Combustion Sensors
Combustion Tuning Model
Burner Airflow Controls
Coal Flow Sensors
Coal Flow Dampers
Components …
Zonal™ Combustion Controls

9GE Energy
August 2005
Zonal™ combustion control system … how fuel & air controls work together.
Zonal CO Trim - fine controls for combustion balancing :> Trim furnace zonal air/fuel
ratios based on sensor grid– Balance CO– Reduce hot spots– Reduce delayed
combustion– Maintain burner flame– Reduce LOI– Reduce excess O2
Zonal Fuel Trim - coarse controls for combustion shaping :> Optimize wall-burner firing
– Reduce impingement> Reshape tangential fireball
– Centered and round > Tune furnace fuel
distribution – Balance economizer O2
– Divert heat loading from peak FEGT & slag regions
10GE Energy
August 2005
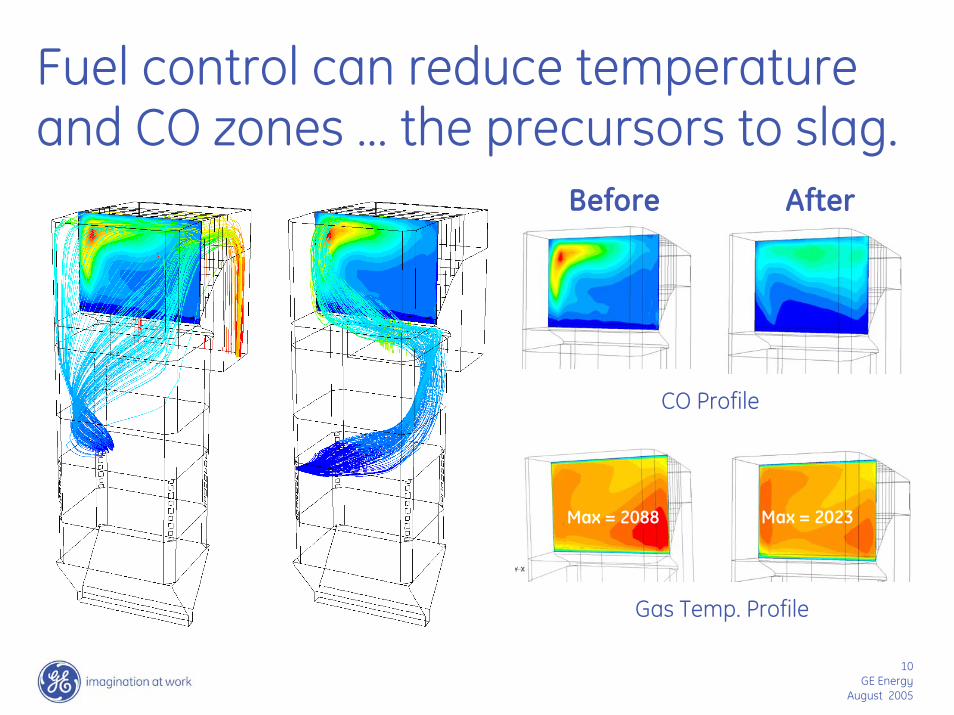
Fuel control can reduce temperature and CO zones … the precursors to slag.
AfterBefore
CO Profile
Max = 2088 Max = 2023
Gas Temp. Profile
11GE Energy
August 2005
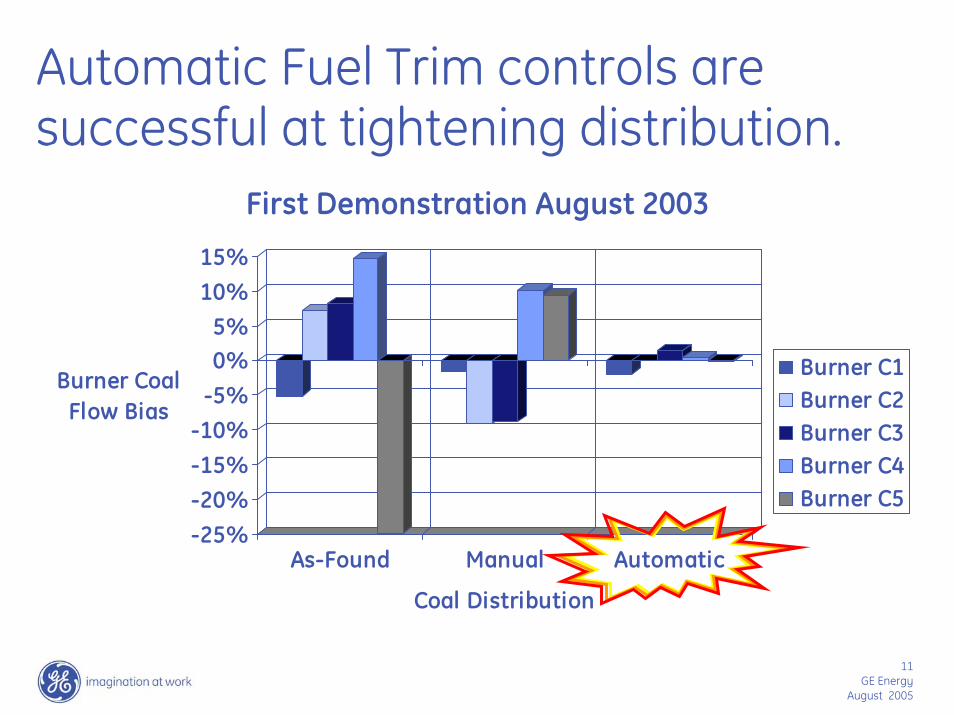
Automatic Fuel Trim controls are successful at tightening distribution.
-25%-20%-15%-10%
-5%0%5%
10%15%
Burner Coal Flow Bias
As-Found Manual Automatic
Coal Distribution
Burner C1Burner C2Burner C3Burner C4Burner C5
First Demonstration August 2003
12GE Energy
August 2005
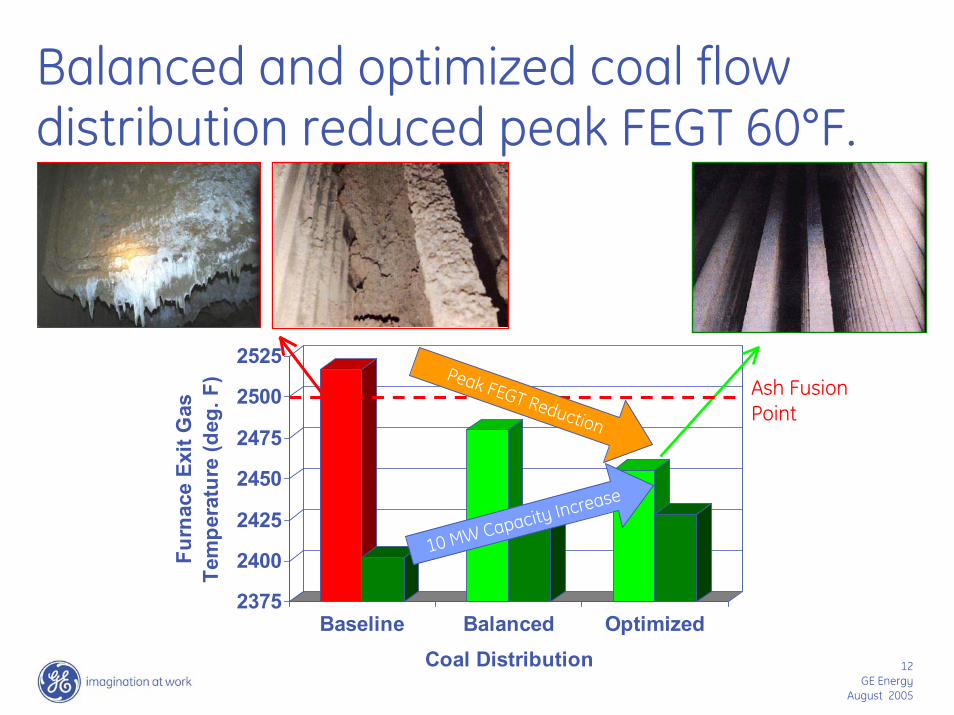
Balanced and optimized coal flow distribution reduced peak FEGT 60°F.
2375
2400
2425
2450
2475
2500
2525
Furn
ace
Exit
Gas
Te
mpe
ratu
re (d
eg. F
)
Baseline Balanced OptimizedCoal Distribution
Ash Fusion Point
Peak FEGT Reduction
10 MW Capacity Increase

13GE Energy
August 2005
20°F Peak FEGT limited boiler capacity approximately 10MW.
2,150
2,200
2,250
2,300
2,350
2,400
2,450
2,500
2,550
2,600
2,650
2,700
220 240 260 280 300 320 340 360 380 400
Load, MWg
Furn
ace
Exit
Gas
Tem
pera
ture
, deg
F
FEGT West
FEGT East
FEGT Average
Turbine CapacityBoiler Limit

14GE Energy
August 2005
Zonal™ combustion monitoring system
Interface Display
Modeling (upgrade)
Flow and Control Panel
Sensor Array
15GE Energy
August 2005
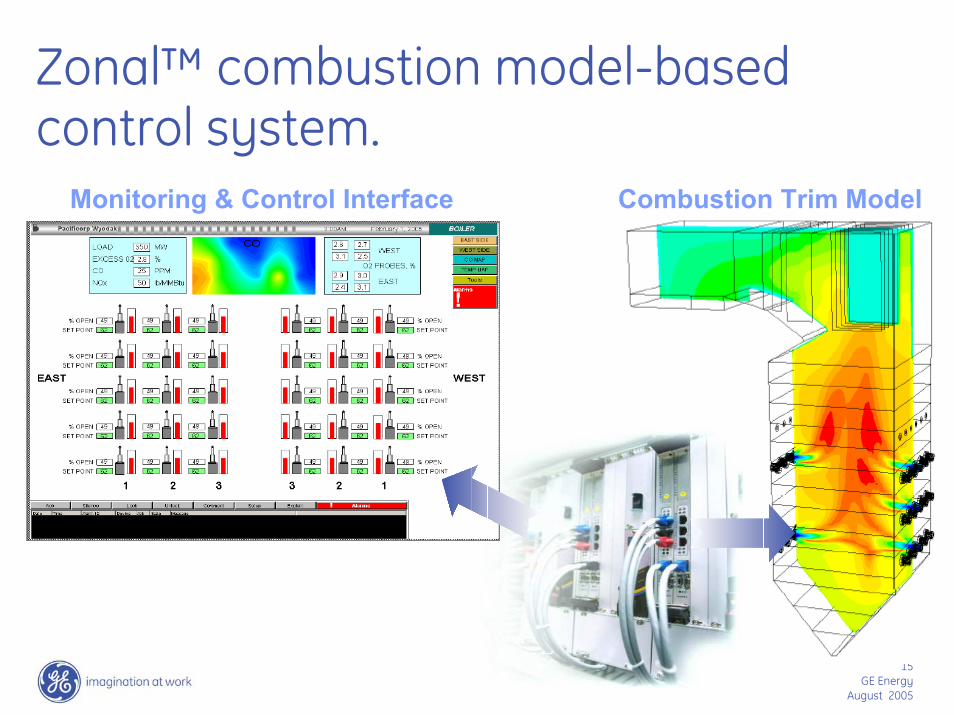
Zonal™ combustion model-based control system.
Combustion Trim ModelMonitoring & Control Interface

16GE Energy
August 2005
Zonal™ combustion tuning system demonstration.
Burner Tuning
Combustion Sensors
Boiler Model
Initial CO
Tuned CO
Tuninem
o
g D

17GE Energy
August 2005
0100200300400500600700800900
1000
CO
Lev
el, p
pm
CO
#11
CO
#6
CO
#12
CO
#7
CO
#14
CO
#13
CO
#1
CO
#9
CO
#8
CO
#10
CO
#4
CO
#15
CO
#5
CO
#2
CO
#3
Combustion Sensors
Initial Tuned
0
0.5
1
1.5
2
2.5
3
3.5
Fly-
Ash
LO
I, %
West Middle East
Flue Gas Duct
Initial Tuned
Systematic tuning balanced CO and fly-ash LOI … synergistic with Hg control.
18GE Energy
August 2005
Zonal™ combustion control system features:> Faster tuning experience> One system for managing Zonal™ combustion> Improves quality through systematic methods> Advises burner adjustments> Stores preferred burner setting by operating
mode> Diagnoses combustion performance

Benefits …

20GE Energy
August 2005
Combustion Optimization – Case StudySunflower Electric 380 MW BoilerScope:> GE coal flow monitors & control> GE combustion sensors> GE boiler tuning services> GE control software
System Benefits:> Reduced peak FEGT 60°F
– Eliminated barrier to increasing output 10 MW worth $1M/yr
> Reduced high CO and temperature zones
– Avoid future slag outage 1 weeks worth ~ $2.5M/yr
> Reduced NOx and Heat Rate
Furnace Combustion Balancing
Burner Fuel/Air FlowSensors & Auto-Control
Coal Flow
Sensor
Coal Damper
Furnace Combustion
Sensor Arrays
CO Sensor
Burner Air Control

21GE Energy
August 2005
Zonal™ combustion controls benefits:
Reduce average and peak FEGTReduce fuel rich (CO) zonesReduce corrosionReduce slaggingReduce LOIReduced NOx

22GE Energy
August 2005
Good combustion provides significant benefits.
0500
1,0001,5002,0002,500
100 300 500 700 900
Boiler Load, MWe
Ann
ual B
enef
its, k
$/yr
Emissions Heat RatePeak Power Availability
Improvements :> Excess O2: 0.5% reduction> Emissions (NOx): 15% reduction> Heat Rate: 0.4% improvement> Peak Power: 2.3% increase> Availability: 1 week avoided
outage
Economic assumptions provided in notes
Economic benefits are site-specific. Your plants benefits may vary.