comments on the integrated resource plan 2016 draft tobias bischof-niemz chief engineer comments on...
TRANSCRIPT
Dr Tobias Bischof-Niemz Chief Engineer
Comments on the Integrated Resource Plan 2016 Draft South African Integrated Resource Plan 2016 public hearing CSIR Energy Centre
Johannesburg, 7 December 2016
Jarrad Wright +27 79 527 6002 [email protected] Dr Tobias Bischof-Niemz +27 83 403 1108 [email protected] Robbie van Heerden +27 82 803 0961 [email protected] Crescent Mushwana +27 82 310 2142 [email protected]
2
Agenda
Expertise of Commentators
Comments on IRP Assumptions
IRP Results and Least-cost Scenario
Proposal / Next Steps

3
Commentators have significant expertise to give feedback on IRP & its implementation, from planning, system operation and grid perspective
Dr Tobias Bischof-Niemz
• Head of CSIR’s Energy Centre
• Member of Ministerial Advisory Council on Energy (MACE)
• Member of IRP2010/IRP2013 teams at Eskom, energy planning in Europe for large utilities
Robbie van Heerden
• Senior Specialist: Energy Systems at the CSIR’s Energy Centre
• Former General Manager and long-time head of System Operations at Eskom
Crescent Mushwana
• Research Group Leader: Energy Systems at the CSIR’s Energy Centre
• Former Chief Engineer at Eskom strategic transmission grid planning
Jarrad Wright
• Principal Engineer: Energy Planning at the CSIR’s Energy Centre
• Energy Commissioner in the National Planning Commission
• Former Africa manager of PLEXOS (software package used for the IRP)
4
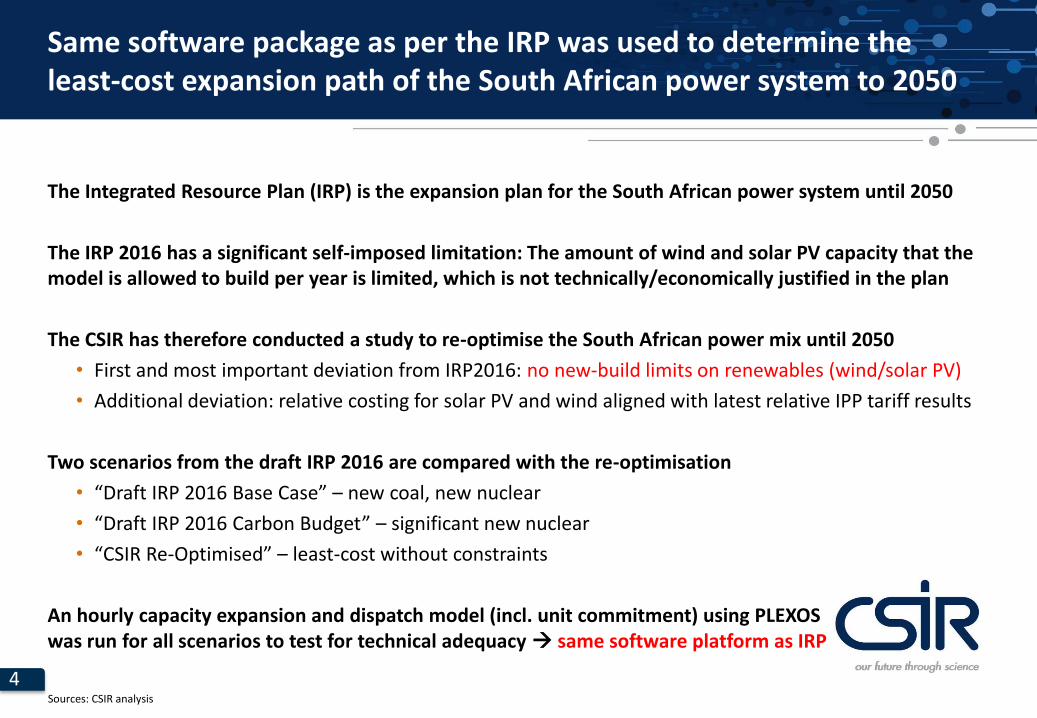
Same software package as per the IRP was used to determine the least-cost expansion path of the South African power system to 2050
The Integrated Resource Plan (IRP) is the expansion plan for the South African power system until 2050
The IRP 2016 has a significant self-imposed limitation: The amount of wind and solar PV capacity that the model is allowed to build per year is limited, which is not technically/economically justified in the plan
The CSIR has therefore conducted a study to re-optimise the South African power mix until 2050
• First and most important deviation from IRP2016: no new-build limits on renewables (wind/solar PV)
• Additional deviation: relative costing for solar PV and wind aligned with latest relative IPP tariff results
Two scenarios from the draft IRP 2016 are compared with the re-optimisation
• “Draft IRP 2016 Base Case” – new coal, new nuclear
• “Draft IRP 2016 Carbon Budget” – significant new nuclear
• “CSIR Re-Optimised” – least-cost without constraints
An hourly capacity expansion and dispatch model (incl. unit commitment) using PLEXOS was run for all scenarios to test for technical adequacy same software platform as IRP
Sources: CSIR analysis

5
Agenda
Expertise of Commentators
Comments on IRP Assumptions
IRP Results and Least-cost Scenario
Proposal / Next Steps
6
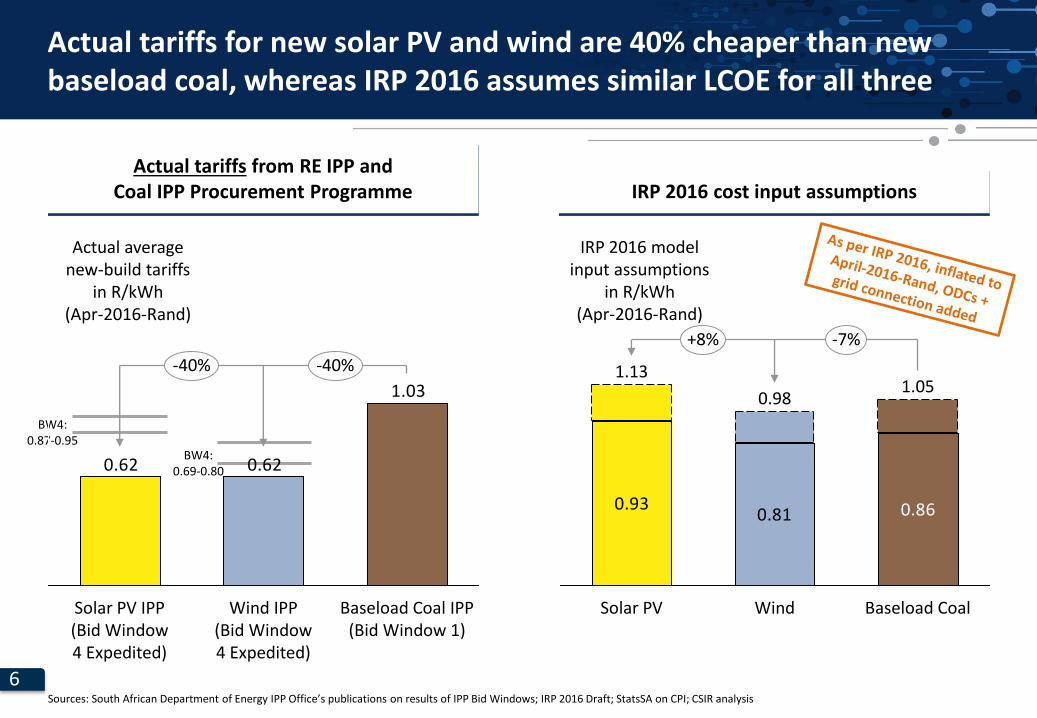
BW4: 0.87-0.95
BW4: 0.69-0.80
Actual tariffs for new solar PV and wind are 40% cheaper than new baseload coal, whereas IRP 2016 assumes similar LCOE for all three
Sources: South African Department of Energy IPP Office’s publications on results of IPP Bid Windows; IRP 2016 Draft; StatsSA on CPI; CSIR analysis
1.03
0.620.62
Wind IPP (Bid Window 4 Expedited)
Solar PV IPP (Bid Window 4 Expedited)
-40% -40%
Baseload Coal IPP (Bid Window 1)
Actual average new-build tariffs
in R/kWh (Apr-2016-Rand)
Actual tariffs from RE IPP and Coal IPP Procurement Programme IRP 2016 cost input assumptions
0.860.810.93
Solar PV
1.13 1.05
Wind
0.98
-7% +8%
Baseload Coal
IRP 2016 model input assumptions
in R/kWh (Apr-2016-Rand)
19
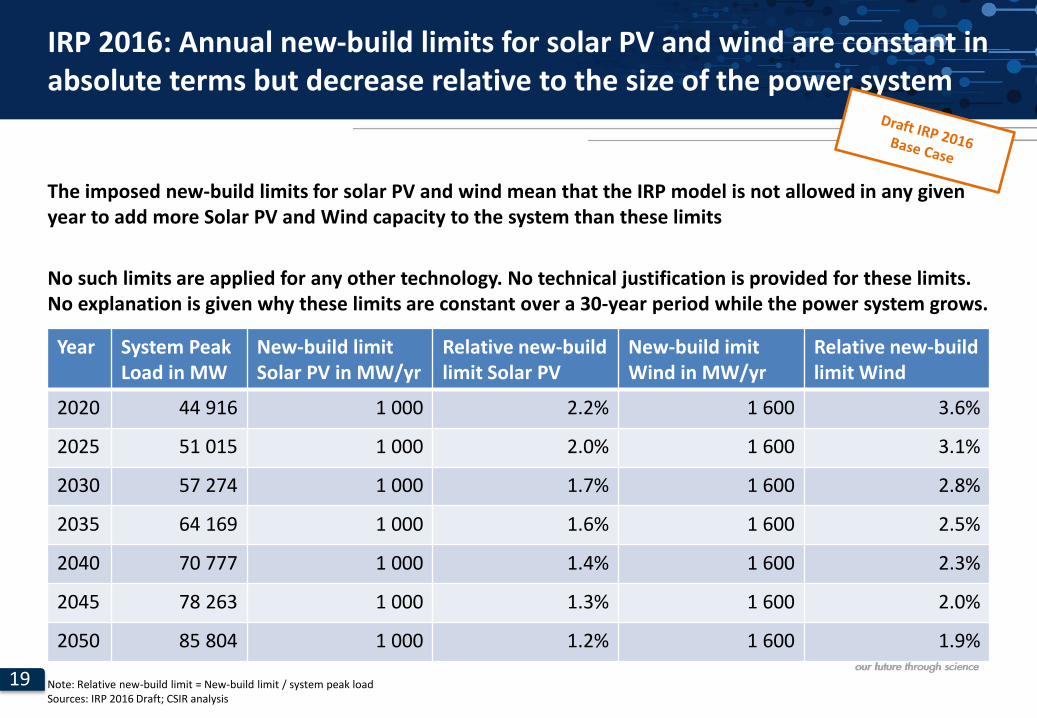
IRP 2016: Annual new-build limits for solar PV and wind are constant in absolute terms but decrease relative to the size of the power system
The imposed new-build limits for solar PV and wind mean that the IRP model is not allowed in any given year to add more Solar PV and Wind capacity to the system than these limits
No such limits are applied for any other technology. No technical justification is provided for these limits. No explanation is given why these limits are constant over a 30-year period while the power system grows.
Year System Peak Load in MW
New-build limit Solar PV in MW/yr
Relative new-build limit Solar PV
New-build imit Wind in MW/yr
Relative new-build limit Wind
2020 44 916 1 000 2.2% 1 600 3.6%
2025 51 015 1 000 2.0% 1 600 3.1%
2030 57 274 1 000 1.7% 1 600 2.8%
2035 64 169 1 000 1.6% 1 600 2.5%
2040 70 777 1 000 1.4% 1 600 2.3%
2045 78 263 1 000 1.3% 1 600 2.0%
2050 85 804 1 000 1.2% 1 600 1.9%
Note: Relative new-build limit = New-build limit / system peak load Sources: IRP 2016 Draft; CSIR analysis
20
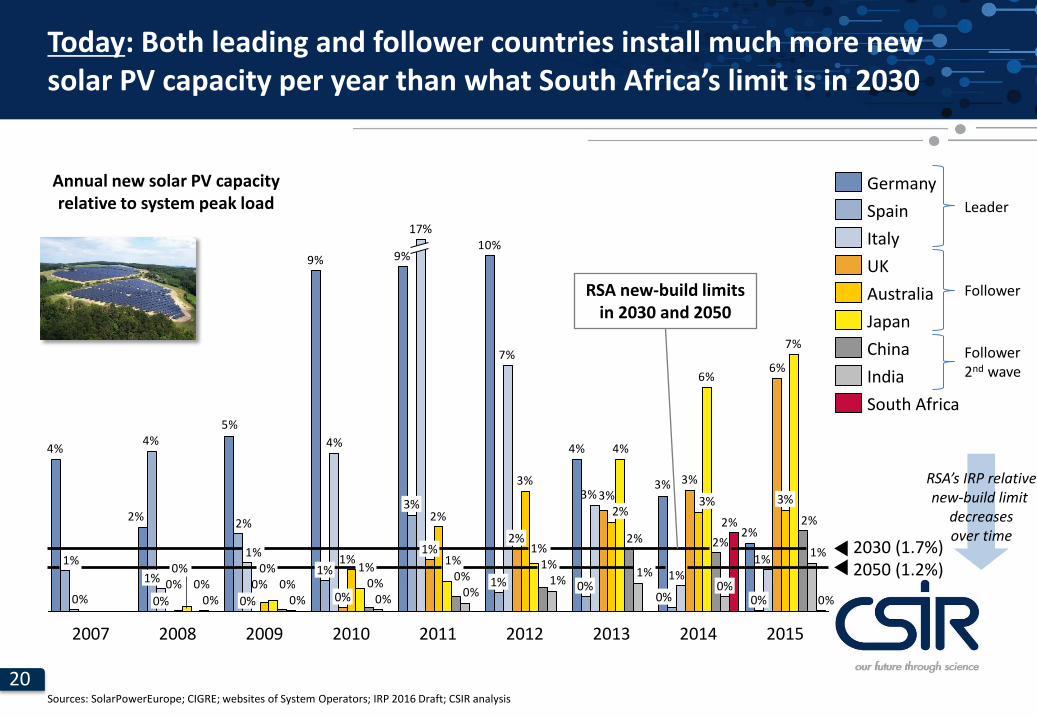
Today: Both leading and follower countries install much more new solar PV capacity per year than what South Africa’s limit is in 2030
2%
3%
4%
10%9%9%
5%
2%
4%
2%
4%
1% 1%1%
3%
7%
4%
1%
0%
6%
3%3%
3%
2%
1%
0%0%
7%
6%
4%
1%1%
1%0%0%
2%
2%2%
1%0%
0%0%0%
1%
1%1%
0%0%0%0% 0%
2%
2007
3%
0%
2014
0%
3%
0%
2008
0%
1%
0%
2013
2%
0%
2012
2%
1%
2011
1%
17%
3%
2010
0%
1%
2009
2050 (1.2%) 2030 (1.7%)
2015
India
South Africa
China
Japan
Australia
UK
Italy
Spain
Germany Annual new solar PV capacity relative to system peak load
RSA’s IRP relative new-build limit
decreases over time
Leader
Follower
Follower 2nd wave
Sources: SolarPowerEurope; CIGRE; websites of System Operators; IRP 2016 Draft; CSIR analysis
RSA new-build limits in 2030 and 2050
21
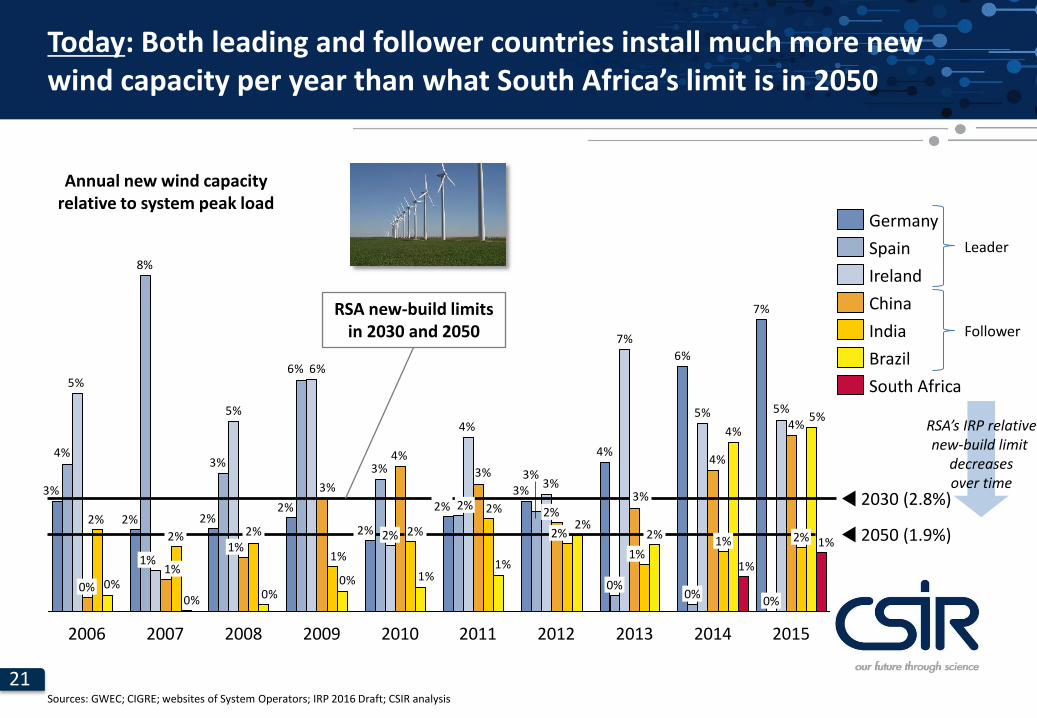
Today: Both leading and follower countries install much more new wind capacity per year than what South Africa’s limit is in 2050
7%
6%
4%
3%2%
2%
2%2%2%
3%3%3%
6%
3%4%
5%5%
7%
3%
4%
6%
5%
5%
4%
4%
3%
3%
4%
3%
2%
2%
1%
2%2%
2%
5%4%
2%2%
1%1%0%
0%0%0%
1%
1%
2050 (1.9%)
2030 (2.8%)
2015
2%
0%
2014
1%
0%
2013
1%
0%
2012
2%
2%
2007
1% 1%
8%
2006
0%
2011
2%
2010
2%
2009 2008
1%
South Africa
Brazil
India
China
Ireland
Spain
Germany
Annual new wind capacity relative to system peak load
RSA’s IRP relative new-build limit
decreases over time
Leader
RSA new-build limits in 2030 and 2050
Sources: GWEC; CIGRE; websites of System Operators; IRP 2016 Draft; CSIR analysis
Follower
24
Agenda
Expertise of Commentators
Comments on IRP Assumptions
IRP Results and Least-cost Scenario
Proposal / Next Steps
25
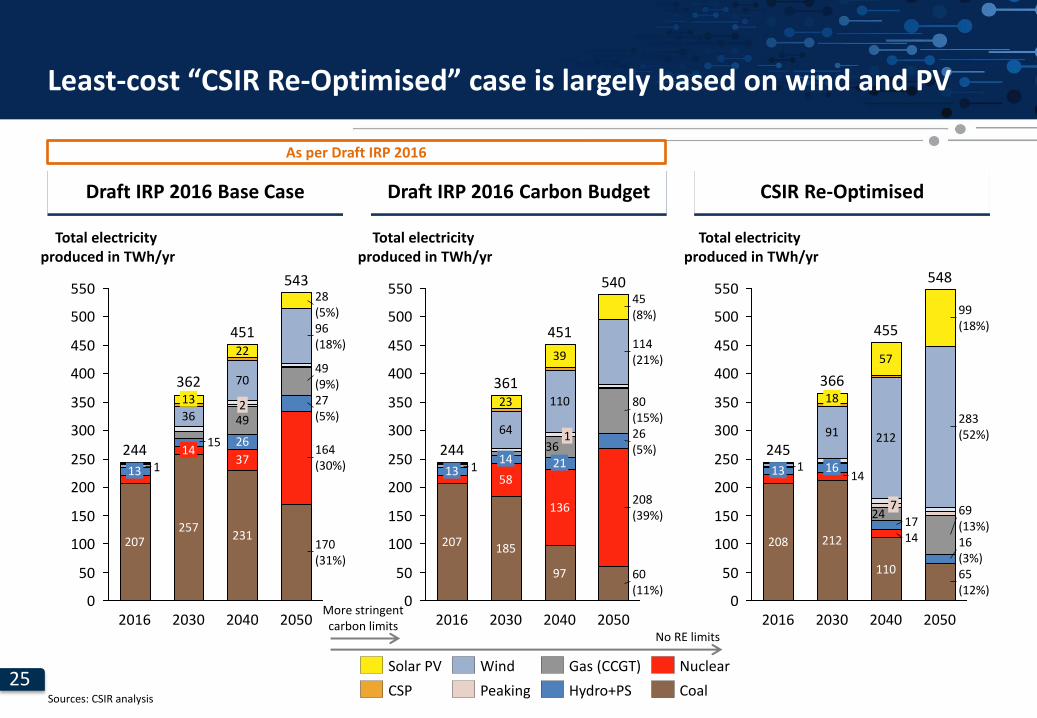
Least-cost “CSIR Re-Optimised” case is largely based on wind and PV
Draft IRP 2016 Base Case CSIR Re-Optimised Draft IRP 2016 Carbon Budget
500
200
100
450
400
350
550
300
250
150
50
0 2030
15
231
451
362
2
164 (30%)
170 (31%)
543
36 27 (5%)
2040
28 (5%) 96 (18%)
49 (9%)
49
26
13
1 13
207
Total electricity produced in TWh/yr
244
2050
70
22
2016
14
257
37
Solar PV
Peaking Hydro+PS
Gas (CCGT)
CSP
Wind Nuclear
Coal
300
100
150
450
500
550
350
400
0
50
200
250
97
451
58
14
1
21
208 (39%)
60 (11%)
80 (15%)
36
23
207
1
64
2016
244
13
2040
114 (21%)
26 (5%)
45 (8%)
2050
361
540
39
136
185
2030
110
Total electricity produced in TWh/yr
0
50
100
200
250
300
350
400
450
150
550
500
24
2030
7
212
366
14
57
69 (13%)
455
110
283 (52%)
99 (18%)
14
2016 2040
18
91
16
212
245
208
13
17
65 (12%)
16 (3%)
2050
Total electricity produced in TWh/yr
1
548
Sources: CSIR analysis
As per Draft IRP 2016
More stringent carbon limits
No RE limits
26
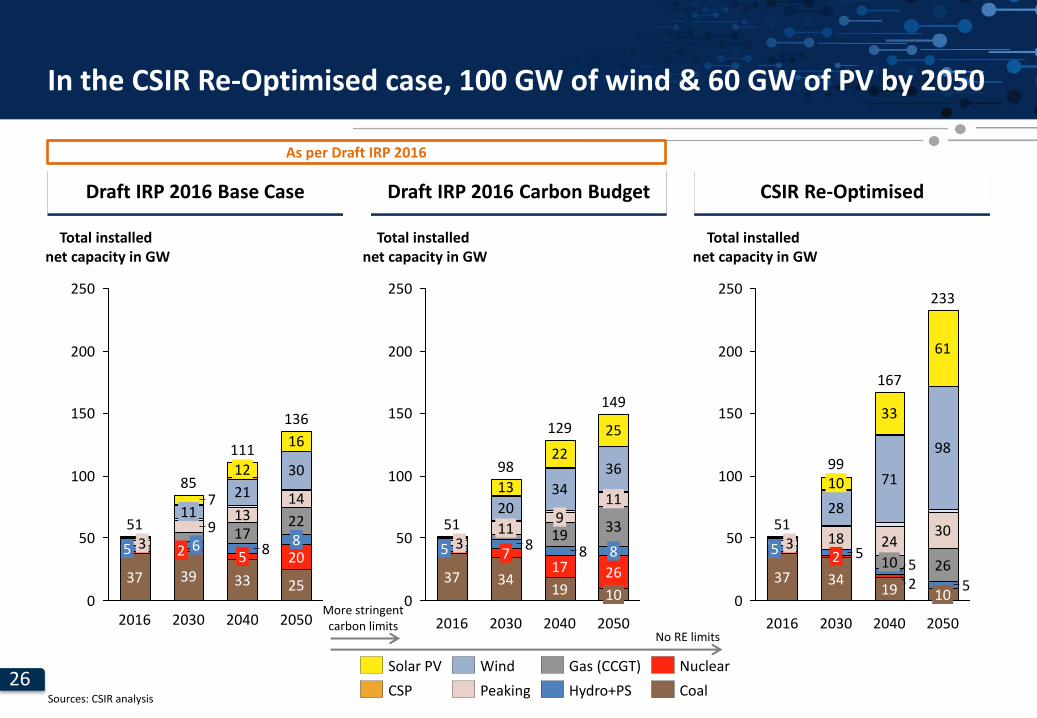
In the CSIR Re-Optimised case, 100 GW of wind & 60 GW of PV by 2050
Draft IRP 2016 Base Case CSIR Re-Optimised Draft IRP 2016 Carbon Budget
150
200
250
50
100
0
3
22 8
20
16
30
14
2050
136
25
2040
111
33
5 8
2030
21
12
17
11
2
Total installed net capacity in GW
9
39
7 85
2016
13 51
37
5 6
Gas (CCGT)
Peaking
Wind Solar PV
CSP Hydro+PS
Nuclear
Coal
200
100
150
0
250
50
2016
51 3 5
37
Total installed net capacity in GW
22
149
10
26
8
33 9
2050
129
19
17 8
19
2040
25
36 98
34
7 8
11
20
2030
11 13 34
0
200
250
100
150
50 3
2016
28
10
233
10
26
5
30
98
33
61
2040
10 5 2 19
167
2030
99
2
34
18 5
24
Total installed net capacity in GW
71
51
5
37
2050
Sources: CSIR analysis
As per Draft IRP 2016
More stringent carbon limits
No RE limits

27
CSIR Re-Optimised case without renewables limits is R90 billion/yr cheaper than both IRP 2016 Base Case & IRP 2016 Carbon Budget case
Draft IRP 2016 Base Case CSIR Re-Optimised Draft IRP 2016 Carbon Budget
R580 billion/yr R490 billion/yr
90 Mt/yr 90 Mt/yr
16 bn l/yr 16 bn l/yr
R580 billion/yr
200 Mt/yr
40 bn l/yr
27% 34% 72%
Sources: CSIR analysis

28
Agenda
Expertise of Commentators
Comments on IRP Assumptions
IRP Results and Least-cost Scenario
Proposal / Next Steps

29
Recommendation: The IRP Base Case should be least-cost, free of any artificial constraints
Solar PV, wind and flexibility is the cheapest new-build mix for the South African power system and it is the cost-optimal expansion to aim for a >70% renewable energy share by 2050
This “CSIR Re-Optimised” mix is R90 billion per year cheaper by 2050 than current Draft IRP Base Case
Also, CSIR Re-Optimised mix reduces CO2 emissions by 65% (-130 Mt/yr) compared to Draft IRP Base Case
Avoiding CO2 emissions and least-cost is not a trade-off anymore – South Africa can de-carbonise its electricity sector at negative carbon-avoidance cost
Recommendation: The IRP Base Case should be least-cost, free of any artificial constraints
• New-build limits for renewables should be lifted, relative costs of wind/PV updated, and the unconstrained re-run should form the Base Case of the IRP 2016
• Any cost increase due to deviations from the least-cost Base Case should be reported on
Note: Wind and solar PV would have to be 60% more expensive than assumed before the IRP Base Case and the CSIR Re-Optimised case break even Sources: CSIR analysis
30
Thank you Re a leboga
Siyathokoza Enkosi
Siyabonga
Re a leboha
Ro livhuha
Ha Khensa
Dankie
Note: „Thank you“ in all official languages of the Republic of South Africa