commerce career services 2014 destinations report career services 2014 destinations report ......
TRANSCRIPT

CommerCe Career ServiCeS2014 Destinations Report
mcintire School of Commerce at the University of virginia

a Letter from the associate DeanDear Friend of mcintire,
This year’s Destinations report highlights not only the continued success of our students, but also the School’s continued commitment to developing innovative programs and initiatives that will ensure its ongoing leadership in global business education. Based on a 100% response rate from those surveyed, the report reflects the outstanding marketability of mcintire students.
Bloomberg Businessweek once again ranked mcintire’s undergraduate program #2 among the nation’s undergraduate business schools, making it the only program to be ranked either #1 or #2 for the nine years the magazine has published rankings. The School continues to strengthen its unique, integrated undergraduate curriculum by further expanding its global partnerships in regions, including Southeast asia and Latin america. our focused tracks in real estate, quantitative finance, business analytics, entrepreneurship, and global commerce continue to offer students expertise in key areas of real-world relevance. entrepreneurship and business analytics have proven to be of particular interest to students, and a select group of highly motivated students will also participate in our rigorous Global Commerce Scholars Program.
mcintire’s three graduate programs likewise continue to distinguish themselves as leaders among their peers. Now in its seventh year, our innovative m.S. in Commerce Program welcomed the largest class to date in august. The 109 members of the Class of 2015 represent more than 44 undergraduate institutions, and the class includes citizens of 13 countries. The m.S. in miT Program, which attracts working professionals with an average of 12 years’ work experience, remains one of the School’s most diverse, with 33% of the students representing U.S. minorities. more than 55 companies and organizations are represented in this year’s class, adding depth and context to class discussions. Finally, our m.S. in accounting Program continues to attract highly motivated students from top colleges and universities, and to enjoy strong and incredibly valuable relationships with leading employers in the industry.
mcintire’s ongoing success is the result of a remarkable team effort—that of our diverse, outstanding students, world-class faculty, superb staff (including our amazing staff here in Commerce Career Services), engaged alumni, and, of course, our incredibly generous and dedicated corporate partners and friends. Your work as interviewers, mentors, advisers, and guest lecturers is an invaluable part of the mcintire experience. We greatly appreciate all that you do for the School, and we look forward to working with you to achieve more great outcomes.
Sincerely,
Tom Fitchassociate Dean for Commerce Career Services & employer relations
“Our success is predicated on the support and involvement of our corporate partners and friends.”
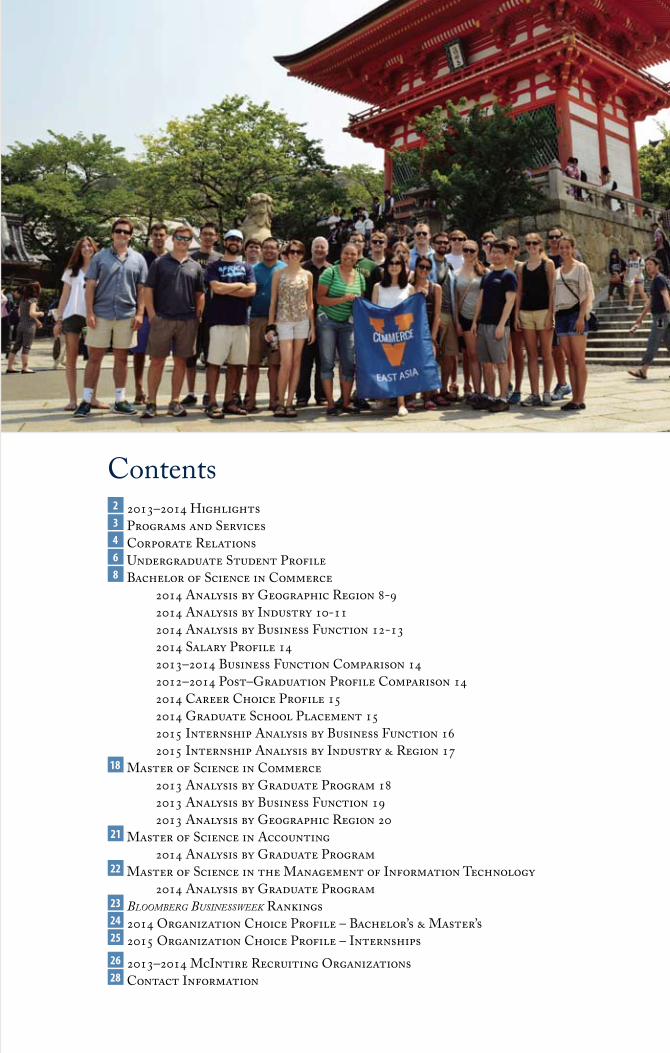
Cover photos by Joel Pattison
Contents2 2013–2014 Highlights3 Programs and Services4 Corporate relations6 Undergraduate Student Profile8 Bachelor of Science in Commerce
2014 analysis by Geographic region 8-9 2014 analysis by industry 10-11 2014 analysis by Business Function 12-13 2014 Salary Profile 14 2013–2014 Business Function Comparison 14 2012–2014 Post–Graduation Profile Comparison 14 2014 Career Choice Profile 15 2014 Graduate School Placement 15 2015 internship analysis by Business Function 16 2015 internship analysis by industry & region 1718 master of Science in Commerce 2013 analysis by Graduate Program 18 2013 analysis by Business Function 19 2013 analysis by Geographic region 2021 master of Science in accounting 2014 analysis by Graduate Program22 master of Science in the management of information Technology 2014 analysis by Graduate Program23 BloomBerg Businessweek rankings24 2014 organization Choice Profile – Bachelor’s & master’s25 2015 organization Choice Profile – internships26 2013–2014 mcintire recruiting organizations28 Contact information
2
2013–2014 Highlights
on-Grounds recruiting activity remained strong, with more than 300 organizations recruiting mcintire students at the University. Highlights of the 2013-2014 recruiting season are listed below:
Over 3,200 Interviewsmcintire students participated in 3,283 out of 6,781 total interviews at the University.
96% Undergraduate Placementas of august 19, 96% of the undergraduate Class of 2014 indicated they had accepted a position (87%), were enrolling in or seeking to enroll in graduate school (7%), or were not in the job market (2%).
Average Salary Is $64,352The average annual base salary for the undergraduate Class of 2014 is $64,352; the median annual base salary is $65,000.
...Plus BonusesThe average signing bonus for the undergraduate Class of 2014 is $8,427 (from information collected on 46% of those reporting). The average estimated annual bonus is $23,779 (from information collected on 20% of those reporting).
Graduate School Destinationsa total of 24 B.S. in Commerce students (7% of the class) indicated they have enrolled in or are seeking enrollment in graduate degree programs, most of which include accounting and law.
Class of 2014: Summer Internships Lead to...eighty-two percent (281 students) of the undergraduate Class of 2014 indicated they had an internship during the summer prior to their fourth year at mcintire. of these students, 43% (147 students) received full-time job offers, and 28% (95 students) accepted full-time employment with the company at which they interned.
Class of 2015: Summer Internships Are Strongas of august 19, 81% (272 students) of the undergraduate Class of 2015 indicated they had an internship during the summer prior to their fourth year at mcintire. The average internship monthly wage is $4,142; the average internship hourly wage is $22.26.
95% Employment: M.S. in Commerceas of December 10, 2013, 95% of the m.S. in Commerce Class of 2013 reported being employed or plans to pursue further graduate studies. The average annual base salary is $55,903; the median annual base salary is $57,000.
96% Employment: M.S. in Accountingas of august 19, 96% of the m.S. in accounting Class of 2014 reported being employed, and 2% indicated they were not in the job market. The average base salary is $55,489; the median annual base salary is $56,500.
99% Employment: M.S. in the Management of Information Technologyat graduation, 99% (72 out of 73) of m.S. in the management of information Technology Class of 2014 reported being employed.
3
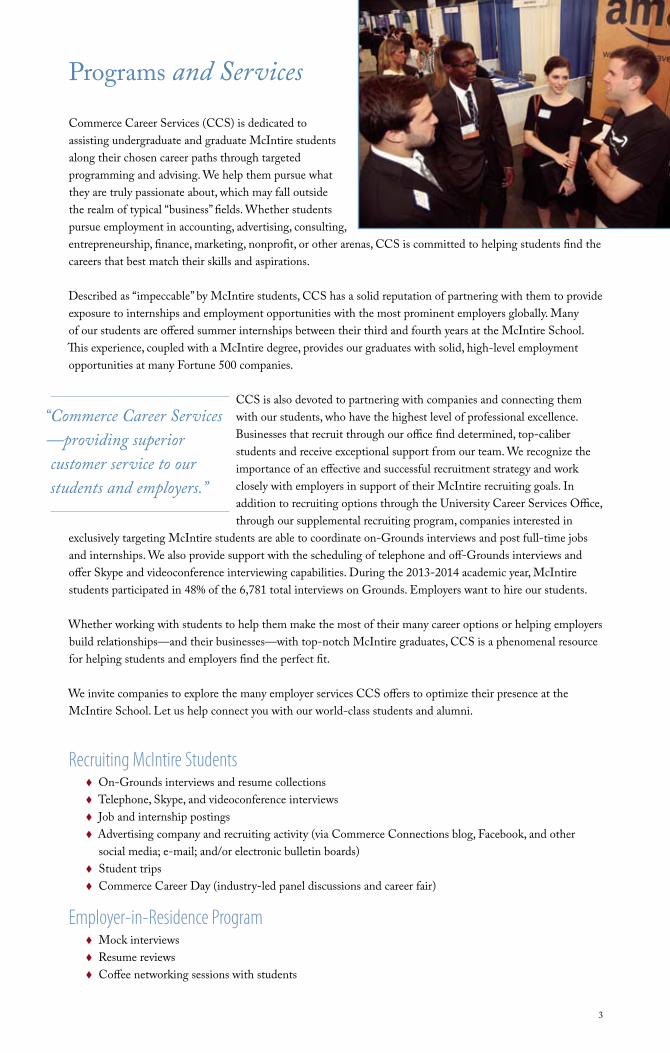
Programs and ServicesCommerce Career Services (CCS) is dedicated to assisting undergraduate and graduate mcintire students along their chosen career paths through targeted programming and advising. We help them pursue what they are truly passionate about, which may fall outside the realm of typical “business” fields. Whether students pursue employment in accounting, advertising, consulting, entrepreneurship, finance, marketing, nonprofit, or other arenas, CCS is committed to helping students find the careers that best match their skills and aspirations. Described as “impeccable” by mcintire students, CCS has a solid reputation of partnering with them to provide exposure to internships and employment opportunities with the most prominent employers globally. many of our students are offered summer internships between their third and fourth years at the mcintire School. This experience, coupled with a mcintire degree, provides our graduates with solid, high-level employment opportunities at many Fortune 500 companies.
CCS is also devoted to partnering with companies and connecting them with our students, who have the highest level of professional excellence. Businesses that recruit through our office find determined, top-caliber students and receive exceptional support from our team. We recognize the importance of an effective and successful recruitment strategy and work closely with employers in support of their mcintire recruiting goals. in addition to recruiting options through the University Career Services office, through our supplemental recruiting program, companies interested in
exclusively targeting mcintire students are able to coordinate on-Grounds interviews and post full-time jobs and internships. We also provide support with the scheduling of telephone and off-Grounds interviews and offer Skype and videoconference interviewing capabilities. During the 2013-2014 academic year, mcintire students participated in 48% of the 6,781 total interviews on Grounds. employers want to hire our students.
Whether working with students to help them make the most of their many career options or helping employers build relationships—and their businesses—with top-notch mcintire graduates, CCS is a phenomenal resource for helping students and employers find the perfect fit.
We invite companies to explore the many employer services CCS offers to optimize their presence at the mcintire School. Let us help connect you with our world-class students and alumni.
Recruiting McIntire Studentson-Grounds interviews and resume collections��
Telephone, Skype, and videoconference interviews��
Job and internship postings ��
advertising company and recruiting activity (via Commerce Connections blog, Facebook, and other ��
social media; e-mail; and/or electronic bulletin boards)Student trips��
Commerce Career Day (industry-led panel discussions and career fair)��
Employer-in-Residence Programmock interviews��
resume reviews��
Coffee networking sessions with students��
“Commerce Career Services —providing superior customer service to our students and employers.”

4
Corporate Relations at mcintire
Enhance Your Corporate Presence at McIntire mcintire Corporate Partners strengthen their brand and boost their visibility through sponsorships, recruiting,
and support of academic programs. in addition to gaining access to our excellent faculty and students, partners also have the opportunity to participate in mcintire Center activities and further develop employees through graduate and executive education. Beyond the core Corporate Partner benefits, our team works with you to create targeted strategies that will help achieve your goals. Tailored interactions differentiate your company and allow students and faculty to get to know you better.
Corporate Partners enjoy the following core benefits:
Engage FacultyConnect to students and programs through your faculty liaison��
Create an ongoing dialogue with faculty about current business issues��
meet with key faculty leaders through annual Corporate Partner events��
Gain Priorityregister in advance for interview dates (University-wide)��
enjoy privileged access to faculty and students through private events��
receive special recognition and booth placement at Commerce Career Day��
Increase VisibilityParticipate in customized student organization or classroom activities��
receive ongoing recognition at mcintire and in School publications ��
Host student and alumni events at your firm��
To join the Corporate Partners Program, contact Allison Teweles, Assistant Dean for Corporate & Foundation Relations, at 434-924-0752 or [email protected].
4
“During the last 10 years, McIntire has increased its global reach and been rated as one of the best undergraduate business schools in the country. I am always impressed by the students I meet, and I know that McIntire’s reputation is hard-won and well-deserved.”
—Will Powers, Rolls-Royce, N.A.
5
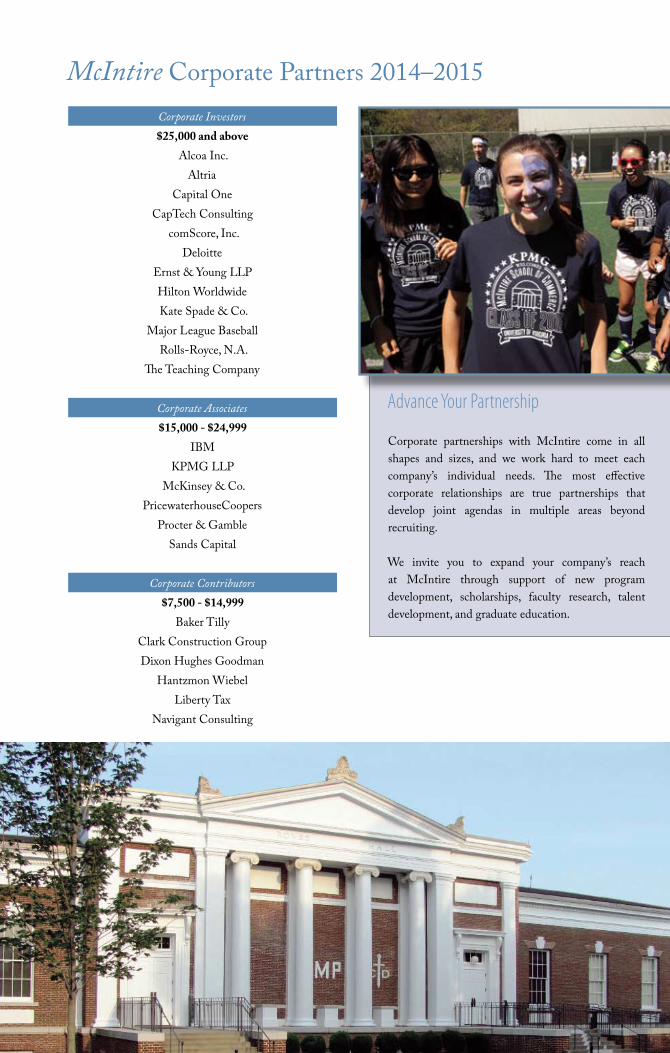
Advance Your Partnership
Corporate partnerships with mcintire come in all shapes and sizes, and we work hard to meet each company’s individual needs. The most effective corporate relationships are true partnerships that develop joint agendas in multiple areas beyond recruiting.
We invite you to expand your company’s reach at mcintire through support of new program development, scholarships, faculty research, talent development, and graduate education.
McIntire Corporate Partners 2014–2015Corporate Investors$25,000 and above
alcoa inc.altria
Capital oneCapTech Consulting
comScore, inc.Deloitte
ernst & Young LLPHilton WorldwideKate Spade & Co.
major League Baseballrolls-royce, N.a.
The Teaching Company
Corporate Associates$15,000 - $24,999
iBmKPmG LLP
mcKinsey & Co.PricewaterhouseCoopers
Procter & GambleSands Capital
Corporate Contributors$7,500 - $14,999
Baker TillyClark Construction GroupDixon Hughes Goodman
Hantzmon WiebelLiberty Tax
Navigant Consulting
6
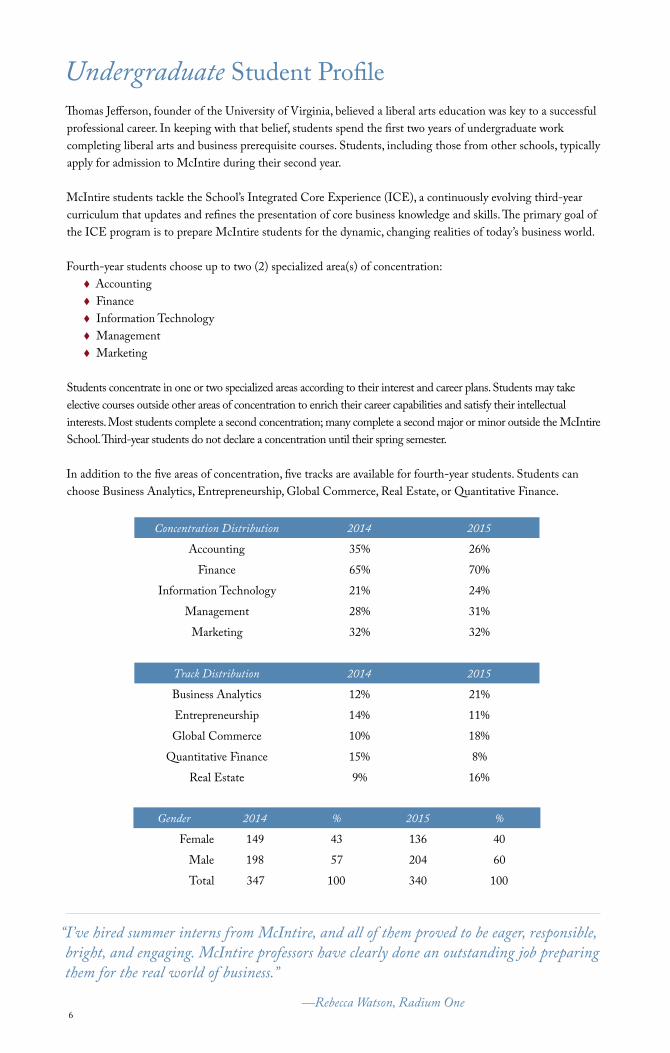
Concentration Distribution 2014 2015
accounting 35% 26%
Finance 65% 70%
information Technology 21% 24%
management 28% 31%
marketing 32% 32%
Track Distribution 2014 2015
Business analytics 12% 21%
entrepreneurship 14% 11%
Global Commerce 10% 18%
Quantitative Finance 15% 8%
real estate 9% 16%
Gender 2014 % 2015 %
Female 149 43 136 40
male 198 57 204 60
Total 347 100 340 100
Undergraduate Student Profile Thomas Jefferson, founder of the University of virginia, believed a liberal arts education was key to a successful professional career. in keeping with that belief, students spend the first two years of undergraduate work completing liberal arts and business prerequisite courses. Students, including those from other schools, typically apply for admission to mcintire during their second year.
mcintire students tackle the School’s integrated Core experience (iCe), a continuously evolving third-year curriculum that updates and refines the presentation of core business knowledge and skills. The primary goal of the iCe program is to prepare mcintire students for the dynamic, changing realities of today’s business world.
Fourth-year students choose up to two (2) specialized area(s) of concentration:accounting��
Finance��
information Technology��
management��
marketing��
Students concentrate in one or two specialized areas according to their interest and career plans. Students may take elective courses outside other areas of concentration to enrich their career capabilities and satisfy their intellectual interests. most students complete a second concentration; many complete a second major or minor outside the mcintire School. Third-year students do not declare a concentration until their spring semester.
in addition to the five areas of concentration, five tracks are available for fourth-year students. Students can choose Business analytics, entrepreneurship, Global Commerce, real estate, or Quantitative Finance.
“I’ve hired summer interns from McIntire, and all of them proved to be eager, responsible, bright, and engaging. McIntire professors have clearly done an outstanding job preparing them for the real world of business.”
—Rebecca Watson, Radium One

7
Undergraduate Student ProfileCitizenship 2014 2015
U.S. Citizen or Permanent residence 85% 85%
Students with visas 15% 15%
Ethnicity* 2014 2015
african/african-american 5% 5.0%
alien Temporary** 14.5% 14.4%
asian/asian-american 15.7% 16.2%
Caucasian 64.5% 65.9%
Hispanic 5.9% 5.9%
Native american 0.3% 0.6%
Native Hawaiian for Pacific islander 0.3% 0.3%
Unclassified 2.1% 2.4%*more than one ethnicity may be reported.
**alien Temporary hold citizenships from countries other than the United States.
For additional information go to www.commerce.virginia.edu/about/studentprofile/Pages/Undergraduate-Profile.aspx
“In the two years I’ve been a member of this community at McIntire, the high level of dedication, teamwork, and scholarship has never ceased to amaze me. On top of it all, our Career Services professionals are second to none. I truly felt like they made my goals their own, and I would not be where I am today if it were not for their continued support, guidance, and advice during the entire recruitment process.”
—Chris Roy, BSC Class of 2014

8
2014 Analysis by Geographic RegionBachelor of Science in Commerce
Region, City and State % Responses*Average Base
Salary ($)Median Base
Salary ($)Base Salary Range ($)
% Responses (Average Signing Bonus)**
Average Signing Bonus ($)
% Responses (Average Annual Bonus)***
Average Annual Bonus ($)
Average Total Compensation ($)
Midwest 3.9% 61,722 60,000 53,000 –75,000 3.4% 7,000 6.0% 10,675 70,356Chicago, iL 2.2% 66,500 63,000 60,000 –75,000 3.4% 7,000 4.5% 12,400 80,940
Northeast/Mid-Atlantic 44.8% 66,314 70,000 35,000 –85,000 49.7% 9,340 55.2% 31,689 84,226
New York, NY 36.1% 67,693 70,000 35,000 –85,000 42.1% 9,451 40.3% 36,389 86,476
Boston, ma 3.9% 60,145 60,000 44,000 –72,500 4.1% 7,167 9.0% 22,500 79,923
Philadelphia, Pa 2.2% 67,000 70,000 55,000 –70,000 2.1% 11,667 3.0% 22,500 83,000
Bethesda, mD 0.9% 53,500 53,500 52,000 –55,000 0.7% 6,000 1.5% 5,000 59,000
South/Southeast 40.9% 61,599 60,000 40,000 –90,000 36.6% 7,491 26.9% 14,490 68,597mcLean, va 10.0% 59,239 56,700 46,000 –72,500 8.3% 6,167 4.5% 9,333 63,674
Washington, D.C. 5.2% 63,125 60,000 56,000 –80,000 5.5% 5,750 u u 66,958
arlington, va 3.9% 69,167 72,500 50,000 –90,000 3.4% 11,000 3.0% 7,750 77,000
atlanta, Ga 3.9% 66,111 65,000 54,000 –72,500 4.8% 8,929 3.0% 13,500 76,056
reston, va 3.9% 65,889 60,000 60,000 –80,000 2.8% 3,250 1.5% 50,000 72,889
richmond, va 3.5% 60,250 59,500 51,000 –70,000 3.4% 6,400 u u 64,250
vienna, va 2.2% 56,201 55,000 48,006 –65,000 1.4% 7,000 1.5% 37,800 66,561
Charlotte, NC 1.3% 65,000 65,000 65,000 –65,000 2.1% 15,000 1.5% 50,000 96,667
Charlottesville, va 1.3% 52,000 56,000 40,000 –60,000 u u 3.0% 8,600 57,733
Tysons Corner, va 1.3% 65,333 70,000 56,000 –70,000 1.4% 10,000 1.5% 8,000 74,667
West/Southwest 10.4% 65,676 60,000 45,000 –110,000 10.3% 9,600 11.9% 16,875 77,301San Francisco, Ca 5.7% 64,709 70,000 45,720 –90,000 4.8% 8,857 6.0% 11,250 72,940
Houston, TX 0.9% 61,750 61,750 53,500 –70,000 u u 1.5% 5,000 64,250
Los angeles, Ca 0.9% 85,000 85,000 70,000 –100,000 0.7% 5,000 u u 87,500
International acceptances in Beijing, Hong Kong, Mexico City, and Singapore were also reported.
only select cities are noted from information collected.*Based on those who reported a salary.
**Based on those who reported a signing bonus.***Based on those who reported an annual bonus.
u�None or less than 1% reported.
“I’m so appreciative of all the timely and thoughtful help that CCS offered me! Before coming to the program, I knew little about the job market and recruiting culture in the United States. The handouts covering different aspects of recruiting and the workshops involving more interaction prepared me so well for the interviews. More importantly, the personalized counsel I received from CCS helped me to realize both my strengths and weaknesses so that I could improve myself more effectively! The learning curve is hard sometimes, but it is worth a try.”
—Kailun Zheng, MSC 2014

9
West/Southwest
Midwest Northeast/Mid-Atlantic
South/Southeast
Region, City and State % Responses*Average Base
Salary ($)Median Base
Salary ($)Base Salary Range ($)
% Responses (Average Signing Bonus)**
Average Signing Bonus ($)
% Responses (Average Annual Bonus)***
Average Annual Bonus ($)
Average Total Compensation ($)
Midwest 3.9% 61,722 60,000 53,000 –75,000 3.4% 7,000 6.0% 10,675 70,356Chicago, iL 2.2% 66,500 63,000 60,000 –75,000 3.4% 7,000 4.5% 12,400 80,940
Northeast/Mid-Atlantic 44.8% 66,314 70,000 35,000 –85,000 49.7% 9,340 55.2% 31,689 84,226
New York, NY 36.1% 67,693 70,000 35,000 –85,000 42.1% 9,451 40.3% 36,389 86,476
Boston, ma 3.9% 60,145 60,000 44,000 –72,500 4.1% 7,167 9.0% 22,500 79,923
Philadelphia, Pa 2.2% 67,000 70,000 55,000 –70,000 2.1% 11,667 3.0% 22,500 83,000
Bethesda, mD 0.9% 53,500 53,500 52,000 –55,000 0.7% 6,000 1.5% 5,000 59,000
South/Southeast 40.9% 61,599 60,000 40,000 –90,000 36.6% 7,491 26.9% 14,490 68,597mcLean, va 10.0% 59,239 56,700 46,000 –72,500 8.3% 6,167 4.5% 9,333 63,674
Washington, D.C. 5.2% 63,125 60,000 56,000 –80,000 5.5% 5,750 u u 66,958
arlington, va 3.9% 69,167 72,500 50,000 –90,000 3.4% 11,000 3.0% 7,750 77,000
atlanta, Ga 3.9% 66,111 65,000 54,000 –72,500 4.8% 8,929 3.0% 13,500 76,056
reston, va 3.9% 65,889 60,000 60,000 –80,000 2.8% 3,250 1.5% 50,000 72,889
richmond, va 3.5% 60,250 59,500 51,000 –70,000 3.4% 6,400 u u 64,250
vienna, va 2.2% 56,201 55,000 48,006 –65,000 1.4% 7,000 1.5% 37,800 66,561
Charlotte, NC 1.3% 65,000 65,000 65,000 –65,000 2.1% 15,000 1.5% 50,000 96,667
Charlottesville, va 1.3% 52,000 56,000 40,000 –60,000 u u 3.0% 8,600 57,733
Tysons Corner, va 1.3% 65,333 70,000 56,000 –70,000 1.4% 10,000 1.5% 8,000 74,667
West/Southwest 10.4% 65,676 60,000 45,000 –110,000 10.3% 9,600 11.9% 16,875 77,301San Francisco, Ca 5.7% 64,709 70,000 45,720 –90,000 4.8% 8,857 6.0% 11,250 72,940
Houston, TX 0.9% 61,750 61,750 53,500 –70,000 u u 1.5% 5,000 64,250
Los angeles, Ca 0.9% 85,000 85,000 70,000 –100,000 0.7% 5,000 u u 87,500
International acceptances in Beijing, Hong Kong, Mexico City, and Singapore were also reported.
only select cities are noted from information collected.*Based on those who reported a salary.
**Based on those who reported a signing bonus.***Based on those who reported an annual bonus.
u�None or less than 1% reported.

10
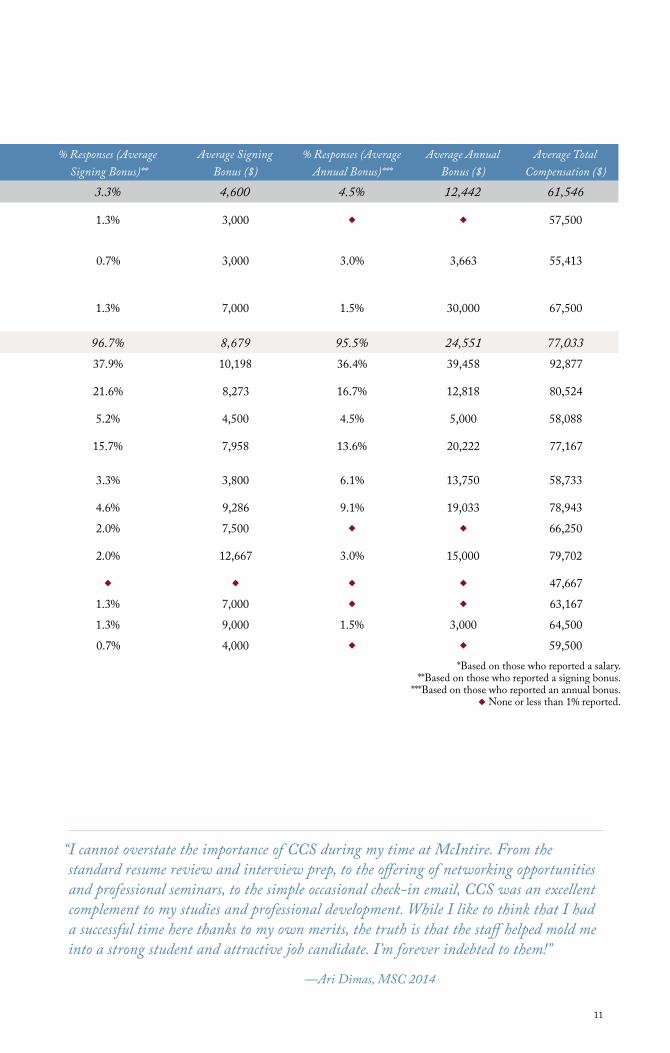
2014 Analysis by IndustryBachelor of Science in Commerce
Industry % Responses*Average Base
Salary ($)Median Base
Salary ($)Base Salary Range ($)
% Responses (Average Signing Bonus)**
Average Signing Bonus ($)
% Responses (Average Annual Bonus)***
Average Annual Bonus ($)
Average Total Compensation ($)
Total Manufacturing 3.0% 52,929 54,000 45,000 –70,000 3.3% 4,600 4.5% 12,442 61,546auto/aerospace/
other Transportation 0.9% 54,500 54,500 54,000 –55,000 1.3% 3,000 u u 57,500
Consumer Goods (Food, Beverage, Tobacco,
Household Products)0.9% 50,250 50,250 46,500 –54,000 0.7% 3,000 3.0% 3,663 55,413
High Technology (electronics, Computers,
Telecommunications)0.9% 45,500 45,500 45,000 –46,000 1.3% 7,000 1.5% 30,000 67,500
Total Service 97.0% 64,615 70,000 35,000 –110,000 96.7% 8,679 95.5% 24,551 77,033investment Banking 27.7% 69,208 70,000 50,000 –80,000 37.9% 10,198 36.4% 39,458 92,877
Consulting (not with accounting firms) 17.9% 70,667 72,500 52,000 –90,000 21.6% 8,273 16.7% 12,818 80,524
Public accounting 14.5% 56,588 56,000 51,000 –68,000 5.2% 4,500 4.5% 5,000 58,088
Diversified Financial Services 12.8% 64,733 69,000 45,000 –85,000 15.7% 7,958 13.6% 20,222 77,167
advertising/marketing Services/Public relations 6.8% 54,108 58,500 35,000 –62,500 3.3% 3,800 6.1% 13,750 58,733
investment management 6.0% 66,143 70,000 56,000 –75,000 4.6% 9,286 9.1% 19,033 78,943
Commercial Banking 2.6% 62,500 65,000 50,000 –70,000 2.0% 7,500 u u 66,250
High Technology/e-Commerce 1.7% 62,702 59,904 55,000 –76,000 2.0% 12,667 3.0% 15,000 79,702
Law 1.3% 47,667 43,000 40,000 –60,000 u u u u 47,667
retail 1.3% 58,500 55,000 48,000 –72,500 1.3% 7,000 u u 63,167
Government 0.9% 54,000 54,000 50,000 –58,000 1.3% 9,000 1.5% 3,000 64,500
insurance 0.9% 57,500 57,500 53,000 –62,000 0.7% 4,000 u u 59,500*Based on those who reported a salary.
**Based on those who reported a signing bonus.***Based on those who reported an annual bonus.
u None or less than 1% reported.
“I would and have recommended the McIntire experience to Virginia underclassmen and even prospective college students. Third year is a challenge, but the hard work is worth it, and most students end up landing the internship and (ultimately) job opportunities of their choice. Overall, I am extremely grateful to the faculty, Commerce Career Services, and the McIntire community in general for what has been a remarkable experience.”
—Patrick Shikani, BSC Class of 2014
11
Industry % Responses*Average Base
Salary ($)Median Base
Salary ($)Base Salary Range ($)
% Responses (Average Signing Bonus)**
Average Signing Bonus ($)
% Responses (Average Annual Bonus)***
Average Annual Bonus ($)
Average Total Compensation ($)
Total Manufacturing 3.0% 52,929 54,000 45,000 –70,000 3.3% 4,600 4.5% 12,442 61,546auto/aerospace/
other Transportation 0.9% 54,500 54,500 54,000 –55,000 1.3% 3,000 u u 57,500
Consumer Goods (Food, Beverage, Tobacco,
Household Products)0.9% 50,250 50,250 46,500 –54,000 0.7% 3,000 3.0% 3,663 55,413
High Technology (electronics, Computers,
Telecommunications)0.9% 45,500 45,500 45,000 –46,000 1.3% 7,000 1.5% 30,000 67,500
Total Service 97.0% 64,615 70,000 35,000 –110,000 96.7% 8,679 95.5% 24,551 77,033investment Banking 27.7% 69,208 70,000 50,000 –80,000 37.9% 10,198 36.4% 39,458 92,877
Consulting (not with accounting firms) 17.9% 70,667 72,500 52,000 –90,000 21.6% 8,273 16.7% 12,818 80,524
Public accounting 14.5% 56,588 56,000 51,000 –68,000 5.2% 4,500 4.5% 5,000 58,088
Diversified Financial Services 12.8% 64,733 69,000 45,000 –85,000 15.7% 7,958 13.6% 20,222 77,167
advertising/marketing Services/Public relations 6.8% 54,108 58,500 35,000 –62,500 3.3% 3,800 6.1% 13,750 58,733
investment management 6.0% 66,143 70,000 56,000 –75,000 4.6% 9,286 9.1% 19,033 78,943
Commercial Banking 2.6% 62,500 65,000 50,000 –70,000 2.0% 7,500 u u 66,250
High Technology/e-Commerce 1.7% 62,702 59,904 55,000 –76,000 2.0% 12,667 3.0% 15,000 79,702
Law 1.3% 47,667 43,000 40,000 –60,000 u u u u 47,667
retail 1.3% 58,500 55,000 48,000 –72,500 1.3% 7,000 u u 63,167
Government 0.9% 54,000 54,000 50,000 –58,000 1.3% 9,000 1.5% 3,000 64,500
insurance 0.9% 57,500 57,500 53,000 –62,000 0.7% 4,000 u u 59,500*Based on those who reported a salary.
**Based on those who reported a signing bonus.***Based on those who reported an annual bonus.
u None or less than 1% reported.
“I cannot overstate the importance of CCS during my time at McIntire. From the standard resume review and interview prep, to the offering of networking opportunities and professional seminars, to the simple occasional check-in email, CCS was an excellent complement to my studies and professional development. While I like to think that I had a successful time here thanks to my own merits, the truth is that the staff helped mold me into a strong student and attractive job candidate. I’m forever indebted to them!”
—Ari Dimas, MSC 2014

12
2014 Analysis by Business FunctionBachelor of Science in Commerce
Business Function % Responses* Average Base Salary ($)
Median Base Salary ($)
Base Salary Range ($)
% Responses (Average Signing Bonus)**
Average Signing Bonus ($)
% Responses (Average Annual Bonus)***
Average Annual Bonus ($)
Average Total Compensation ($)
Accounting 11.2% 55,339 56,000 51,000 –63,000 1.9% 4,333 0.6% 5,000 56,161audit 6.8% 54,606 56,000 51,000 –57,000 0.6% 3,000 0.6% 5,000 55,371
audit/Tax 1.6% 54,175 54,350 51,000 –57,000 u u u u 54,175
other accounting 1.2% 55,667 56,000 55,000 –56,000 0.6% 5,000 u u 57,333
Tax Specialist(Public accounting) 0.8% 59,250 59,250 58,500 –60,000 u u u u 59,250
Consulting 23.3% 67,052 70,000 46,000 –90,000 28.3% 6,844 4.1% 11,679 75,181management 6.0% 71,933 72,500 55,000 –90,000 8.8% 8,714 2.0% 14,500 86,833
Technology/information Systems 6.0% 67,033 70,000 46,000 –76,000 5.7% 5,889 0.3% 18,000 71,767
other Consulting 4.0% 60,500 60,500 52,000 –76,000 3.1% 4,200 0.3% 3,000 62,900
Business 3.2% 67,439 65,004 56,500 –90,000 5.0% 5,375 0.3% 15,000 74,689
Strategic 3.2% 68,500 71,250 50,000 –75,000 4.4% 8,143 0.9% 7,000 78,250
Financial 0.8% 56,000 56,000 52,000 –60,000 1.3% 6,000 0.3% 5,000 64,500
Finance 47.8% 66,725 70,000 50,000 –80,000 56.0% 9,506 12.5% 31,493 85,214analyst-investment/Corporate Banking 27.7% 69,312 70,000 50,000 –80,000 37.1% 10,034 7.0% 40,708 92,051
investment management/research/Trust 7.2% 65,889 70,000 50,000 –75,000 8.2% 9,231 2.0% 25,314 82,400
Corporate Finance/Treasury (within corp.) 2.4% 58,333 55,500 54,000 –70,000 1.9% 7,000 0.3% 5,500 62,750
Sales/Trading 2.4% 70,000 70,000 70,000 –70,000 2.5% 11,750 0.3% 40,000 84,500
Commercial Banking (investment analysis) 1.6% 62,500 65,000 50,000 –70,000 2.5% 6,125 0.6% 10,000 73,625
real estate Finance/Development 1.6% 60,625 58,750 55,000 –70,000 1.3% 6,250 0.9% 22,500 80,625
Commercial Banking (retail) 1.2% 58,333 60,000 55,000 –60,000 1.3% 9,000 0.3% 2,000 65,000
Commercial Lending 1.2% 61,000 58,000 55,000 –70,000 1.3% 5,500 0.3% 5,000 66,333
Financial Planning 1.2% 55,433 53,300 53,000 –60,000 u u u u 55,433
venture Capital 1.2% 61,667 65,000 50,000 –70,000 u u 0.9% 20,000 81,667
Information Technology 3.2% 72,563 66,250 55,000 –110,000 3.1% 7,800 0.3% 20,000 79,938Business/Systems analyst 1.6% 61,375 59,000 55,000 –72,500 1.9% 8,000 u u 67,375
internet/e-Commerce 0.8% 85,000 85,000 60,000 –110,000 0.6% 10,000 0.3% 20,000 100,000
Programming 0.8% 82,500 82,500 80,000 –85,000 0.6% 5,000 u u 85,000
Marketing/Sales 10.4% 56,347 56,000 40,000 –90,000 8.2% 7,769 2.0% 15,214 64,328Sales/Sales management 3.2% 57,350 56,900 44,000 –90,000 3.8% 6,000 1.5% 19,000 73,725
market research 2.0% 56,000 60,000 40,000 –60,000 1.3% 1,000 u u 56,400
Product/Brand management 2.0% 56,500 55,000 48,000 –72,500 2.5% 13,250 u u 67,100
Services marketing 2.0% 58,745 60,000 45,720 –80,000 0.6% 10,000 0.3% 7,000 62,145
advertising/Public relations 0.8% 47,500 47,500 45,000 –50,000 u u 0.3% 4,500 49,750
Operations u u u u u u u u u
Other† 3.6% 56,056 50,000 35,000 –100,000 1.9% 9,667 0.9% 3,442 60,425
These salary figures reflect accepted offers. They are based on information collected on students who reported accepting full-time employment by august 2014.

13
Business Function % Responses* Average Base Salary ($)
Median Base Salary ($)
Base Salary Range ($)
% Responses (Average Signing Bonus)**
Average Signing Bonus ($)
% Responses (Average Annual Bonus)***
Average Annual Bonus ($)
Average Total Compensation ($)
Accounting 11.2% 55,339 56,000 51,000 –63,000 1.9% 4,333 0.6% 5,000 56,161audit 6.8% 54,606 56,000 51,000 –57,000 0.6% 3,000 0.6% 5,000 55,371
audit/Tax 1.6% 54,175 54,350 51,000 –57,000 u u u u 54,175
other accounting 1.2% 55,667 56,000 55,000 –56,000 0.6% 5,000 u u 57,333
Tax Specialist(Public accounting) 0.8% 59,250 59,250 58,500 –60,000 u u u u 59,250
Consulting 23.3% 67,052 70,000 46,000 –90,000 28.3% 6,844 4.1% 11,679 75,181management 6.0% 71,933 72,500 55,000 –90,000 8.8% 8,714 2.0% 14,500 86,833
Technology/information Systems 6.0% 67,033 70,000 46,000 –76,000 5.7% 5,889 0.3% 18,000 71,767
other Consulting 4.0% 60,500 60,500 52,000 –76,000 3.1% 4,200 0.3% 3,000 62,900
Business 3.2% 67,439 65,004 56,500 –90,000 5.0% 5,375 0.3% 15,000 74,689
Strategic 3.2% 68,500 71,250 50,000 –75,000 4.4% 8,143 0.9% 7,000 78,250
Financial 0.8% 56,000 56,000 52,000 –60,000 1.3% 6,000 0.3% 5,000 64,500
Finance 47.8% 66,725 70,000 50,000 –80,000 56.0% 9,506 12.5% 31,493 85,214analyst-investment/Corporate Banking 27.7% 69,312 70,000 50,000 –80,000 37.1% 10,034 7.0% 40,708 92,051
investment management/research/Trust 7.2% 65,889 70,000 50,000 –75,000 8.2% 9,231 2.0% 25,314 82,400
Corporate Finance/Treasury (within corp.) 2.4% 58,333 55,500 54,000 –70,000 1.9% 7,000 0.3% 5,500 62,750
Sales/Trading 2.4% 70,000 70,000 70,000 –70,000 2.5% 11,750 0.3% 40,000 84,500
Commercial Banking (investment analysis) 1.6% 62,500 65,000 50,000 –70,000 2.5% 6,125 0.6% 10,000 73,625
real estate Finance/Development 1.6% 60,625 58,750 55,000 –70,000 1.3% 6,250 0.9% 22,500 80,625
Commercial Banking (retail) 1.2% 58,333 60,000 55,000 –60,000 1.3% 9,000 0.3% 2,000 65,000
Commercial Lending 1.2% 61,000 58,000 55,000 –70,000 1.3% 5,500 0.3% 5,000 66,333
Financial Planning 1.2% 55,433 53,300 53,000 –60,000 u u u u 55,433
venture Capital 1.2% 61,667 65,000 50,000 –70,000 u u 0.9% 20,000 81,667
Information Technology 3.2% 72,563 66,250 55,000 –110,000 3.1% 7,800 0.3% 20,000 79,938Business/Systems analyst 1.6% 61,375 59,000 55,000 –72,500 1.9% 8,000 u u 67,375
internet/e-Commerce 0.8% 85,000 85,000 60,000 –110,000 0.6% 10,000 0.3% 20,000 100,000
Programming 0.8% 82,500 82,500 80,000 –85,000 0.6% 5,000 u u 85,000
Marketing/Sales 10.4% 56,347 56,000 40,000 –90,000 8.2% 7,769 2.0% 15,214 64,328Sales/Sales management 3.2% 57,350 56,900 44,000 –90,000 3.8% 6,000 1.5% 19,000 73,725
market research 2.0% 56,000 60,000 40,000 –60,000 1.3% 1,000 u u 56,400
Product/Brand management 2.0% 56,500 55,000 48,000 –72,500 2.5% 13,250 u u 67,100
Services marketing 2.0% 58,745 60,000 45,720 –80,000 0.6% 10,000 0.3% 7,000 62,145
advertising/Public relations 0.8% 47,500 47,500 45,000 –50,000 u u 0.3% 4,500 49,750
Operations u u u u u u u u u
Other† 3.6% 56,056 50,000 35,000 –100,000 1.9% 9,667 0.9% 3,442 60,425
*Based on those who reported a salary.**Based on those who reported a signing bonus.
***Based on those who reported an annual bonus.†includes actuarial, Buying/Purchasing, entrepreneur, management Training, military and Paralegal.
u None or less than 1% reported.

14
1%
<1%
2% 4%
9%
16%
15%
6%
37%
6%
1%
<1%
2%
<$35,000
$35,000 - $39,999
$40,000 - $44,999
$45,000 - $49,999
$50,000 - $54,999
$55,000 - $59,999
$60,000 - $64,999
$65,000 - $69,999
$70,000 - $74,999
$75,000 - $79,999
$80,000 - $84,999
$85,000 - $89,999 >$89,999
$40000$42500$45000$47500$50000$52500$55000$57500$60000$62500$65000
Salar
y
20102011201220132014
Year
$61,022 $60,869 $59,617
$64,666$64,352
2014 Salary ProfileBachelor of Science in Commerce
2012–2014 Post–Graduation Profile ComparisonBachelor of Science in Commerce
2013–2014 Business Function ComparisonBachelor of Science in Commerce
Plans 2014 2013 2012
accepted Full-Time employment 87%* 86%* 86%*
attending/Seeking to attend Graduate School 7% 7% 8%
Seeking employment 4% 2% 2%
Not in the Job market 2% 5% 4%*includes a small percentage of fourth-year internship acceptances.
2014 2013
Business Function % Responses Average Base Salary ($) % Responses Average Base Salary ($)accounting 11% 55,339 5% 55,958
Consulting 23% 67,052 31% 65,646
Finance 48% 66,725 48% 67,533
information Technology 3% 72,563 3% 64,000
marketing/Sales 10% 56,347 7% 46,625
operations u u 1% 78,333
other 4% 56,056 4% 61,444 u None or less than 1% reported.
2010–2014 Salary ComparisonDistribution of Base Salaries in 2014
15
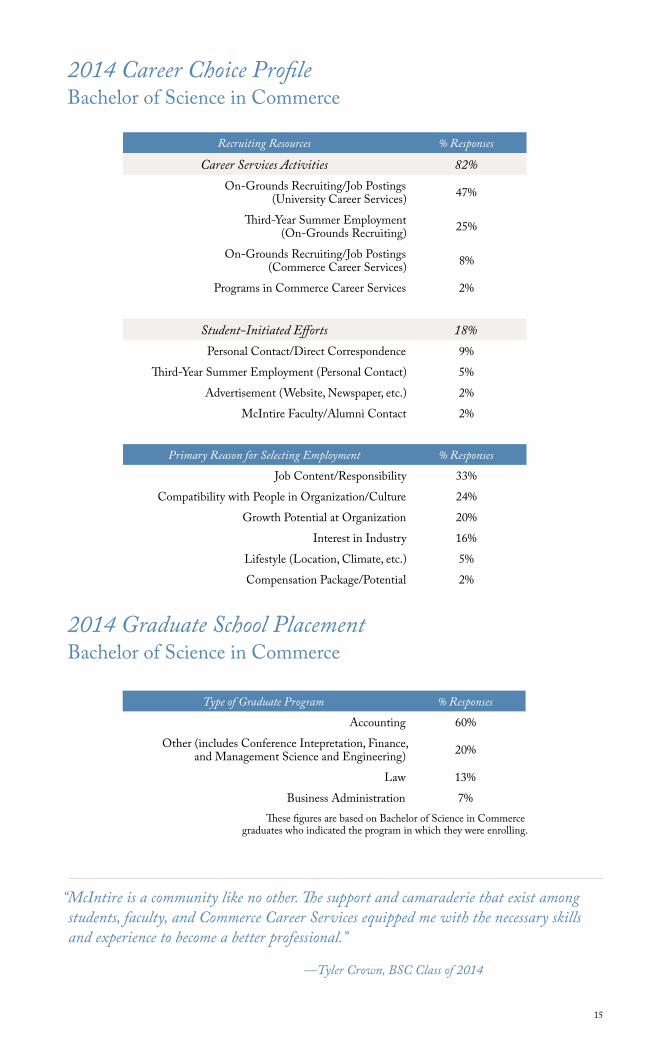
Type of Graduate Program % Responses
accounting 60%
other (includes Conference intepretation, Finance, and management Science and engineering) 20%
Law 13%
Business administration 7%These figures are based on Bachelor of Science in Commerce
graduates who indicated the program in which they were enrolling.
2014 Career Choice ProfileBachelor of Science in Commerce
2014 Graduate School PlacementBachelor of Science in Commerce
Recruiting Resources % Responses
Career Services Activities 82%on-Grounds recruiting/Job Postings
(University Career Services) 47%
Third-Year Summer employment (on-Grounds recruiting) 25%
on-Grounds recruiting/Job Postings(Commerce Career Services) 8%
Programs in Commerce Career Services 2%
Student-Initiated Efforts 18%Personal Contact/Direct Correspondence 9%
Third-Year Summer employment (Personal Contact) 5%
advertisement (Website, Newspaper, etc.) 2%
mcintire Faculty/alumni Contact 2%
Primary Reason for Selecting Employment % Responses
Job Content/responsibility 33%
Compatibility with People in organization/Culture 24%
Growth Potential at organization 20%
interest in industry 16%
Lifestyle (Location, Climate, etc.) 5%
Compensation Package/Potential 2%
“McIntire is a community like no other. The support and camaraderie that exist among students, faculty, and Commerce Career Services equipped me with the necessary skills and experience to become a better professional.”
—Tyler Crown, BSC Class of 2014
16
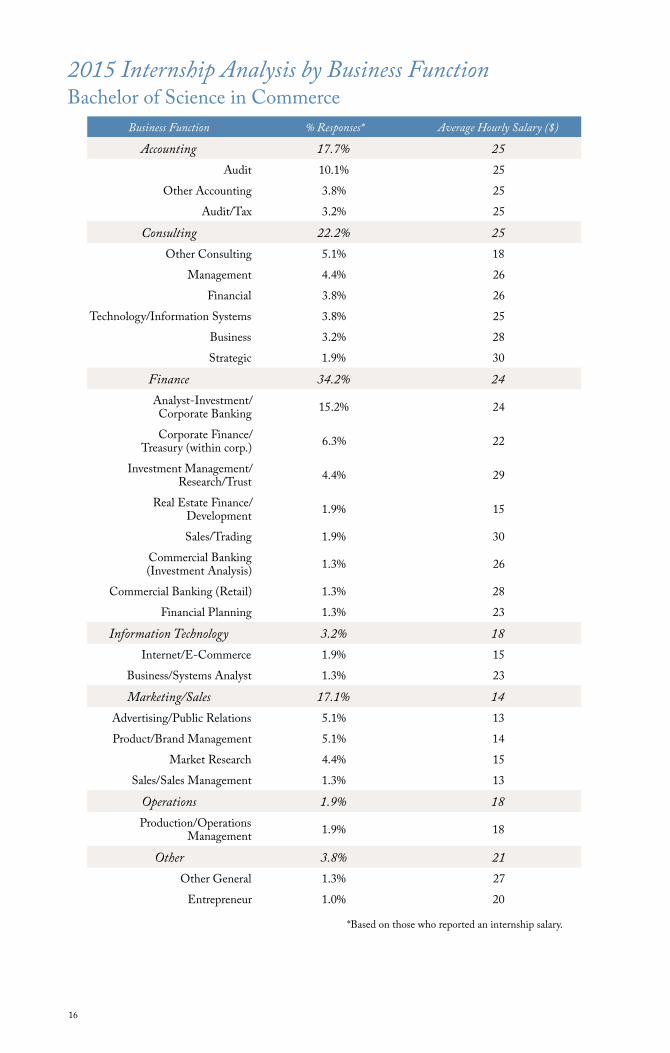
2015 Internship Analysis by Business FunctionBachelor of Science in Commerce
Business Function % Responses* Average Hourly Salary ($)
Accounting 17.7% 25audit 10.1% 25
other accounting 3.8% 25
audit/Tax 3.2% 25
Consulting 22.2% 25other Consulting 5.1% 18
management 4.4% 26
Financial 3.8% 26
Technology/information Systems 3.8% 25
Business 3.2% 28
Strategic 1.9% 30
Finance 34.2% 24analyst-investment/Corporate Banking 15.2% 24
Corporate Finance/Treasury (within corp.) 6.3% 22
investment management/research/Trust 4.4% 29
real estate Finance/Development 1.9% 15
Sales/Trading 1.9% 30
Commercial Banking (investment analysis) 1.3% 26
Commercial Banking (retail) 1.3% 28
Financial Planning 1.3% 23
Information Technology 3.2% 18internet/e-Commerce 1.9% 15
Business/Systems analyst 1.3% 23
Marketing/Sales 17.1% 14advertising/Public relations 5.1% 13
Product/Brand management 5.1% 14
market research 4.4% 15
Sales/Sales management 1.3% 13
Operations 1.9% 18Production/operations
management 1.9% 18
Other 3.8% 21other General 1.3% 27
entrepreneur 1.0% 20
*Based on those who reported an internship salary.

17
2015 Internship Analysis by Industry & RegionBachelor of Science in Commerce
Industry % Responses* Average Hourly Salary ($)
Manufacturing 4.7% 16Consumer Goods (Food/Beverage/
Tobacco/Household Products) 2.7% 18
auto/aerospace/other Transportation 1.3% 18
Service 95.3% 23Public accounting 21.3% 26
investment Banking 18.0% 25
Diversified Financial Services 14.0% 26
Consulting (not with accounting firms) 13.3% 24
advertising/marketing Services/ Public relations 6.0% 14
investment management 4.7% 28
retail 2.7% 19
Commercial Banking 2.0% 23
education 2.0% 12
media 2.0% 11
real estate/Construction 2.0% 15
entertainment/Leisure 1.3% 10
Region and State % Responses* Average Hourly Salary ($)
Midwest 2.9% 17Chicago, iL 1.4% 15
Northeast/Mid-Atlantic 34.3% 24New York, NY 26.4% 25
Philadelphia, Pa 2.1% 18
Princeton, NJ 1.4% 29
South/Southeast 56.4% 22mcLean, va 17.1% 25
richmond, va 10.7% 21
Washington, D.C. 8.6% 24
Charlottesville, va 4.3% 12
reston, va 4.3% 15
Charlotte, NC 2.1% 23
Tysons Corner, va 2.1% 22
arlington, va 1.4% 21
Herndon, va 1.4% 17
Norfolk, va 1.4% 23
West/Southwest 6.4% 23Dallas, TX 2.1% 17
San Francisco, Ca 2.1% 23
International internship acceptances in San Paulo, Brazil, and Toronto, Canada, were also reported.only select data are noted from information collected.
*Based on those who reported an internship salary.

18
“McIntire’s Career Services offers tremendous support to its students. From connecting you to alumni to offering interview tips, CCS supports you with valuable insights that you cannot receive anywhere else. The Career Services support on top of quality classroom learning is what makes the McIntire experience stand out. I truly believe that without the personal support of the CCS staff throughout the job search process, I would not have been able to take my candidacy to another level.”
—Jun Cho, MSC 2014
2013 Analysis by Graduate Programmaster of Science in Commerce
The master of Science in Commerce Program (with tracks in Finance and marketing & management) is a one-year, 40-credit-hour program designed to help recent liberal arts, science, and engineering graduates transform their intellectual and academic skill sets into focused business expertise. The program features an integrated core curriculum, specialty tracks, and a month-long Global immersion experience in europe, east asia, Southeast asia, or Latin america. of the Class of 2014, 65% chose the marketing & management Track; 35% chose the Finance Track. of the Class of 2015, 55% chose the marketing & management Track; 45% chose the Finance Track. Final placement statistics for the master of Science in Commerce Class of 2014 will be available online after December 2014.
Gender 2013 2014 2015
Female 46 49% 46 43% 47 42%
male 48 51% 60 57% 64 58%
94 106 111
Citizenship 2013 2014 2015
U.S. Citizen, Dual Citizen, or
Permanent resident76% 81% 84%
Students with visas 24% 19% 16%
Graduate Program
% Responses*
Average Base Salary ($)
Median Base Salary ($)
Base Salary Range ($)
Average Signing Bonus ($)
Average Annual Bonus ($)
Average Total Compensation ($)
M.S. in Commerce 100% 55,903 57,000 35,000 –77,000 6,792 20,092 60,691
Finance 34% 63,962 65,000 50,000 –77,000 7,500 43,750 74,154
marketing & management 66% 51,712 50,000 35,000 –75,000 6,083 4,320 53,690
*Based on those who reported a salary.
19
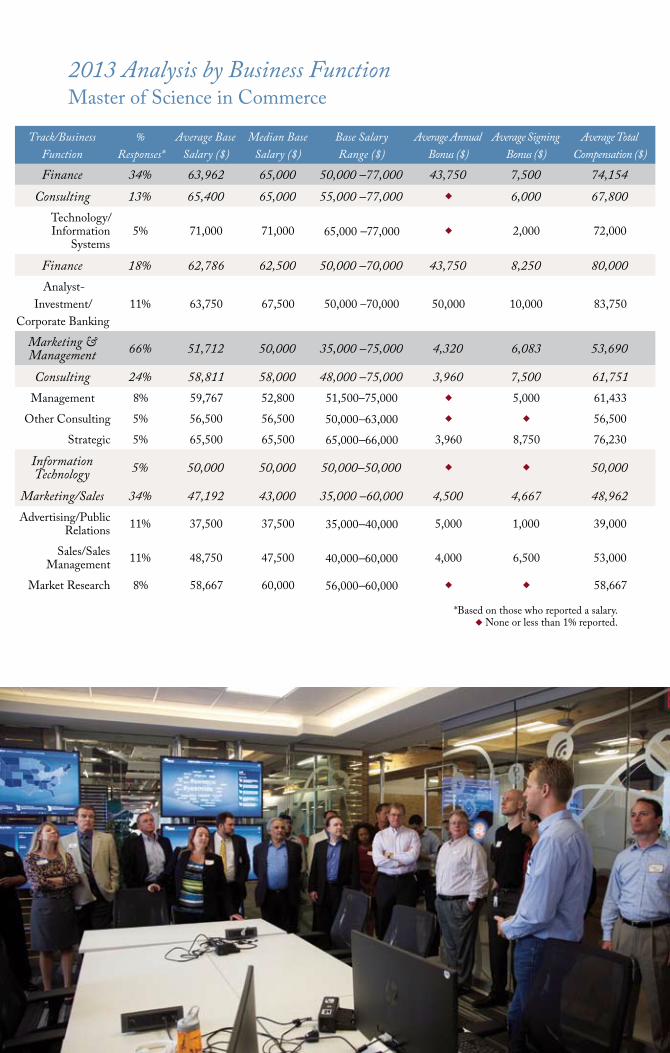
Track/Business Function
% Responses*
Average Base Salary ($)
Median Base Salary ($)
Base Salary Range ($)
Average Annual Bonus ($)
Average Signing Bonus ($)
Average Total Compensation ($)
Finance 34% 63,962 65,000 50,000 –77,000 43,750 7,500 74,154Consulting 13% 65,400 65,000 55,000 –77,000 u 6,000 67,800
Technology/information
Systems5% 71,000 71,000 65,000 –77,000 u 2,000 72,000
Finance 18% 62,786 62,500 50,000 –70,000 43,750 8,250 80,000analyst-
investment/Corporate Banking
11% 63,750 67,500 50,000 –70,000 50,000 10,000 83,750
Marketing & Management 66% 51,712 50,000 35,000 –75,000 4,320 6,083 53,690
Consulting 24% 58,811 58,000 48,000 –75,000 3,960 7,500 61,751management 8% 59,767 52,800 51,500–75,000 u 5,000 61,433
other Consulting 5% 56,500 56,500 50,000–63,000 u u 56,500
Strategic 5% 65,500 65,500 65,000–66,000 3,960 8,750 76,230
Information Technology 5% 50,000 50,000 50,000–50,000 u u 50,000
Marketing/Sales 34% 47,192 43,000 35,000 –60,000 4,500 4,667 48,962advertising/Public
relations 11% 37,500 37,500 35,000–40,000 5,000 1,000 39,000
Sales/Sales management 11% 48,750 47,500 40,000–60,000 4,000 6,500 53,000
market research 8% 58,667 60,000 56,000–60,000 u u 58,667
*Based on those who reported a salary.u None or less than 1% reported.
2013 Analysis by Business Functionmaster of Science in Commerce
20
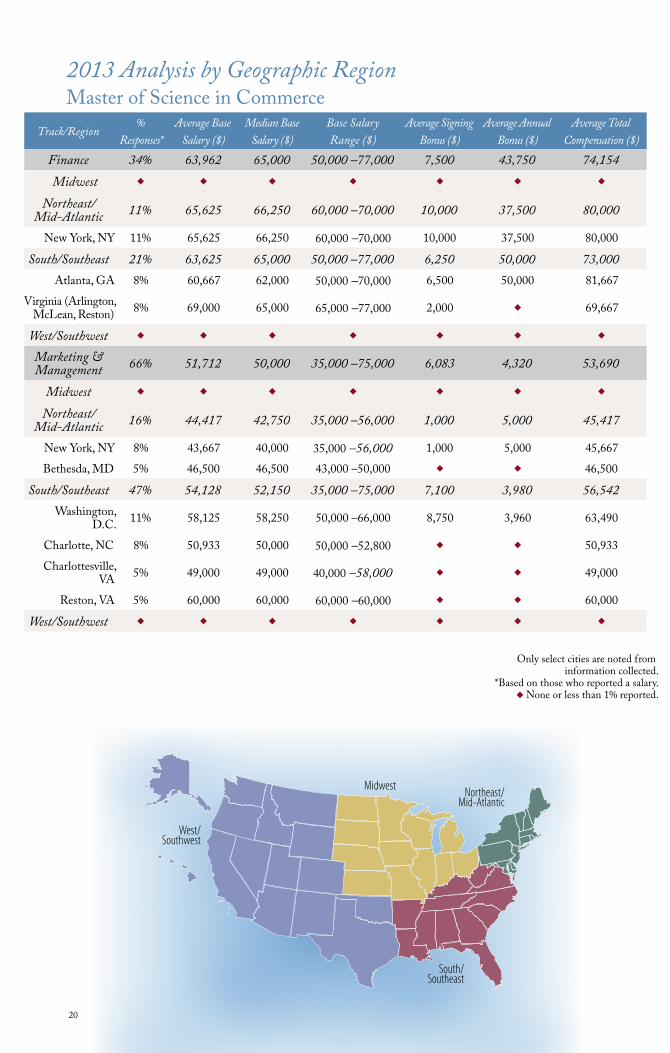
West/Southwest
Midwest Northeast/Mid-Atlantic
South/Southeast
2013 Analysis by Geographic Regionmaster of Science in Commerce
Track/Region%
Responses*Average Base
Salary ($)Median Base
Salary ($)Base Salary Range ($)
Average Signing Bonus ($)
Average Annual Bonus ($)
Average Total Compensation ($)
Finance 34% 63,962 65,000 50,000 –77,000 7,500 43,750 74,154 Midwest u u u u u u u
Northeast/ Mid-Atlantic 11% 65,625 66,250 60,000 –70,000 10,000 37,500 80,000
New York, NY 11% 65,625 66,250 60,000 –70,000 10,000 37,500 80,000
South/Southeast 21% 63,625 65,000 50,000 –77,000 6,250 50,000 73,000atlanta, Ga 8% 60,667 62,000 50,000 –70,000 6,500 50,000 81,667
virginia (arlington, mcLean, reston) 8% 69,000 65,000 65,000 –77,000 2,000 u 69,667
West/Southwest u u u u u u u
Marketing & Management 66% 51,712 50,000 35,000 –75,000 6,083 4,320 53,690
Midwest u u u u u u u
Northeast/Mid-Atlantic 16% 44,417 42,750 35,000 –56,000 1,000 5,000 45,417
New York, NY 8% 43,667 40,000 35,000 –56,000 1,000 5,000 45,667
Bethesda, mD 5% 46,500 46,500 43,000 –50,000 u u 46,500
South/Southeast 47% 54,128 52,150 35,000 –75,000 7,100 3,980 56,542 Washington,
D.C. 11% 58,125 58,250 50,000 –66,000 8,750 3,960 63,490
Charlotte, NC 8% 50,933 50,000 50,000 –52,800 u u 50,933
Charlottesville, va 5% 49,000 49,000 40,000 –58,000 u u 49,000
reston, va 5% 60,000 60,000 60,000 –60,000 u u 60,000
West/Southwest u u u u u u u
only select cities are noted from information collected.
*Based on those who reported a salary.u�None or less than 1% reported.

21
“We have a number of McIntire graduates at all levels of Capital One who are performing extremely well, taking the bank’s product lines and business areas to the next level.”
—William Chichester III, Capital One
2014 Analysis by Graduate Programmaster of Science in accounting Program
The mcintire School’s master of Science in accounting Program is recognized for developing graduates with a comprehensive understanding of accounting as well as core competencies needed for success as a business professional. our 30-credit-hour curriculum offers students the choice between a Financial reporting & assurance Track and a Tax Consulting Track. Both tracks have been carefully designed to help students acquire not only the necessary specialized technical knowledge, but also a better understanding of the broad context within which professional decisions are made. of the Class of 2014, 64% chose the Financial reporting & assurance Track, 25% chose the Tax Consulting Track, and the remaining 11% were enrolled in the one-semester track. (one-semester students completed the requirements for the m.S. in accounting Program during the fall semester by earning credits for specified graduate courses as mcintire undergraduates before beginning the graduate program.) of the Class of 2015, 66% chose the Financial reporting & assurance Track, 25% chose the Tax Consulting Track, and 9% are enrolled in the one-semester option.
Gender 2014 2015
Female 38 64% 39 59%
male 21 36% 27 41%
Total 59 66
Citizenship 2014 2015
U.S. Citizen or Permanent resident 68% 77%
Students with visas 32% 23%
Graduate Program
% Responses*
Average Base Salary ($)
Median Base Salary ($)
Base Salary Range ($)Average Signing
Bonus ($)Average Annual
Bonus ($)Average Total
Compensation ($)
M.S. in Accounting 100% 55,489 56,500 36,000 –63,000 3,583 5,000 56,614
Financial reporting
& assurance
57% 54,513 56,500 36,000 –63,000 3,250 5,000 55,544
Tax Consulting 25% 57,500 57,000 56,000 –60,000 3,750 u 59,643
one-Semester 18% 55,800 56,000 51,000 –58,500 u u 55,800
*Based on those who reported a salary.u None or less than 1% reported.

22
BloombergBusinessweek
Rankings2014 Analysis by Graduate Programmaster of Science in the management of information Technology
The master of Science in the management of information Technology is one of the leading graduate business programs for experienced professionals who want to better understand how to strategically leverage iT in order to deliver greater business value. The 12-month program is offered in two locations: a section that meets in Charlottesville, va., one weekend (Thursday-Friday-Saturday) each month and a section that meets in arlington, va., every other Saturday. For details on the schedule, please contact the Graduate admissions office.
The m.S. in miT attracts a wide range of business and technology professionals. Students possess an average of 12 years of professional work experience (ranging from 2 to 25+) in business, technology, or a combination of the two. employers interested in resume referrals or job postings targeting non-sponsored students in the program should contact Commerce Career Services for assistance.
Gender 2014 2015
Female 21% 20%
male 79% 80%
Class Size 2014 2015
73 (Nova-47, Cville-26) 72 (Nova-49, Cville-23)
Citizenship 2014 2015
U.S. Citizen or Permanent resident 96% 95%
Students with visas 4% 5%
Ethnicity* 2014 2015
african-american 10% 7%
asian-american 11% 20%
Caucasian 70% 69%
Hispanic 7% 8%
North american 3% 0%
Native Hawaiian/Pacific islander 1% 0%
Unclassified 3% 5%
Employment 2014 2015
Sponsored by employers(Full or in Part) 58% 50%
employed at Graduation 99%
Work Experience 2014 2015
2-4 Years 12% 15%
5-9 Years 32% 23%
10-14 Years 18% 17%
15-19 Years 16% 26%
20+ Years 22% 19%*more than one ethnicity reported.

23
Detailed rankings can be found on the Bloomberg BusinessWeek Web site: www.businessweek.com/bschools/rankings/
BloombergBusinessweek
Rankings
1. Notre Dame (mendoza)2. virginia (mcintire)3. Cornell (Dyson)4. Boston College (Carroll)5. Washington University, St. Louis (olin)
6. Texas (mcCombs)7. Pennsylvania (Wharton)8. indiana University (Kelley)9. emory (Goizueta)10. North Carolina (Kenan-Flagler)
mcintire remains #2 among Nation’s Top Business Programs in Bloomberg Businessweek rankingsThe mcintire School of Commerce at the University of virginia was again ranked second among the nation’s best undergraduate business programs, according to the annual Bloomberg Businessweek rankings, and it remains the only program to be consistently ranked either first or second in the nine years that Businessweek has ranked undergraduate programs. The rankings were announced april 4, 2014, on the Businessweek website.
Notre Dame’s mendoza College of Business was ranked first. Cornell University’s Charles H. Dyson School of applied economics and management was ranked third.
mcintire again earned a+ grades for teaching quality, facilities and services, and job placement and also remains the top-rated program among public institutions. in addition, the School tied with the University of Pennsylvania’s Wharton and Carnegie mellon’s Tepper for the highest median starting salary of $70,000.
“Since Businessweek began its annual rankings of undergraduate business schools in 2006, mcintire has been ranked among the elite programs in the nation and consistently achieved the highest marks for teaching, facilities, and job placement,” mcintire Dean Carl Zeithaml said. “our terrific students, faculty, and staff are supported by a remarkable community of alumni, parents, friends, and corporate sponsors, whose commitment ensures that the quality of our teaching is unparalleled, that our research remains on the cutting edge, and that our global reach continues to grow in exciting and important ways.”
other virginia schools ranked in the top 50 were the University of richmond (16), The College of William & mary (22), and James madison University (40). Complete rankings can be found on the Bloomberg Businessweek website.
Bloomberg Businessweek’s Top 10 Undergraduate Business Schools
“Our emphasis on strategic and functional integration, action-oriented learning through corporate projects, teamwork, communication, and cutting-edge specialty tracks enables the School to attract superlative students and to produce high-impact graduates.” –Carl Zeithaml, Dean, McIntire School of Commerce
24
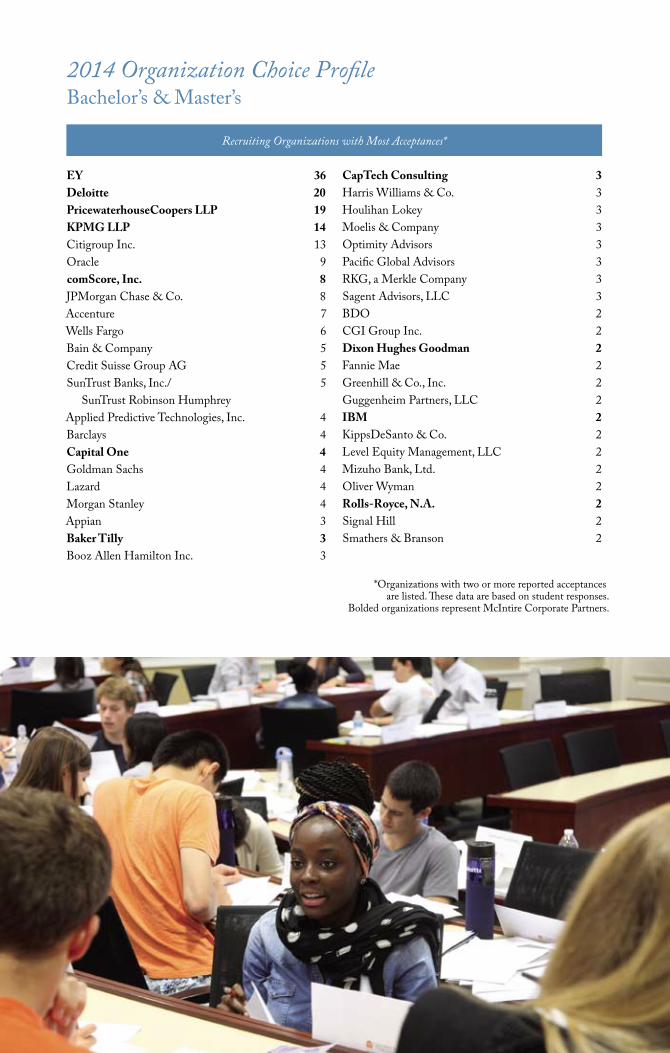
2014 Organization Choice ProfileBachelor’s & master’s
Recruiting Organizations with Most Acceptances*
EY 36Deloitte 20PricewaterhouseCoopers LLP 19KPMG LLP 14Citigroup inc. 13oracle 9comScore, Inc. 8JPmorgan Chase & Co. 8accenture 7Wells Fargo 6Bain & Company 5Credit Suisse Group aG 5SunTrust Banks, inc./ 5 SunTrust robinson Humphrey applied Predictive Technologies, inc. 4Barclays 4Capital One 4Goldman Sachs 4Lazard 4morgan Stanley 4appian 3Baker Tilly 3Booz allen Hamilton inc. 3
CapTech Consulting 3Harris Williams & Co. 3Houlihan Lokey 3moelis & Company 3optimity advisors 3Pacific Global advisors 3rKG, a merkle Company 3Sagent advisors, LLC 3BDo 2CGi Group inc. 2Dixon Hughes Goodman 2Fannie mae 2Greenhill & Co., inc. 2Guggenheim Partners, LLC 2IBM 2KippsDeSanto & Co. 2Level equity management, LLC 2mizuho Bank, Ltd. 2oliver Wyman 2Rolls-Royce, N.A. 2Signal Hill 2Smathers & Branson 2
*organizations with two or more reported acceptances are listed. These data are based on student responses.
Bolded organizations represent mcintire Corporate Partners.
25
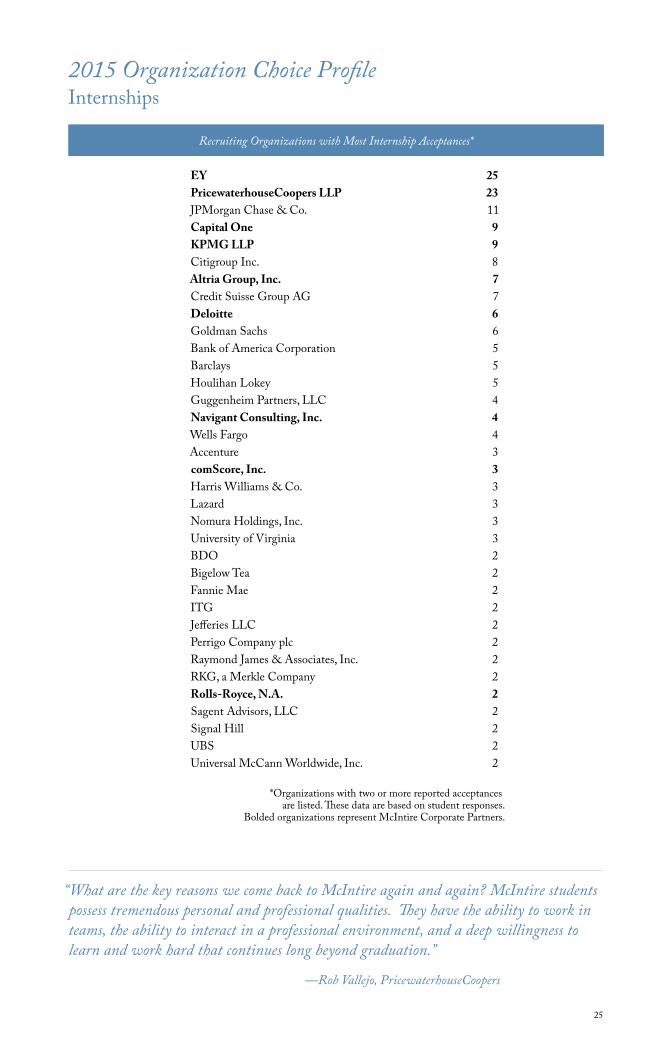
Recruiting Organizations with Most Internship Acceptances*
2015 Organization Choice Profileinternships
“What are the key reasons we come back to McIntire again and again? McIntire students possess tremendous personal and professional qualities. They have the ability to work in teams, the ability to interact in a professional environment, and a deep willingness to learn and work hard that continues long beyond graduation.”
—Rob Vallejo, PricewaterhouseCoopers
EY 25PricewaterhouseCoopers LLP 23JPmorgan Chase & Co. 11Capital One 9KPMG LLP 9Citigroup inc. 8Altria Group, Inc. 7Credit Suisse Group aG 7Deloitte 6Goldman Sachs 6Bank of america Corporation 5Barclays 5Houlihan Lokey 5Guggenheim Partners, LLC 4Navigant Consulting, Inc. 4Wells Fargo 4accenture 3comScore, Inc. 3Harris Williams & Co. 3Lazard 3Nomura Holdings, inc. 3University of virginia 3BDo 2Bigelow Tea 2Fannie mae 2iTG 2Jefferies LLC 2Perrigo Company plc 2raymond James & associates, inc. 2rKG, a merkle Company 2Rolls-Royce, N.A. 2Sagent advisors, LLC 2Signal Hill 2UBS 2Universal mcCann Worldwide, inc. 2
*organizations with two or more reported acceptances are listed. These data are based on student responses.
Bolded organizations represent mcintire Corporate Partners.

26
2013-2014 McIntire Recruiting Organizations12 West Capital Management LPA Bar A RanchA&M Metals Processing, LLCABBABCAccentureAdams Capital, Inc.Advance Auto PartsAdvancement Concepts, LLCThe Advisory Board CompanyAetnaAetos CapitalAgilexAlarm.comAlcoa Inc.ALDIAlphaSightsAltius AssociatesAlton LaneAltria Group, Inc.AmazonAmeson Education and Cultural Exchange
FoundationAmstarAnalysis GroupAppianApplied Predictive Technologies, Inc.AQR Capital Management, LLCThe AroundCampus GroupAtlantic MediaAuldbrass PartnersAvalonBay Communities, Inc.Avison YoungAWI Licensing CompanyAXA Equitable Life Insurance CompanyBabson Capital ManagementBain & CompanyBaker TillyBank of America CorporationBankCap PartnersBarclaysBates WhiteBayer HealthcareBB&T Capital MarketsBBDOBDOBecker Professional EducationBed Bath & Beyond Inc.Beers & CutlerBell Brands Advisors, LLCBerkeley Research Group, LLCBig C New MeBig Tent EntertainmentBigelow TeaBlackRock, Inc.The Blackstone Group L.P.Bloomberg L.P.Blue Ridge CapitalBlueMountain Capital Management, LLCBluestem Asset Management, LLCBon Secours Health System, Inc.Booz Allen Hamilton Inc.The Boston Consulting GroupBranch Banking and Trust CompanyThe Breckenridge Group, Inc.
Brentwood Capital Advisors LLCBrown Advisory, Inc.Brown-Forman CorporationThe Buffalo BillsCambridge Associates LLCCantor Futures Exchange, L.P.CapgeminiCapital Automotive Real Estate Services, Inc.The Capital Group Companies, Inc.Capital OneCapital Teaching ResidencyCapTech ConsultingCarlyle Investment Management L.L.C.CarMax Business Services, LLCCary Street PartnersCBRE, Inc.CBS InteractiveCCMP Capital Advisors, LLCCEBCenter for Open SourceCenterview Partners Holdings LPCentral Intelligence AgencyCGI Group Inc.Change CorpsChesapeake Capital CorporationChess Consulting LLCChoice Hotels International, Inc.CignaCitigroup Inc.City of CharlottesvilleClark Construction Group, LLCClark Realty CapitalCLEARClose Up FoundationCME Group Inc.CohnReznick LLPCollaborative SolutionscomScore, Inc.Consumer Financial Protection BureauConverse, Inc.Cornerstone ResearchCorporate Eco ForumCounterpoint Consulting, Inc.Creative Artists AgencyCredit Suisse Group AGCrestline Hotels & Resorts, LLCCrew CutsCroft & Bender LLCCrosslink CapitalCrutchfieldCushman & WakefieldCvent, Inc.DC EnergyDean & CompanyDellDeloitteDerivative Solutions, Inc.Deutsche Bank AGDialsmithDickinson Williams & CompanyDisney ResearchDixon Hughes GoodmanDominionDougherty DialecticDroga5
DropboxDuff & Phelps Corp.dunnhumbyDuPontE.&J. Gallo WineryEastdil Secured, LLCEdelmanEDENSEllucian Company L.P.Emanate PREntegra SystemsEnterprise Rent-A-CarePalsEpic Systems CorporationEvercoreEwing Bemiss & Co.Exxon Mobile CorporationEYFacebookFalcon Edge Capital, LPFannie MaeFastenal CompanyFederal ReserveFidus Investment Advisors, LLCFinanco, LLCFirst Annapolis ConsultingFirst Investors CorporationFirst Street, Inc.FISFleishmanHillardFoulger-PrattFreshplum, Inc.FTI Consulting, Inc.Fullbridge, Inc.The Fund for American StudiesFusionGCEGEGEICOGeneral Mills Inc.Genworth Financial, Inc.Gerson Lehrman Group, Inc.Gilt Groupe, Inc.Goldman SachsGoogleGray Matters CapitalGreat Harvest Bread CompanyGreatBridge ConsultingGreenhill & Co., Inc.Grey GroupGT Marketing and ConsultingGuggenheim Partners, LLCH.J. Heinz CompanyHamilton LaneHanover ResearchHantzmon WiebelHarris Williams & Co.Height Securities, LLCHeineken USA, Inc.Hillstone Restaurant GroupHilton WorldwideHorizon MediaHotelTonight, Inc.Houlihan LokeyHSBC
27
IBMImpact Makers, Inc.inCode ConsultingIndiana Harbor Belt Railroad CompanyIndiegogoING North America Insurance CorporationInsight Global, Inc.InterbrandInternational Rescue CommitteeIntrax, Inc.Investure, LLCIPG MediabrandsIpsosIron Bow TechnologiesITGITHAKAJefferies LLCJET ProgramJohnson & Johnson Services, Inc.JPMorgan Chase & Co.Kate Spade & Co.KCIC, LLCKeefe, Bruyette & Woods, Inc.KeiterThe Kenrich Group LLCKippsDeSanto & Co.KLH CapitalKorean Culture Center DCKPMG LLPThe Kroger CompanyKurt SalmonLafargeLazardLevel Equity Management, LLCLiberty TaxLilly PulitzerLinkedInLogical ParadigmLowe’sM&T BankMacquarie Group LimitedMajor League BaseballMalkin PropertiesMapcom SystemsMarketBridgeMarketing MojoMars, IncorporatedThe Martin AgencyMassachusetts Mutual Life Insurance
CompanyMatrix Capital Markets Group, Inc.MAXIMUSMBI Inc.McKinsey & CompanyMcPhillips, Roberts & Deans, PLCMercer LLCMicroStrategy Inc.Mizuho Bank, Ltd.Moelis & CompanyMorgan StanleyThe Motley FoolMoxie GroupmozillaNational Journalism CenterNavigant Consulting, Inc.NBA Media Ventures, LLCNodal Exchange, LLC
Noldus Information TechnologyNomura Holdings, Inc.The Northwestern Mutual Life Insurance
CompanyNorthwood Investors LLCNovus Energy PartnersOffice of the Chief AuditorsOgilvy & MatherOliver WymanOlympus Corporation of the AmericasOmniTek ConsultingOppenheimer & Co. Inc.Optimity AdvisorsOraclePace HarmonPacific Global AdvisorsParenteBeardPBM Products, LLCPeace CorpsPerella Weinberg PartnersPerficient, Inc.Perrigo Company plcPFM GroupPhiladelphia FinancialPiper Jaffray CompaniesPlaya Hotels & Resorts, B.V.Plow & HearthPortescapPortfolio Recovery Associates, LLCPower Home Remodeling Group, LLCPrezi Inc.PricewaterhouseCoopers LLPPrince William County Police DepartmentProcter & GambleProphetPROS, Inc.Prospect 33Prudential Financial, Inc.Publicis GroupeQuoraR/GARaise the Children InternationalRaymond James & Associates, Inc.RCLCOReckitt Benckiser Group plcRed Hat, Inc.Richards Kibbe & Orbe LLPRKG, a Merkle CompanyRoark Capital GroupRolls-Royce, N.A.Rosenblatt Securities Inc.RothschildRoyall & CompanyRxEOB.com, LLCSaatchi & SaatchiSagent Advisors, LLCSam Hill EntertainmentSandglass Capital ManagementSands Capital ManagementScopia Capital Management LLCSEB Merchant BankingSEOSharethis Inc.Signal HillSmathers & BransonThe Smithfield Packing Co., Inc.SnagAJob.com
Sotheby’sSouthern Teachers AgencySRA International, Inc.Stadium Capital Management, LLCStarwood Capital GroupStarwood Hotels & Resorts Worldwide, Inc.State Corporation Commission (SCC)Stout Risius Ross, Inc.Strategic Investment Management, LLCSullivan & CompanySunTrust Banks, Inc.SunTrust Robinson HumphreySusquehanna International Group, LLPSynaptitude Inc.T. Rowe PriceTarget Brands, Inc.Tate & Tryon CPAs and ConsultantsTeach For America, Inc.Teach For ChinaTerrAlignThomas Jefferson FoundationThompson, Siegel & Walmsley LLCThorley Industries, LLCTowers WatsonTransPerfect Translations International, Inc.Tribal WorldwideTricon Energy Ltd.Truland SystemsTSU ProfessionalsTudor FundsTwitterTwo Sigma Investments, LLCU.S. ArmyU.S. Department of StateU.S. NavyUBSUNITE HERE! Local 25United Bankshares, Inc.Universal McCann Worldwide, Inc.University of VirginiaUniversity of Virginia Investment
Management CompanyuPlayaUrban Teacher CenterVaynerMediaVCU BrandcenterVeris Consulting, Inc.VerizonVibethinkVirginia Society of Certified Public
AccountantsVonageVOX GlobalVRA Partners, LLCW2O GroupWahoo CapitalWal-Mart Stores, Inc.Warby ParkerWeddingWire Inc.Wells FargoWhite Oak Capital, LLCWillowTree Apps, Inc.WorldStridesYES PrepYMA Fashion Scholarship FundYount, Hyde & BarbourZeus Jones

28
University of VirginiaWeb Site: www.virginia.edu
Student Locator: 434.924.3363
McIntire School of CommerceWeb Site: www.commerce.virginia.edu
Dean, F.S. Cornell Professor of Free enterprise Carl Zeithaml 434.924.3176
Senior associate Dean richard Netemeyer 434.924.3388
associate Dean for administration & CFo rob Hoover 434.924.2814
associate Dean for the Undergraduate Program ryan Nelson 434.924.7587
associate Dean for Graduate Programs James maxham 434.924.6962
associate Dean for Global initiatives Peter maillet 434.243.2290
associate Dean for Corporate relations & Programs Cyndy Huddleston 434.996.4454
associate Dean for Center Development & research George overstreet, Jr. 434.924.7063
associate Dean for Student Services rebecca Leonard 434.924.3865
associate Dean for Development & alumni engagement
Katie Whittier 434.924.3394
assistant Dean for Strategic initiatives Stuart evans 434.924.7975
assistant Dean for Corporate & Foundation relations allison Teweles 434.924.0752
assistant Dean for Communications Jim Travisano 434.924.7005
Area Coordinatorsaccounting Susan Perry Williams 434.924.3988
Finance Felicia marston 434.924.1417
information Technology Saonee Sarker 434.924.3414
management adelaide King 434.924.4048
marketing James Burroughs 434.243-8679
Faculty Directors for Graduate Programsm.S. in Commerce ira Harris 434.924.8816
m.S. in accounting roger martin 434.982.2182
m.S. in the management of information Technology Stefano Grazioli 434.982.2973
Commerce Career Servicesmain office 434.924.7986
Facsimile 434.982.2999
Web Site www.commerce.virginia.edu/careerservices
Facebook www.facebook.com/CommerceUva
Twitter www.twitter.com/tomfUva
Pinterest www.pinterest.com/CommerceUva
associate Dean for Commerce Career Services and employer relations
Tom Fitch 434.924.3448
assistant Dean, Commerce Career Services Denise egan 434.924.7937
associate Director of Career Development Kelly eddins 434.924.5670
assistant Director of Career Development Pam Henderson 434.243.1933
assistant Director of Career Development alicia Castillo Shrestha 434.243.2144
Director for employer relations mary riner 434.243.8838
assistant Director for employer relations Peggy ehrenberg 434.982.3036
assistant Director of employer Programs Jenny Leslie 434.924.3553
Career Services associate/Customer Service Specialist Lindsey Saxby 434.924.7986
Contact information
29
www.commerce.virginia.edu/careerservices
www.facebook.com/CommerceUVA
www.twitter.com/tomfUVA
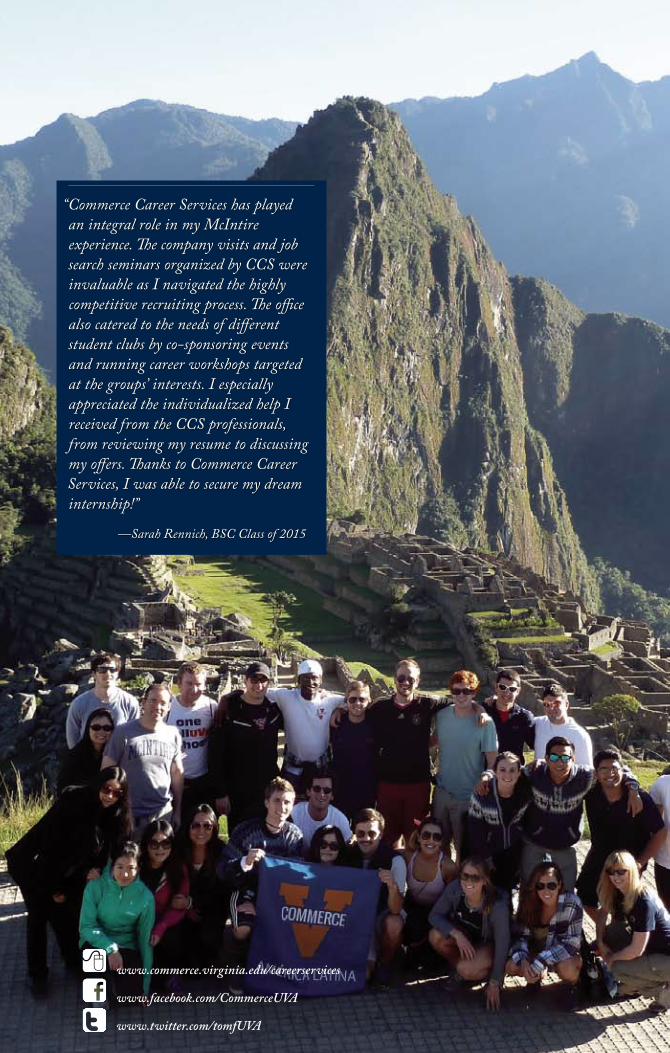
“Commerce Career Services has played an integral role in my McIntire experience. The company visits and job search seminars organized by CCS were invaluable as I navigated the highly competitive recruiting process. The office also catered to the needs of different student clubs by co-sponsoring events and running career workshops targeted at the groups’ interests. I especially appreciated the individualized help I received from the CCS professionals, from reviewing my resume to discussing my offers. Thanks to Commerce Career Services, I was able to secure my dream internship!”
—Sarah Rennich, BSC Class of 2015

The Commerce Career Services team is an integral part of the mcintire School of Commerce and endeavors to provide exemplary service to all constituents. Building and enhancing relationships with students and employers remain our #1 priority while providing innovative resources and programs to meet the evolving and dynamic career needs of students with broad and diverse backgrounds and interests.
University of Virginiamcintire School of CommerceCommerce Career Servicesrouss & robertson Hallseast Lawn, Suite 407P.o. Box 400173Charlottesville, va 22904