commerzbank investor update h1 2019 fixed income investor
TRANSCRIPT

Commerzbank 4.0
simple – digital – efficient
These written materials and the information contained herein may not be published and
may not be distributed in the United States of America, Canada and Australia
These written materials and the information contained herein may not be published and
may not be distributed in the United States of America, Canada and Australia
Commerzbank investor update H1 2019 Continued momentum in customer business in challenging environment
Fixed income investor presentation
GM – Investor Relations | GM – Treasury | August 2019

Commerzbank 4.0
simple – digital – efficient
These written materials and the information contained herein may not be published and
may not be distributed in the United States of America, Canada and Australia
The information contained herein has been compiled by Commerzbank Aktiengesellschaft (“Commerzbank”) for the information of the recipient only. This
presentation has been prepared for information purposes only. It does not constitute or form part of any offer or invitation to buy, sell or issue, or any solicitation of
any offer to purchase or subscribe for, any securities or any other financial instruments or to enter into any other transaction. Neither this presentation, nor any part
of it, nor the fact of its distribution, shall form the basis of, or be relied on in connection with, any contractual commitment or investment decision in relation to the
securities of Commerzbank in any jurisdiction, nor does it constitute a recommendation regarding any such securities. The contents of this document shall not be
construed as legal, tax, accounting, financial or investment advice.
This presentation contains forward-looking statements and information on Commerzbank’s future business development. Forward-looking statements are
statements that are not historical facts; they include, inter alia, statements about Commerzbank’s beliefs and expectations in relation to its future business
development, and the assumptions underlying these statements. These statements can be recognized by terms such as “expects”, “anticipates”, “intends”, “plans”,
“aims”, “believes”, “seeks”, “estimates”, “will” or words with similar meaning. These statements are based on plans, estimates, projections and targets that are
currently available to the management of Commerzbank, as well as assumptions that Commerzbank management believes to be reasonable. Forward-looking
statements therefore speak only as of the date they are made, and Commerzbank is under no obligation to update any of them in light of new information or future
events. By their very nature, forward-looking statements involve risks and uncertainties. A number of important factors could therefore cause actual results to differ
materially from those contained in any forward-looking statement. Such factors include, among others, the conditions in the financial markets in Germany, in Europe,
in the United States and elsewhere from which Commerzbank derives a substantial portion of its revenues and in which it holds a substantial portion of its assets,
the development of asset prices and market volatility, potential defaults of borrowers or trading counterparties, the implementation of its strategic initiatives and the
reliability of its risk management and compliance policies.
In addition, this presentation contains financial and other information which has been derived from publicly available information disclosed by persons other than
Commerzbank (“external data”). In particular, external data has been derived from industry and customer-related data and other calculations taken or derived from
industry reports published by third parties, market research reports and commercial publications. Commercial publications generally state that the information they
contain has originated from sources assumed to be reliable, but that the accuracy and completeness of such information is not guaranteed and that the calculations
contained therein are based on a series of assumptions. The external data has not been independently verified by Commerzbank. Therefore, Commerzbank and its
agents, representatives, directors, officers, employees and shareholders do not assume any responsibility for the accuracy of the external data taken or derived from
public sources.
In addition, some of the industry and market data, if not labelled otherwise, contained in this presentation are derived from Commerzbank’s internal research and
estimates based on the knowledge and experience of its management in the markets in which it operates. Commerzbank believes that such research and
estimates are reasonable and reliable, but their underlying methodology and assumptions have not been verified by any independent source for accuracy or
completeness and are subject to change without notice.
The information contained in this presentation is in summary form only, and is therefore not necessarily accurate or complete. Commerzbank and its agents,
representatives, directors, officers, employees and shareholders make no representations or warranties as to the accuracy or completeness of the information
contained in this presentation. Undue reliance should not be placed on any of the information contained in this presentation.
Disclaimer
1 All figures in this presentation are subject to rounding
All figures in this presentation can be subject to restatement publications GM – Investor Relations | GM – Treasury | August 2019

Commerzbank 4.0
simple – digital – efficient
These written materials and the information contained herein may not be published and
may not be distributed in the United States of America, Canada and Australia
Agenda
1 Commerzbank at a glance Slide 3
2 Q2 2019 results (audit review) Slide 11
3 Capital management and funding Slide 24
Appendix Slide 35
2 GM – Investor Relations | GM – Treasury | August 2019

Commerzbank 4.0
simple – digital – efficient
These written materials and the information contained herein may not be published and
may not be distributed in the United States of America, Canada and Australia
Commerzbank at a glance
3 GM – Investor Relations | GM – Treasury | August 2019

These written materials and the information contained herein may not be published and
may not be distributed in the United States of America, Canada and Australia Commerzbank 4.0
simple – digital – efficient
A leading international commercial bank with a client-focussed portfolio
of financial services in two segments
Facts and Figures: an Overview
4
Private and Small-Business
Customers Corporate Clients
Digital
Enterprise
Enhancing
Efficiency
Focussed
Business Model
GM – Investor Relations | GM – Treasury | August 2019

These written materials and the information contained herein may not be published and
may not be distributed in the United States of America, Canada and Australia Commerzbank 4.0
simple – digital – efficient
Facts and Figures: Commerzbank’s Global Presence
5 GM – Investor Relations | GM – Treasury | August 2019
● Shanghai
● Hong Kong
● Melbourne
●
●
●
●
●
● Taipeh
●
●
● Beirut
● Kuala Lumpur
● ●
● Tashkent ●
● ●
● Baku
● ● Lagos
● Luanda
● Johannesburg
● Abidjan
● Cairo
São Paulo
● Buenos Aires
● Caracas
● Seoul
● Dhaka
Addis Abeba
Beijing
Tokyo
Ho Chi Minh City
Jakarta
Singapore
Dubai Mumbai
Bangkok
Tbilisi
Bagdad Ashgabat
Almaty
Frankfurt ● New York
● branches
● subsidiaries
● representative offices
Approximately 1,000 branches in Germany
6 material subsidiaries, 20 operational foreign
branches, and 31 representative offices
internationally
London •
• •
• •
•
•
• •
•
• • •
•
•
• •
Paris
Milan
Luxemburg
Brussels
Zurich
Amsterdam
Vienna
Prague
Bratislava
Belgrade Zagreb Bucharest
• Kiev
Budapest
• Minsk
• Istanbul
• Brno
Hamburg
Warsaw
• Saint Petersburg
• Madrid • Barcelona
London
Panama City ●
Moscow •

These written materials and the information contained herein may not be published and
may not be distributed in the United States of America, Canada and Australia Commerzbank 4.0
simple – digital – efficient
Shareholder structure
as of June 2019
Facts and Figures: Selected Group Financial Figures
6
Figures
~ 20% Private
Investors ~ 55% Institutional
Investors
> 15% Federal Republic of
Germany
Op. result
(in €m)
Consolidated profit
(in €m)1
Total revenues
(in €m)
CET 1 ratio (%)2
Op. RoTE (%)
Cost income ratio
op. business (%)
2,178 8,570 2,129
401 1,245 298
272 865 271
77.8 80.3 77.6
13.0 12.9 / 12.73 12.94
6.1 4.8 4.5
Q2 2018 FY 2018 Q2 2019
Employees
< 5%
Blackrock
> 5%
Cerberus
30 June 2018 31 Dec 2018
49,410 48,779
1) Attributable to Commerzbank shareholders 2) Basel 3, fully phased-in
3) pro-forma 01/2019 after IFRS 16 4) Includes net result of H1 2019 reduced by dividend accrual GM – Investor Relations | GM – Treasury | August 2019
48,644
30 June 2019
These written materials and the information contained herein may not be published and
may not be distributed in the United States of America, Canada and Australia Commerzbank 4.0
simple – digital – efficient
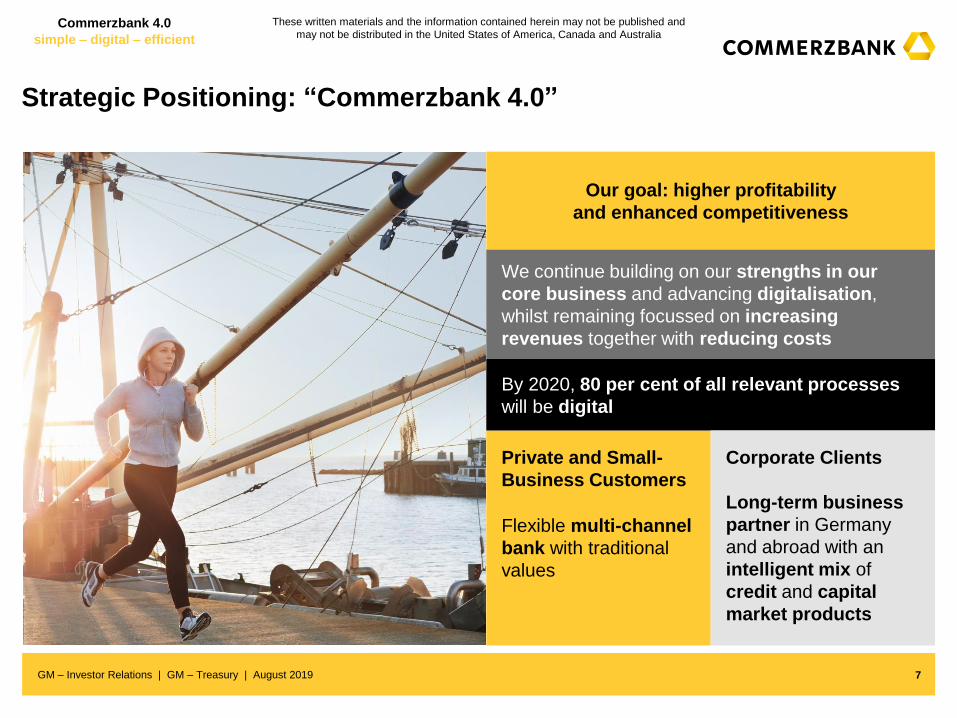
Strategic Positioning: “Commerzbank 4.0”
7
Our goal: higher profitability
and enhanced competitiveness
Private and Small-
Business Customers
We continue building on our strengths in our
core business and advancing digitalisation,
whilst remaining focussed on increasing
revenues together with reducing costs
By 2020, 80 per cent of all relevant processes
will be digital
Flexible multi-channel
bank with traditional
values
Corporate Clients
Long-term business
partner in Germany
and abroad with an
intelligent mix of
credit and capital
market products
GM – Investor Relations | GM – Treasury | August 2019

These written materials and the information contained herein may not be published and
may not be distributed in the United States of America, Canada and Australia Commerzbank 4.0
simple – digital – efficient
Segments of Commerzbank: Private and Small-Business Customers
8
Around 10,000 advisors and approximately 13 million
customers: one of the leading banks for private and
small-business customers in Germany
Target: 2 million net new customers in Germany by 2020
“One” is the name of the multi-channel bank: one sole
IT platform workable for all channels and PSBC clients
Approximately 1,000 branches: one of the densest
branch networks among German private banks
2 different types of branches: flagship branch focussing
on advisory and city branch focussing on serving clients
in the most efficient manner
Comdirect and mBank: two of the leading online banks
Revenues
Op. result
€m Q2 2018
1,200
174
FY 2018 Q2 2019
4,802 1,223
734 239
GM – Investor Relations | GM – Treasury | August 2019

These written materials and the information contained herein may not be published and
may not be distributed in the United States of America, Canada and Australia Commerzbank 4.0
simple – digital – efficient
Segments of Commerzbank: Corporate Clients
9
Further improved client coverage due to stronger
linkage of our expertise in corporate banking and
capital markets
Approximately 30% market share: Commerzbank is the
leading bank in processing German foreign trade
Unchallenged No. 1 financing SMEs in Germany
More than 100 locations in Germany, almost 50 hubs
worldwide
Leading provider of risk hedging solutions for
corporate clients
Top rankings in the European bond market and a top 10
position in EMEA for syndicated loans
Revenues
Op. result
€m Q2 2018
901
218
FY 2018 Q2 2019
3,418 776
601 22
GM – Investor Relations | GM – Treasury | August 2019

Commerzbank 4.0
simple – digital – efficient
These written materials and the information contained herein may not be published and
may not be distributed in the United States of America, Canada and Australia
Focussed business model › We will focus on business in two operating segments: Private
and Small Business Clients and Corporate Clients
› ACR (non-core activities) dissolved as per 1 July 2019 following
successful run-down
2020: Commerzbank 4.0 – a Strategy with three major Cornerstones
Digital enterprise › We will transform the bank into a digital enterprise
› Until 2020, we will digitise 80 % of all relevant processes of the
whole bank
Enhancing efficiency › We will simplify the bank to enhance our efficiency
› We will generate additional competitive advantages due to the
simplification of our processes
10 GM – Investor Relations | GM – Treasury | August 2019
Commerzbank 4.0
simple – digital – efficient
These written materials and the information contained herein may not be published and
may not be distributed in the United States of America, Canada and Australia
Q2 2019 results (audit review)
11 GM – Investor Relations | GM – Treasury | August 2019

Commerzbank 4.0
simple – digital – efficient
These written materials and the information contained herein may not be published and
may not be distributed in the United States of America, Canada and Australia
Continued momentum in customer business in challenging
environment
Highlights Q2 2019
12
Further growth in customers and assets › In PSBC net new customers Germany increased by 108k bringing the total to 1.3m
› AuC in PSBC Germany up by €11bn in Q2 – loan volume surpasses €100bn
› In CC targets of >€85bn loan volume with corporates and >10k net new customers reached
YoY stable net result of €271m based on operating result of €298m – net RoTE 4.3% › While NII increased by 7% YoY, overall revenues were 2% lower due to significantly decreased
fair value result
› Risk result of -€178m driven by a few individual cases
› Operating expenses and compulsory contributions of €1.65bn in line with FY guidance
Clean balance sheet and healthy risk profile – further dividend accrual › CET1 ratio increased to 12.9% – before TRIM impact expected in Q3
› Total capital strengthened by $1bn AT1 issuance in early July
› Group NPL ratio of 0.8% – ACR dissolved following successful run-down
GM – Investor Relations | GM – Treasury | August 2019

Commerzbank 4.0
simple – digital – efficient
These written materials and the information contained herein may not be published and
may not be distributed in the United States of America, Canada and Australia
Key financial figures at a glance
Group Financial Results Group Capital2
Operating result (€m)
Net result1
(€m)
Leverage ratio fully loaded (% end of period)
CET1 ratio fully loaded
(%)
1) Consolidated result attributable to Commerzbank shareholders
2) Includes net results reduced by dividend accrual
383 278 264
244
401
18
Q2 2019 Q2 2018 Q1 2019
-34
34
298
272
120
271
Q2 2018 Q2 2019 Q1 2019
12,7
Q2 2018
12.9
Q1 2019
13.0
Q2 2019
4.5 4.5 4.5
Q1 2019 Q2 2018 Q2 2019
Exceptional Revenue Items
13 GM – Investor Relations | GM – Treasury | August 2019

Commerzbank 4.0
simple – digital – efficient
These written materials and the information contained herein may not be published and
may not be distributed in the United States of America, Canada and Australia
1.225 1.220 1.244
-20 -25
Q2 2018 Q1 2019
-21
Q2 2019
1,200 1,200 1,223
Exceptional Revenue Items
Revenues and operating results of Commerzbank divisions
14
Private and Small Business Customers (€m)
Others & Consolidation Asset & Capital Recovery (dissolved as of July 1st)
Corporate Clients
Operating Result 174
Revenues
(€m)
(€m) (€m)
Revenues
Operating Result
Operating Result Operating Result
-51
-20
0
-51
Q2 2018
-2 0
Q1 2019
0
Q2 2019
-22
-1
-40
Q2 2018
51 78
9
Q2 2019
-3 -4
-7
Q1 2019
60 38
909 869 799
Q2 2019
-8
901
Q2 2018
-8
Q1 2019
-23
860 776
239 153 218 22 120
GM – Investor Relations | GM – Treasury | August 2019

Commerzbank 4.0
simple – digital – efficient
These written materials and the information contained herein may not be published and
may not be distributed in the United States of America, Canada and Australia
258
401 346
240 244 298
Q3 Q1 Q4 Q2 Q1 Q2
Operating result reflects resilient customer business – but weak
contribution from fair value result
Group operating result (€m)
Group P&L
2018 2019
1) Consolidated result attributable to Commerzbank shareholders 15
Highlights
› YoY stable net result of €271m supported by tax refunds – operating result decreased mainly due to fair value and risk results
› YoY 7% increase in NII based on growth in PSBC and CC but also on lower interest expenses from funding
› Lack of positive contributions from legacy portfolios and lower contributions from hedging and portfolio management led to
significant decrease in fair value result – especially in Corporate Clients
in €m Q2 2018 Q1 2019 Q2 2019 H1 2018 H1 2019
Revenues 2,178 2,156 2,129 4,395 4,285
Exceptional items 18 -34 34 19 -
Revenues excl. exceptional items 2,160 2,190 2,095 4,376 4,285
o/w Net interest income 1,207 1,253 1,291 2,331 2,544
o/w Net commission income 763 768 739 1,565 1,507
o/w Net fair value result 150 66 -1 340 65
o/w Other income 39 103 67 140 169
Risk result -82 -78 -178 -160 -256
Operating expenses 1,636 1,569 1,581 3,274 3,150
Compulsory contributions 58 265 72 302 337
Operating result 401 244 298 659 542
Pre-tax profit discontinued operations -12 -19 19 30 -
Pre-tax profit Commerzbank Group 389 225 318 689 542
Taxes on income 94 91 20 99 111
Minority interests 23 14 27 57 41
Net result ¹ 272 120 271 533 391
CIR (excl. compulsory contributions) (%) 75.1 72.8 74.2 74.5 73.5
CIR (incl. compulsory contributions) (%) 77.8 85.1 77.6 81.4 81.4
Net RoTE (%) 4.3 1.9 4.3 4.3 3.1
Operating RoCET (%) 7.1 4.2 5.0 5.8 4.6
GM – Investor Relations | GM – Treasury | August 2019

Commerzbank 4.0
simple – digital – efficient
These written materials and the information contained herein may not be published and
may not be distributed in the United States of America, Canada and Australia
Cost development remains in line with FY guidance
16
H1 2018 vs. H1 2019 transition (€m)
107
1,395
Other
302
1,702
1,572
3,487
H1 2018
35
Compulsory
contributions
Costs of
investments
& growth
10
Regulatory &
compliance
26
Cost
management
19
1,754
337
H1 2019
3,576
Personnel expenses
Administrative expenses
Compulsory contributions
Highlights
› Prioritised investments in digitalisation and growth leading to considerably lower costs for external suppliers
› Timely and successful implementation of robust compliance framework comes with higher cost level to run regulatory and
compliance operations
› Increase of personnel expenses due to new compensation model and ongoing internalisation – partially compensated by staff
reduction
GM – Investor Relations | GM – Treasury | August 2019

Commerzbank 4.0
simple – digital – efficient
These written materials and the information contained herein may not be published and
may not be distributed in the United States of America, Canada and Australia
Risk result driven by single cases
Risk Result (€m)
Risk Result divisional split
-77 -82
-133 -154
-78
-178
Q2 Q1 Q2 Q3 Q1 Q4
2018 2019
17 1) NPL ratio = Default volume loans held at Amortised Cost and Fair Value OCI / Exposure at Default
2) Cost of Risk (CoR) = Risk Result / Exposure at Default
Highlights
› Risk result in CC higher due to single cases in Q2 and significantly lower write backs in the first half of the year
› PSBC and CC continue to reflect healthy risk profile with Group NPL ratio of 0.8% based on unchanged lending standards
› Despite the macro environment slightly loosing momentum, the risk indicators remain stable and only single names in specific
industries are showing a slight impact so far
Risk Result in €m Q2 2018 Q1 2019 Q2 2019 H1 2018 H1 2019
Private and Small Business Customers -66 -52 -48 -115 -100
Corporate Clients -35 -28 -127 -60 -155
Asset & Capital Recovery 16 -1 -23 14 -24
Others & Consolidation 3 2 21 2 23
Group -82 -78 -178 -160 -256
NPL in €bn
Private and Small Business Customers 1.8 1.7 1.8 1.8 1.8
Corporate Clients 1.9 1.7 1.7 1.9 1.7
Asset & Capital Recovery 0.2 0.4 0.3 0.2 0.3
Others & Consolidation - - - - -
Group 4.0 3.7 3.8 4.0 3.8
Group NPL ratio (in %) ¹ 0.9 0.9 0.8 0.9 0.8
Group CoR (bps) ² 7 7 16 7 12
GM – Investor Relations | GM – Treasury | August 2019

Commerzbank 4.0
simple – digital – efficient
These written materials and the information contained herein may not be published and
may not be distributed in the United States of America, Canada and Australia
155 176 159 178
81 88
96 101
100
109 126 134
413 381 373
H1 2019
>400
336
2016 2019 2017 2018 2020
>390
Private and Small Business Customers: net new customer acquisition
on target – Assets under Control above €400bn
0.1
0.6
1.0
1.3
1.5
2.0
2016 2017 2020 2018 H1 2019 2019
Net new customers (GER) (m cumulative)
Assets under Control (GER)
+0.7m
(€bn eop)
continued growth
Securities
Targets
Deposits
Loans
+0.2m
+77bn
18
+0.9m
GM – Investor Relations | GM – Treasury | August 2019

Commerzbank 4.0
simple – digital – efficient
These written materials and the information contained herein may not be published and
may not be distributed in the United States of America, Canada and Australia
203 174 186
171 153
239
Q2 Q1 Q1 Q2 Q3 Q4
Private and Small Business Customers: progress in line with strategy
Operating result
(€m)
Segmental P&L
2018 2019
19
Highlights
› Q2 operating result of €239m reflects slightly improved underlying revenues and reduced expenses
› Underlying revenues driven by YoY 6.0% higher NII from growth – offsetting lower margins
› German mortgages up €1.6bn to €78.1bn in Q2 – consumer finance book at €3.8bn (Q2 2018: €3.5bn)
in €m Q2 2018 Q1 2019 Q2 2019 H1 2018 H1 2019
Revenues 1,200 1,200 1,223 2,436 2,424
o/w Private Customers 599 589 598 1,196 1,187
o/w Small Business Customers 202 201 204 404 405
o/w mBank 265 274 294 518 568
o/w comdirect 94 96 100 199 196
o/w Commerz Real 65 60 47 119 108
o/w exceptional revenue items -25 -20 -21 - -41
Revenues excl. exceptional items 1,225 1,220 1,244 2,436 2,464
Risk result -66 -52 -48 -115 -100
Operating expenses 912 870 873 1,800 1,743
Compulsory contributions 49 125 63 145 188
Operating result 174 153 239 377 392
RWA (end of period in €bn) 39.3 43.2 44.8 39.3 44.8
CIR (excl. compulsory contributions) (%) 76.0 72.5 71.4 73.9 71.9
CIR (incl. compulsory contributions) (%) 80.0 82.9 76.5 79.8 79.7
Operating return on equity (%) 14.9 12.0 18.2 16.2 15.2
GM – Investor Relations | GM – Treasury | August 2019

Commerzbank 4.0
simple – digital – efficient
These written materials and the information contained herein may not be published and
may not be distributed in the United States of America, Canada and Australia
Corporate Clients: 2020 customer growth and loan volume targets
reached
1.3
5.4
8.9
11.4
2016 2017 H1 2019 2018 2019 2020
>10.0 >9.4
1) Volumes Mittelstand and International Corporates
Net new customers (k cumulative)
continued growth
+7.6k
Loan Volume Corporates1
(€bn)
20
+ 2.5k
Q4 2017 Q4 2016
82
Q2 2019
88
Q4 2018 Dec 2019 Dec 2020
75
78
>83 >85
+13€bn
continued growth
GM – Investor Relations | GM – Treasury | August 2019

Commerzbank 4.0
simple – digital – efficient
These written materials and the information contained herein may not be published and
may not be distributed in the United States of America, Canada and Australia
97
218
175
111 120
22
Q2 Q2 Q1 Q1 Q3 Q4
Corporate Clients: stable customer business but significantly lower fair
value and increased risk result
Operating result (€m)
Segmental P&L
2018 2019
21
Highlights
› Lower Q2 operating result driven by poor fair value result in “others” as well as higher risk result due to single cases
› YoY revenue growth in all client divisions Mittelstand, International Corporates and Financial Institutions
› “Others” reflects lack of positive contributions from legacy portfolios – Q2 2018 had in particular benefitted from a large
transaction – as well as lower contributions from hedging and portfolio management
in €m Q2 2018 Q1 2019 Q2 2019 H1 2018 H1 2019
Revenues 901 860 776 1,765 1,636
o/w Mittelstand 429 452 437 858 889
o/w International Corporates 232 254 241 444 495
o/w Financial Institutions 109 126 124 236 250
o/w others 139 37 -3 237 34
o/w exceptional revenue items -8 -8 -23 -9 -32
Revenues excl. exceptional items 909 869 799 1,775 1,668
Risk result -35 -28 -127 -60 -155
Operating expenses 639 619 619 1,282 1,238
Compulsory contributions 9 93 8 108 101
Operating result 218 120 22 315 142
Pre-tax profit discontinued operations -12 -19 19 30 -
RWA (end of period in €bn) 92.4 102.0 102.5 92.4 102.5
CIR (excl. compulsory contributions) (%) 71.0 71.9 79.7 72.6 75.6
CIR (incl. compulsory contributions) (%) 71.9 82.7 80.8 78.8 81.8
Operating return on equity (%) 8.3 4.1 0.7 6.0 2.4
GM – Investor Relations | GM – Treasury | August 2019

Commerzbank 4.0
simple – digital – efficient
These written materials and the information contained herein may not be published and
may not be distributed in the United States of America, Canada and Australia
16
60
14
-56
-7
38
Q2 Q1 Q3 Q4 Q1 Q2
Asset & Capital Recovery: segment dissolved as of July 1st following
successful portfolio run down
Operating result (€m)
Segmental P&L
2018 2019
22
Highlights
› De-risking and portfolio reduction largely finished – ship finance exposure in ACR at €200m
› Positive operating result of €38m in Q2 – driven by valuation effects
› The remaining €4.5bn exposures have been transferred to Others & Consolidation as of July 1st
in €m Q2 2018 Q1 2019 Q2 2019 H1 2018 H1 2019
Revenues 62 11 68 106 79
Revenues excl. exceptional items 10 14 -11 78 3
Risk result 16 -1 -23 14 -24
Operating expenses 17 9 7 34 15
Compulsory contributions - 9 - 10 9
Operating result 60 -7 38 76 31
RWA (end of period in €bn) 14.4 10.5 10.8 14.4 10.8
CRE (EaD in €bn) 1.1 0.8 0.7 1.1 0.7
Ship Finance (EaD in €bn) 1.1 0.2 0.2 1.1 0.2
Public Finance (EaD in €bn) 7.7 3.6 3.5 7.7 3.5
Group Ship Finance (EaD in €bn) 1.4 0.3 0.3 1.4 0.3
ACR segment result will be frozen and carried forward to YE 2019
GM – Investor Relations | GM – Treasury | August 2019

Commerzbank 4.0
simple – digital – efficient
These written materials and the information contained herein may not be published and
may not be distributed in the United States of America, Canada and Australia
Objectives and expectations for 2019
2019 – Outlook
We continue our growth strategy and expect higher underlying revenues
We plan to maintain a dividend pay-out ratio comparable to 2018
We expect a risk result not below €550m
We target a cost base below €6.8bn
23
We target a CET1 ratio ≥12.75%
GM – Investor Relations | GM – Treasury | August 2019

Commerzbank 4.0
simple – digital – efficient
These written materials and the information contained herein may not be published and
may not be distributed in the United States of America, Canada and Australia
Capital management and funding
24 GM – Investor Relations | GM – Treasury | August 2019

Commerzbank 4.0
simple – digital – efficient
These written materials and the information contained herein may not be published and
may not be distributed in the United States of America, Canada and Australia
Capital ratio increased to 12.9% on capital built
25
Highlights
Transition of CET1 ratio (%) (€bn eop)
143 152 152
21 22 23 12
176
Q2 2018
12
Q2 2019 Q1 2019
12 185 187
Market Risk
Credit Risk
Operational Risk
RWA development by RWA classification
0,3
13.0
0.1
Q1 2019 Q2 2018 RWA
change
Capital built Q2 2019
12.7
12.9
› CET1 ratio increased to 12.9% as the RWA increase was more than offset by capital built – before TRIM impact expected in Q3
› €1bn increase of Operational Risk RWA due to changes in the external loss database
› Market and Credit Risk RWA stable with higher Credit Risk RWA from loan growth offset by RWA management and FX effects
› Capital built mainly from retained earnings net of dividend accrual and lower regulatory capital deductions
GM – Investor Relations | GM – Treasury | August 2019

Commerzbank 4.0
simple – digital – efficient
These written materials and the information contained herein may not be published and
may not be distributed in the United States of America, Canada and Australia
SREP 2019 – CET1 ratio well above requirement
› Commerzbank CET1 ratio of 12.9% well above SREP
requirement
› SREP for 2019: Pure CET1 requirement at 10.11%
› Pillar 2 Requirement (P2R):
Reduction from 2.25% to 2.0% reflecting the
progress made by Commerzbank in further risk
reduction
› Capital Conservation Buffer (CCB):
Industry-wide Buffer of 2.5%
› Other systematically important institution (O-SII):
Increase from 1.0% to 1.5% has been postponed
from 2019 to 2020
› Countercyclical Buffer (CCyB):
0.11% stemming from foreign exposure so far
(German CCyB will apply from July 2020)
Commerzbank
CET1 ratio
Q2 2019 SREP 2019
2.5%
12.9%
4.5%
0.11%
2.0%
1.0% CCyB
10.11%
O-SII
CCB
P2R
CET1 min.
Pure CET1
requirement
26 GM – Investor Relations | GM – Treasury | August 2019

Commerzbank 4.0
simple – digital – efficient
These written materials and the information contained herein may not be published and
may not be distributed in the United States of America, Canada and Australia
Distance to MDA strengthened by AT1 issuance
27 1) Based on RWAs of €187bn as of Q2 2019
2) Incl. legacy T1 instruments (0.4% of RWA in Q2 2019)
Distance to MDA – Status quo and pro-forma USD 1bn inaugural AT1 issue1 in %
Q2 2019
CET1
Q2 2019 MDA
incl. AT1
inefficiency
1.1
10.1
0.5
USD 1bn AT1
issued July
2019
0.6
Pro-forma Q2
2019 MDA
incl. new AT1
12.9
11.2
10.7
10.1
~170bps ~220bps
› Inaugural USD 1bn AT1 issue in
July 2019 has increased distance to
MDA by ~50 bps
› Pro-forma distance to MDA of
~220bps at Q2 2019
› Comfortable basis for expected
increase of MDA in 2020 (D-SIB
increase by 50 bps, introduction of
CCyB in Germany) and further
phase-out of legacy AT1
› Further AT1 issuance strategy to be
considered in light of maintaining an
appropriate distance to MDA and
capital requirements
Pure CET1 requirement AT1 inefficiency2
GM – Investor Relations | GM – Treasury | August 2019

Commerzbank 4.0
simple – digital – efficient
These written materials and the information contained herein may not be published and
may not be distributed in the United States of America, Canada and Australia
Total Capital – Development of Tier 2
YE 2019 Q2 2019
5.1bn
YE 2020 YE 2021 YE 2022
16.0%
Q2 2019
12.9%
(24.0bn)
2.7%
(5.1bn)
CET1
Tier 2
› Increase of capital efficiency via replacement of
amortizing Tier 2 instruments.
› New supply will be limited and manageable aiming to a
Tier 2 layer that remains comfortable above 2% of RWA.
› Broader market access which includes US market and
potentially niche markets provides flexibility
1) Reflecting linear amortisation according to CRR Article 64
0.4%
(0.8bn) AT1²
Total Capital² Tier 2 roll-off profile1 (%) (€bn)
28
²) USD 1bn 7% AT1 issuance as
of July 2019 not yet reflected
GM – Investor Relations | GM – Treasury | August 2019
Commerzbank 4.0
simple – digital – efficient
These written materials and the information contained herein may not be published and
may not be distributed in the United States of America, Canada and Australia
29
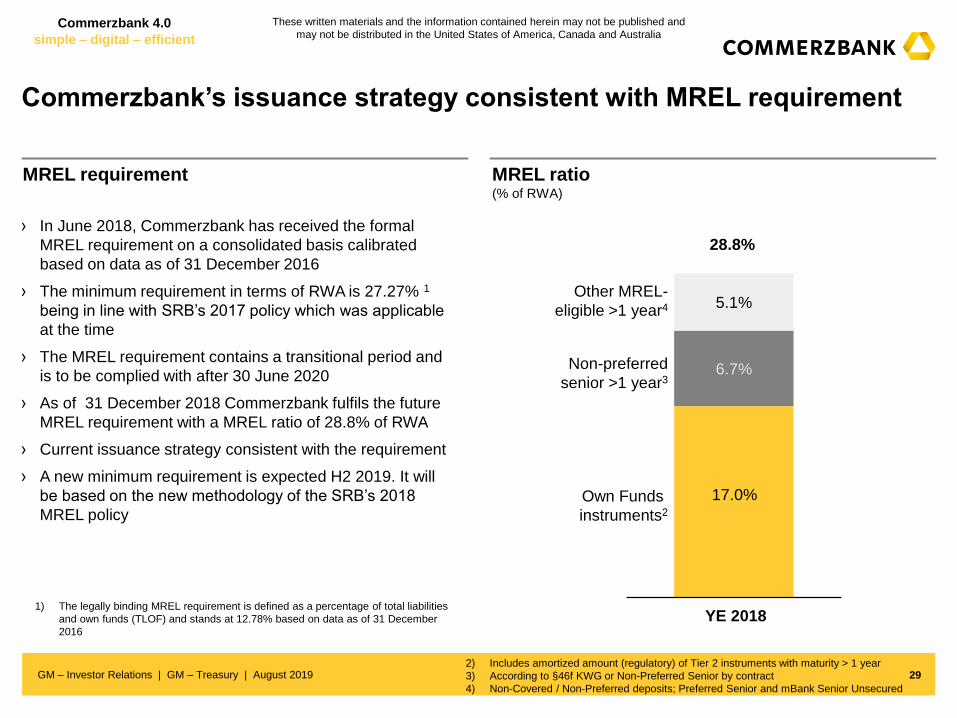
MREL requirement MREL ratio (% of RWA)
› In June 2018, Commerzbank has received the formal
MREL requirement on a consolidated basis calibrated
based on data as of 31 December 2016
› The minimum requirement in terms of RWA is 27.27% 1
being in line with SRB’s 2017 policy which was applicable
at the time
› The MREL requirement contains a transitional period and
is to be complied with after 30 June 2020
› As of 31 December 2018 Commerzbank fulfils the future
MREL requirement with a MREL ratio of 28.8% of RWA
› Current issuance strategy consistent with the requirement
› A new minimum requirement is expected H2 2019. It will
be based on the new methodology of the SRB’s 2018
MREL policy
17.5 %
6.7%
5.1%
Own Funds
instruments2
28.8%
YE 2018
Other MREL-
eligible >1 year4
Non-preferred
senior >1 year3
2) Includes amortized amount (regulatory) of Tier 2 instruments with maturity > 1 year
3) According to §46f KWG or Non-Preferred Senior by contract
4) Non-Covered / Non-Preferred deposits; Preferred Senior and mBank Senior Unsecured
17.0%
1) The legally binding MREL requirement is defined as a percentage of total liabilities
and own funds (TLOF) and stands at 12.78% based on data as of 31 December
2016
Commerzbank’s issuance strategy consistent with MREL requirement
GM – Investor Relations | GM – Treasury | August 2019

Commerzbank 4.0
simple – digital – efficient
These written materials and the information contained herein may not be published and
may not be distributed in the United States of America, Canada and Australia
€2.7bn
€0.7bn
€2.5bn
Capital markets funding activities in 2019
Funding structure1
› €5.9bn issued in first half year 2019 (average term over 8 years) thereof:
– Covered bonds: €2bn dual benchmarks with maturities from 5 years and 15 years
– Preferred senior: Two benchmark transactions of 5 and 7 years with total volume of €2.25bn
– Non-preferred senior: €500m benchmark with 7 years maturity
› Total funding volume for 2019 expected to be around €10bn
› Issuance of $1bn AT1 in early July
Group Funding activities H1 20192
Promissory notes
Unsecured bonds
25%
Covered bonds
Subordinated debt
(as of 30 June 2019)
1) Based on balance sheet figures; unsecured bonds including preferred and non-preferred senior
2) Including mBank activities; front office data base 30
Highlights
€5.9bn
Covered bonds
Preferred senior
Non-preferred senior
11%
12%
27%
50% ~€69bn
(nominal values)
GM – Investor Relations | GM – Treasury | August 2019

Commerzbank 4.0
simple – digital – efficient
These written materials and the information contained herein may not be published and
may not be distributed in the United States of America, Canada and Australia
Diversification of funding sources – optimisation of capital structure
New issues activities1 Maturities2 until 2023
› Issuance requirements 2019 expected to be around €10bn
› Ongoing review of funding plan throughout the year, final funding depends on asset / RWA development
› New issuance to replace maturing debt and meet regulatory requirements
› Continued focus on diversification: new foreign markets and new investors
› New funding will support the well balanced maturity profile
› Issuance of $1bn AT1 in July 2019
Strategy
1) values based on nominal basis as of June 30th
2) basis IFRS values as of June 30th, 2018; non-preferred and preferred senior bonds
3) unsecured bonds incl. preferred and non-preferred senior bonds
31
0
2
4
6
8
10
12
2017 2018 2019 H1 2019 plan
Subordinated bonds
Unsecured bonds
Covered bonds
(€bn) (€bn)
0
2
4
6
8
10
12
2019 2020 2021 2022 2023
Subordinated bonds
Unsecured bonds
Covered bonds
10.5
5.7
6.6 6.1
5.4 5.4
8.8
~10bn 3
3
5.9
Including 2.7bn
preferred senior
GM – Investor Relations | GM – Treasury | August 2019

Commerzbank 4.0
simple – digital – efficient
These written materials and the information contained herein may not be published and
may not be distributed in the United States of America, Canada and Australia
32
Tier 2 issues successfully placed into the Asian market
Commerzbank well known with Asian investors
February 2017
SGD 500,000,000
Tier 2 capital
4.875%
01 March 2027
Callable March 2022
Distribution:
91% Singapore
7% Hong Kong
September 2018
SGD 400,000,000
Tier 2 capital
4.20%
18 Sept 2028
Callable Sept 2023
Distribution:
95% Singapore
5% Hong Kong
August 2018
AUD 225,000,000
Tier 2 capital
5.50%
29 August 2028
Bullet
Distribution:
87% Asia
9% Oceania
July 2019
USD 1,000,000,000 Distribution:
Additional Tier 1 capital 25% Asia
7% perpetual non call April 2025 (incl. S’pore, HK, China, Australasia)
AT1 enjoyed strong support from Asia
GM – Investor Relations | GM – Treasury | August 2019

Commerzbank 4.0
simple – digital – efficient
These written materials and the information contained herein may not be published and
may not be distributed in the United States of America, Canada and Australia
Rating overview Commerzbank
As of 7 August 2019
Bank Ratings S&P Moody’s Fitch Scope
Counterparty Rating/ Assessment1 A A1/ A1 (cr) A- (dcr) -
Deposit Rating2 A- negative A1 stable A- -
Issuer Credit Rating (long-term debt) A- negative A1 stable BBB+ stable A stable
Stand-alone Rating (financial strength) bbb+ baa2 bbb+ -
Short-term debt A-2 P-1 F2 (UCO) S-1
1) Includes client business (i.e. counterparty for derivatives)
2) Includes corporate and institutional deposits 33
› Fitch has placed Commerzbank’s short-term bank rating under criteria observation (UCO) because it could be upgraded by one notch under
the new criteria. Fitch intends to conclude full implementation of the criteria and resolution of UCO designation within six months
› Moody’s has lowered the rating uplift of non-preferred senior debt rating resulting from the rating agency’s Advanced Loss Given Failure
analysis by one notch and downgraded this instrument class to „Baa2“
› Moody’s and S&P assigned ratings to Commerzbank’s AT1 issuance in June 2019
Rating events in Q2 2019
Product Ratings (unsecured issuance)
Preferred senior unsecured debt A- negative A1 stable A- A stable
Non-preferred senior unsecured debt BBB Baa2 BBB+ stable A- stable
Subordinated debt (Tier 2) BBB- Baa3 BBB BBB stable
Additional Tier 1 (AT1) BB Ba2 - -
GM – Investor Relations | GM – Treasury | August 2019

Commerzbank 4.0
simple – digital – efficient
These written materials and the information contained herein may not be published and
may not be distributed in the United States of America, Canada and Australia
Key elements of our capital management and funding
34
Preferred senior intended to be used as unsecured instrument for refinancing of our
strategic growth and to the extent we are allowed for MREL purpose
Covered Bonds in the form of mortgage-backed Pfandbriefe are our most cost-efficient
strategic funding instrument in line with the PSBC business strategy
Tier 2 is managed at a layer comfortably above the amount of 2% recognised in
regulatory Total Capital
Non-preferred senior is expected to be rolled-over at a sufficient volume to support
the A-rating of our preferred senior instruments and client products
AT1 issuance strategy to be considered in light of maintaining an appropriate distance to
MDA and meeting capital requirements
GM – Investor Relations | GM – Treasury | August 2019

Commerzbank 4.0
simple – digital – efficient
These written materials and the information contained herein may not be published and
may not be distributed in the United States of America, Canada and Australia
Appendix
35 GM – Investor Relations | GM – Treasury | August 2019

Commerzbank 4.0
simple – digital – efficient
These written materials and the information contained herein may not be published and
may not be distributed in the United States of America, Canada and Australia
Appendix
Commerzbank Group
Risk & Capital Management
Funding & Rating
P&L Tables
Other Information
Commerzbank financials at a glance 39
Loan and Deposit volumes 40
Scenario: NII sensitivity 41
Exchange rate development effects on capital 42
Glossary 46
German creditor hierarchy 37
Commerzbank Group 44
Exceptional Revenue Items 45
German economy 38
Corporate responsibility 43
36 GM – Investor Relations | GM – Treasury | August 2019

Commerzbank 4.0
simple – digital – efficient
These written materials and the information contained herein may not be published and
may not be distributed in the United States of America, Canada and Australia
German creditor hierarchy – Implementation of BRRD Article 108
Notching difference X
A- (negative)
A1 (stable)
A-
BBB Baa2 BBB+ (stable)
2N 4N 1N
BBB- Baa3 BBB
Structured
senior
unsecured
debt
Eligible deposits from natural persons
(>100 TEUR) & SME
Covered deposits /
deposit guarantee schemes
(deposits ≤ 100 TEUR)
Derivatives Preferred
Senior*
Senior unsecured
liabilities
(statutory subordination)
Non-
preferred
deposits
Non-preferred
senior
Tier 2
AT 1
CET 1
37
A (stable)
A- (stable)
BBB (stable)
1N
Commerzbank instrument ratings Since 21.07.2018
§46f KWG new - Implementation of BRRD Article 108
GM – Investor Relations | GM – Treasury | August 2019

Commerzbank 4.0
simple – digital – efficient
These written materials and the information contained herein may not be published and
may not be distributed in the United States of America, Canada and Australia
German economy 2019/2020 – looking for the turn-around
› In H1 2019 the German economy stayed weak, and even contracted slightly
in Q2. While manufacturing is in recession, services are still holding up.
› This divergence points to weak external demand as the main reason of
recent weak growth, particularly weighing on the automotive and machinery
industries. In contrast, the expansionary stance of ECB’s monetary policy is
still supporting internal demand.
› Given the still low readings of sentiment indicators risks have increased that
the current period of low growth will stay for longer.
Current
development
› In the further course of 2019 somewhat stronger demand in some parts of the
world economy (especially in China based on the government’s stimulus
measures) will probably help global as well as German manufacturing.
Accordingly the sentiment indicators should at least stabilize in the coming
months. However, the recovery of China is not a given.
› Because of the weak first half of the year the German economy will expand
only by 0.4% in 2019 (after 1.4% in 2018). Growth in 2020 should be some-
what stronger again with an increase of real GDP by 0.8%. However, this
higher growth rate is partly due to more working days in 2020.
Our expectation
for 2019/2020
› The export oriented German economy could suffer especially from rising
protectionism initiated by the US government.
› Germany’s price and non-price competitiveness within the Euro area has
eroded since 2009.
› Economic policy has been geared more towards redistribution of income and
wealth than support for growth, and this will not change with the current
government.
Risks in the
long-run
DAX (avg. p.a.)
Euribor (avg. p.a. in %)
GDP (change vs. previous year in %)
38
10.957 10.196 12.431 12.272
11.800
2018 2019e 2015 2016 2017
-0,02
-0,32 -0,32 -0,30
2017 2015 2018
-0.26
2016 2019e
1,7 1,9 2,2
1,4
0,4 0,8
2,0 1,8
2,6
1,8
0,9 0,7
2020e 2017 2015 2016 2018 2019e
Germany
Eurozone
GM – Investor Relations | GM – Treasury | August 2019

Commerzbank 4.0
simple – digital – efficient
These written materials and the information contained herein may not be published and
may not be distributed in the United States of America, Canada and Australia
Commerzbank financials at a glance
39 1) Includes net results reduced by dividend accrual
Group Q2 2018 Q1 2019 Q2 2019 H1 2018 H1 2019
Operating result (€m) 401 244 298 659 542
Net result (€m) 272 120 271 533 391
CET1 ratio fully loaded (%)¹ 13.0 12.7 12.9 13.0 12.9
Total assets (€bn) 488 503 518 488 518
RWA fully loaded (€bn) 176 185 187 176 187
Leverage ratio fully loaded (%) 4.5 4.5 4.5 4.5 4.5
Cost/income ratio (excl. compulsory contributions) (%) 75.1 72.8 74.2 74.5 73.5
Cost/income ratio (incl. compulsory contributions) (%) 77.8 85.1 77.6 81.4 81.4
Net RoE (%) 3.9 1.7 3.9 3.8 2.8
Net RoTE (%) 4.3 1.9 4.3 4.3 3.1
Total capital ratio fully loaded (%)¹ 16.1 15.7 15.7 16.1 15.7
NPL ratio (in %) 0.9 0.9 0.8 0.9 0.8
CoR (bps) 7 7 16 7 12
GM – Investor Relations | GM – Treasury | August 2019

Commerzbank 4.0
simple – digital – efficient
These written materials and the information contained herein may not be published and
may not be distributed in the United States of America, Canada and Australia
102 102
82 81
Jun-19 Mar-19
117 120
151 155
Mar-19 Jun-19
Continuing loan and deposit growth
PSBC Corporate Clients (€bn) (€bn)
Loan volume
Deposit volume
Loan volume
Deposit volume
› Loan growth in Private and Small Business Customers mainly driven by mortgage business in Germany and mBank’s loan
book
› Increased loan volumes in Mittelstand and International Corporates are offset by lower loan volumes in Financial Institutions
and in legacy portfolios – ongoing deposit optimisation
40
Highlights
GM – Investor Relations | GM – Treasury | August 2019
Commerzbank 4.0
simple – digital – efficient
These written materials and the information contained herein may not be published and
may not be distributed in the United States of America, Canada and Australia
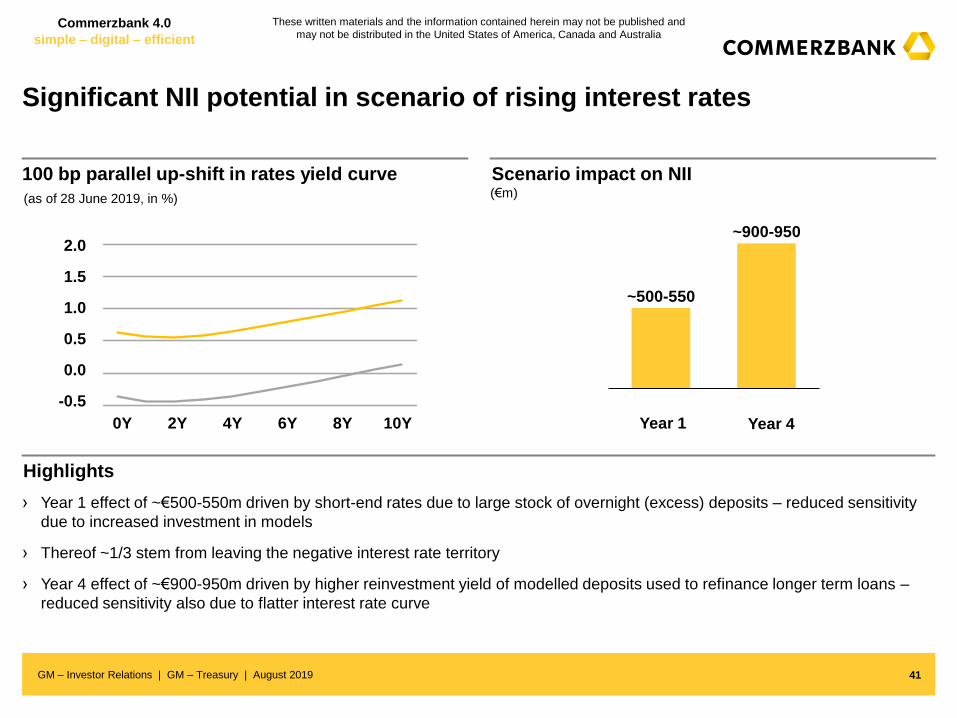
100 bp parallel up-shift in rates yield curve Scenario impact on NII (€m) (as of 28 June 2019, in %)
› Year 1 effect of ~€500-550m driven by short-end rates due to large stock of overnight (excess) deposits – reduced sensitivity
due to increased investment in models
› Thereof ~1/3 stem from leaving the negative interest rate territory
› Year 4 effect of ~€900-950m driven by higher reinvestment yield of modelled deposits used to refinance longer term loans –
reduced sensitivity also due to flatter interest rate curve
Year 1 Year 4
41
Highlights
0.0
-0.5
1.0
0.5
2.0
1.5
0Y 2Y 4Y 6Y 8Y 10Y
~500-550
~900-950
Significant NII potential in scenario of rising interest rates
GM – Investor Relations | GM – Treasury | August 2019
Commerzbank 4.0
simple – digital – efficient
These written materials and the information contained herein may not be published and
may not be distributed in the United States of America, Canada and Australia
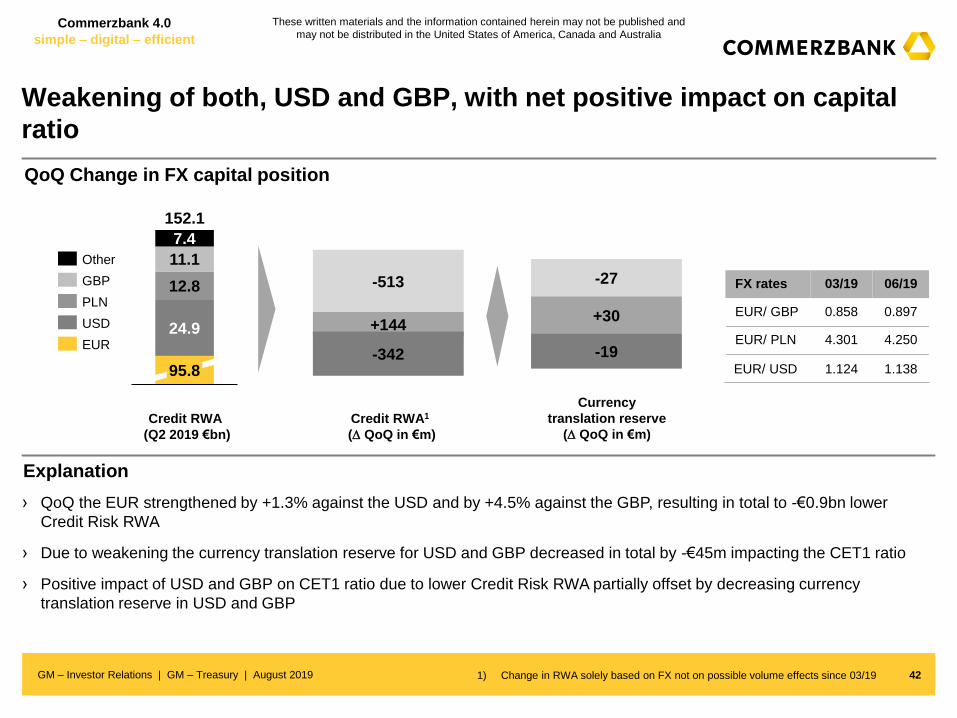
Weakening of both, USD and GBP, with net positive impact on capital
ratio
42
QoQ Change in FX capital position
› QoQ the EUR strengthened by +1.3% against the USD and by +4.5% against the GBP, resulting in total to -€0.9bn lower
Credit Risk RWA
› Due to weakening the currency translation reserve for USD and GBP decreased in total by -€45m impacting the CET1 ratio
› Positive impact of USD and GBP on CET1 ratio due to lower Credit Risk RWA partially offset by decreasing currency
translation reserve in USD and GBP
Credit RWA1
( QoQ in €m)
Currency
translation reserve
( QoQ in €m)
Credit RWA
(Q2 2019 €bn)
24.9
12.8
11.1
7.4
95.8
152.1
Other
EUR
GBP
PLN
USD
1) Change in RWA solely based on FX not on possible volume effects since 03/19
Explanation
FX rates 03/19 06/19
EUR/ GBP 0.858 0.897
EUR/ PLN 4.301 4.250
EUR/ USD 1.124 1.138
-513
+144
-342
-27
+30
-19
GM – Investor Relations | GM – Treasury | August 2019

Commerzbank 4.0
simple – digital – efficient
These written materials and the information contained herein may not be published and
may not be distributed in the United States of America, Canada and Australia
We are a leading German provider of Renewable Energy Project Finance
funding and will become Germany’s most sustainable commercial bank
3.5 3.8 4.0 4.1 4.2 4.2 4.3
2014 2013 2018
2015 2016 2017 Q2
2019
+24%
68%
invested in Germany
32% invested globally
43
Renewable Energy Project Finance Portfolio (Exposure at Default, €bn end of period)
Portfolio Breakdown
Commerzbank’s Sustainability Ratings1
1) Latest change in ISS QualityScores 24 July 2019
A B
Prime
(C)
Outper-
former
Low
Risk
(75 / 100 points) Sector Average: D+ Environment: 1
Social: 1
71%
12%
16%
1%
Wind Offshore Wind Onshore Others Solar
€4.3bn
GM – Investor Relations | GM – Treasury | August 2019

Commerzbank 4.0
simple – digital – efficient
These written materials and the information contained herein may not be published and
may not be distributed in the United States of America, Canada and Australia
€mQ1
2018
Q2
2018
H1
2018
Q3
2018
Q4
2018
FY
2018
Q1
2019
Q2
2019
H1
2019
Total clean revenues 2,216 2,160 4,376 2,122 2,151 8,649 2,190 2,095 4,285
Exceptional items 1 18 19 18 -115 -78 -34 34 -
Total revenues 2,217 2,178 4,395 2,140 2,035 8,570 2,156 2,129 4,285
o/w Net interest income 1,098 1,190 2,288 1,223 1,237 4,748 1,231 1,274 2,505
o/w Net commission income 802 763 1,565 771 754 3,089 768 739 1,507
o/w Net fair value result 203 200 403 85 -121 366 85 28 113
o/w Other income 115 25 139 62 166 367 73 88 160
o/w Dividend income 14 6 21 9 6 36 1 10 11
o/w Net income from hedge accounting -16 36 20 6 22 48 50 46 96
o/w Other f inancial result -19 3 -15 6 35 26 -20 31 11
o/w At equity result 6 3 9 1 2 12 5 2 7
o/w Other net income 129 -24 105 40 101 245 37 -1 36
Risk result -77 -82 -160 -133 -154 -446 -78 -178 -256
Operating expenses 1,638 1,636 3,274 1,607 1,579 6,459 1,569 1,581 3,150
Compulsory contributions 244 58 302 55 63 420 265 72 337
Operating result 258 401 659 346 240 1,245 244 298 542
Pre-tax result discontinued operations 42 -12 30 -15 -30 -15 -19 19 -
Pre-tax result Commerzbank Group 301 389 689 331 210 1,230 225 318 542
Taxes on income 5 94 99 89 75 262 91 20 111
Minority Interests 34 23 57 24 22 103 14 27 41
Consolidated Result attributable to Commerzbank shareholders 262 272 533 218 113 865 120 271 391
Total Assets 470,013 487,518 487,518 493,203 462,369 462,369 503,246 518,030 518,030
o/w Discontinued operations - - - - 12,996 12,996 14,068 13,613 13,613
Average capital employed 22,468 22,640 22,556 23,097 23,399 22,886 23,440 23,818 23,635
RWA credit risk (end of period) 136,014 141,648 141,648 142,633 145,229 145,229 150,964 151,377 151,377
RWA market risk (end of period) 10,987 10,673 10,673 11,507 10,801 10,801 10,418 11,045 11,045
RWA operational risk (end of period) 21,090 21,297 21,297 21,685 21,393 21,393 21,562 22,833 22,833
RWA (end of period) continued operations 168,091 173,618 173,618 175,825 177,423 177,423 182,944 185,256 185,256
RWA (end of period) discontinued operations 1,999 1,890 1,890 2,535 3,075 3,075 2,213 1,541 1,541
RWA (end of period) 170,090 175,508 175,508 178,360 180,498 180,498 185,158 186,797 186,797
Cost/income ratio (excl. compulsory contributions) (%) 73.9% 75.1% 74.5% 75.1% 77.6% 75.4% 72.8% 74.2% 73.5%
Cost/income ratio (incl. compulsory contributions) (%) 84.9% 77.8% 81.4% 77.6% 80.6% 80.3% 85.1% 77.6% 81.4%
Operating return on CET1 (RoCET) (%) 4.6% 7.1% 5.8% 6.0% 4.1% 5.4% 4.2% 5.0% 4.6%
Operating return on tangible equity (%) 4.0% 6.1% 5.1% 5.3% 3.6% 4.8% 3.7% 4.5% 4.1%
Return on equity of net result (%) 3.8% 3.9% 3.8% 3.1% 1.6% 3.1% 1.7% 3.9% 2.8%
Net return on tangible equity (%) 4.2% 4.3% 4.3% 3.5% 1.8% 3.4% 1.9% 4.3% 3.1%
Commerzbank Group
44 GM – Investor Relations | GM – Treasury | August 2019

Commerzbank 4.0
simple – digital – efficient
These written materials and the information contained herein may not be published and
may not be distributed in the United States of America, Canada and Australia
€mQ1
2018
Q2
2018
H1
2018
Q3
2018
Q4
2018
FY
2018
Q1
2019
Q2
2019
H1
2019
Exceptional Revenue Items 1 18 19 18 -115 -78 -34 34 -
o/w Net interest income -26 -17 -43 -20 -17 -80 -22 -16 -39
o/w Net fair value result 14 50 63 31 -139 -44 18 30 48
o/w Other income 14 -15 -1 7 40 46 -30 21 -9
o/w FVA, CVA / DVA, OCS, Other ACR valuations (NII, NFVR) -24 42 18 41 -95 -36 -15 86 71
PSBC 25 -25 - -22 -23 -44 -20 -21 -41
o/w Net interest income -27 -25 -51 -23 -21 -95 -19 -18 -37
o/w Net fair value result - - -1 1 -2 -2 -1 -3 -4
o/w Other income 52 - 52 - - 52 - - -
o/w FVA, CVA / DVA (NII, NFVR) - - -1 1 -2 -2 -1 -3 -4
CC -1 -8 -9 15 -49 -43 -8 -23 -32
o/w Net interest income 1 - 1 -2 -2 -3 -3 -3 -6
o/w Net fair value result -1 -8 -10 16 -47 -40 -5 -20 -26
o/w Other income - - - - - - - - -
o/w FVA, CVA / DVA, OCS (NII, NFVR) -1 -8 -9 15 -49 -43 -8 11 3
ACR -23 51 28 26 -43 11 -3 78 75
o/w Net interest income - 7 7 5 6 17 - 4 4
o/w Net fair value result 15 59 74 15 -89 - 27 53 80
o/w Other income -38 -15 -53 7 40 -6 -30 21 -9
o/w FVA, CVA / DVA, Other ACR valuations (NII, NFVR) -23 51 28 26 -43 11 -3 78 75
O&C - - - -1 -1 -2 -2 - -3
o/w Net interest income - - - - - - - - -
o/w Net fair value result - - - -1 -1 -2 -2 - -3
o/w Other income - - - - - - - - -
o/w FVA, CVA / DVA (NII, NFVR) - - - -1 -1 -2 -2 - -3
Description of Exceptional Revenue Items
2018 €m 2019 €m
Q1 PPA Consumer Finance (PSBC) -27 Q1 PPA Consumer Finance (PSBC) -19
Q1 Polish group insurance business (PSBC) 52 Q2 PPA Consumer Finance (PSBC) -18
Q2 PPA Consumer Finance (PSBC) -25 Q2 Insurance based product (CC) -34
Q3 PPA Consumer Finance (PSBC) -23
Q4 PPA Consumer Finance (PSBC) -21
Commerzbank Group Exceptional Revenue Items
45 GM – Investor Relations | GM – Treasury | August 2019

Commerzbank 4.0
simple – digital – efficient
These written materials and the information contained herein may not be published and
may not be distributed in the United States of America, Canada and Australia
Glossary – Key Ratios
46 1) Includes consolidated P&L reduced by dividend accrual
2) Charge rate reflects current regulatory and market standard
Key Ratio Abbreviation Calculated for Numerator Denominator
GroupPrivate and Small Business
Customers and Corporate ClientsAsset & Capital Recovery Others & Consolidation
Cost/income ratio (excl.
compulsory
contributions) (%)
CIR (excl.
compulsory
contributions)
(%)
Group as well as
segments
PSBC and CC
Operating expenses Total revenues Total revenues n/a n/a
Cost/income ratio (incl.
compulsory
contributions) (%)
CIR (incl.
compulsory
contributions)
(%)
Group as well as
segments
PSBC and CC
Operating expenses
and compulsory
contributions
Total revenues Total revenues n/a n/a
Operating return on
CET1 (%)Op. RoCET (%)
Group and
segments (excl.
O&C)
Operating profit Average CET1 fully loaded ¹12% ² of the average RWAs
(YTD: PSBC €43.1bn, CC €100.7bn)
15% ² of the average RWAs
(YTD: €10.8bn)
n/a
(note: O&C contains the
reconciliation to Group CET1)
Operating return on
tangible equity (%)Op. RoTE (%)
Group and
segments (excl.
O&C)
Operating profit
Average IFRS capital after deduction
of goodwill and other intangible
assets ¹
12% ² of the average RWAs plus
average regulatory capital
deductions (excluding goodwill and
other intangible assets)
(YTD: PSBC €0.2bn, CC €0.7bn)
15% ² of the average RWAs plus
average regulatory capital
deductions (excluding goodwill and
other intangible assets)
(YTD: €0.2bn)
n/a
(note: O&C contains the
reconciliation to Group tangible
equity)
Return on equity of net
result (%)Net RoE (%) Group
Consolidated Result
attributable to
Commerzbank
shareholders
Average IFRS capital without non-
controlling
interests ¹
n/a n/a n/a
Net return on tangible
equity (%)Net RoTE (%) Group
Consolidated Result
attributable to
Commerzbank
shareholders
Average IFRS capital without non-
controlling
interests after deduction of goodwill
and other intangible assets ¹
n/a n/a n/a
Key Parameter Calculated for Calculation
Total clean revenuesGroup and
segmentsTotal revenues excluding exceptional revenue items
Underlying Operating
Performance
Group and
segmentsOperating result excluding exceptional revenue items and compulsory contributions
GM – Investor Relations | GM – Treasury | August 2019

Commerzbank 4.0
simple – digital – efficient
These written materials and the information contained herein may not be published and
may not be distributed in the United States of America, Canada and Australia
For more information, please contact Commerzbank’s IR team
Christoph Wortig (Head of Investor Relations)
P: +49 69 136 52668
Investors and Financial Analysts
Michael H. Klein
P: +49 69 136 24522
Jutta Madjlessi
P: +49 69 136 28696
Dirk Bartsch (Head of Strategic IR / Rating Agency Relations / ESG)
P: +49 69 136 22799
Mail: [email protected]
www.ir.commerzbank.com
Financial calendar
2019
Ansgar Herkert (Head of IR Communications)
P: +49 69 136 44083
47
07 Nov
Q3 2019 results
13 Feb
Q4 2019 press conference
13 May
Q1 2020 results
05 Aug
Q2 2020 results
05 Nov
Q3 2020 results
2020
GM – Investor Relations | GM – Treasury | August 2019