commissioned by the prepared by the community service council february 2013
TRANSCRIPT

EARLY CHILDHOOD PROFILE 2013LOGAN COUNTY
Commissioned by the
Prepared by the Community Service CouncilFebruary 2013

LOGAN COUNTY
Demographic Trends Economics and Employment Health Indicators

DEMOGRAPHIC TRENDS

DEMOGRAPHIC TRENDS
Population change--migration to suburban areas of Tulsa and Oklahoma City MSA with an overall decrease in new births
Age--aging population Race and ethnicity--more culturally
diverse Living arrangements--transitional for
family living arrangement
Dem
og
rap
hic
s
Prepared by the Community Service Council of Greater Tulsa
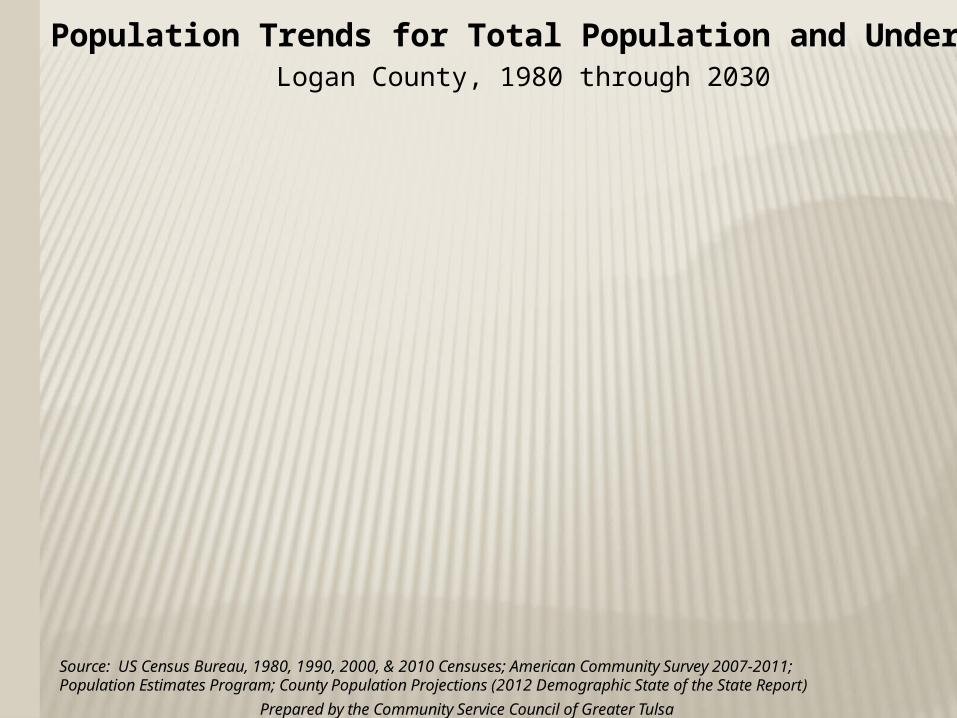
Population Trends for Total Population and Under Age 5Logan County, 1980 through 2030
Source: US Census Bureau, 1980, 1990, 2000, & 2010 Censuses; American Community Survey 2007-2011; Population Estimates Program; County Population Projections (2012 Demographic State of the State Report)
1980 1990 2000 2010 2011(est.)
2020(proj.)
2030(proj.)
0
10,000
20,000
30,000
40,000
50,000
60,000
Under age 5 2,104 1,944 2,082 2,783 2,664 2,683 2,833
Total Population 27,041 29,011 33,924 41,848 42,499 46,185 50,462
Dem
og
rap
hic
s
Prepared by the Community Service Council of Greater Tulsa
Dem
og
rap
hic
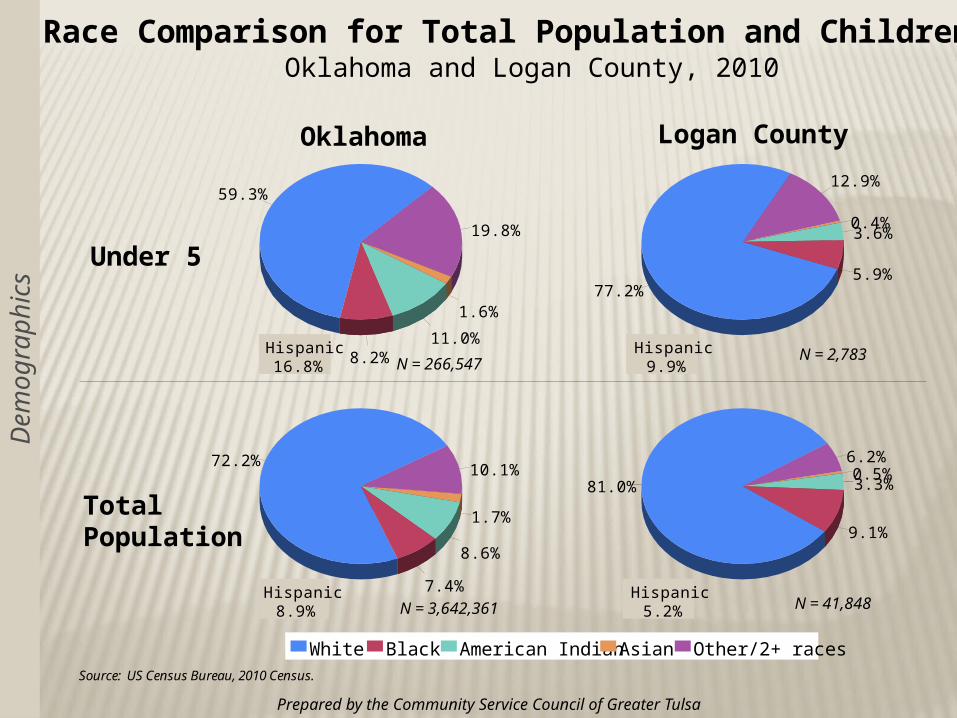
sRace Comparison for Total Population and Children under 5
Oklahoma and Logan County, 2010
Source: US Census Bureau, 2010 Census.
59.3%
8.2%11.0%
1.6%
19.8%
77.2%5.9%
3.6%0.4%
12.9%
72.2%
7.4%
8.6%
1.7%
10.1%81.0%
9.1%
3.3%0.5%
6.2%
White Black American Indian Asian Other/2+ races
Oklahoma Logan County
Under 5
Total Population
N = 41,848
N = 2,783N = 266,547
N = 3,642,361
Hispanic16.8%
Hispanic9.9%
Hispanic8.9%
Hispanic5.2%

Prepared by the Community Service Council of Greater Tulsa
Population Trends and Projections by Age GroupLogan County, 1980 - 2030
Source: US Census Bureau, 1970, 1980, 1990, 2000, & 2010 Censuses; US Census Bureau, Population Estimates Division, Population Projections, 2000 - 2030.
5.9
6.2
6.7
6.1
6.7
7.8
19.5
19.9
22.7
23.7
24.8
25.8
8
7.8
6.5
7.6
7.9
8.9
45.4
48.1
51.4
50.2
47.2
43.4
18
15.6
11.2
10.6
11.4
12.5
2030
2020
2010
2000
1990
1980
0% 20% 40% 60% 80% 100%
Percent of population
0-4 5-19 20-24 25-64 65-84 85+
1.9
1.4
1.2
.9
.6
Pro
ject
ions 2.5
2.1
Dem
og
rap
hic
s

Prepared by the Community Service Council of Greater Tulsa
Living Arrangements of Related Children Under 18Logan County, 1990, 2000, 2010, & 2007-11 Estimates
Source: US Census Bureau, 1990, 2000, and 2010 Censuses; US Census Bureau, American Community Survey 2007-11.
Married Couple Male-headed Female-headed Other relatives0%
20%
40%
60%
80% 1990 2000 2010 2007-11 est.
1990 76.3% 3.1% 14.4% 6.1%
2000 72.8% 4.8% 14.8% 7.6%
2010 70.6% 5.9% 13.4% 10.1%
2007-11 est. 71.3% 3.4% 17.3% 7.9%
Children living with 1 or both parents
Dem
og
rap
hic
s

ECONOMICS AND EMPLOYMENT

Ratio of Income to Poverty LevelPercentage of Total Population and Children
Logan County, 2007-11
Source: US Census Bureau, 2007-11 American Community Survey.
Total population Under 18 Under 6 6-170%
25%
50%
75%
Percentage of population
Below 100% Below 185% Below 200%
Below 100% 14.9% 19.7% 16.2% 21.3%
Below 185% 32.5% 40.4% 36.9% 41.9%
Below 200% 35.6% 44.4% 42.4% 45.3%
Eco
nom
ics
& E
mp
loym
en
t

Family of Three, Logan County, 2013*
Source: Oklahoma Association of Community Action Agencies and the Oklahoma Asset Building Coalition, December 2009, The Self-Sufficiency Standard for Oklahoma 2009; 2013 HHS Poverty Guidelines, Federal Register, Vol. 78, No. 16, January 24, 2013, pp. 5182-5183; Oklahoma State Dept. of Human Services; U.S. Census Bureau, 2007-11 American Community Survey.
$74,213
$63,604
$24,087
$10,309$15,312
$19,530
$36,131
$17,917
WelfareWage
MinimumWage
PovertyWage
185% PovertyWage
Median FamilyIncome
(2007-11 ACS)
$0
$20,000
$40,000
$60,000
$80,000Annual Wage
Self-Sufficiency Wage = $30,331 ($14.36/hr)
Comparison of Wages: Self-Sufficiency, Welfare, Minimum, Poverty, 185% of Poverty, and Median Family Income
($4.88/hr)($7.25/hr)
($9.39/hr)
($17.37/hr)
Notes: For the self-sufficiency wage, family of three consists of one adult, one preschooler and one schoolage child. Hourly wages given assume full-time, year-round employment. Welfare wage is the combined value of TANF, SNAP, & WIC.
Married-couple families w/ children <18($35.14/hr)
All families w/ children <18
Male-headed families w/ children <18
Female-headed families w/ children <18
($11.41/hr)
($30.12/hr)
($8.48/hr)
Eco
nom
ics
& E
mp
loym
en
t

Participation in Public Assistance ProgramsNumber of Participants and Percentage of Population Participating
Logan County, 2012
Source: Oklahoma Dept. of Human Services, Statistical Bulletin, September 2012; Oklahoma State Dept. of Education, Low Income Report for 2011-12; US Census Bureau, 2010 Census; Oklahoma State Department of Health-WIC Service, Caseload Report, October 2012; Oklahoma Health Care Authority, Monthly Enrollment Fast Facts November 2012.
8,683
3,843
228
501
279
6,355
76
219
517
20.4%
37.8%
23%
51%
10%
15%
0.7%
51.3%
11.4%
Soonercare Total (185%/100%)
Soonercare <19 (185%)
WIC Infants (185%)
WIC age 1-5 (185%)
Child Care Subsidy <5 (185%)
SNAP Total (130%)
TANF <18 (50%)
Elem. School Free Lunch (130%)
Elem. School Reduced Lunch (185%)
02,5005,0007,50010,000
Number of Participants
0% 20% 40% 60%
Percent of Population
Eco
nom
ics
& E
mp
loym
en
t
Prepared by the Community Service Council of Greater Tulsa
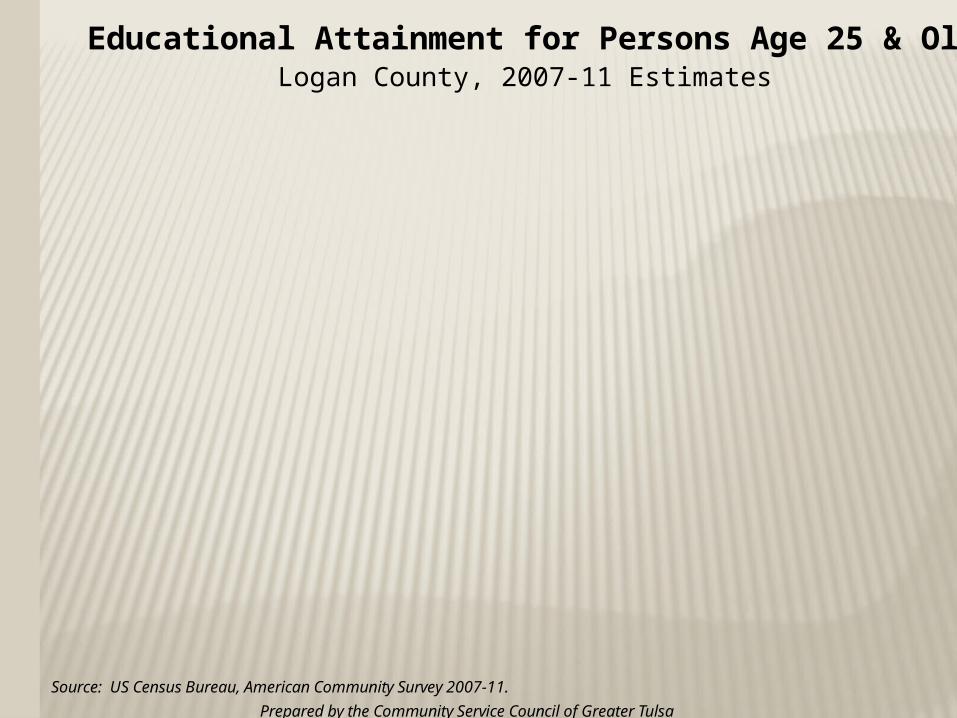
Educational Attainment for Persons Age 25 & OlderLogan County, 2007-11 Estimates
Source: US Census Bureau, American Community Survey 2007-11.
12.8%
34.3%
24.7%
5.2%
16.2%
5.2%
1.1%
0.6%
Less than high school
High school graduate
Some college
Associate degree
Bachelor's degree
Master's degree
Professional school degree
Doctorate degree
0% 5% 10% 15% 20% 25% 30% 35% 40%
Percent of persons 25+
Eco
nom
ics
& E
mp
loym
en
t
Prepared by the Community Service Council of Greater Tulsa
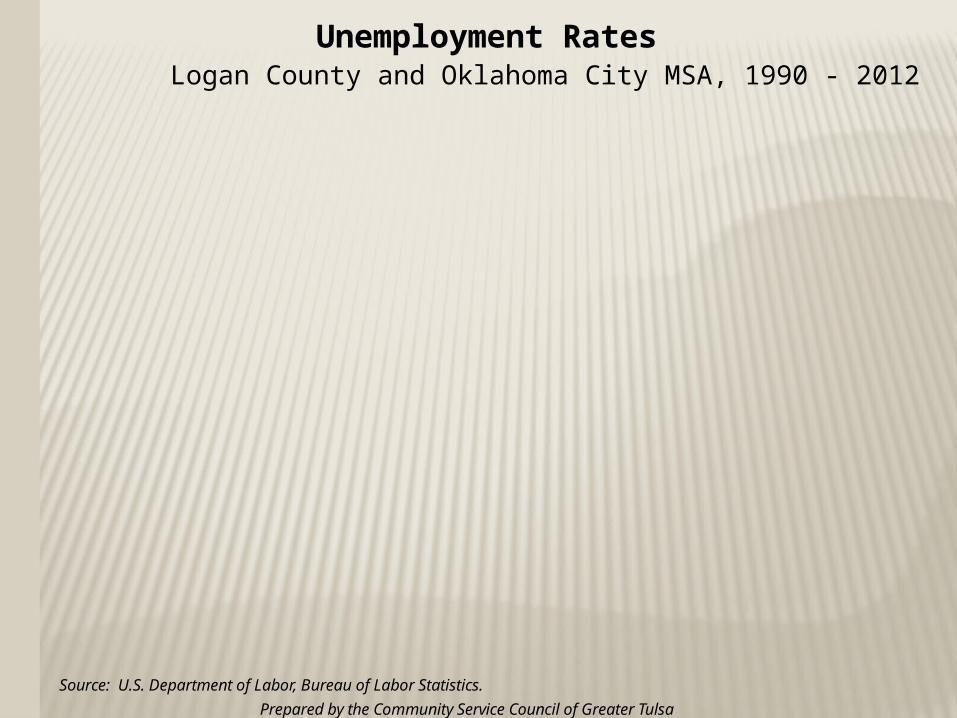
Unemployment RatesLogan County and Oklahoma City MSA, 1990 - 2012
Source: U.S. Department of Labor, Bureau of Labor Statistics.
1990199119921993199419951996199719981999200020012002200320042005200620072008200920102011Dec. 2012
0.0
1.0
2.0
3.0
4.0
5.0
6.0
7.0
Logan Co. 3.9 4.8 4.4 4.5 3.7 3.3 3.0 3.2 3.7 2.6 2.5 2.9 3.5 4.4 4.0 3.9 3.8 3.9 3.6 5.9 6.1 5.2 4.1
Oklahoma City MSA 5.3 5.2 5.4 4.9 4.4 3.6 3.4 3.4 3.6 2.7 2.7 3.6 4.5 5.2 4.6 4.4 4.1 4.2 3.8 6.2 6.5 5.7 4.6
Eco
nom
ics
& E
mp
loym
en
t
CHILD INDICATORS

WHY ARE CHILDREN AT RISK?
Lack of health insurance Limited access to preventative
services Living in high risk families Living in a state with a high level of
premature death
Prepared by the Community Service Council of Greater Tulsa
Ch
ild In
dic
ato
rs

THE ADVERSE CHILDHOOD EXPERIENCES (ACE) STUDY
Major American research project that poses the question of whether and how childhood experiences affect adult health decades later
Provides compelling evidence that: Adverse childhood experiences are surprisingly common ACE’s happen even in “the best of families” ACE’s have long-term, damaging consequences
Findings reveal powerful relationships between emotional experiences as children and physical and mental health as adults
Source: The Adverse Childhood Experiences Study website: www.acestudy.org, “About the Adverse Childhood Experiences Study.”
Ch
ild In
dic
ato
rs

THE ADVERSE CHILDHOOD EXPERIENCES (ACE) STUDY PYRAMID
Early Death
Disease, Disability and
Social Problems
Adoption of Health-risk Behaviors
Social, Emotional and Cognitive Impairment
Disrupted Neurodevelopment
Adverse Childhood Experiences
Ch
ild In
dic
ato
rs
Conception
Death
Mechanisms by which Adverse Childhood Experiences Influence Health and Well-being throughout the Lifespan
Source: The Adverse Childhood Experiences Study website: www.acestudy.org, “About the Adverse Childhood Experiences Study.”

ADVERSE CHILDHOOD EXPERIENCES…
Recurrent physical abuse
Recurrent emotional abuse
Sexual abuse An alcohol or drug
abuser An incarcerated
household member
Someone who is chronically depressed, suicidal, institutionalized or mentally ill
Mother being treated violently
One or no parents Emotional or
physical neglectSource: The Adverse Childhood Experiences Study website: www.acestudy.org, “What are Adverse Childhood Experieinces (ACE’s).”
Ch
ild In
dic
ato
rs
…GROWING UP IN A HOUSEHOLD WITH:

…LEAD TO HEALTH-RISK BEHAVIORS…
Smoking Overeating Physical inactivity Heavy alcohol use Drug use Promiscuity
Source: The Adverse Childhood Experiences Study website: www.acestudy.org
Ch
ild In
dic
ato
rs
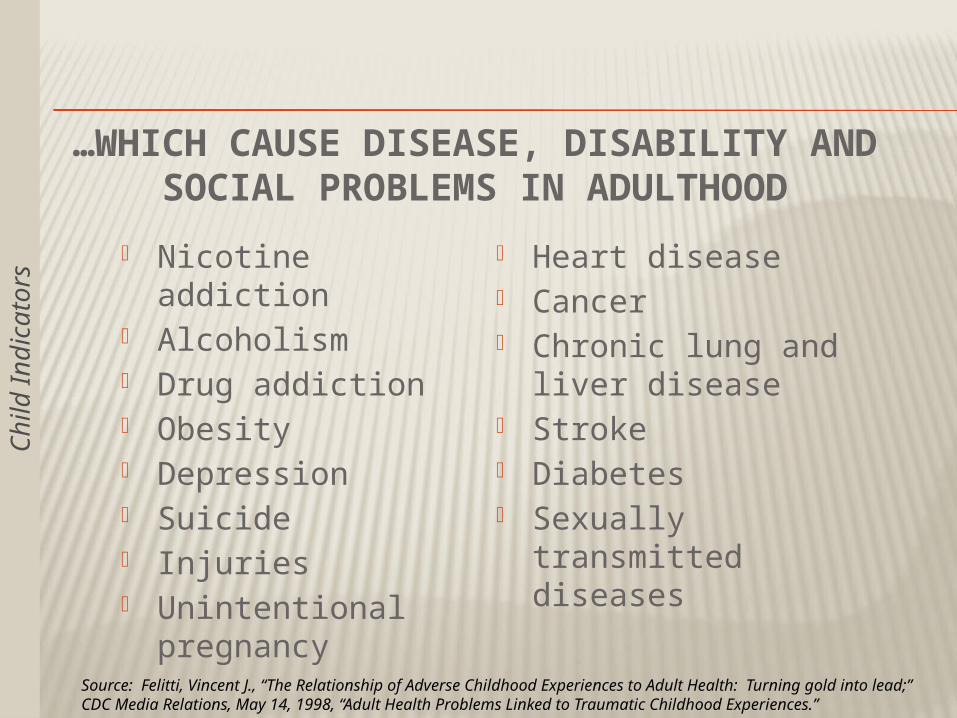
…WHICH CAUSE DISEASE, DISABILITY AND SOCIAL PROBLEMS IN ADULTHOOD
Heart disease Cancer Chronic lung and
liver disease Stroke Diabetes Sexually transmitted
diseases
Nicotine addiction Alcoholism Drug addiction Obesity Depression Suicide Injuries Unintentional
pregnancy
Source: Felitti, Vincent J., “The Relationship of Adverse Childhood Experiences to Adult Health: Turning gold into lead;” CDC Media Relations, May 14, 1998, “Adult Health Problems Linked to Traumatic Childhood Experiences.”
Ch
ild In
dic
ato
rs

Ch
ild In
dic
ato
rs
Prepared by the Community Service Council of Greater Tulsa
Summary of Risk Factors for InfantsLogan County and Oklahoma, 2008
Source: Oklahoma State Department of Health, Vital Statistics.
10.7%
34.2%
2.7%
13.6%
8.5%
1.4%
33.3%
19.3%
11.7%
13.7%
42.3%
5.4%
21.4%
6.9%
1.4%
34.8%
20.5%
11%
Teen mother(age 15-19)
Unmarried mother
Poor prenatal care(3rd trimester/no care)
Mother w/ <12th gradeeducation
Low birthweight(1500-2499 grams)
Very low birthweight(<1500 grams)
Short birth spacing(<24 mos. apart)
Very short birth spacing(<18 mos. apart)
Premature(<37 weeks gest.)
0% 10% 20% 30% 40% 50%
Percent of Births
Logan Co.
Oklahoma
Logan County births: 515 Oklahoma births: 54,753

Ch
ild In
dic
ato
rs
Prepared by the Community Service Council of Greater Tulsa
Characteristics of Births to Teen Mothers (Age 15-19)Logan County and Oklahoma, 2008
Source: Oklahoma State Department of Health, Vital Statistics.
80%
3.6%
45.5%
9.1%
1.8%
21.8%
9.1%
0%
81.6%
7.1%
54.1%
7.9%
1.8%
67.6%
46.9%
11.6%
20.8%
3.6%
Unmarried
Poor prenatal care(3rd trimester/no care)
Mother w/ <12th gradeeducation
Low birthweight(1500-2499 grams)
Very low birthweight(<1500 grams)
Short birth spacing(<24 mos. apart)
Very short birth spacing(<18 mos. apart)
Premature(<37 weeks gest.)
1+ previous births
2+ previous births
0% 20% 40% 60% 80% 100%
Percent of Teen Births
Logan Co.
Oklahoma
Logan County births to teens: 55Logan County teen birth rate: 33.8 (per 100,000 females age 15-19)
Oklahoma births to teens: 7,492Oklahoma teen birth rate: 61.6 (per 100,000 females age 15-19)
N/A
N/A
Prepared by the Community Service Council of Greater Tulsa
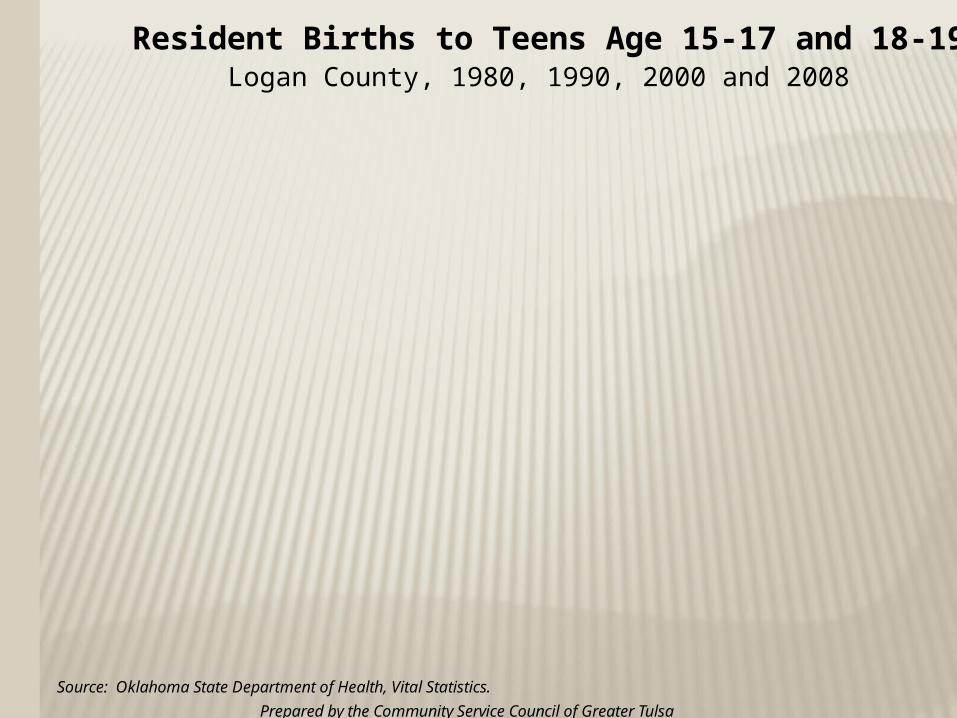
Resident Births to Teens Age 15-17 and 18-19Logan County, 1980, 1990, 2000 and 2008
Source: Oklahoma State Department of Health, Vital Statistics.
1980 1990 2000 20080
15
30
45
60
Number of births
0
40
80
120
160Specific birth rate
Births 15-17 27 18 11 21
Births 18-19 56 41 39 34
Birth rate 15-17 40.5 25.6 13 24
Birth rate 18-19 78.9 69.5 56 45.3
Note: Specific birth rate is the number of births to females in specified age group per 1,000 females in age group.
Ch
ild In
dic
ato
rs
Prepared by the Community Service Council of Greater Tulsa
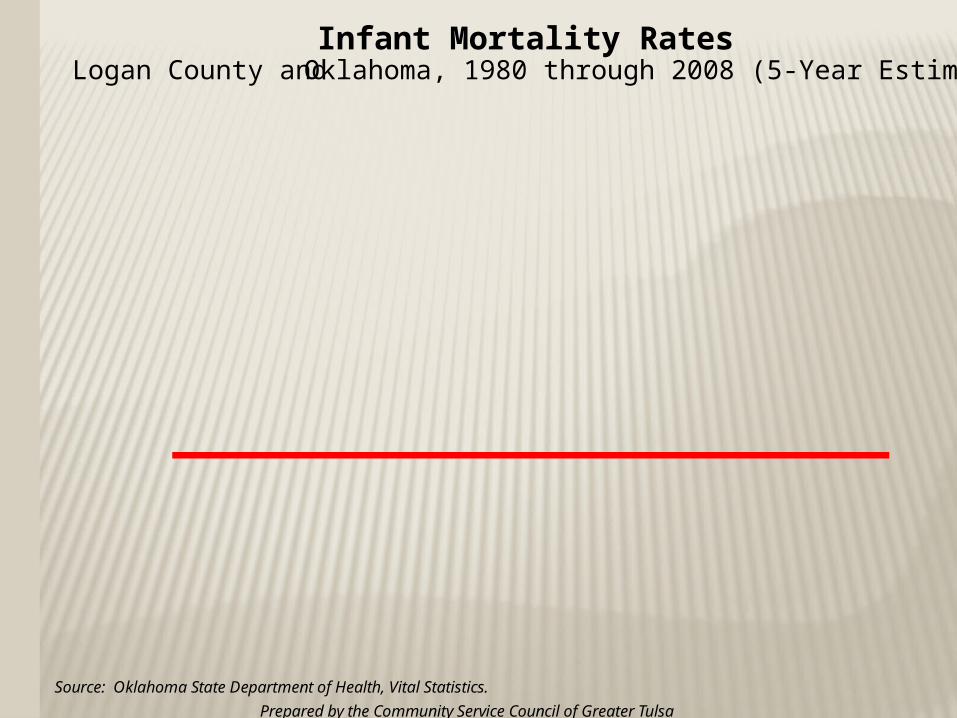
Infant Mortality RatesLogan County and Oklahoma, 1980 through 2008 (5-Year Estimates)
Source: Oklahoma State Department of Health, Vital Statistics.
19
80
-84
19
81
-85
19
82
-86
19
83
-87
19
84
-88
19
85
-89
19
86
-90
19
87
-91
19
88
-92
19
89
-93
19
90
-94
19
91
-95
19
92
-96
19
93
-97
19
94
-98
19
95
-99
19
96
-00
19
97
-01
19
98
-02
19
99
-03
20
00
-04
20
01
-05
20
02
-06
20
03
-07
20
04
-08
0
5
10
15
20
25Number of infant deaths per 1,000 live births
Logan County Oklahoma
Logan County 7 5.7 6.7 7.8 8.3 9 9.5 5.5 5.6 4.5 4 4.6 6.4 4.6 7.5 9.1 8.5 8.1 9.5 7.2 7.3 8.3 8.7 7.9 8.5
Oklahoma 11.2 10.9 10.6 10 9.7 9.3 9 8.9 8.7 8.7 8.7 8.6 8.4 8.2 8.2 8.2 8.2 8 8.1 8 7.9 7.8 8 8.1 8
From 2003 through 2008, there was an average of 3.7 infant deaths per year in Logan County, for a rate of 7.9 per 1,000 live births. In Oklahoma, the average was 421 infant deaths, for a rate of 8.0.
“Healthy People 2020” goal = 6.0 per 1,000
Ch
ild In
dic
ato
rs

Prepared by the Community Service Council of Greater Tulsa
Average Daily Membership and Percentage of Children Enrolled in Special Education, by School District
Logan County County, School Year 2011-12
Source: Oklahoma State Department of Education, Education Oversight Board, Office of Accountability, Profiles 2012 Reports.
Coyle Crescent Guthrie Mulhall-Orlando0
1,000
2,000
3,000
4,000ADM
0%
10%
20%
30%
40%Percent in Special Education
ADM % Spec. Ed.
ADM 334.8 603.4 3,290.1 243.4
% Spec. Ed. 21.2% 16.2% 12.9% 19.4%
Logan County total ADM = 4,471.1; percentage in special education = 14.3%
Ch
ild In
dic
ato
rs

Prepared by the Community Service Council of Greater Tulsa
DHS Licensed Child Care Services Provided to Children Under Age 5, by Age
Logan County, December 2002 - December 2012
Source: Oklahoma Department of Human Services, Monthly Statistical Bulletins.
40
70
63
57
65
31
5358
81
62
32
62
6864
53
Age <1 Age 1 Age 2 Age 3 Age 40
20
40
60
80
100Percent
December 2002 December 2007 December 2012
Ch
ild In
dic
ato
rs

Child Deaths Due to AbuseOklahoma, Fiscal Years 1978 - 2010
Source: Oklahoma Dept. of Human Services, Children & Family Services Division.
75
12 13
1821
16 16
24
31
2325
18
38
2023
3134
29
4245
47 48
3835
27
51
40
32
3941
52
38
1978
1979
1980
1981
1982
1983
1984
1985
1986
1987
1988
1989
1990
1991
1992
1993
1994
1995
1996
1997
1998
1999
2000
2001
2002
2003
2004
2005
2006
2007
2008
2009
2010
0
10
20
30
40
50
60
Ch
ild In
dic
ato
rs

CHILD ABUSE & NEGLECT
In Logan County in FY 2012, there were 257 reports of child abuse and/or neglect accepted for investigation or assessment. 408 children were involved in these reports (duplicated count).
99 children were confirmed victims of child abuse and/or neglect. 41 were abused, 34 were neglected, 24 were victims of both abuse and neglect.
Nearly 4 of every 1,000 children in Logan County are victims of abuse and/or neglect. In Oklahoma, the rate is just under 9 of every 1,000 children.
Oklahoma ranks #23 in the nation in the rate of children who are victims of abuse and/or neglect.
Parents make up 78.6% of all perpetrators, followed by “no relation” at 6.9%, step-parents at 5.4%, and grandparents at 3.0%.
Substance abuse is a major contributing factor to child neglect.
Prepared by the Community Service Council of Greater Tulsa
Ch
ild In
dic
ato
rs
Prepared by the Community Service Council of Greater Tulsa
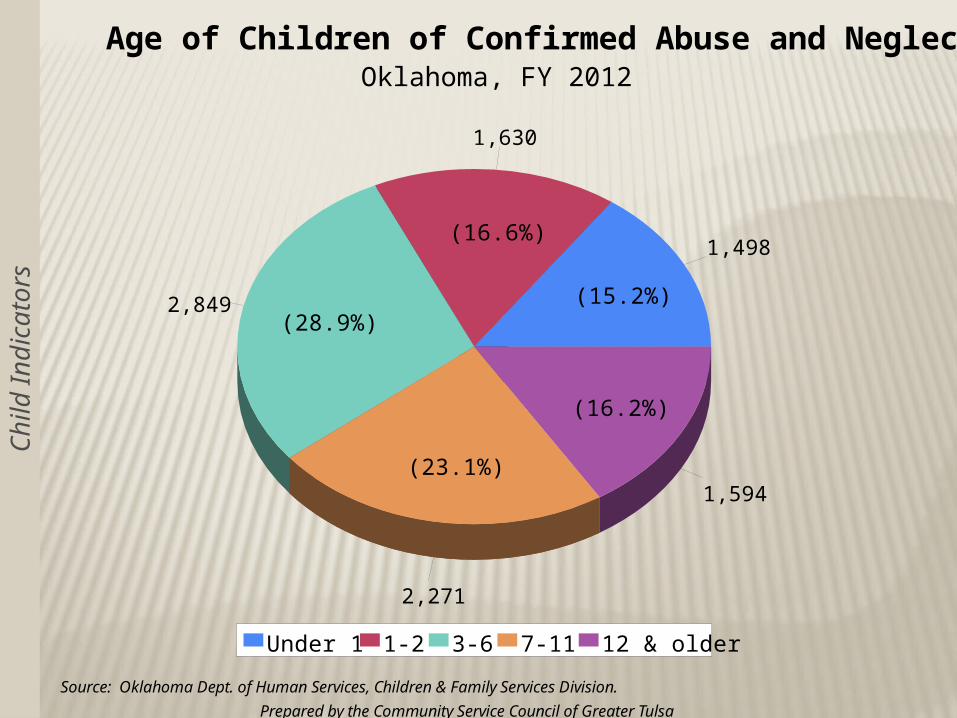
Age of Children of Confirmed Abuse and NeglectOklahoma, FY 2012
Source: Oklahoma Dept. of Human Services, Children & Family Services Division.
1,498
1,630
2,849
2,271
1,594
(15.2%)
(16.6%)
(28.9%)
(23.1%)
(16.2%)
Under 1 1-2 3-6 7-11 12 & older
Ch
ild In
dic
ato
rs

Prepared by the Community Service Council of Greater Tulsa
Elementary School Students Eligible for Free and Reduced Lunch Program
By School District, Logan County, 2012-2013 School Year
Source: Oklahoma State Dept. of Education, Low Income Report for 2012-2013.
52.1%
53.8%
41.9%
39%
63.4%
11.1%
11.6%
8.2%
11.7%
11.3%
Logan County Total
Guthrie
Crescent
Mulhall-Orlando
Coyle
0% 20% 40% 60% 80% 100%
Percent of Students Eligible
Free
Reduced
Free lunch eligibility requirement: annual household income below 130% of poverty, which currently is $25,389 for a family of three.
Reduced lunch eligibility requirement: annual household income below 185% of poverty, which currently is $36,131 for a family of three.
Ch
ild In
dic
ato
rs

Juvenile Arrests, by Type of CrimeLogan County, 2002 through 2011
Source: Oklahoma State Bureau of Investigation, Uniform Crime Reports.
Index crimes Drug related Alcohol related Other crimes0
10
20
30
40
50
60Number of arrests
2002 2003 2004 2005 2006
2007 2008 2009 2010 2011
A total of 75 juvenile arrests were made in Logan County in 2011, for a rate of 16.3 per 1,000 juveniles age 10-17, down from 107 arrests for a
rate of 24.7 in 2002.
Includes murder, rape, robbery aggravated
assault, burglary, larceny, and motor vehicle theft.
Includes sale/manufacturing
and possession of drugs.
Includes driving under the influence, liquor law violations, and drunkenness.
Includes other assaults, disorderly conduct, curfew & loitering, runaway and all other non-traffic offenses
Ch
ild In
dic
ato
rs

Prepared by the Community Service Council of Greater Tulsa
Source: Centers for Disease Control, Youth Risk Behavior Surveillance System; Oklahoma State Department of Health, OK2SHARE.
47.8%
22%
9.9%
22.2%
26.5%
17.5%
30.6%
43.1%
15.9%
5.5%
19.1%
23.2%
13.3%
26.8%
38.3%
19.1%
4.2%
17.2%
22.7%
7.2%
19.7%
38.7%
23.1%
3.8%
25.6%
18.1%
8.2%
24.1%
Alcohol
Marijuana
Methamphetamine
Offered/sold/givenillegal drugs at school
Smoked cigarettesduring past month
Drove after drinkingalcohol in past month
Rode with drinkingdriver in past month
0% 10%20%30%40%50%
2003 Oklahoma
2007 Oklahoma
2011 Oklahoma
2011 US
Youth Risk Behavior Survey:Summary of Alcohol, Other Drug & Tobacco Use
High School Students, Oklahoma, 2003 through 2011, and U.S. 2011
Used once or more during past 30 days...
Ever used...
Ch
ild In
dic
ato
rs

Prepared by the Community Service Council of Greater Tulsa
Source: Centers for Disease Control, Youth Risk Behavior Surveillance System; Oklahoma State Department of Health, OK2SHARE.
50%
5.8%
64.3%
17.7%
7%
14.2%
50.9%
5.8%
59.6%
16.7%
5.9%
15.2%
49.6%
50.5%
5%
57.1%
20.5%
6.3%
16.3%
50.8%
47.4%
6.2%
60.2%
18%
7.8%
15.2%
49.5%
Ever hadsexual intercourse
Had sex before age 13
Used condom last time
Used birth controlpills last time
Attempted suicidein past year
Overweight(according to BMI)
Physical activity for60 min/day 5 of past 7 days
0% 20% 40% 60% 80%
2003 Oklahoma
2007 Oklahoma
2011 Oklahoma
2011 US
Youth Risk Behavior Survey:Summary of Sexual Behaviors, Suicide & Physical Health
High School Students, Oklahoma, 2003 through 2011, and U.S. 2011
N/A
Ch
ild In
dic
ato
rs

Prepared by the Community Service Council of Greater Tulsa
Health StatusOklahoma and United States, 1996 - 2012
Source: United Health Foundation, “America’s Health Rankings.“
'96 '97 '98 '99 '00 '01 '02 '03 '04 '05 '06 '07 '08 '09 '10 '11 '120%
5%
10%
15%
20%
25%
Pe
rce
nt a
du
lt s r
ep
ort
ing
f air
or
po
or
he
alt h
0
10
20
30
40
50
Sta
te ra
nk
Oklahoma Rank US
Oklahoma 13.1% 14%13.4%12.6%17.4%15.3%19.6%17.7%17.8%19.7%18.7%20.2%19.2%18.7%20.2%20.5%19.6%
Rank 26 32 28 25 42 34 45 41 41 44 42 46 43 42 42 45 41
US 12.9%12.9%12.8%12.6% 13%13.9% 14%14.7%14.7%14.9%14.8%14.7%14.9%14.4%14.5%14.7%16.9%
Ch
ild In
dic
ato
rs

Prepared by the Community Service Council of Greater Tulsa
Prevalence of ObesityOklahoma and United States, 1990 - 2012
Source: United Health Foundation, “America’s Health Rankings.“
'90 '91 '92 '93 '94 '95 '96 '97 '98 '99 '00 '01 '02 '03 '04 '05 '06 '07 '08 '09 '10 '11 '120%
5%
10%
15%
20%
25%
30%
35%
Pe
rce
nt o
f po
pu
l ati o
n e
stim
at e
d t o
be
ob
ese
0
10
20
30
40
50
Sta
te ra
nk
Oklahoma Rank US
Ch
ild In
dic
ato
rs

Prepared by the Community Service Council of Greater Tulsa
Prevalence of SmokingOklahoma and United States, 1990 - 2012
Source: United Health Foundation, “America’s Health Rankings.“
'90 '91 '92 '93 '94 '95 '96 '97 '98 '99 '00 '01 '02 '03 '04 '05 '06 '07 '08 '09 '10 '11 '120%
10%
20%
30%
40%
50%
60%
Pe
rce
nt o
f po
pu
l ati o
n o
ver
18
t ha
t sm
oke
re
gu
lar l
y
0
10
20
30
40
50
60
Sta
te ra
nk
Oklahoma Rank US
Ch
ild In
dic
ato
rs

1950
1955
1960
1965
1970
1975
1980
1985
1990
1995
2000
2005
2010
2012
0
5,000
10,000
15,000
20,000
25,000
30,000Prison population
Oklahoma’s Prison PopulationFiscal Years 1950 - 2012
Source: Oklahoma Department of Corrections.
US incarceration rates (2012): Male: 932 per 100,000 people Female: 65 per 100, 000 people Total: 497 per 100,000 people
Oklahoma incarceration rates (2012): Male: 1,167 per 100,000 people Female: 128 per 100,000 people Total: 686 per 100,000 people
Prepared by the Community Service Council of Greater Tulsa
Cri
me &
In
carc
era
tion

Health Insurance Status, by AgeU.S. & Oklahoma, 2010-11
Source: Kaiser Family Foundation, StateHealthFacts.org; Oklahoma Health Care Authority, Oklahoma County Chartbook, May 2009.
149,350,600(48.5%)
15,416,100(5.0%)
50,670,200(16.5%)
39,996,700(13.0%)
3,846,400(1.2%)
48,611,600(15.8%)
39,136,100(49.9%)
3,112,700(4.0%)
27,361,400(34.9%)
1,135,000(1.4%)
7,633,900(9.7%)
109,524,600(58.3%)
12,057,800(6.4%)
19,609,300(10.4%)
6,526,400(3.5%)
40,281,600(21.4%)
1711300(46.0%)
156300(4.2%)
594100(16.0%)
538500(14.5%)
79100(2.1%)
638500(17.2%)
438200(45.2%)
42700(4.4%)
392400(40.5%)
96500(10.0%)
1276000(58.1%)
112100(5.1%)
156500(7.1%)
114300(5.2%)
538700(24.5%)
Employer Individual Medicaid Medicare Other public Uninsured
Total Population Under Age 19 Age 19-64
Estimated uninsured non-elderly population of Logan County (2008) = 19.6%Estimated Medicaid enrollment rate for Logan County (2007) = 20.0%
(Oklahoma Health Care Authority, May 2009)
United States
Oklahoma
Healt
h In
dic
ato
rs
Oklahoma's Rankings in Health Determinants, 2012 (part 1)According to United Health Foundation's State Health Rankings
Note: Missing data values represent years in which variables were not measured/ranked.
Source: United Health Foundation, “America’s Health Rankings.“
#47
#12
#45
#25
#39
#42
#11
#24
#29
Personal Behaviors
Prevalence of smoking
Prevalence of Binge Drinking
Prevalence of obesity
Community & Environment
High school graduation
Violent crime
Occupational fatalities
Infectious disease
Children in poverty
Air pollution
#0 #10 #20 #30 #40 #50
1992 2002 2012
Ranking: 1=best, 50=worst
Healt
h In
dic
ato
rs

Oklahoma's Rankings in Health Determinants, 2012 (part 2)According to United Health Foundation's State Health Rankings
Notes: Missing data values represent years in which variables were not measured/ranked. Updated data for “early prenatal care” were not available. Shown results are for 1991, 2001, & 2011.
Source: United Health Foundation, “America’s Health Rankings.“
#35
#15
#20
#47
#49
#45
#42
Public & Health Policies
Lack of health insurance
Public health funding (per capita)
Immunization coverage
Clinical Care
Early prenatal care
Primary Care Physicians
Preventable Hospitalizations
All Determinants
#0 #10 #20 #30 #40 #50
1992 2002 2012
Ranking: 1=best, 50=worst
Healt
h In
dic
ato
rs

Oklahoma's Rankings in Health Outcomes, 2012According to United Health Foundation's State Health Rankings
Note: Missing data values represent years in which variables were not measured/ranked.
Source: United Health Foundation, “America’s Health Rankings.“
#46
#40
#20
#39
#48
#42
#46
#44
Poor mental health days
Poor physical health days
Geographic disparity
Infant mortality
Cardiovascular deaths
Cancer deaths
Premature death
All Health Outcomes
#0 #10 #20 #30 #40 #50
1992 2002 2012
Ranking: 1=best, 50=worst
Oklahoma’s overall health ranking for 2012 is # 43
Healt
h In
dic
ato
rs

ADVERSE CHILDHOOD EXPERIENCESLOGAN COUNTY RANKINGS
Incarcerated household member 27
Violence against mother 43 Mental illness and substance abuse 46 Psychological, physical & sexual abuse 41 Emotional & physical neglect 26
Overall ACE ranking 5
Rankings: 1 = best, 77 = worst*Indicates a tie with at least one other county
Source: Oklahoma 2009 KIDS COUNT Factbook (2007-2008 rankings), Oklahoma Institute for Child Advocacy, OKDHS FY2012 Child Abuse and Neglect Statistics, Oklahoma State Bureau of Investigation 2011 Uniform Crime Report
Ch
ild In
dic
ato
rs

…IN SUMMARY

EARLY CHILDHOOD PROFILE 2013LOGAN COUNTY
Prepared by the Community Service Council of Greater TulsaFebruary 2013
…is available on our website:www.csctulsa.org
Presentation are available from Jan Figart