commodities 161110 sutias
TRANSCRIPT

8/8/2019 Commodities 161110 SUTIAS
http://slidepdf.com/reader/full/commodities-161110-sutias 1/26
Commodities
Introduction and overview
Alexander Raygorodetskiy
Salman Shariff

8/8/2019 Commodities 161110 SUTIAS
http://slidepdf.com/reader/full/commodities-161110-sutias 2/26
2
COMMODITIES TYPES
16 November 2010SUTIAS
Energy
Crude OilOil Products
RefiningCoal-to-Liquids & Gas-to-LiquidsOil SandsOil TransportationUS Natural GasLiquefied Natural GasUS Power
Thermal CoalUraniumEthanol
CO EmissionsRenewable Energy
Precious Metals
Gold
Silver
Platinum
Palladium
Rhodium
Other Platinum Group Metals:
Ruthenium, Iridium & Osmium
Industrial Metals & Bulk
Commodities
Aluminium
Copper LeadNickelTinZincIron OreFerro-Chrome
Metallurgical CoalSteel
Minor Metals
CobaltGalliumLithiumMagnesiumManganese
MolybdenumRheniumTantalumThorium
TitaniumTungstenVanadium
Agriculture
CocoaCoffee (Arabica)
Coffee (Robusta)CornCottonPalm OilRapeseedRiceRubber
SoybeansSugar Wheat
Orange JuiceFeeder CattleLean HogsFrozen Pork Bellies

8/8/2019 Commodities 161110 SUTIAS
http://slidepdf.com/reader/full/commodities-161110-sutias 3/26
3
COMMODITIES MARKET OVERVIEW
16 November 2010SUTIAS
Source: Bloomberg
Figure 1: Commodity Scorecard since 2002 Figure 2: Top 20 commodity futures by turnover
Source: NYMEX, ICE, DCE, LME, NYBOT, TCE, SHFE, CBOT, ZCE

8/8/2019 Commodities 161110 SUTIAS
http://slidepdf.com/reader/full/commodities-161110-sutias 4/26
4
ENERGY
16 November 2010SUTIAS
Global energy consumption has nearly doubled since the 1973 oilcrisis. In terms of the energy mix, oil provides approximately 36% of
total primary energy consumption, that is primary fuels that are
commercially-traded. Despite the implications for global warming and
the environment, coal represents 29% of total energy use followed by
natural gas, which meets 26% of energy demand. Hydro-power and
nuclear energy account for approximately 6% each.
Energy markets, and specifically crude oil, are the deepest and
most liquid of all the five broad commodity sectors. The Nymex WTI
crude oil futures contract is the most actively traded commodity future
anywhere in the world, with annual turnover in 2007 of just over 120million lots. The NYMEX WTI futures contract is therefore twice as
liquid as its nearest rival, the ICE Brent futures contracts. In the past
two years, turnover on both contracts has more than doubled.

8/8/2019 Commodities 161110 SUTIAS
http://slidepdf.com/reader/full/commodities-161110-sutias 5/26
5
ENERGY
16 November 2010SUTIAS
Source: NYMEX, ICE, TOCOM, SHFE, CJCE (Turnover in million lots)
Figure 3: Energy futures turnover Figure 4: Global energy use by region in 2007
Source: BP Statistical Review

8/8/2019 Commodities 161110 SUTIAS
http://slidepdf.com/reader/full/commodities-161110-sutias 6/26
6
CRUDE OIL
16 November 2010SUTIAS
Saudi Arabia is the world¶s largest producer as well as exporter of crudeoil. Although the US is the world¶s third-largest oil producing nation, it is also
the world¶s largest importer of oil, representing 25% of cross-border trade in
oil. In terms of annual production, OPEC's market share has declined from
about 50% in 1973 to 32% in 1987 and has averaged approximately 43%
over the 2005 to 2008 period. This share is expected to rise going forward
since the 12 OPEC member countries hold 75% of the world¶s proved crudeoil reserves. The largest oil reserves exist in Saudi Arabia, Iran and
Iraq, Figure 5.
The United States remains the largest consumer of oil, accounting for
24% of world consumption in 2007. In 2005, China overtook Japan to
become the world¶s second largest oil consumer. Since 1995
India hasmoved from being the 13th largest oil consuming nation to the world¶s 4th.
Brazil has also moved up the league table of oil consuming nations from 12th
to 9th place over the same period. In terms of oil demand growth, China is
expected to post the largest incremental increase in oil demand during the
current decade.

8/8/2019 Commodities 161110 SUTIAS
http://slidepdf.com/reader/full/commodities-161110-sutias 7/26
7
CRUDE OIL
16 November 2010SUTIAS
Source: Central Intelligence Agency
Figure 5: Crude oil reserves by country
18.97%
12.67%
9.95%
8.31%7.52%
7.18%
7.07%
5.71%
3.20
%
2.69%
2.17%
1.84% 1.47%
1.38%0.93%
8.94%Saudi Arabia
Canada
Iran
Iraq
Kuwait
Venezuela
United Arab Emirates
Russia
Libya
Nigeria
Kazakhstan
Qatar
China
United States
Brazil
Others

8/8/2019 Commodities 161110 SUTIAS
http://slidepdf.com/reader/full/commodities-161110-sutias 8/26
8
CRUDE OIL
16 November 2010SUTIAS
Figure 6: Different crude oil grades compared
Source: EIA
8/8/2019 Commodities 161110 SUTIAS
http://slidepdf.com/reader/full/commodities-161110-sutias 9/26
9
BALTIC DRY INDEX
16 November 2010SUTIAS
The Baltic Dry Index (BDI) is a number issued daily by theLondon-based Baltic Exchange. Not restricted to Baltic Sea
countries, the index tracks worldwide international shipping prices of
various dry bulk cargoes.
The index provides "an assessment of the price of moving the
major raw materials by sea. Taking in 26 shipping routes measured
on a time charter and voyage basis, the index covers
Handymax, Panamax, and Capesize dry bulk carriers carrying a
range of commodities including coal, iron ore and grain.
Most directly, the index measures the demand for shippingcapacity versus the supply of dry bulk carriers. The demand for
shipping varies with the amount of cargo that is being traded or
moved in various markets (supply and demand).

8/8/2019 Commodities 161110 SUTIAS
http://slidepdf.com/reader/full/commodities-161110-sutias 10/26
10
BALTIC DRY INDEX
16 November 2010SUTIAS
Source: Bloomberg
Figure 7: 3Y Baltic Dry Index

8/8/2019 Commodities 161110 SUTIAS
http://slidepdf.com/reader/full/commodities-161110-sutias 11/26
11
NATURAL GAS
16 November 2010SUTIAS
The US and the countries of the former Soviet Union are the largestproducers of natural gas. The Russian natural gas industry is dominated by
Gazprom, which controls 95% of production. In the
US, Texas, Louisiana, Alaska, New Mexico and Oklahoma hold more than
half of the country¶s reserves. Other major producers include
Canada, Iran, Norway, Algeria, Saudi Arabia, and the United Kingdom. World
natural gas reserves are estimated at 6,261 trillion cubic feet (tcf). TheMiddle East holds 41% of world reserves, while an additional 40% is located
in the former Soviet Union, with only 9% held in the OECD countries.
Burning natural gas is relatively clean, producing 30% less carbon dioxide
than petroleum and 45% less than coal. The major use for gas is in
homes, businesses and factories for heating, cooking and cooling. Naturalgas is increasingly used as a source of energy for electricity generation via
gas turbines and steam turbines. Compressed natural gas is used as a
vehicle fuel for public transport buses. In addition, natural gas is used as a
base ingredient in the manufacture of
ammonia, antifreeze, fabrics, glass, steel, plastics and paint.

8/8/2019 Commodities 161110 SUTIAS
http://slidepdf.com/reader/full/commodities-161110-sutias 12/26
12
NATURAL GAS
16 November 2010SUTIAS
Source: BP Statistical Review
Figure 8: The world¶s top 10 natural gas producers, consumers, exporters and importers

8/8/2019 Commodities 161110 SUTIAS
http://slidepdf.com/reader/full/commodities-161110-sutias 13/26

8/8/2019 Commodities 161110 SUTIAS
http://slidepdf.com/reader/full/commodities-161110-sutias 14/26
14
THERMAL COAL
16 November 2010SUTIAS
Source: AME
Figure 9: Major exporters and importers of thermal coal

8/8/2019 Commodities 161110 SUTIAS
http://slidepdf.com/reader/full/commodities-161110-sutias 15/26
15
URANIUM
16 November 2010SUTIAS
In 2007, Canada was the world¶s largest producer of uranium, amountingto 9.5Kt, although Kazakhstan is set to surpass Canada as the top global
producer in the coming years. Australia has the world¶s largest reasonably
assured reserves of uranium, amounting to 1,142,000 tonnes, representing
30% of the world¶s total. However, there are tight restrictions on new uranium
mining in Australia that will likely remain in place for the next several years
which will restrict access to most Australian material, though we think thesepolicies will eventually be overturned. Other major producing countries are
South Africa, Namibia, Russia and Niger.
Today, nearly 100% of all uranium produced goes to nuclear reactors for
electricity generation, with a very small amount used in research, medical
applications and as fuel for nuclear-powered ships and submarines. In itsfinal physical form, uranium dioxide (UO2) is a ceramic powder, pressed into
small cylindrical pellets. These pellets are loaded into zirconium alloy or
stainless steel fuel rods which are assembled into bundles to form an array of
reactor fuel assemblies.

8/8/2019 Commodities 161110 SUTIAS
http://slidepdf.com/reader/full/commodities-161110-sutias 16/26
16
URANIUM
16 November 2010SUTIAS
Source: UxC
Figure 10: Uranium production by country Figure 11: The leading uranium mining companies
Source: Raw Materials Group

8/8/2019 Commodities 161110 SUTIAS
http://slidepdf.com/reader/full/commodities-161110-sutias 17/26
17
RENEWABLE ENERGY
16 November 2010SUTIAS
Renewable energy is produced from resources which are naturally replenished, such asrain, wind, sunlight, oceanic streams, geothermal heat and biomass. In order to get rid of the
intermittency inherent in renewable, storage capacities and integration to the electricity¶s
transportation network are essential, not even taking into account the potential of smart grids in the
future.
Hydropower is the most commonly of all renewable energy sources for electricity generation.
Hydropower generates electricity by harnessing or directing moving water. Typically, water flowing
through a penstock or a pipe, turns and pushes against the blades in a turbine to spin a generator
to produce electricity. Hydropower has been used for thousands of years to turn stones for grindinggrains and consequently it is one of the oldest harnessed sources of energy. However, it did not
become widely used until the 20th Century when the technology to transmit electricity over long
distances was developed.
Wind power uses wind turbines to generate electricity. The power output of a turbine increases
dramatically as wind speed increases. Areas where winds are more constant and stronger, such as
high altitude sites and offshore regions, are better albeit more expensive locations for wind farms.
Wind energy has also been used by people since ancient times as a source of power to grind
grains and other materials. The earliest windmills were built in Persia in the 7th century. Solar power describes the conversion of solar energy into other forms of energy, such as heat
and electricity. Solar energy can be converted into electricity using photovoltaic (PV) devices or
solar power plants. Photovoltaic generates electricity directly from sunlight. Solar power plants can
also generate electricity indirectly using thermal collectors to focus the sun¶s rays to heat fluid at a
high temperature. The heated fluid then produces steam that is used to operate a turbine and
generate electricity. British astronomer John Herschel used a solar thermal collector box to cook
food during an expedition to Africa in the 1830s.

8/8/2019 Commodities 161110 SUTIAS
http://slidepdf.com/reader/full/commodities-161110-sutias 18/26
18
RENEWABLE ENERGY
16 November 2010SUTIAS
Geothermal energy is the energy derived from the hot interior of the earth. It is a renewableenergy because heat is continuously produced inside the earth by the slow decay of radioactive
particles. Water heated by the geothermal energy rises naturally to the surface via fissures in the
earth¶s crust at hot springs and geysers. Heated underground steam or water are tapped and
brought to the surface to operate steam turbines and generate electricity, a practise common in
Iceland.
Biomass energy is generated from non-fossilized materials derived from plants. The main
sources of biomass energy are wood and wood waste, followed by energy from municipal solidwaste (MSW) and alcohol fuels. Biomass in the form of organic waste can be converted through
gasification to produce a biogas (normally methane). The biogas is then burnt to produce energy.
When using biomass as a renewable source of energy it is absolutely necessary to consider the
durability of the source via land management practises.
China is the world¶s largest producer of energy using renewable resources. In 2007, about 820
megawatts of solar PV were produced in China, second only to Japan. Canada, the largest
producer of hydropower in the world, produces about 3.1 billion kilowatt hours of hydropower per year, followed by the United States. China is the world leader in total renewable energy
consumption, followed by the United States and Canada. However, the United States consumes the
most non-hydro renewable energy, consuming twice as much non-hydro renewable energy as
Germany and more than three times as much as Japan.

8/8/2019 Commodities 161110 SUTIAS
http://slidepdf.com/reader/full/commodities-161110-sutias 19/26
19
PRECIOUS METALS
16 November 2010SUTIAS
Gold held by central banks amounted to just over 29,800 tonnes as of the end of June 2008. The lion¶s share of these holdings is held by the United
States, Germany, France and Italy. These countries gold holdings are equivalent to
around two-thirds of total reserves, compared to a world average of just over 10%. In
contrast, gold to total reserve ratios are significantly lower in Asia and the Middle East
and in some circumstances below 3% of total reserves. The performance of the gold
price has been closely linked to the course of the US dollar and the level of real
interest rates in the United States.
Since 1905, South Africa had been the world¶s largest producer of gold.
However, last year China surpassed South African production by 16 tonnes. During
this decade South African production has suffered from declining ore grades, maturing
mines, power disruptions and labour unrest. Today China, South Africa, Australia and
the US account for approximately 40% of the world¶s annual gold mine production.
Global central banks remain a powerful community in terms of the world gold
market. Their combined holdings amounted to 29,813 tonnes as of June 2008. The
largest holder of reserves is the United States with 8,134 tonnes, equivalent to 78.2%
of total reserves. The average gold to total reserve ratio across all central banks is
10.8%. However, in Europe ratios are significantly higher with Greece holding the
highest gold to total reserve ratio at 89.9%.

8/8/2019 Commodities 161110 SUTIAS
http://slidepdf.com/reader/full/commodities-161110-sutias 20/26
20
PRECIOUS METALS
16 November 2010SUTIAS
Source: CPM Group
Figure 12: Precious metals production in 2007 Figure 13: Central bank gold reserves
Source: IMF, World Gold Council (data end June 2008)

8/8/2019 Commodities 161110 SUTIAS
http://slidepdf.com/reader/full/commodities-161110-sutias 21/26
21
PRECIOUS METALS
16 November 2010SUTIAS
Source:: CPM Group * Middle East includes Pakistan ** Asia excludes Japan and Thailand *** Africa excludes South Africa
World production data excludes secondary supply. World consumption excludes investment demand
Figure 14: The world¶s top 10 gold producers and consumers in 2007 by country and region

8/8/2019 Commodities 161110 SUTIAS
http://slidepdf.com/reader/full/commodities-161110-sutias 22/26
22
PRECIOUS METALS
16 November 2010SUTIAS
Figure 15: The world¶s top 10 gold producers and consumers in 2007 by country and region
Source: * Middle East includes Pakistan ** Asia excludes Japan and Thailand *** Africa excludes South Africa
World production data excludes secondary supply. World consumption excludes investment demand
8/8/2019 Commodities 161110 SUTIAS
http://slidepdf.com/reader/full/commodities-161110-sutias 23/26
23
INDUSTRIAL METALS
16 November 2010SUTIAS
Industrial metals are non-ferrous metals, meaning they do not contain anappreciable amount of iron. The industrial metals complex is comprised of
aluminium, copper, lead, nickel, tin and zinc. These six metals are traded on several
exchanges around the world. However, the benchmark contracts are listed on the
London Metal Exchange (LME). The LME was founded for in 1877 and much of the
business is still conducted through open outcry trading in the µRing.¶ Volume on the
LME is dominated by the aluminium, copper and zinc contracts, which combined
represent around 85% of all turnover on the exchange. The LME is a highly liquid market and in 2007 turnover reached a new record of 93
million lots, equivalent to USD9,500 billion. During this decade the LME have been
increasing the number of listed futures contracts for example polypropylene, low
density polyethylene and steel billets. Aluminium is the most actively traded metal on
global exchanges. The annual production of aluminium, which reached 38.1 million
tonnes in 2007, exceeds the output of all other industrial and precious metals
combined, with the exception of steel. One of the most important trends during this decade has been China¶s voracious
appetite for industrial raw materials, which has accelerated since the country joined the
World Trade Organisation in 2001. This has led the country¶s share of world
consumption of not only industrial metals, but all major raw materials to increase
substantially.
8/8/2019 Commodities 161110 SUTIAS
http://slidepdf.com/reader/full/commodities-161110-sutias 24/26
24
INDUSTRIAL METALS
16 November 2010SUTIAS
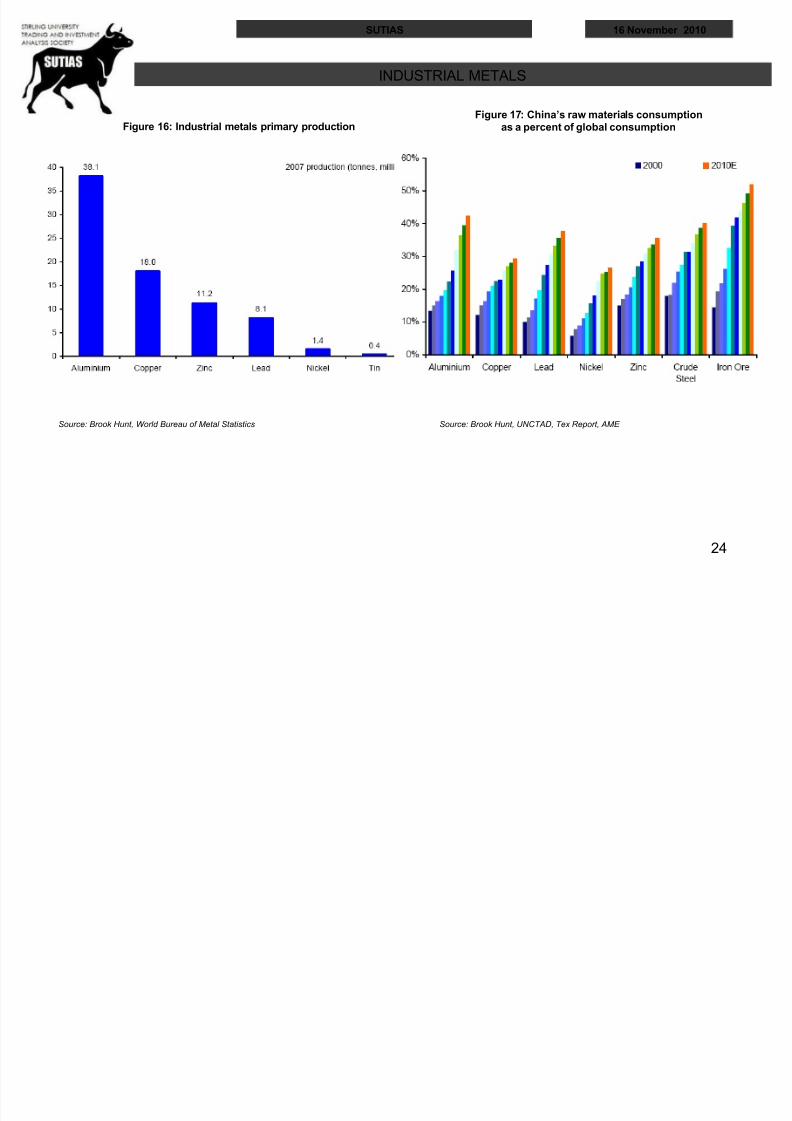
Source: Brook Hunt, World Bureau of Metal Statistics
Figure 16: Industrial metals primary productionFigure 17: China¶s raw materials consumption
as a percent of global consumption
Source: Brook Hunt, UNCTAD, Tex Report, AME

8/8/2019 Commodities 161110 SUTIAS
http://slidepdf.com/reader/full/commodities-161110-sutias 25/26
25
AGRICULTURE
16 November 2010SUTIAS
The United States and China are the world¶s superpowers when it comesto agricultural production. Their combined output of
corn, wheat, rice, soybeans and sugar is approximately double that of their
nearest rivals, India and the EU-27 countries. However, what distinguishes
these two countries apart is that while the US is a major exporter of
agricultural commodities, China has become increasingly dependent on
agricultural imports. For example, in 2007-08, the US accounted for 30%, 41% and 63% of world exports for corn, soybeans and wheat
respectively while China has became the world¶s largest importer of
cotton, palm oil, rubber and soybeans.
Of all the agricultural commodities, corn and wheat dominate in terms of
world production. However, global wheat production has declined over the
past two years in response to significant droughts in major wheat producing
countries, such as Australia. In contrast, global corn production has risen by
15% over the past two years following an increase in US corn plantings. This
has occurred to supply the US ethanol industry, which now consumes
approximately 25% of the annual US cornharvest compared to less than 5%
at the beginning of the decade.

8/8/2019 Commodities 161110 SUTIAS
http://slidepdf.com/reader/full/commodities-161110-sutias 26/26
26
AGRICULTURE
16 November 2010SUTIAS
Source: USDA
Figure 18: The world¶s top agricultural producersFigure 19: Total world production of a selection of
agricultural commodities
Source: USDA, World Cocoa Organization