community detection in large-scale networks: a survey … · wires comput stat...
TRANSCRIPT

Advanced Review
Community detectionin large-scale networks: a surveyand empirical evaluationSteve Harenberg, Gonzalo Bello, L. Gjeltema, Stephen Ranshous,Jitendra Harlalka, Ramona Seay, Kanchana Padmanabhan andNagiza Samatova∗
Community detection is a common problem in graph data analytics that consistsof finding groups of densely connected nodes with few connections to nodesoutside of the group. In particular, identifying communities in large-scale networksis an important task in many scientific domains. In this review, we evaluatedeight state-of-the-art and five traditional algorithms for overlapping and disjointcommunity detection on large-scale real-world networks with known ground-truthcommunities. These 13 algorithms were empirically compared using goodnessmetrics that measure the structural properties of the identified communities,as well as performance metrics that evaluate these communities against theground-truth. Our results show that these two types of metrics are not equivalent.That is, an algorithm may perform well in terms of goodness metrics, but poorlyin terms of performance metrics, or vice versa. © 2014 The Authors. WIREs ComputationalStatistics published by Wiley Periodicals, Inc.
How to cite this article:WIREs Comput Stat 2014, 6:426–439. doi: 10.1002/wics.1319
Keywords: clustering; community detection; empirical evaluation; graphs;ground-truth; networks
INTRODUCTION
Large-scale networks with thousands to millions ofnodes are ubiquitous across many different sci-
entific domains. Community structures in these net-works are often of particular interest. For example,communities represent modules of functionally associ-ated proteins in biological networks,1 customers withsimilar interests in customer preferences databases,2 or
∗Correspondence to: [email protected]
Department of Computer Science, North Carolina State University,Raleigh, NC, USA
Computer Science and Mathematics Division, Oak Ridge NationalLaboratory, Oak Ridge, TN, USA
Conflict of interest: The authors have declared no conflicts ofinterest for this article.
regions of homogeneous long-term climate variabilityin climate networks.3
Identifying communities in a network is a com-plex problem due to the existence of numerousdefinitions of community and the intractability ofmany community detection algorithms. Informally, acommunity is a densely connected group of nodesthat is sparsely connected to the rest of the network.As there are several structural definitions that sat-isfy this criterion, no formal definition of commu-nity is universally accepted.4 In addition, communi-ties can have various properties, often stemming fromthe domain at hand, such as hierarchical organization,overlapping nodes, or weighted edges. For all thesereasons, community detection has been approachedfrom many different perspectives and is one of the
426 Volume 6, November/December 2014© 2014 The Authors. WIREs Computational Statistics published by Wiley Periodicals, Inc.This is an open access article under the terms of the Creative Commons Attribution-NonCommercial License, which permits use, distribution and reproductionin any medium, provided the original work is properly cited and is not used for commercial purposes.

WIREs Computational Statistics Community detection in large-scale networks
most widely researched problems in graph data analyt-ics. In this article, we perform an extensive empiricalreview of state-of-the-art community detection algo-rithms, focusing on their performance in large-scalereal-world networks.
RELATED WORK
In recent years, several surveys in the area of com-munity detection have been published. Fortunato4
and Coscia et al.5 presented comprehensive reviews ofboth disjoint and overlapping community detectionalgorithms published up to 2009 and 2011, respec-tively. Fortunato classified these algorithms based ontheir methodological principles, whereas Coscia et al.classified them based on the definition of communityused. Crampes and Plantié6 proposed an alternativeclassification based on the type of input and outputdata. Malliaros and Vazirgiannis7 focused on commu-nity detection algorithms for directed graphs, and sug-gested a methodology-based taxonomy to classify thedifferent algorithmic approaches.
Furthermore, some existing surveys also offeran empirical evaluation of the algorithms consid-ered. Danon et al.8 and Lancichinetti and Fortunato9
evaluated several community detection algorithmson synthetic graphs, by computing the fraction ofcorrectly identified nodes and the Normalized MutualInformation (NMI), respectively. Orman et al.10
compared eight algorithms for disjoint commu-nity detection with respect to the performance metricsobtained and the topological properties of the commu-nities identified on a set of synthetic graphs. Xie et al.11
contrasted the performance of 14 state-of-the-art algo-rithms for overlapping community detection on bothsynthetic graphs and on real-world social networkswith no known ground-truth communities. Similarly,Leskovec et al.12 and Moradi et al.13 evaluated thestructural quality of the communities identified byvarious algorithms on real-world networks.
This review presents an overview of eightstate-of-the-art (published since 2010) algorithms forboth disjoint and overlapping community detection.We analyzed some of the top-performing algorithmsidentified in previous empirical studies, as well asmore recent algorithms that have not been includedin any survey. Five traditional community detectionalgorithms were also considered as benchmarks.Moreover, existing empirical comparisons of com-munity detection algorithms have focused mostly onsynthetic graphs or on real-world networks with noknown ground-truth communities. To the best ofour knowledge, this is the first review to present asystematic evaluation of state-of-the-art algorithms
for community detection on large-scale real-worldnetworks with known ground-truth communities.The algorithms were evaluated based not only on thestructural properties of the communities identified,but also on the accuracy of the results obtained withrespect to the ground-truth communities.
ALGORITHMS
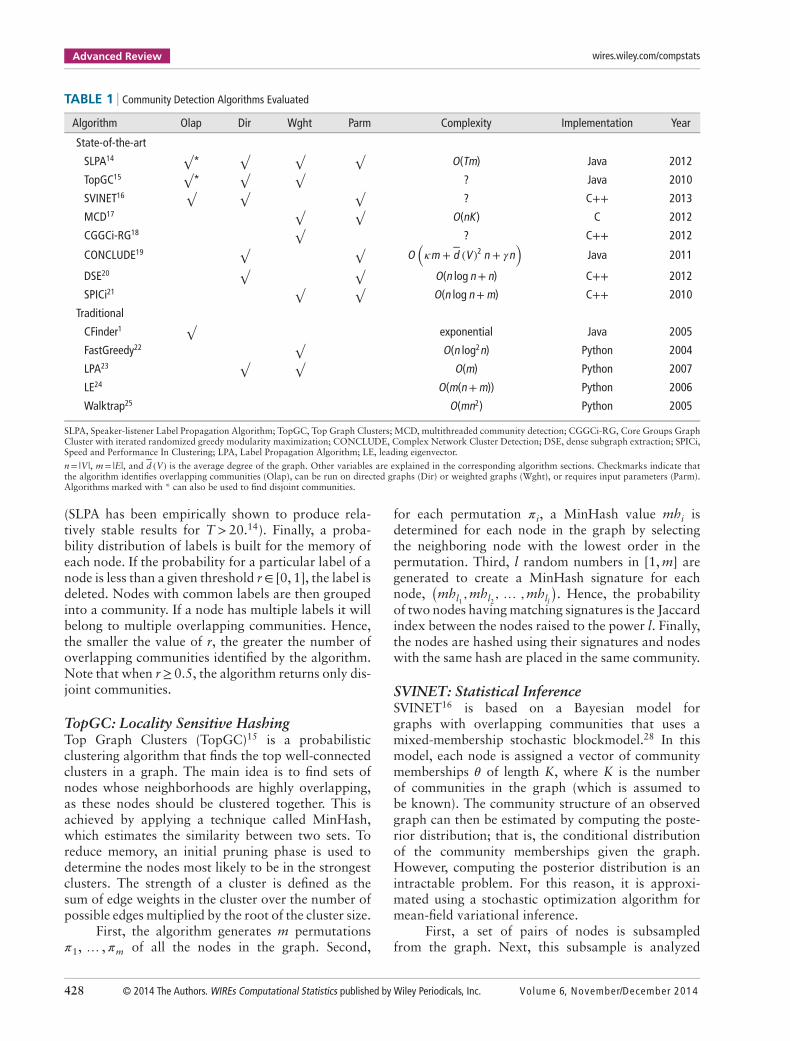
In this section, we describe eight state-of-the-art (pub-lished since 2010) algorithms for overlapping and/ordisjoint community detection. Two of the algorithms(TopGC and SLPA) can be used to detect both typesof communities. Six of the algorithms (CGGC, MCD,CONCLUDE, SVINET, SLPA, and TopGC) are non-deterministic. Moreover, some of the algorithms canbe applied to directed and/or weighted graphs. In addi-tion, several traditional methods (CFinder, Walktrap,FastGreedy, LPA, and LE) for community detectionare included as benchmarks. For an overview of thealgorithms, see Table 1.
Overlapping Community DetectionMany real-world networks contain overlapping com-munities; that is, each node can belong to multiplecommunities. One of the most widely used techniquesto find overlapping communities is the Clique Perco-lation Method (CPM).26 This technique finds all themaximal cliques in a graph, which requires exponen-tial time in the worst case,27 and then forms communi-ties by merging cliques with common nodes. We usedCFinder,1 an implementation of CPM, as the tradi-tional method for benchmark comparison.
SLPA: Label PropagationSpeaker-listener Label Propagation Algorithm(SLPA),14 later renamed to GANXiS, extends LabelPropagation Algorithm (LPA)23 to overlapping com-munity detection. SLPA identifies both disjoint andoverlapping communities by propagating labels rep-resenting community membership between nodes in agraph.
First, the memory of each node is initialized witha unique label. This means that initially each nodebelongs to a different community. Next, a node isselected as a listener. A label is propagated to thelistener from each of its neighbors (speakers). Eachlabel propagated is randomly selected with a proba-bility proportional to its frequency in the memory ofthe speaker that sends it. The listener then incorpo-rates the most common of the labels received into itsmemory. This label propagation process is repeatedfor a user-defined maximum number of iterations T
Volume 6, November/December 2014 © 2014 The Authors. WIREs Computational Statistics published by Wiley Periodicals, Inc. 427
Advanced Review wires.wiley.com/compstats
TABLE 1 Community Detection Algorithms Evaluated
Algorithm Olap Dir Wght Parm Complexity Implementation Year
State-of-the-art
SLPA14√
*√ √ √
O(Tm) Java 2012
TopGC15√
*√ √
? Java 2010
SVINET16√ √ √
? C++ 2013
MCD17√ √
O(nK) C 2012
CGGCi-RG18√
? C++ 2012
CONCLUDE19√ √
O(𝜅m + d (V )2 n + 𝛾n
)Java 2011
DSE20√ √
O(n log n+ n) C++ 2012
SPICi21√ √
O(n log n+m) C++ 2010
Traditional
CFinder1√
exponential Java 2005
FastGreedy22√
O(n log2n) Python 2004
LPA23√ √
O(m) Python 2007
LE24 O(m(n+m)) Python 2006
Walktrap25 O(mn2) Python 2005
SLPA, Speaker-listener Label Propagation Algorithm; TopGC, Top Graph Clusters; MCD, multithreaded community detection; CGGCi-RG, Core Groups GraphCluster with iterated randomized greedy modularity maximization; CONCLUDE, Complex Network Cluster Detection; DSE, dense subgraph extraction; SPICi,Speed and Performance In Clustering; LPA, Label Propagation Algorithm; LE, leading eigenvector.
n= |V|, m= |E|, and d (V) is the average degree of the graph. Other variables are explained in the corresponding algorithm sections. Checkmarks indicate thatthe algorithm identifies overlapping communities (Olap), can be run on directed graphs (Dir) or weighted graphs (Wght), or requires input parameters (Parm).Algorithms marked with * can also be used to find disjoint communities.
(SLPA has been empirically shown to produce rela-tively stable results for T >20.14). Finally, a proba-bility distribution of labels is built for the memory ofeach node. If the probability for a particular label of anode is less than a given threshold r∈ [0, 1], the label isdeleted. Nodes with common labels are then groupedinto a community. If a node has multiple labels it willbelong to multiple overlapping communities. Hence,the smaller the value of r, the greater the number ofoverlapping communities identified by the algorithm.Note that when r≥ 0.5, the algorithm returns only dis-joint communities.
TopGC: Locality Sensitive HashingTop Graph Clusters (TopGC)15 is a probabilisticclustering algorithm that finds the top well-connectedclusters in a graph. The main idea is to find sets ofnodes whose neighborhoods are highly overlapping,as these nodes should be clustered together. This isachieved by applying a technique called MinHash,which estimates the similarity between two sets. Toreduce memory, an initial pruning phase is used todetermine the nodes most likely to be in the strongestclusters. The strength of a cluster is defined as thesum of edge weights in the cluster over the number ofpossible edges multiplied by the root of the cluster size.
First, the algorithm generates m permutations𝜋1, … ,𝜋m of all the nodes in the graph. Second,
for each permutation 𝜋i, a MinHash value mhi isdetermined for each node in the graph by selectingthe neighboring node with the lowest order in thepermutation. Third, l random numbers in [1, m] aregenerated to create a MinHash signature for eachnode,
(mhl1
,mhl2, … ,mhll
). Hence, the probability
of two nodes having matching signatures is the Jaccardindex between the nodes raised to the power l. Finally,the nodes are hashed using their signatures and nodeswith the same hash are placed in the same community.
SVINET: Statistical InferenceSVINET16 is based on a Bayesian model forgraphs with overlapping communities that uses amixed-membership stochastic blockmodel.28 In thismodel, each node is assigned a vector of communitymemberships 𝜃 of length K, where K is the numberof communities in the graph (which is assumed tobe known). The community structure of an observedgraph can then be estimated by computing the poste-rior distribution; that is, the conditional distributionof the community memberships given the graph.However, computing the posterior distribution is anintractable problem. For this reason, it is approxi-mated using a stochastic optimization algorithm formean-field variational inference.
First, a set of pairs of nodes is subsampledfrom the graph. Next, this subsample is analyzed
428 © 2014 The Authors. WIREs Computational Statistics published by Wiley Periodicals, Inc. Volume 6, November/December 2014

WIREs Computational Statistics Community detection in large-scale networks
and the community structure of the graph is updatedaccordingly. This subsampling procedure is repeatedfor a given number of iterations. Hence, SVINETanalyzes a subgraph of the graph at each iteration.
Disjoint Community DetectionThe majority of algorithms for community detectionfind disjoint communities; that is, each node belongsto at most one community. In general, communitydetection in literature refers to disjoint communitiesunless explicitly stated otherwise.
Graph partitioning methods divide the graphinto two partitions (i.e., communities), which maythen be further partitioned. One of the limitations ofgraph partitioning methods is that they usually requirethe user to specify the number of partitions, whichmay not be known in advance. One solution proposedto this problem is to use a goodness metric (e.g., mod-ularity) to evaluate the partition of the graph at eachstep. However, this is computationally expensive andcan be infeasible for large graphs. Several heuris-tics have been proposed to partition the graph. Forinstance, the traditional algorithm Walktrap25 usesrandom walks based on the intuition that a randomwalk will likely get trapped in densely connectedregions of the graph corresponding to communities.
Other traditional methods use a bottom-upapproach, starting with individual nodes andcombining them. Some of these methods, such asFastGreedy,22 are based on maximizing an objectivefunction (e.g., modularity). Others, such as LPA,23
are based on communication theory.Another category of traditional methods use
spectral clustering to identify communities; forexample, by calculating the leading eigenvector (LE)24
of the modularity matrix of the graph.
MCD: Modularity MaximizationThe multithreaded community detection (MCD) algo-rithm in Ref 17 creates a set of disjoint partitions of theinput graph. Like other agglomerative clustering algo-rithms, this method starts with each node as a separatecommunity and merges communities until some objec-tive function (such as modularity or negative conduc-tance) achieves a local maximum. For our evaluation,we used modularity as the objective function.
To cluster the graph, this algorithm maintainsa community graph, where each community is repre-sented by a single node and the edges are weightedwith the number of collapsed edges. Using thiscommunity graph, at each iteration, the algorithmcomputes the change in the optimization metric aftermerging two adjacent communities, greedily selects
pairs of communities to merge, and contracts the com-munity graph based on these mergers. In all itera-tions, there are at most K contraction phases, whichis bounded by |V|, but is often much less.
CGGC: Ensemble-Based ModularityMaximizationCore Groups Graph Cluster (CGGC)18 is an ensem-ble learning method for clustering graph data. Thisensemble method combines several different cluster-ings to help decide about the final partitioning of thenode set into clusters; if all the clusterings agree that apair of nodes belong together in a cluster, it is probablytrue, otherwise, a second look should be taken.
The general strategy is to run clustering algo-rithms k times to generate k different partitions of thenodes. From these k partitions, a maximum overlappartition P̂ is created where nodes that are part of thesame clusters in all of the k clusterings are in the samepartition of P̂. A graph is built using the partitionsfrom P̂ as nodes and a final clustering step is performedon this smaller graph to find the final partitioning.An improvement to this method is made by perform-ing the k-partitioning iteratively until a ‘best’ initialpartitioning is achieved. Although a combination ofseveral different clustering techniques can be used inthe initial k-partitioning phase of the algorithm, theauthors use only one clustering technique (run k times)and compare label propagation and a randomizedgreedy modularity maximization as their clusteringtechniques. For our evaluation, we used CGGC withiterated randomized greedy modularity maximization(CGGCi-RG), which was shown to perform best.18
CONCLUDE: Random Walks and ModularityMaximizationThe Complex Network Cluster Detection (CON-CLUDE) algorithm19 aims to combine the accuracy ofglobal methods with the efficiency of local methods.This is done by incorporating knowledge about thetopology of the entire graph to heuristic algorithmsfor community detection.
First, the 𝜅-path edge centrality of each edge inthe graph is computed using the Edge Random Walk𝜅-path Centrality (ERW-Kpath) algorithm.19 𝜅-pathedge centrality is a measure of the importance of anedge in the connectivity of the graph. ERW-Kpath is aheuristic algorithm that approximates the 𝜅-path edgecentrality of an edge by calculating the probabilityof the edge belonging to a random non-backtrackingwalk of finite length 𝜅. Next, we use the 𝜅-pathedge centrality values estimated to compute the dis-tances between all pairs of connected nodes in thegraph. Finally, the distances computed are assigned
Volume 6, November/December 2014 © 2014 The Authors. WIREs Computational Statistics published by Wiley Periodicals, Inc. 429

Advanced Review wires.wiley.com/compstats
as edge weights and the resulting weighted graph ispartitioned using the Louvain Method.29 The LouvainMethod is a widely used greedy algorithm for commu-nity detection by network modularity maximizationthat converges in 𝛾 iterations.
DSE: Matrix Blocking via Cosine SimilarityThe method for dense subgraph extraction (DSE) inRef 20 is inspired by matrix blocking. Matrix blockingis the process of reordering the rows and columnssuch that a critical mass of the nonzero elementsare along or near the diagonal. The blocks alongthe diagonal correspond to dense subgraphs. Throughan adaptation of the method presented in Ref 30, ahierarchical clustering algorithm for extracting densesubgraphs is created. This approach requires onlythe minimum density of the subgraphs and yields anincomplete clustering, meaning that not every node inthe graph needs to be part of a community.
Given a sparse graph G, a matrix M is created,where Mij is the cosine similarity between columns iand j in the adjacency matrix of G. A tree T, whichrepresents the partitioning of the nodes, is constructedin a bottom-up fashion by iterating over the nonzeroentries in M in descending order, each time joining twosubtrees if they are not already connected. The densesubgraphs can be extracted by a simple tree traversal,outputting the subtrees rooted at internal nodes withdensities greater than the threshold value.
SPICi: Support MaximizationSpeed and Performance In Clustering (SPICi)21 is agreedy heuristic algorithm that produces an incom-plete clustering and is designed to work on large bio-logical networks. It begins by identifying a seed pairof nodes, which will be the node u with the maxi-mum weighted degree (dw(u)=
∑v : (u,v)∈Ewu,v) and its
neighbor with the highest weighted degree. The pro-cedure for growing the current cluster S is similar toDPClus.31 At each iteration, the node with the high-est support (support(u, S)=
∑v∈ Swu,v) for the current
cluster is chosen to be added if the density wouldremain above the user-defined threshold. Otherwise,the cluster is reported and its nodes and incident edgesare removed from the graph.
EVALUATION METHODOLOGY
In this section, we describe the methodology used toevaluate the community detection algorithms. Eachalgorithm was applied to several graph datasets toobtain goodness and performance metrics. Goodnessmetrics quantitatively measure structural properties ofthe identified communities, whereas the performance
metrics quantitatively compare these communitiesagainst the ground-truth communities. These metricswere analyzed and compared in R 3.0.2. The nondeter-ministic algorithms were run 10 times on each graph.All experiments were performed on a dedicated Intelserver consisting of two hex-core E5645 processorsand 64 GB DDR2 RAM. The data was stored on a2TB RAID1 partition and the operating system wasinstalled on a 120.5 GB SSD.
DatasetsFor our experiments, we used real-world networkswith overlapping ground-truth communities fromthe Stanford Large Network Dataset Collection(SNAP).31 Five undirected, unweighted networksfrom three different domains were considered:
• Co-product purchasing network (Amazon):Nodes represent products. Adjacent nodes rep-resent products that are frequently copurchased.Ground-truth communities are defined by thehierarchy of product categories.
• Co-publishing network (DBLP): Nodes representauthors. Adjacent nodes represent authors withat least one shared publication. Ground-truthcommunities are defined as sets of authors whopublished in the same journal or conference.
• Social networks (LiveJournal, Orkut, Youtube):Nodes represent users and edges represent friend-ship between two users. Ground-truth com-munities are defined by node membership inuser-created groups.
Only the top 5000 ground-truth communitiesfrom each network (determined by Ref 32) were usedfor evaluation, as goodness metrics have been shownto degrade quickly after roughly the top 5000. Inaddition, many of these top communities had lowinternal densities, contradicting the intuitive defini-tion of a community. Therefore, we ranked the top5000 ground-truth communities based on internaldensity and removed the bottom quartile. Duplicatecommunities were also eliminated. Finally, all thenodes (and incident edges) that did not belong toany of the remaining communities were removed fromthe networks. The resulting graphs and ground-truthcommunities were used to test the algorithms for over-lapping community detection.
In addition, five more graphs with disjointground-truth communities were derived from thereal-world networks in order to test the algorithmsfor disjoint communities. To obtain these graphs, themaximum independent set of disjoint ground-truth
430 © 2014 The Authors. WIREs Computational Statistics published by Wiley Periodicals, Inc. Volume 6, November/December 2014
WIREs Computational Statistics Community detection in large-scale networks
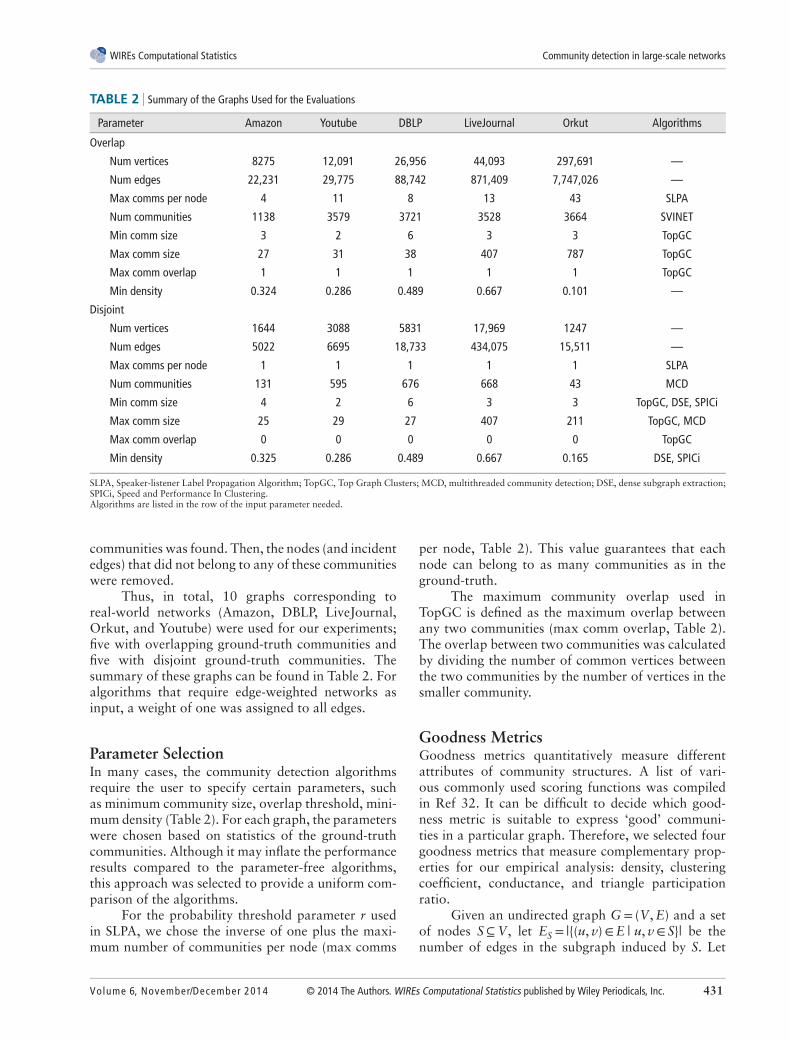
TABLE 2 Summary of the Graphs Used for the Evaluations
Parameter Amazon Youtube DBLP LiveJournal Orkut Algorithms
Overlap
Num vertices 8275 12,091 26,956 44,093 297,691 —
Num edges 22,231 29,775 88,742 871,409 7,747,026 —
Max comms per node 4 11 8 13 43 SLPA
Num communities 1138 3579 3721 3528 3664 SVINET
Min comm size 3 2 6 3 3 TopGC
Max comm size 27 31 38 407 787 TopGC
Max comm overlap 1 1 1 1 1 TopGC
Min density 0.324 0.286 0.489 0.667 0.101 —
Disjoint
Num vertices 1644 3088 5831 17,969 1247 —
Num edges 5022 6695 18,733 434,075 15,511 —
Max comms per node 1 1 1 1 1 SLPA
Num communities 131 595 676 668 43 MCD
Min comm size 4 2 6 3 3 TopGC, DSE, SPICi
Max comm size 25 29 27 407 211 TopGC, MCD
Max comm overlap 0 0 0 0 0 TopGC
Min density 0.325 0.286 0.489 0.667 0.165 DSE, SPICi
SLPA, Speaker-listener Label Propagation Algorithm; TopGC, Top Graph Clusters; MCD, multithreaded community detection; DSE, dense subgraph extraction;SPICi, Speed and Performance In Clustering.Algorithms are listed in the row of the input parameter needed.
communities was found. Then, the nodes (and incidentedges) that did not belong to any of these communitieswere removed.
Thus, in total, 10 graphs corresponding toreal-world networks (Amazon, DBLP, LiveJournal,Orkut, and Youtube) were used for our experiments;five with overlapping ground-truth communities andfive with disjoint ground-truth communities. Thesummary of these graphs can be found in Table 2. Foralgorithms that require edge-weighted networks asinput, a weight of one was assigned to all edges.
Parameter SelectionIn many cases, the community detection algorithmsrequire the user to specify certain parameters, suchas minimum community size, overlap threshold, mini-mum density (Table 2). For each graph, the parameterswere chosen based on statistics of the ground-truthcommunities. Although it may inflate the performanceresults compared to the parameter-free algorithms,this approach was selected to provide a uniform com-parison of the algorithms.
For the probability threshold parameter r usedin SLPA, we chose the inverse of one plus the maxi-mum number of communities per node (max comms
per node, Table 2). This value guarantees that eachnode can belong to as many communities as in theground-truth.
The maximum community overlap used inTopGC is defined as the maximum overlap betweenany two communities (max comm overlap, Table 2).The overlap between two communities was calculatedby dividing the number of common vertices betweenthe two communities by the number of vertices in thesmaller community.
Goodness MetricsGoodness metrics quantitatively measure differentattributes of community structures. A list of vari-ous commonly used scoring functions was compiledin Ref 32. It can be difficult to decide which good-ness metric is suitable to express ‘good’ communi-ties in a particular graph. Therefore, we selected fourgoodness metrics that measure complementary prop-erties for our empirical analysis: density, clusteringcoefficient, conductance, and triangle participationratio.
Given an undirected graph G= (V, E) and a setof nodes S⊆V, let ES = |{(u, v)∈E | u, v∈ S}| be thenumber of edges in the subgraph induced by S. Let
Volume 6, November/December 2014 © 2014 The Authors. WIREs Computational Statistics published by Wiley Periodicals, Inc. 431
Advanced Review wires.wiley.com/compstats
0.0
0.2
0.4
0.6
0.8
1.0
AmazonD
ensi
tyYoutube DBLP LiveJournal Orkut
0.0
0.2
0.4
0.6
0.8
1.0
Clu
ster
ing
coef
ficie
nt
0.0
0.2
0.4
0.6
0.8
1.0
TP
R
SLP
A
Top
GC
SV
INE
T
CF
inde
r
grou
nd−
trut
h
0.0
0.2
0.4
0.6
0.8
1.0
Con
duct
ance
SLP
A
Top
GC
SV
INE
T
CF
inde
r
grou
nd−
trut
h
SLP
A
Top
GC
SV
INE
T
CF
inde
r
grou
nd−
trut
h
SLP
A
Top
GC
SV
INE
T
CF
inde
r
grou
nd−
trut
h
SLP
A
Top
GC
SV
INE
T
CF
inde
r
grou
nd−
trut
h
TraditionalalgorithmGround−truth
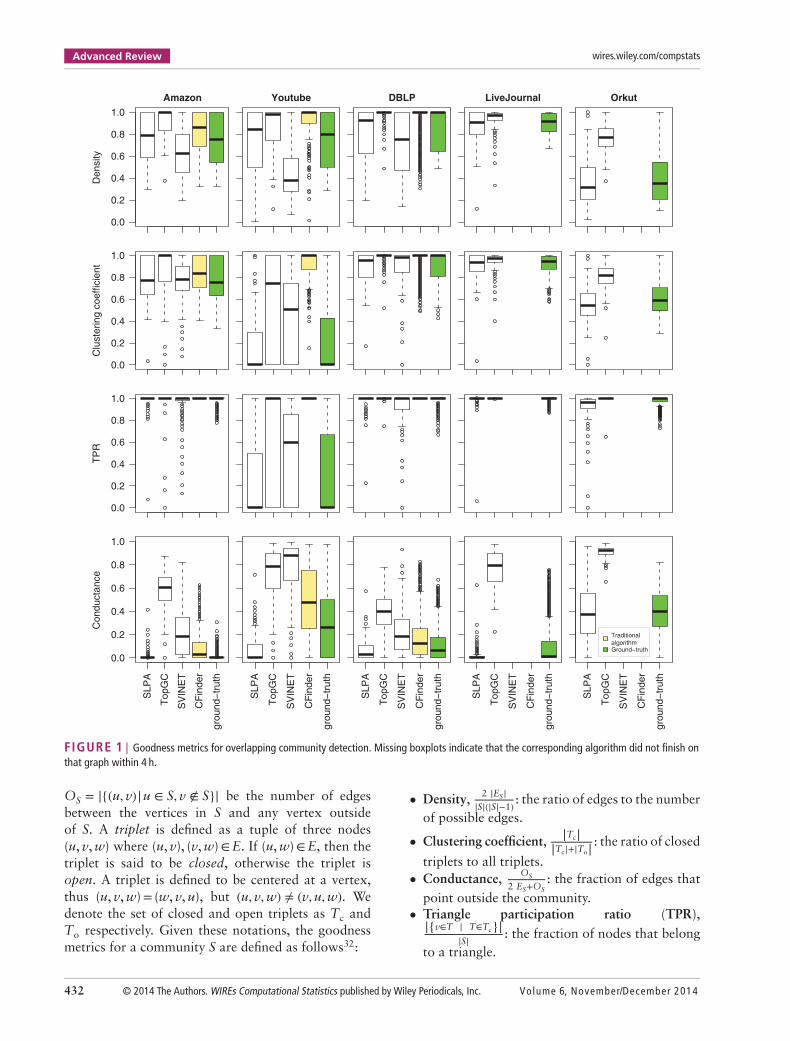
FIGURE 1 | Goodness metrics for overlapping community detection. Missing boxplots indicate that the corresponding algorithm did not finish onthat graph within 4 h.
OS = |{(u, v)|u ∈ S, v ∉ S}| be the number of edgesbetween the vertices in S and any vertex outsideof S. A triplet is defined as a tuple of three nodes(u, v, w) where (u, v), (v, w)∈E. If (u, w)∈E, then thetriplet is said to be closed, otherwise the triplet isopen. A triplet is defined to be centered at a vertex,thus (u, v, w)= (w, v, u), but (u, v,w) ≠ (v,u,w). Wedenote the set of closed and open triplets as Tc andTo respectively. Given these notations, the goodnessmetrics for a community S are defined as follows32:
• Density, 2 |ES||S|(|S|−1): the ratio of edges to the number
of possible edges.
• Clustering coefficient, |Tc||Tc|+|To| : the ratio of closed
triplets to all triplets.• Conductance, OS
2 ES+OS: the fraction of edges that
point outside the community.• Triangle participation ratio (TPR),|{v∈T | T∈Tc}|
|S| : the fraction of nodes that belongto a triangle.
432 © 2014 The Authors. WIREs Computational Statistics published by Wiley Periodicals, Inc. Volume 6, November/December 2014

WIREs Computational Statistics Community detection in large-scale networks
0.0
0.2
0.4
0.6
0.8
1.0Amazon
Den
sity
Youtube DBLP LiveJournal Orkut
0.0
0.2
0.4
0.6
0.8
1.0
Clu
ster
ing
coef
ficie
nt
0.0
0.2
0.4
0.6
0.8
1.0
TP
R
SLP
AT
opG
CM
CD
CG
GC
i−R
GC
ON
CLU
DE
DS
ES
PIC
iF
astG
reed
yLP
A LEW
alkt
rap
grou
nd−
trut
h
0.0
0.2
0.4
0.6
0.8
1.0
Con
duct
ance
SLP
AT
opG
CM
CD
CG
GC
i−R
GC
ON
CLU
DE
DS
ES
PIC
iF
astG
reed
yLP
A LEW
alkt
rap
grou
nd−
trut
h
SLP
AT
opG
CM
CD
CG
GC
i−R
GC
ON
CLU
DE
DS
ES
PIC
iF
astG
reed
yLP
A LEW
alkt
rap
grou
nd−
trut
h
SLP
AT
opG
CM
CD
CG
GC
i−R
GC
ON
CLU
DE
DS
ES
PIC
iF
astG
reed
yLP
A LEW
alkt
rap
grou
nd−
trut
h
SLP
AT
opG
CM
CD
CG
GC
i−R
GC
ON
CLU
DE
DS
ES
PIC
iF
astG
reed
yLP
A LEW
alkt
rap
grou
nd−
trut
h
FIGURE 2 | Goodness metrics for disjoint community detection. Missing boxplots indicate that the corresponding algorithm did not finish on thatgraph within 4 h.
Performance MetricsPerformance metrics are another way to measure thequality of the output by comparing identified commu-nities against the ground-truth communities. For everypair of nodes, we checked whether they belong to thesame community. A pair of nodes is misclassified if(1) they were assigned to different communities butbelong to the same ground-truth community (falsenegative) or if (2) they were assigned to the samecommunity but belong to different ground-truth com-munities (false positive). Using the true/false positives/negatives, we obtained several statistical measures:precision (P), recall (R), F-measure (F), specificity (S),accuracy (A),33 and NMI,34 which measures the sim-ilarity between the set of ground-truth communitiesand the set of communities output by an algorithm.
RESULTS AND DISCUSSION
In this section, we present the results obtained with thecommunity detection algorithms evaluated in terms ofgoodness metrics, performance metrics, output sim-ilarity, and run-time. To obtain these values, the
deterministic algorithms were run once and the non-deterministic algorithms were run 10 times. For thenondeterministic algorithms, the values per goodnessmetric in an ‘average’ run, shown in the boxplots, werecomputed as follows: for each percentile, the mean ofthe 10 runs was calculated; the resulting 100 pointswere used as an approximation of an ‘average’ distri-bution of the goodness metric.
Goodness Metrics ResultsThe algorithms were evaluated on a per-goodness-metric basis. The results for the overlappingand disjoint community detection algorithms can befound in Figures 1 and 2 respectively. The goodnessmetrics selected for evaluation are bounded by 0 and1. A high value of density, clustering coefficient, orTPR indicates ‘good’ communities, as does a lowvalue of conductance.
Analysis of Ground-Truth CommunitiesAn analysis of the overlapping and disjointground-truth communities revealed that theLiveJournal, Orkut, and Youtube networks do not
Volume 6, November/December 2014 © 2014 The Authors. WIREs Computational Statistics published by Wiley Periodicals, Inc. 433

Advanced Review wires.wiley.com/compstats
have similar values for the majority of the goodnessmetrics, despite all being social networks. LiveJournalcommunities have low median scores for conductanceand high scores for density, clustering coefficient, andTPR, whereas Orkut communities have a wider rangeand lower scores for density and clustering coefficient.On the other hand, Youtube communities exhibit thewidest range of values for all the goodness metricsexcept for density.
The ground-truth communities of the Youtubenetwork have unexpected values for most of thegoodness metrics. Three quarters of the Youtube over-lapping and disjoint ground-truth communities havelow clustering coefficients and low TPRs. The medianclustering coefficient (0 for overlapping and 0.214 fordisjoint) and the median TPR (0 for overlapping and0.429 for disjoint) are considerably lower than in theother networks. For the disjoint graphs, Youtube’scommunities also have a higher median conductance(0.2) than the communities of the other networks(0 for each). This means that most of the Youtubecommunities do not exhibit the expected structuralproperties of ‘good’ communities; that is, there aremany edges within these communities (indicated bythe high density), but there are not many triangles(indicated by the low TPR and the low clusteringcoefficient). Owing to these particular structuralproperties, all the community detection algorithmsevaluated yielded a low precision (and thus a lowF-measure) on the Youtube network.
Analysis of AlgorithmsFor each graph, the algorithms were ranked basedon the median values of the goodness metrics ofthe communities found. In cases where the medianswere similar, the interquartile ranges were compared,followed by inspection of the ranges. Note that thecomparison of the overlapping algorithms for theLiveJournal and Orkut networks may be affected bythe fact that only two of these algorithms ran withinthe allotted time frame.
The overall top and bottom ranked algorithmsare shown in Table 5. No full ranking is provided,because some instances had no clear distinctionbetween the rankings of the algorithms. For instance,all the overlapping and disjoint community detectionalgorithms identified communities with generally highTPR (median very close to 1 and small interquartilerange of 0.106), except in the case of the Youtubenetwork.
Among all the algorithms, TopGC identified thebest overlapping and disjoint communities in termsof density and clustering coefficient. TopGC achievesthis high performance because it aims to find only the
best communities as determined by a scoring functionproportional to density, rather than all communitiesin the graph. However, the communities identifiedby TopGC also had the worst conductance. Thisdemonstrates that an algorithm optimizing for a singlegoodness metric may not capture all desired structuralproperties of a community.
On the other hand, SLPA found the communitieswith the lowest conductance of all the overlappingalgorithms. SLPA achieved a low conductance,because it naturally forms communities with fewoutgoing edges: sets of nodes with few outgoing edgesare likely to propagate the same labels between themand hence will frequently be placed into the samecommunity.
Performance Metrics ResultsThe performance metrics for each algorithm werecalculated using the ground-truth communities. Thesemetrics can be found in Tables 3 and 4. The algorithmswere ranked on a per-performance-metric basis usingthe median values as described in the previous section.The overall top and bottom ranked algorithms areshown in Table 5. Note that due to a high numberof true negatives, the specificity and accuracy of allthe overlapping and disjoint community detectionalgorithms were near perfect (almost 1) on mostgraphs. Therefore, these two performance metrics didnot provide any discriminatory information and werenot included in our analysis.
In most cases, TopGC yielded considerablyworse values of recall, F-measure, and NMI than allthe other overlapping and disjoint community detec-tion algorithms. TopGC only identifies the top com-munities in the graph as determined by its scoringfunction. Therefore, many nodes are not placed inany community, resulting in a very large number offalse negatives (and thus in a very low recall andF-measure). On the other hand, the number of falsepositives is likely to be low, which explains the highprecision of the algorithm.
For overlapping communities, SLPA achievedthe best recall, F-measure, and NMI on all graphs.SLPA has been previously identified as one of the bestperforming algorithms on overlapping networks.11
For disjoint communities, SLPA also produced verygood results in terms of recall, F-measure, and NMIon all graphs except Youtube.
Similarity MeasureTo further compare the community detection algo-rithms, the pairwise similarity between the output ofthe algorithms (i.e., the identified communities) was
434 © 2014 The Authors. WIREs Computational Statistics published by Wiley Periodicals, Inc. Volume 6, November/December 2014

WIREs Computational Statistics Community detection in large-scale networks
TABLE 3 Performance Metrics for Overlapping Community Detection
Metric SLPA TopGC SVINET CFinder
Amazon
Recall .938 [.932; .944] .134 [.115; .141] .640 [.617; .747] .727
Precision .996 [.992; .999] .999 [.996; 1 ] .789 [.492; .837] 1
F-measure .966 [.962; .969] .236 [.207; .248] .719 [.547; .757] .842
NMI .826 [.823; .827] .208 [.170; .246] .634 [.378; .680] .649
Youtube
Recall .917 [.915; .926] .076 [.057; .094] .438 [.431; .449] .293
Precision .006 [.005; .007] .381 [.255; .570] .167 [.142; .187] .011
F-measure .012 [.009; .014] .126 [.103; .144] .242 [.214; .263] .022
NMI .449 [.425; .465] .067 [.050; .080] .100 [.063; .163] .068
DBLP
Recall .925 [.922; .927] .131 [.126; .136] .782 [.773; .875] .805
Precision .840 [.831; .853] .975 [.944; .984] .665 [.491; .721] .925
F-measure .881 [.875; .888] .231 [.224; .237] .742 [.601; .748] .861
NMI .820 [.818; .828] .214 [.165; .245] .701 [.512; .719] .843
LiveJournal
Recall .974 [.972; .977] .166 [.159; .182] NA NA
Precision .933 [.923; .936] .961 [.957; .970] NA NA
F-measure .953 [.947; .956] .283 [.273; .307] NA NA
NMI .593 [.592; .595] .110 [.095; .132] NA NA
Orkut
Recall .743 [.732; .753] .003 [.003; .003] NA NA
Precision .483 [.465; .557] .868 [.865; .874] NA NA
F-measure .587 [.572; .634] .005 [.005; .005] NA NA
NMI .491 [.481; .496] 0 [ 0 ; 0 ] NA NA
SLPA, Speaker-listener Label Propagation Algorithm; TopGC, Top Graph Clusters; NMI, Normalized Mutual Information.Results displayed as median [range] over 10 runs where applicable.
computed. Moreover, the similarity between the out-put of each algorithm and the ground-truth communi-ties was also determined.
The similarity between the output of two com-munity detection algorithms A and B is given byRef 7:
S (A,B) = 1n
∑v∈V
||CA (v) ∩ CB (v)||||CA (v) ∪ CB (v)|| (1)
where Ci(v) is the set of nodes that belong to the samecommunity as v in the output of algorithm i.
The similarity matrices for the overlapping anddisjoint community detection algorithms are shownin Figure 3. Some of the similarities obtained are rela-tively consistent across different graphs (e.g., Amazonand Orkut). However, for the Youtube graph, all thecommunity detection algorithms have very differ-ent outputs and none of them is very similar to theground-truth communities. This is likely due to the
unconventional structure of the communities of thisgraph.
In most cases, the outputs of TopGC and SPICiwere considerably different from the output of theother algorithms and from the ground-truth commu-nities. This can be partly explained by the fact thatboth algorithms produce incomplete clusterings of thegraph, whereas the ground-truth communities are acomplete clustering. In addition, TopGC aims to iden-tify only the most densely connected communities inthe graph. For this reason, it usually finds fewer orsmaller communities than the other algorithms andthan the ground-truth.
Furthermore, among the overlapping algo-rithms, the communities identified by SLPA were themost similar to the ground-truth communities forall graphs. This agrees with the performance metricsobtained in our evaluation and with the conclusion ofother community detection empirical surveys.11
Volume 6, November/December 2014 © 2014 The Authors. WIREs Computational Statistics published by Wiley Periodicals, Inc. 435

Advanced Review wires.wiley.com/compstats
TABLE 4 Performance Metrics for Disjoint Community Detection
Metric SLPA TopGC MCD CGGCi-RG CONCLUDE DSE SPICi FastGreedy LPA LE Walktrap
Amazon
R .904 [.889; .923] .061 [.055; .067] .990 [.985; .995] 1 [ 1 ; 1 ] .791 [.771; .816] 1 .639 1 .866 1 1
P 1 [.995; 1] 1 [.995; 1 ] .956 [.955; .969] .956 [.956; .956] 1 [.999; 1 ] .974 .999 .956 1 .956 .956
F .950 [.941; .960] .114 [.105; .126] .973 [.970; .982] .978 [.978; .978] .883 [.871; .898] .987 .779 .978 .928 .978 .978
NMI .939 [.932; .948] .079 [.063; .093] .957 [.956; .961] .960 [.960; .960] .861 [.853; .874] .970 .774 .960 .915 .960 .960
Youtube
R .875 [.850; .890] .035 [.025; .045] .709 [.700; .714] .926 [.920; .932] .779 [.763; .794] .373 .436 .911 .908 .787 .817
P .031 [.024; .041] .680 [.536; .765] .501 [.491; .514] .058 [.049; .063] .433 [.227; .480] .756 .564 .041 .014 .008 .040
F .060 [.047; .079] .066 [.048; .085] .587 [.577; .596] .109 [.094; .117] .555 [.352; .594] .499 .492 .078 .028 .016 .077
NMI .565 [.548; .579] .043 [.031; .052] .592 [.578; .602] .290 [.287; .298] .678 [.651; .695] .286 .510 .354 .538 .261 .663
DBLP
R .912 [.901; .919] .070 [.063; .075] .879 [.877; .884] 1 [.999; 1 ] .855 [.845; .871] .949 .556 1 .884 .998 .997
P .954 [.942; .966] .997 [.987; 1 ] .847 [.844; .851] .469 [.469; .470] .985 [.975; .994] .948 .972 .461 .972 .459 .284
F .932 [.922; .942] .131 [.118; .140] .863 [.862; .867] .639 [.639; .639] .918 [.910; .924] .948 .707 .631 .926 .629 .442
NMI .932 [.925; .939] .073 [.066; .082] .856 [.852; .863] .638 [.638; .638] .911 [.902; .917] .942 .567 .635 .918 .641 .635
LiveJournal
R .983 [.980; .985] .079 [.062; .098] .576 [.575; .578] .994 [.994; .994] NA .974 .871 .995 .985 .993 .977
P .986 [.983; .989] .997 [.991; .998] .859 [.852; .864] .728 [.727; .729] NA .981 .994 .644 .967 .088 .988
F .984 [.984; .986] .147 [.116; .179] .690 [.687; .692] .841 [.839; .841] NA .978 .928 .782 .976 .162 .983
NMI .979 [.977; .980] .109 [.100; .116] .797 [.793; .802] .779 [.776; .779] NA .974 .923 .750 .975 .668 .974
Orkut
R .989 [.988; .994] .013 [.012; .014] .997 [.994; .999] .999 [.999; .999] .970 [.798; .993] .990 .414 .999 .997 .997 .977
P .996 [.996; .996] .997 [.993; 1 ] .996 [.979; .996] .888 [.888; .888] .996 [.996; .997] .804 .997 .996 .996 .992 .996
F .992 [.992; .995] .026 [.023; .028] .997 [.986; .997] .940 [.940; .940] .983 [.886; .995] .887 .585 .997 .996 .995 .986
NMI .975 [.969; .982] .073 [.068; .085] .984 [.907; .987] .903 [.903; .903] .942 [.899; .977] .894 .615 .987 .981 .984 .956
SLPA, Speaker-listener Label Propagation Algorithm; TopGC, Top Graph Clusters; MCD, multithreaded community detection; CGGCi-RG, Core Groups Graph Cluster with iteratedrandomized greedy modularity maximization; CONCLUDE, Complex Network Cluster Detection; DSE, dense subgraph extraction; SPICi, Speed and Performance In Clustering; LPA,Label Propagation Algorithm; LE, leading eigenvector; P, precision; R, recall; F, F-measure; NMI, Normalized Mutual Information.Results displayed as median [range] over 10 runs where applicable.
TABLE 5 Best and Worst Algorithms for Each Goodness and Performance Metric
Best Performing Algorithm Worst Performing Algorithm
Metric Overlapping Disjoint Overlapping Disjoint
Goodness metrics
Density TopGC TopGC SVINET —
Clustering coefficient TopGC TopGC SLPA —
TPR CFinder — — —
Conductance SLPA CGGCi-RG TopGC TopGC
Performance metrics
Recall SLPA CGGCi-RG TopGC TopGC
Precision TopGC — SLPA, SVINET —
F-measure SLPA — TopGC TopGC
NMI SLPA — TopGC TopGC
TopGC, Top Graph Clusters; SLPA, Speaker-listener Label Propagation Algorithm; CGGCi-RG, Core Groups Graph Cluster with iterated randomized greedymodularity maximization; TPR, triangle participation ratio; NMI, Normalized Mutual Information.
436 © 2014 The Authors. WIREs Computational Statistics published by Wiley Periodicals, Inc. Volume 6, November/December 2014

WIREs Computational Statistics Community detection in large-scale networks
ground−truth
CFinder
SVINET
TopGC
SLPAS
LPA
Top
GC
SV
INE
T
CF
inde
r
grou
nd−
trut
h
Amazon
SLP
A
Top
GC
SV
INE
T
CF
inde
r
grou
nd−
trut
h
Youtube
SLP
A
Top
GC
SV
INE
T
CF
inde
r
grou
nd−
trut
h
DBLP
SLP
A
Top
GC
SV
INE
T
CF
inde
r
grou
nd−
trut
h
Live journal
SLP
A
Top
GC
SV
INE
T
CF
inde
r
grou
nd−
trut
h
ground−truth
CFinder
SVINET
TopGC
SLPA
Orkut
ground−truthWalktrap
LELPA
FastGreedySPICiDSE
CONCLUDECGGCi−RG
MCDTopGC
SLPA
SLP
AT
opG
CM
CD
CG
GC
i−R
GC
ON
CLU
DE
DS
ES
PIC
iF
astG
reed
yLP
ALE W
alkt
rap
grou
nd−
trut
h
SLP
AT
opG
CM
CD
CG
GC
i−R
GC
ON
CLU
DE
DS
ES
PIC
iF
astG
reed
yLP
ALE W
alkt
rap
grou
nd−
trut
h
SLP
AT
opG
CM
CD
CG
GC
i−R
GC
ON
CLU
DE
DS
ES
PIC
iF
astG
reed
yLP
ALE W
alkt
rap
grou
nd−
trut
h
SLP
AT
opG
CM
CD
CG
GC
i−R
GC
ON
CLU
DE
DS
ES
PIC
iF
astG
reed
yLP
ALE W
alkt
rap
grou
nd−
trut
h
SLP
AT
opG
CM
CD
CG
GC
i−R
GC
ON
CLU
DE
DS
ES
PIC
iF
astG
reed
yLP
ALE W
alkt
rap
grou
nd−
trut
h
ground−truthWalktrapLELPAFastGreedySPICiDSECONCLUDECGGCi−RGMCDTopGCSLPA
0.0 0.2 0.4 0.6 0.8 1.0
FIGURE 3 | Matrices of pairwise similarity scores for the community detection algorithms and the ground-truth. Dots indicate that a similarityscore could not be computed, because one of the algorithms did not finish on that graph within 4 h.
Amazon Youtube DBLP LiveJournal Orkut
Tim
e (s
econ
ds)
SLP
A
Top
GC
MC
D
CG
GC
i−R
G
CO
NC
LUD
E
DS
E
SP
ICi
Fas
tGre
edy
LPA LE
Wal
ktra
p
0.01
1
100
10000
SLP
A
Top
GC
SV
INE
T
CF
inde
r
FIGURE 4 | Run-times of the disjoint and overlapping community detection algorithms (including read and write times) per graph. The algorithmswere terminated if they did not finish within 4 h. For the nondeterministic algorithms, the average of 10 run-times was taken.
Run-TimeFigure 4 shows the run-time of the community detec-tion algorithms on each network. For our evaluations,we used the available implementation of each algo-rithm (Table 1). Note that the language of these imple-mentations likely had an impact on the run-time.
Among the algorithms for overlapping com-munity detection, TopGC had the fastest run-time.CFinder was not able to run on the two largestnetworks (LiveJournal and Orkut) within theallotted time frame of 4 h. This algorithm is very
computationally expensive and thus may not beappropriate for community detection in large-scalenetworks. The time complexity of SVINET is notexplicitly stated in Ref 16 but it also failed to run onLiveJournal and Orkut.
Among the algorithms for disjoint commu-nity detection, DSE and SPICi had the fastestrun-time in all networks except for LiveJournal.On LiveJournal, MCD had the fastest run-time.Moreover, CONCLUDE did not run on LiveJournalwithin the allotted time frame.
Volume 6, November/December 2014 © 2014 The Authors. WIREs Computational Statistics published by Wiley Periodicals, Inc. 437

Advanced Review wires.wiley.com/compstats
CONCLUSION
In this review, we empirically evaluated severalstate-of-the-art community detection algorithms foroverlapping and disjoint community detection onlarge-scale real-world networks. The algorithms wereevaluated by measuring the structural properties oftheir identified communities, as well as their perfor-mance with respect to the known ground-truthcommunities. Our results show that these twotypes of measures are not equivalent; an algorithm
that identifies communities with ‘good’ structuralproperties does not necessarily yield good perfor-mance metrics. For example, TopGC obtained goodresults in terms of goodness metrics (i.e., density, clus-tering coefficient, and TPR), but it did not performwell when compared against ground-truth communi-ties. In contrast, SLPA did not identify communitieswith good clustering coefficients. However, it returnedthe best values for the performance metrics (i.e., recall,precision, and NMI), and the communities it identifiedwere the most similar to the ground-truth.
ACKNOWLEDGMENTS
This work was supported in part by the DOE SDAVI Institute and the U.S. National Science Foundation(Expeditions in Computing program).
REFERENCES1. Adamcsek B, Palla G, Farkas IJ, Derényi I, Vicsek
T. Cfinder: locating cliques and overlapping mod-ules in biological networks. Bioinformatics 2006,22:1021–1023.
2. Reddy PK, Kitsuregawa M, Sreekanth P, Rao SS. Agraph based approach to extract a neighborhood cus-tomer community for collaborative filtering. In: Sub-hash Bhalla, eds. Databases in Networked InformationSystems. Berlin/Heidelberg: Springer; 2002, 188–200.
3. Steinhaeuser K, Chawla NV, Ganguly AR. Complexnetworks as a unified framework for descriptive analysisand predictive modeling in climate science. Stat AnalData Mining 2011, 4:497–511.
4. Fortunato S. Community detection in graphs. CoRR,abs/0906.0612, 2009.
5. Coscia M, Giannotti F, Pedreschi D. A classification forcommunity discovery methods in complex networks.CoRR, abs/1206.3552, 2012.
6. Crampes M, Plantié M. A unified community detec-tion, visualization and analysis method. CoRR,abs/1301.7006, 2013.
7. Malliaros FD, Vazirgiannis M. Clustering and commu-nity detection in directed networks: a survey. CoRR,abs/1308.0971, 2013.
8. Danon L, Diaz-Guilera A, Duch J, Arenas A. Comparingcommunity structure identification. J Stat Mech TheorExp 2005, 2005:P09008.
9. Lancichinetti A, Fortunato S. Community detectionalgorithms: a comparative analysis. Phys Rev E 2009,80:056117.
10. Orman GK, Labatut V, Cherifi H. Comparative eval-uation of community detection algorithms: a topolog-ical approach. J Stat Mech Theor Exp 2012, 2012:P08001.
11. Xie J, Kelley S, Szymanski BK. Overlapping commu-nity detection in networks: the state-of-the-art andcomparative study. ACM Comput Surv 2013, 45:43.
12. Leskovec J, Lang KJ, Mahoney MW. Empirical compar-ison of algorithms for network community detection.CoRR, abs/1004.3539, 2010.
13. Moradi F, Olovsson T, Tsigas P. An evaluation of com-munity detection algorithms on large-scale email traffic.In: SEA. Berlin/Heidelberg: Springer; 2012; 283–294.
14. Xie J, Szymanski BK. Towards linear time overlappingcommunity detection in social networks. In: PAKDD.Berlin/Heidelberg: Springer; 2012, 25–36.
15. Macropol K, Singh AK. Scalable discovery of bestclusters on large graphs. Proc VLDB Endowment 2010,3:693–702.
16. Gopalan PK, Blei DM. Efficient discovery of overlap-ping communities in massive networks. Proc Natl AcadSci 2013, 110:14534–14539.
17. Riedy J, Bader DA, Meyerhenke H. Scalable multi-threaded community detection in social networks. In:Parallel and Distributed Processing Symposium Work-shops & PhD Forum (IPDPSW), 2012 IEEE 26th Inter-national. Washington, DC: IEEE; 2012, 1619–1628.
18. Ovelgönne M, Geyer-Schulz A. An ensemble learningstrategy for graph clustering. In: Bader DA, MeyerhenkeH, Sanders P, Wagner D, eds. Graph Partitioning andGraph Clustering. Providence, RI: American Mathemat-ical Society; 2012, 187–206.
19. De Meo P, Ferrara E, Fiumara G, Provetti A. Mixinglocal and global information for community detectionin large networks. J Comput Syst Sci 2014, 80:72–87.
20. Chen J, Saad Y. Dense subgraph extraction with appli-cation to community detection. IEEE Trans KnowlData Eng 2012, 24:1216–1230.
438 © 2014 The Authors. WIREs Computational Statistics published by Wiley Periodicals, Inc. Volume 6, November/December 2014

WIREs Computational Statistics Community detection in large-scale networks
21. Jiang P, Singh M. Spici: a fast clustering algorithmfor large biological networks. Bioinformatics 2010,26:1105–1111.
22. Clauset A, Newman MEJ, Moore C. Finding commu-nity structure in very large networks. Phys Rev E 2004,70:066111.
23. Raghavan UN, Albert R, Kumara S. Near linear timealgorithm to detect community structures in large-scalenetworks. Phys Rev E 2007, 76:036106.
24. Newman MEJ. Finding community structure in net-works using the eigenvectors of matrices. Phys Rev E2006, 74:036104.
25. Pons P, Latapy M. Computing communities in large net-works using random walks. In: Proceedings of the 20thInternational Conference on Computer and Informa-tion Sciences. Berlin/Heidelberg: Springer-Verlag; 2005,284–293.
26. Palla G, Derényi I, Farkas I, Vicsek T. Uncover-ing the overlapping community structure of complexnetworks in nature and society. Nature 2005, 435:814–818.
27. Tomita E, Tanaka A, Takahashi H. The worst-case timecomplexity for generating all maximal cliques. In ChwaKY, Munro JI, eds. Computing and Combinatorics.Berlin/Heidelberg: Springer; 2004, 161–170.
28. Airoldi EM, Blei DM, Fienberg SE, Xing EP. Mixedmembership stochastic blockmodels. J Mach Learn Res2008, 9:1981–2014.
29. Blondel VD, Guillaume J-L, Lambiotte R, Lefebvre E.Fast unfolding of communities in large networks. J StatMech Theor Exp 2008, 2008:P10008.
30. Saad Y. Finding exact and approximate block structuresfor ilu preconditioning. SIAM J Sci Comput 2003,24:1107–1123.
31. Altaf-Ul-Amin M, Shinbo Y, Mihara K, KurokawaK, Kanaya S. Development and implementation ofan algorithm for detection of protein complexes inlarge interaction networks. BMC Bioinformatics 2006,7:207.
32. Yang J, Leskovec J. Defining and evaluating networkcommunities based on ground-truth. In: ICDM. NewYork, NY: ACM; 2012, 745–754.
33. Samatova NF, Hendrix W, Jenkins J, Padmanabhan K,Chakraborty A. In: Samatova NF, Hendrix W, Jenkins J,Padmanabhan K, Chakraborty A, eds. Practical GraphMining with R. Chapman and Hall/CRC: CRC Press;2013.
34. McDaid AF, Greene D, Hurley NJ. Normalized mutualinformation to evaluate overlapping community findingalgorithms. CoRR, abs/1110.2515, 2011.
Volume 6, November/December 2014 © 2014 The Authors. WIREs Computational Statistics published by Wiley Periodicals, Inc. 439