community development corporations and their changing
TRANSCRIPT

Christopher Walker
Community Development Corporations and their Changing Support Systems

Community Development Corporations and Their Changing Support Systems
December 2002Copyright © 2002
Christopher WalkerThe Urban InstituteMetropolitan Housing and Communities Policy Center2100 M Street, NWWashington, DC 20037
The nonpartisan Urban Institute publishes studies, reports, and books on timely topics worthy of publicconsideration. The views expressed are those of the authors and should not be attributed to the Urban Institute,its trustees, or its funders.

Acknowledgments:
The author thanks the many individuals who contributed information, insights, and commentary to the draftingand publication of this report. George Galster, Lang Keyes, Neil Mayer, Robin Redford, Munro Richardson, KenTemkin, Avis Vidal, and Mark Weinheimer conducted field research used in this report. Jeremy Gustafson, KimMarschner, Sandy Padilla, and Chris Snow helped with the analysis, and Diane Hendricks produced the report.Dozens of Local Initiatives Support Corporation (LISC) and The Enterprise Foundation (Enterprise) staff mem-bers throughout the 23 cities contributed time and logistical support to the field data collection effort, as didhundreds of persons from community development corporations, foundations, financial institutions, and govern-ment agencies. Michael Tang of LISC and Angela Gravely Smith of Enterprise provided important technicalsupport throughout data collection and analysis.
We especially thank Reese Fayde and Mark Weinheimer of Living Cities: The National Community DevelopmentInitiative (NCDI) for the quality and thoroughness of their comments on drafts. We acknowledge the helpfulcommentary of: Carol Berde (McKnight Foundation) chair of the NCDI Learning Committee and the com-ments of other committee members—John Bare (Knight Foundation), Mark Willis (JP Morgan Chase), SandyJibrell (A.E. Casey Foundation), Lyn Whitcomb and Karen Daley (HUD), as well as comments from MichaelRubinger and Mindy Leiterman (LISC), Bart Harvey, Kelly Cartales and Diana Meyer (Enterprise) and MargeTurner of the Urban Institute.
ii Community Development Corporations and their Changing Support Systems

T a b l e o f C o n t e n t s iii
TABLE OF CONTENTS
Summary of Findings and Methods 1
Section-by-Section Findings 2
Research Approach and Methods 4
Section 1: Neighborhood Problems and CDC Responses 6
CDC Impacts on Neighborhood Markets 8
Why Support Systems for CDCs Are Necessary 10
Section 2: Activities, Size, and Quality of CDC Industries 12
CDC Projects and Activities 12
Growth in CDC Development Activity between 1991 and 2000 15
Growth in Industry Size between 1990 and 1998 16
Variations in Industry Strength across Cities 18
What Explains the Relative Performance of the 23 Cities? 20
Section 3: Changes in Production Systems 22
Production System Characteristics and Problems 22
Production System Changes over the 1990s 24
Differences in Quality of Local Production Systems 29
Continuing Challenges and New Opportunities 32

iv Community Development Corporations and their Changing Support Systems
Section 4: Changes in Capacity-Building Systems 34
How Capable Are CDCs and How Has This Changed? 34
Creation and Growth of New Capacity-Building Systems in the 1990s 38
Continuing Challenges and New Opportunities 44
Section 5: Leadership Systems 48
Leadership Systems and Their Problems 48
Methods of Engagement 50
Trends over the 1990s 51
The Critical Role of Intermediation 54
Continuing Challenges and New Opportunities 56
Conclusion 58
References 59
Appendix A: The National Community Development Initiative 60
Appendix B: Research Methodology 62

S u m m a r y o f F i n d i n g s a n d M e t h o d s 1
Summary of Findings and Methods
In recent years, community development corporations (CDCs) have received major attention from governmentand private funders as a promising way to improve urban neighborhoods and the lives of those who live in them.These groups are nonprofit, community-controlled real estate development organizations dedicated to the revital-ization of poor neighborhoods. They undertake physical revitalization as well as economic development, socialservices, and organizing and advocacy activities. Because public services for poor communities are fragmentedacross multiple agencies and levels of government, CDCs often are the only institution with a comprehensive and coordinated program agenda.
This paper assesses changes over the 1990s in community development corporations and the growing support systems that have been constructed to further their work. The analysis relies on 10 years of research in the 23 citiesfunded by the National Community Development Initiative (NCDI), a consortium of national corporations,foundations, and the U.S. Department of Housing and Urban Development. In 2001, NCDI funders committedto an additional ten years of investment. Since that time, the organization has expanded its activities and incorpo-rated as a nonprofit with a new name: Living Cities: The National Community Development Initiative.
This paper’s central conclusion is that CDCs as an industry made strong gains in their number, size, outputs,and contributions to neighborhood revitalization over the 1990s. They increased their ability to influence neigh-borhood markets and to respond to neighborhood problems. They expanded their physical revitalization activitiesand began to pursue more comprehensive approaches to community improvement. These advances were largelythe result of an institutional revolution within most major U.S. cities. Support for CDC initiatives had beenlargely ad hoc and poorly coordinated before 1990. By decade’s end, support for CDCs had became more rational,entrenched, and effective.
Community development support “systems” had emerged in many cities. These systems are comprised of theinterrelated people and institutions that mobilize money, expertise, and political support for community develop-ment. As prominent aspects of these systems, governments, financial institutions, and philanthropic organizationscame together to create new collaborative bodies to support CDCs. These bodies linked CDCs to money, expert-ise, and political power. They attracted resources from local and national sources and channeled them to CDCs as project capital, operating subsidies, and technical assistance grants. They also engaged civic and political leadersin a neighborhood improvement agenda.
Two national intermediary organizations—the Local Initiatives Support Corporation (LISC) and The EnterpriseFoundation (Enterprise)—can take major credit for the creation and growth of these new local collaboratives.Through their network of field offices in nearly 60 U.S. cities, LISC and Enterprise aggressively promote non-profit community development and invest directly in CDC projects.
During the 1990s, the LISC and Enterprise networks served as the delivery mechanism for the infusion ofapproximately $250 million into community development from the National Community DevelopmentInitiative (NCDI). Launched in 1991 by a collaboration of national foundations, corporations, and the U.S.Department of Housing and Urban Development, and managed by a small Secretariat of part-time consultants,NCDI supported CDC projects and invested heavily in CDC organizational capacity in 23 cities.1 NCDI playeda key role in catalyzing CDC gains over the 1990s.
1 Please see appendix A for a more complete description of NCDI.

2 Community Development Corporations and their Changing Support Systems
Section-by-Section Findings
Section 1 discusses CDCs as an alternative model to government administration of
comprehensive community programs. Unlike government, CDCs can respond quickly
to development opportunities, and they can more easily assemble and coordinate the
disparate programs needed to respond to neighborhood problems effectively. The
record shows CDC successes. Experimental econometric analysis finds that CDC
efforts do lead to improvements in neighborhood quality that the market recognizes, as
shown by increases in residential property values. Local community development prac-
titioners in most NCDI cities can identify at least one neighborhood where property
values are rising and CDCs are most likely responsible; in two-thirds of cities, this has
happened in more than one neighborhood. But to accomplish improvement objectives, CDCs must rely on the
support of the broader community development system of which they are a part. This support has helped CDCs
move partway toward resolution of long-standing organizational capacity issues, which stem from CDCs’ unique
status as community-based development organizations that take on complex public-purpose projects, usually in
stagnant or declining markets.
Section 2 examines the CDC industry itself—the organizations and the projects and
activities they pursue to redevelop neighborhoods. Over the 1990s, CDCs diversified
their range of community development activities, with increasing interest in adopting
or expanding commercial development, workforce and youth development, and com-
munity facilities programs. This diversification took place across a variety of cities in all
regions of the country. Total value of CDC projects receiving support from intermedi-
aries doubled between 1991 and 2000, and the overall size of CDC industries grew as
well. The quality of CDC industries, however, as measured in terms of their size and
capabilities, differed greatly over the 23 NCDI cities, even though they all improved
over the decade. Differences in industry strength can best be explained by differences in the performance of com-
munity development systems.
Section 3 focuses on community development production systems—the relationships
among people and institutions that mobilize, allocate, and regulate the use of land and
capital for community development. Why did CDCs substantially boost their produc-
tive capabilities in the 1990s? Section 3 explores the major factors. The affordable
housing industry became more adept at using the Low-Income Housing Tax Credit.
Private capital became easier to secure for affordable housing. And federal housing
resources grew, as did some local funds. National intermediaries supplied large amounts
of hard-to-get predevelopment funding to CDC projects, which went partway toward
filling a long-standing gap in the financing system. These funds also helped CDCs

S u m m a r y o f F i n d i n g s a n d M e t h o d s 3
move into new types of community development activities, most notably the development of for-sale housing,
commercial centers, and community facilities. By the end of the decade, some CDCs were in position to take full
advantage of new national sources of support for housing and commercial development.
Section 4 examines community development capacity-building systems—the relation-
ships among people and institutions that accumulate and allocate resources to
strengthen organizations’ ability to pursue community development. Both local LISC
and Enterprise and CDC staff recognize the organizational improvements CDCs have
made over the 1990s, especially in core financial systems, and CDCs’ strong perform-
ance in establishing and maintaining community ties. But CDCs remain vulnerable,
financially, especially in view of the more expanded set of community development
responsibilities they have assumed. Fortunately, community development capacity-
building systems have registered larger gains than any other system. A key feature of
good capacity-building programs is operating support. Before 1991, only 8 of the 23 NCDI cities had operating
support programs—and these were rudimentary. By 2001, 21 cities had such programs, and many were compre-
hensive. Section 4 concludes by examining how the new collaboratives and capacity-building programs strength-
ened CDCs as organizations. Among the key factors: offering multiyear grants and establishing stronger
performance standards.
Section 5 explores community development leadership systems—the relationships
among CDCs and those who command community development resources. The new
collaborations forged in the 1990s drew leaders across multiple sectors into community
development. CDCs rose on local political agendas. Section 5 focuses especially on
the intermediaries’ role in strengthening CDC leadership systems. It traces how a
collaborative typically operates. The section concludes by examining factors that con-
tributed to CDCs’ rising political credibility—including CDCs’ stronger production
capability, the high profiled involvement of NCDI, and stronger local leadership for
community development.
By the end of the decade, CDCs had made modest gains in improving poor communities, even though most
CDC neighborhoods remained isolated from the economic and social mainstream. Nevertheless, the 1990s was
an important decade for community development and for CDCs. By decade’s end, a growing number of cities
had created the basic elements of a well-functioning community development industry. Success in these cities
paved the way for widespread future improvements in community development systems. This report assesses the
record of change in CDC industries—an alternative (but not replacement) to public or for-profit development
efforts—and links these changes to the support they received from government and private sector sources.

4 Community Development Corporations and their Changing Support Systems
Research Approach and Methods
Research for this paper was conducted by senior research staff from the Urban Institute and its consultants.2 Itdraws on a seven-year investigation of NCDI by the Urban Institute, drawing on the experience of the 23 citiesparticipating in the NCDI program (“NCDI cities”).
Community development systems are comprised of the relationships among neighborhood leaders, includingCDCs, and citywide institutions that mobilize, allocate, and wield finance, expertise, and political influencefor community development purposes.
Our research answers one core question: How have community development systems changed over the decade of the 1990s? To answer this question, we divided community development systems into four components.
• CDC industries, consisting of individual CDCs, and their projects and activities.
• Production systems to support physical revitalization projects. A production system includes the relationshipsamong people and institutions that mobilize, allocate, and regulate the use of land and capital for communitydevelopment purposes. Typical activities include development of affordable housing, commercial buildings, and community facilities.
• Capacity-building systems to support CDCs’ ability to carry out neighborhood improvement activities effec-tively. The capacity-building system consists of the relationships among people and institutions that accumulateand allocate resources to strengthen organizations’ ability to pursue community development purposes. Typicalactivities include provision of operating support, consulting assistance, training and seminars, and upgrades tofinancial, personnel, and information and asset management systems.
• Leadership systems to mobilize political support and resources for a community development agenda. Theleadership system consists of the relationships among CDCs and those who command community develop-ment resources.
In the best functioning community development systems, these components reinforce one another, and theyoften do so through the following:
• Intermediation, which in NCDI cities was most often provided by the Local Initiatives Support Corporation(LISC) and The Enterprise Foundation. These national organizations, with offices in most major cities and allof the 23 NCDI cities, provide technical help and operating support to community organizations, principallyincluding CDCs, and financial assistance to community development projects. In the most advanced commu-nity development environments, local intermediaries also have arisen to mobilize funding from local financialinstitutions and to supply technical help to a portion of the community development industry or for specialtypes of projects.
One reason why intermediation is important is that it bridges gaps between portions of systems that have notworked together well in the past. For example, capacity systems may build the CDC staff skills needed to takeadvantage of the opportunities offered by the production system, or production systems are streamlined to permitsmall organizations to apply for funding without incurring excessive transaction costs. But as noted in the intro-duction, production and capacity systems do not always work together well. At the beginning of the 1990s, themost pervasive disconnects between the two lay in the inability of production systems, however well functioning,to generate sufficient operating support to fully cover the costs of CDC revitalization activities. One of the mostimportant roles of intermediaries is to provide this working capital.
2 Please see appendix B for more detail on the data collection and analysis methods used.

S u m m a r y o f F i n d i n g s a n d M e t h o d s 5
Our findings are based on our review of the accumulated evidence of community development systemschange across all 23 NCDI cities during the 1990s. We rely heavily on field reports, compiled by a teamof community development experts, who visited their assigned NCDI cities about every 18 months. Thesereports follow a common format, typically covering each of the four system components, but emphasizingdifferent aspects of these components in each reporting cycle. Field researchers gathered information throughinterviews with representatives from local intermediaries, CDCs, city agencies, banks, foundations, andother informed observers.
We also rely on other sources of evidence gathered throughout the course of this research. Specifically, some of thefindings contained in this report rely on the following:
1. A mail survey of CDCs to find out about CDCs’ activities, assessment of capacity and priorities for the future,and ratings of other community development actors. We surveyed all CDCs in the 23 NCDI cities that werecapable of producing 10 housing units per year or more (or the commercial space equivalent) as judged bylocal LISC and Enterprise staff. We received 163 completed surveys from 270 surveys mailed, a 60 percentresponse rate.
2. Documentary material on CDC activities and accomplishments, city administration programs and policies,and other local activities, as well as published reports on changes in federal policy, national funding patterns,and others. We also analyzed data from the Department of Treasury’s Home Mortgage Disclosure Act files,information from the U.S. Census, and other public databases.
3. Information from LISC and Enterprise management information systems on the amount, purpose, and CDCbeneficiaries of NCDI and non-NCDI funding for projects and capacity building in each NCDI city.
4. Information from LISC and Enterprise program documents submitted to the NCDI Secretariat and funders as part of their planning and reporting requirements. Most helpful were the system “Portraits” compiled in2001 in preparation for NCDI’s second decade, the local workplans prepared at the beginning of each of thethree NCDI funding cycles, and annual and semiannual reports on problems and progress in implementingNCDI-funded activities.
Our analysis relies on multiple pieces of evidence, assembled and analyzed to arrive at solid conclusions about thedirection and pace of change in each NCDI community.

Neighborhood Problems and CDC Responses
1s e c t i o n
Since the 1960s, the poorest neighborhoods of Philadelphia, Cleveland, Chicago, Los Angeles,and many other cities have seen the withdrawal of private capital. The most obvious signs ofthis disinvestment are the rows of blighted properties, many abandoned by their former
owners. Disinvestment was produced by a complex mix of social and economic factors, includingracial segregation and middle-class suburbanization. The physical deterioration of neighborhoodswas accompanied by other changes that aggravated the downward spiral. Left with increasinglypoor residents, cities lost much of their tax base and hence their ability to provide the high-qualitypublic services needed to sustain the flow of private capital. Economic change often meant the lossof industrial jobs in inner-city neighborhoods. Concentrations of poverty produced a kind of socialisolation of the poor that made it difficult for them to take advantage of mainstream economic andsocial opportunities.
As communities declined, government agencies andprivate foundations have pursued a variety of strategiesto improve neighborhood quality through investmentsin housing rehabilitation, commercial district improve-ments, upgrades to the transportation and under-ground infrastructure, renovation of parks and openspaces, and other activities. The aim of these commu-nity development investments was to improve thequality of the neighborhood for those who lived there,and at the same time, induce outsiders to make newinvestments, which in turn would further improveneighborhood quality.
Most community development agencies understoodthat physical revitalization alone would not be enough.Poor people needed opportunities to learn job skillsand find employment, and some public agencies andprivate philanthropies turned their attention to busi-ness development, workforce programs, and otherefforts to help people seize economic opportunities.Further, families with children needed immediate helpwith educational programs, supervision of children
after school, and other programs to help ensure healthyand stable families. Therefore, many communitydevelopment programs also included these kinds ofsocial investments.
But blending these investments in ways that producesolid results has proven to be exceptionally difficult.Since the middle of the 1970s, when a major shift inresponsibility from the federal to the local levels tookplace, county and municipal government agencieshave had the lead responsibility for the design andimplementation of community development strategiesand programs. Decentralized community develop-ment has its strengths, but it also multiplied the num-ber of governments involved. State governments, forexample, allocated the Low-Income Housing TaxCredits and some affordable housing loan funds.Localities controlled the dispersal of CommunityDevelopment Block Grant Program monies and otherhousing funds. The federal government, too, retaineda diminished inventory of special-purpose programs.

N e i g h b o r h o o d P r o b l e m s a n d C D C R e s p o n s e s 7
Econometric Evidence of the Impact of Community Development Corporations on Neighborhoods
Most CDCs promote reinvestment by communi-cating accurate market information to investorsand by demonstrating, through their projects, thatneighborhoods are market-worthy. The UrbanInstitute conducted an exploratory analysis of theimpacts of CDCs on neighborhood quality in fiveurban neighborhoods. People interviewed in thestudy communities agreed that neighborhood qualityhad improved and that CDC efforts were partlyresponsible. Comparison of price trends showedthat values increased. But researchers also assessedproperty value changes using econometric trendanalysis, which accounts for the myriad factorsother than CDC efforts that can influence propertyvalue change. This method requires very strongevidence to merit a finding of CDC impact.
The team found that CDCs had generated higherproperty values in two of the five study neighbor-hoods. In Portland, OR and Denver, econometrictrend analysis produced solid evidence that theincreases resulted from CDC activities and the supporting investments made by private andpublic agencies. In Portland, OR, property valuesincreased 60 percent more than they would have otherwise after REACH CommunityDevelopment Corporation worked with theBelmont Business Association and BelmontNeighborhood Association to design and implement
a series of business district improvements. In Denver,values increased by 50 percent more than theywould have otherwise after HOPE Housing, Inc.,rehabilitated a large gateway property, supportedby additional private and public investment.
The conclusion: “Policy” interventions of the sortrepresented by CDCs’ community developmentinvestments can produce real results that arescientifically measurable.
CDCs had the most posi-tive influence on propertyvalues in neighborhoodswhere they concentratedtheir activities in a cleartarget area or pursuedprojects with high visibility.And the way CDCs pursueredevelopment throughcommunity empower-ment is important to
their success. All five CDCs in the study devotedconsiderable energy to involving people in redevel-opment efforts, and residents and businesses, onceinduced to participate in CDC activities, continuedtheir activism later on.
For more, see Temkin et al. (forthcoming).

8 Community Development Corporations and their Changing Support Systems
Further, while local govern-ments are far closer to the neighborhoods, localadministrations generallywere not all that good atharnessing different pro-grams into a coordinatedneighborhood strategy.Public works agencies over-saw infrastructure spending;housing and community
development agencies managed the housing funds;and social services funding came from city or countyfamily services agencies. Typically, no single agencyhad the authority to coordinate these investments.The participation of community residents was gener-ally missing, except through weak planning structurescreated by local governments. The results of theseinvestments cannot be considered a solid recordof accomplishment.
Over the past 30 years, the most promising alternativemodel to direct governmental administration of community development programs has been that of community development corporations. Unlikegovernment, community development corporations
can respond quickly to the development opportunitiesoffered by a changing marketplace. They also can mixand match programs to respond to the multiple needswithin a neighborhood more easily than can citygovernment, which is responsible for programs in allneighborhoods. And CDCs are directly accountableto governing boards that include community represen-tation, linking CDC directors and staff links to a vari-ety of community institutions, which can be enlistedin the task of community change.
As intermediaries between the community and themarket, CDCs possess two great strengths: they pro-duce housing units, commercial space, communityfacilities, and other visible neighborhood improve-ments to help make the lives of people in the commu-nity better. And they work with disparate communityresidents and leaders to help bring external resourcesto bear on the task of neighborhood improvement.
CDC Impacts on Neighborhood Markets
The public policy record does not feature many con-vincing examples that purposive action can improveneighborhoods. One reason is that sustainable changein real estate markets is hard to effect, requiring the
Table 1.1
Scope of Neighborhood Quality Improvement Credited to CDCs in 23 NCDI Cities
Scope of Impact Cities Relationship to CDC Industry Strength
Impacts in MultipleNeighborhoods
Eight Cities
Boston, Chicago, Cleveland,Kansas City, New York,Philadelphia, Seattle, Washington,D.C.
All but Kansas City are top-rankedcities in terms of industry size andquality. (See section 3.)
Impacts in Single Neighborhood
Eleven Cities
Atlanta, Baltimore, Denver,Indianapolis, Los Angeles,Newark, Oakland, Portland, OR,San Antonio, St. Paul, Miami
These are a mix of industry sizeand quality, tend to be dominatedby one strong CDC with a solidproduction record.
Impacts are Block-by-Block Four Cities
Columbus, Dallas, Detroit, Phoenix
All are relatively new industries orlarger industries (Detroit) withrecognized capacity problems.

N e i g h b o r h o o d P r o b l e m s a n d C D C R e s p o n s e s 9
participation of a myriad of large and small investors.Yet some CDCs’ investments, by directly improvingquality and leading the market to show potentialreturns, have sent the market signals needed toinduce external investment. New exploratory researchshows that the markets in certain neighborhoodshave responded to CDC redevelopment efforts. (See text box.)
Other research conducted as part of the NCDI assess-ment provides supporting evidence for the claim thatCDC improvement efforts can make neighborhoodsbetter in ways that are recognized by the market. Fieldresearchers found widespread agreement among com-munity development practitioners in NCDI cities thatsome CDC investments have produced improvementsin community quality that have been recognized bythe market and thus capitalized in higher real estatevalues. Even though econometric evidence was notavailable to demonstrate this result statistically,community development professionals in the 23cities—CDC directors, intermediary staff, cityofficials, bankers, foundation staff, local academics,and others—identified neighborhoods with upswingsin housing markets thought to be due, in some largepart, to CDC redevelopment efforts. In about two-
thirds of cities, practitioners credited CDCs withsuccessful neighborhood turnaround in at least oneneighborhood. (See text box.)
Differences across cities in CDC ability to improveneighborhood quality can be explained by differencesin part by the strength of regional markets, but also bythe quality of CDC industries, and the quality of thecommunity development support system. Overcomingdeep and complex neighborhood problems demandslong-term and consistently applied strategic invest-ments, which few CDCs have been able to make his-torically. Industries with large numbers of CDCs ableto make these long-term investments have achievedresults, but not all industries have reached this levelof size and quality. Those that have done so benefitedfrom creation of strong community developmentsupport systems.
CDCs achieved the broadest results where they pur-sued a consistent community improvement strategyover time, supported by strategic alliances with otherneighborhood and citywide actors. Field investigatorsconfirmed that the CDCs most often credited withobservable impacts in their neighborhoods were groups
Table 1.2
Potential CDC Assets and Liabilities as Development Organizationsand Community Organizations
As Development As Community Organizations v. For- Organizations v. Other Profit Developers (Non-Development)
Community Organizations
Potential CDC Assets Able to organize residents insupport of redevelopmentpolicies and projects.
Able to secure support frompublic agencies.
Able to act as coordinatingagency for public investments.
Can bring resources into theneighborhood.
Have connection to city, state,and national supporters.
Follow a businesslike orientation.
Potential CDC Liabilities Can be cash-starved since devel-opments may not make money.
Can have weak capacity to bringprojects on line efficiently, atlow cost.
May be overly “political.”
Can be distracted fromcommunity purpose due toorientation to markets andexternal stakeholders.

10 Community Development Corporations and their Changing Support Systems
that had been at work for atleast a decade. These CDCscombined two necessarystrengths—a track record ofsuccessful redevelopment,including a blended portfolioof physical development andhuman service programs, andan ability to manage and gov-ern themselves effectively.
CDCs in cities that created effective communitydevelopment systems early on tend to have multiple,strong, capably managed CDCs able to pursue neigh-borhood revitalization over the long haul. The keycomponent of support systems is the relationshipsamong individuals and institutions that can be used to mobilize and wield finance, expertise, and politicalinfluence for community development. As the boxshows, we found a rough correlation between thebreadth of neighborhood impacts achieved and thestrength of local community development systems.
Why Support Systems for CDCs Are Necessary
All types of organizations and institutions havestrengths and weaknesses and CDCs are no exception.As noted above, CDCs have been able to intermediatebetween communities and markets in part becausethey are developers with special ties to community.
CDC status as development organizations conveyscommunity benefits that other community-basedorganizations cannot. CDCs establish and maintainrelationships with powerful outside actors, whoseresources can sometimes be brought to bear to helpsolve a variety of neighborhood problems. They alsomay command substantial amounts of physical andfinancial assets, which confers power of a kind thatsocial services organizations typically lack. CDC statusas community-based organizations conveys advantagesto the community relative to for-profit developers.They can help blend multiple community programs,not just those tied to specific development projects.They can design and build redevelopment projectsthat meet with community approval. And CDCs havecommunity connections that few private developerscan duplicate. And as a result, they can act in the public arena as the voice of the neighborhood.
CDCs’ dual role has costs,too. As small nonprofit devel-opers, many CDCs are cash-strapped, and compared tosome private sector develop-ers, they often lack capacity to bring projects on line effi-ciently, at low cost. And com-pared to those community-based organizations that donot depend on city govern-
ment to support internal operations and fund projects,CDCs sometimes resist appeals for a more confronta-tional posture toward local elected and administrativeofficials. Further, if they are to be built, CDC projectsmust meet market tests of financial soundness, whichsometimes means that they cannot serve only thepoorest residents in a community, or provide the services some residents may demand.
Many of the challenges faced by community develop-ment systems stem from the special difficulties posedby the dual CDC role. To overcome these difficulties,CDCs rely heavily on their relationships with othersinside and outside the neighborhoods in which theywork. Of special interest in this paper are the con-nections CDCs maintain with sources of money, talent, and expertise outside their neighborhoods. The remaining sections of this paper examine CDCswithin the context of the broader financial, technical,and political systems. Across the country, these localsystems vary considerably in their performance, inwhich community development policymakers andpractitioners have invested considerable money andtime to improve.


Activities, Size, and Quality of CDC Industries
2s e c t i o n
CDC industries consist of CDCs and their projects and activities. Over the 1990s, CDCsgenerally diversified their range of community development activities, with increasinginterest in adopting or expanding commercial development, workforce and youth
development, and community facilities programs. (Not all CDCs chose to expand their activities,choosing instead to partner with other organizations to provide an expanded range of communitydevelopment services.) The total development costs of CDC projects receiving support fromnational intermediaries doubled between 1991 and 2000, and the overall size of CDC industriesgrew as well. The numbers of groups expanded as did their operating budgets, another indicator ofthe expansion of CDC community development activities. The quality of CDC industries, however,as measured in terms of their size and quality, differed greatly over the 23 NCDI cities, even thoughthey all improved over the decade. Differences in industry strength can best be explained by differ-ences in the performance of community development systems.
CDC Projects and Activities
CDCs pursue their redevelopment goals by carryingout a range of community activities, selected based onneighborhood need, organizational abilities, and avail-ability of funding and other support. Field researchshows that over the 1990s, CDCs in the 23 NCDIcities took on a more diverse range of activities, activelysupported by new city governments, financial institu-tions, and foundation investments. By the end of thedecade, about one quarter of CDCs were “comprehen-sive” in terms of the number of activities they pursued.3
Nearly all CDCs do some kind of affordable housingdevelopment, including construction and renovationof housing for renters or homebuyers. These develop-ment activities often are accompanied by neighbor-hood planning efforts and community organizingintended to improve the quality of services to urbanneighborhoods. In 1999, Urban Institute researcherssurveyed CDCs to find out what activities they tookon. (The survey population consisted of “capable”CDCs, those that local LISC and Enterprise staffreported were capable of producing 10 units per year
3 “Comprehensiveness” is not a litmus test of value. Some CDCs chose to expand the range of services they provided directly, others concentrated on thefew activities they already did well. Many of the latter pursued partnerships with other community organizations in lieu of taking on new functions them-selves. But in view of the lack of community capacity in many poor neighborhoods, CDCs often represent the only platform for delivery of community-based services, and thus have no choice but to pursue expansion.

A c t i v i t i e s , S i z e , a n d Q u a l i t y o f C D C I n d u s t r i e s 13
Range of Community Development Activities Carried Out by CDC
Types of Programs and Activities Percent of “Capable” Carried Out by Community CDCs Reporting TheyDevelopment Corporations Conducted Activity in 1999
Housing Development, including both rental and homeowner 94 percenthousing. CDCs steadily increased their draw from a relatively fixed pool of local housing dollars and other community development resources.
Planning and Organizing, including neighborhood planning, 80 percentcommunity organizing and advocacy work, community safety, neighborhood cleanup, and other programs that require active participation of residents and businesses.
Homeownership Programs, including down-payment assistance, 69 percentowner-occupied housing rehabilitation, pre-purchase counseling, emergency repair, and other programs to help support or increase the cadre of homeowners in low-income neighborhoods.
Commercial and Business Development, including commercial 60 percentdistrict improvement and promotion programs, business technical assistance and financing, commercial building renovation and construction, industrial loft retention, and others.
Workforce and Youth Programs, including job-readiness training, 55 percentskills development, youth employment and training, leadership training, and so on.
Community Facilities, including health clinics, schools, senior and 45 percentcommunity centers, homeless shelters, transportation improvements and programs, and other community-use infrastructure.
Open Space, including community gardens, parks improvement and 29 percentmaintenance, greenway development and management, etc.
Source: 1999 Urban Institute survey of CDCs in 23 NCDI cities. Number of respondents = 163.

14 Community Development Corporations and their Changing Support Systems
or more, or the equivalent amount of commercialspace. These capable CDCs form the basis of theanalysis of CDC industry size presented later on inthis section.)4 The results are shown in the box onpage 13.5
The near-universal emphasis on housing developmentand community planning is long-standing and welldocumented by previous research (NCCED 1998).The prevalence of CDC commercial and businessdevelopment, workforce and youth programs, andrenovation and construction of community facilitiesmay be of more recent vintage. Interviews with localcommunity development practitioners point to theseas areas of CDC growth, and the increasing amountsof support CDCs received for community facilities isdocumented in the next section. Empirical support forthis suspected CDC move into commercial develop-ment, workforce and youth, and facilities developmentis provided by table 2.1. For example, 11 percent ofgroups newly implemented a commercial development
program in 1999, and another 8.6 percent that hadnot operated a commercial program in the pastplanned to start one.6
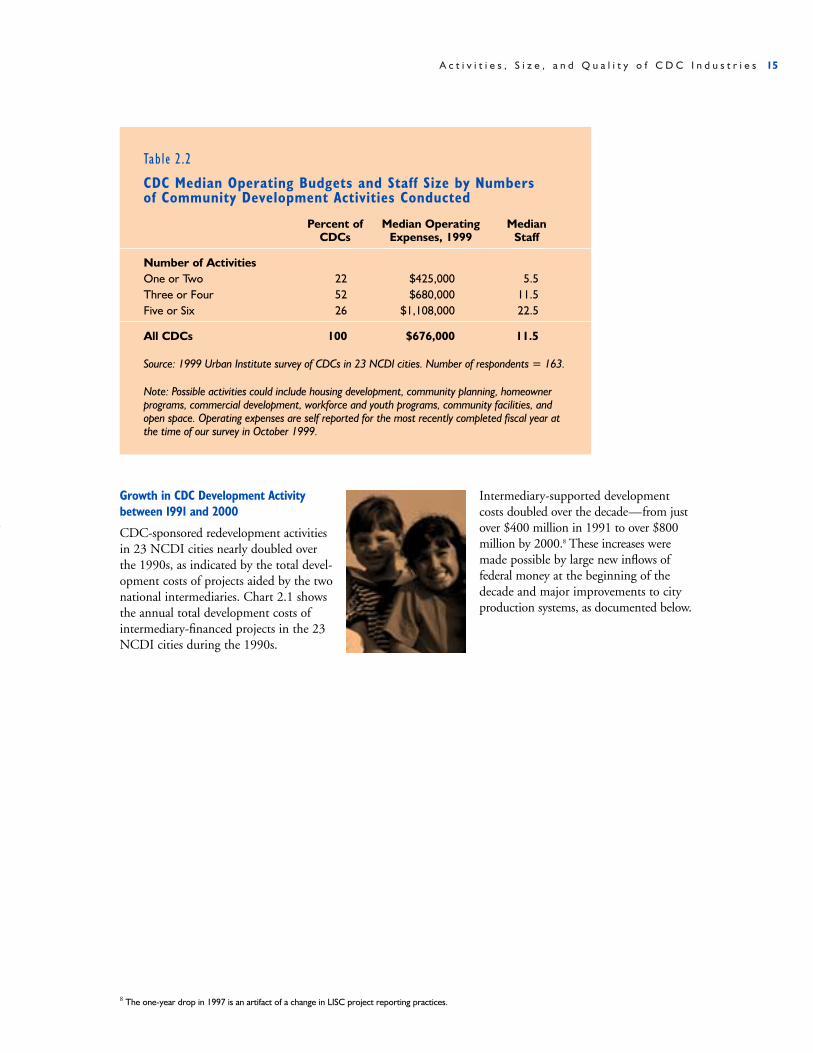
As the table implies, organizations pursue differentnumbers and mixes of community development activ-ities. Some organizations prefer to specialize in one ortwo activities they do well; others aspire to take on asmany types of activities as organizational abilities andfunding opportunities permit. As a result, the CDCindustry nationwide, as well as in particular cities, isinternally diverse. Table 2.2 depicts the variation innumbers of activities, median operating budgets, andmedian staff size for the capable CDCs that respondedto the survey.
About one quarter of CDCs may be thought of as“comprehensive” in terms of the numbers of activitiesthey pursue. These groups average million-dollar oper-ating budgets and employ a staff of 23, about doublethe average for CDCs in the group.7
Table 2.1
Past, Current, and Planned CDC Conduct of Community DevelopmentActivities (Percent of CDCs)
Conducted New in Planned Total NewBefore 1999 1999 2000–2001 or Planned
Housing Development 91.8 1.2 1.0 2.2Planning and Organizing 73.6 6.7 6.2 12.9Homeowner Programs 63.8 5.5 4.9 10.4Commercial Development 49.1 11.0 8.6 19.6Workforce and Youth 46.6 9.2 8.0 17.2Community Facilities 37.4 7.4 14.1 21.5Open Space 22.1 6.1 8.6 14.7
Source: 1999 Urban Institute survey of CDCs in 23 NCDI cities. Number of respondents = 163.
4 Researchers opted to confine estimates of industry size to only “capable” CDCs in order to exclude the large number of “letterhead” organizations,which have produced few, if any, units and do not contribute in a meaningful way to neighborhood improvement.
5 Factor analysis of responses to a survey of experienced CDCs shows how their individual programs have grouped together in the past. For example, CDCsthat do owner-occupied rehabilitation are very likely to provide homeownership counseling as well. CDCs that operate workforce development programs alsooperate youth programs. We have combined the many individual programs we asked about in the survey into the general categories listed in the table above.
6 This percentage does not account for the groups that may have planned to drop commercial programs in 2000 or 2001. To continue the example, 15.8percent of groups that operated commercial programs at any time between 1991 and 1998 did not do so in 1999. This translates into an approximate“attrition” rate of approximately 2 percentage points per year, for an expected 4 percentage point “loss” in 2000 and 2001, producing a net estimate of theincrease in percentage of groups doing commercial development of 15.6 percent.
7 The CDCs in the survey were larger than average, compared to those responding to the latest NCCED triennial census, which records an average$300,000 operating budget and staff of six. See National Congress for Community Economic Development (1998).
A c t i v i t i e s , S i z e , a n d Q u a l i t y o f C D C I n d u s t r i e s 15
Growth in CDC Development Activitybetween 1991 and 2000
CDC-sponsored redevelopment activitiesin 23 NCDI cities nearly doubled overthe 1990s, as indicated by the total devel-opment costs of projects aided by the twonational intermediaries. Chart 2.1 showsthe annual total development costs ofintermediary-financed projects in the 23NCDI cities during the 1990s.
Intermediary-supported developmentcosts doubled over the decade—from justover $400 million in 1991 to over $800million by 2000.8 These increases weremade possible by large new inflows of federal money at the beginning of thedecade and major improvements to cityproduction systems, as documented below.
Table 2.2
CDC Median Operating Budgets and Staff Size by Numbersof Community Development Activities Conducted
Percent of Median Operating MedianCDCs Expenses, 1999 Staff
Number of ActivitiesOne or Two 22 $425,000 5.5Three or Four 52 $680,000 11.5Five or Six 26 $1,108,000 22.5
All CDCs 100 $676,000 11.5
Source: 1999 Urban Institute survey of CDCs in 23 NCDI cities. Number of respondents = 163.
Note: Possible activities could include housing development, community planning, homeownerprograms, commercial development, workforce and youth programs, community facilities, andopen space. Operating expenses are self reported for the most recently completed fiscal year atthe time of our survey in October 1999.
8 The one-year drop in 1997 is an artifact of a change in LISC project reporting practices.

16 Community Development Corporations and their Changing Support Systems
Growth in Industry Size between 1990 and 1998
In the 23 NCDI cities, the number of CDCs able to carry out redevelopment activities and the scope of those activities as reflected in operating budgetsincreased dramatically over the 1990s. But not allcities grew at the same rate, nor did industries changein the same way, from 1991 to 2001:
• The number of CDCs able to produce annuallymore than 10 housing units (or their commercialequivalent) nearly doubled. These so-called capableCDCs grew from an average of 4.5 CDCs per cityto 8.3 per city (Walker and Weinheimer 1998, 28).
• The number of CDCs with strong local reputationsfor efficient production, governance, and manage-ment—the top tier groups—grew from an averageof 2.1 per city to 3.8 per city.
• CDC operating expenses—shown above to be agood proxy for the breadth of activities CDCsundertake—grew by about 150 percent from 1991to 1997 (the last year for which reliable informationwas available).
The most spectacular gains occurred in the smallestCDC industries, where operating expenses grew bynearly 250 percent. For the most part, these industries
Chart 2.1
Total Development Costs of CDC ProjectsSupported by National Intermediaries in NCDI Cities (1991–2000)
1,000
800
600
400
200
0
1991 1992 1993 1994 1995 1996 1997 1998 1999 2000
Year of Financial Transaction
Source: Compiled by the Urban Institute based on information supplied by the Local Initiatives Support Corporation and the Enterprise Foundation. Includes all projects that received loans, grants, or tax credits from intermediary-affiliated national syndicators.
Dol
lars
in m
illio
ns

Chart 2.2
Percent Change in City Total CDC Expenditures, by Categories of 1990 CDC Industry Size (1990–1997)
300
250
200
150
100
50
0
1990 1991 1992 1993 1994 1995 1996 1997
Source: Compiled by Urban Institute from IRS tax return data and National Center for Charitable Statistics.
Note: Size categories based on quartiles of total CDC expenditures in 1990.
Perc
ent
A c t i v i t i e s , S i z e , a n d Q u a l i t y o f C D C I n d u s t r i e s 17
are in cities that had no well-established track recordof public support for community and neighborhooddevelopment activities prior to the 1990s. Theseindustries received substantial infusions of newexternal aid through the NCDI over the decade. Buteven in the largest CDC industries at the beginningof the decade, total operating budgets of capableCDCs nearly doubled in size.
Chart 2.2 shows the change in total operating expensesfor all “capable” CDCs in the cities included in each
quartile of industry size in 1990. We grouped cities by quartile so as not to compare changes in very smallCDC industries to those of the largest industries,which we expected would grow more slowly thanothers. The composition of the resulting quartiles andthe cutoff expense totals used to define them is shownin the box below.9
Although CDC industries generally grew over thedecade, the growth occurred in different ways in dif-ferent cities. Some cities showed strong gains in the
9 Because Columbus had no capable CDCs in 1990 and we did not have data for the few Atlanta CDCs in that year, we used 1992 data as the beginningpoint for those cities.
n Smallest
n Low-Medium
n High-Medium
n Largest

18 Community Development Corporations and their Changing Support Systems
number of groups that met our basic standard ofcapability or in the percentage of groups that passedan additional test of having a top tier reputation.Other cities showed gains in CDC operating funding.(See text box, below.) Only a few, most notablyPhiladelphia, recorded gains in both the number and quality of groups and in operating expenses.
Variations in Industry Strength across Cities
CDCs did not improve everywhere across the board.Even in cities where operating budgets grew mostrapidly, some CDCs known locally as strong organiza-tions did not increase their budgets accordingly. Andsome CDCs that showed large increases in operatingexpenses did not always strengthen their ability to
Composition of Quartiles in Chart 2.2
Smallest From$600,000
To$1,599,999
Atlanta, Columbus, San Antonio,
Detroit, Kansas City,Denver
Low-Medium From$1,600,000
To$3,999,999
Baltimore, Dallas, Oakland,
St. Paul, Portland, OR,Indianapolis
High-Medium From$4,000,000
To$7,499,999
Seattle, Cleveland, Miami, Boston,
Phoenix, Washington, D.C.
Largest From$7,500,000
To$40,000,000
Philadelphia, Newark,Chicago,
Los Angeles, New York City
Types of Change in CDC Industries
Cities showing strong increases in the numberor quality of CDCs but average or below-average gains in operating expenses
Cities showing strong increases in CDCoperating expenses but average gains orbelow-average gains in the number andquality of groups
Baltimore, Atlanta, Los Angeles, Newark, Cleveland,and Boston
Growth in operating expenses reflected a generaluplift in industry activities, spread across a number ofCDCs and neighborhoods.
Seattle, Portland, OR, Oakland, Miami, and Indianapolis
Growth in operating expenses was generally concen-trated in one or two groups,10 which became newindustry leaders. These tended to be groups thatincreased or solidified their reputation as organi-zations that took on a wide range of communitydevelopment activities.
10 In Seattle, HomeSight accounted for most of the increase; in Portland, OR, Northeast CDC; in Oakland, the Unity Council; in Miami/Dade County,Opa Locka CDC; and in Indianapolis, Eastside Community Investments. Both Eastside in Indianapolis and Northeast in Portland, OR have declined consider-ably from their 1997 peaks.

A c t i v i t i e s , S i z e , a n d Q u a l i t y o f C D C I n d u s t r i e s 19
carry out development projects effectively. This dis-tinction between size and quality applies to wholeindustries, and measures of industry size and qualitycan be used in combination to arrive at overall assess-ments of industry strength. Later sections of this paperwill show how differences in industry strength at theend of the 1990s were tied to differences in city com-munity development systems.
In the fall of 2000, local LISC and Enterprise staff in each of the 23 NCDI cities were asked to rate thequality of the CDC industries they serve. To do so,they used six rating factors and performance standardsdevised by Urban Institute researchers in cooperationwith LISC, Enterprise, and the NCDI Secretariat.11
The factors are the following:
• Effective Program Delivery, as shown by the indus-try percentage of CDCs with a reputation for good,neighborhood-appropriate, strategically framedprojects, ability to produce to scale, and ability tomanage assets;
• Strategic Alliances, as shown by the industry per-centage of CDCs engaged in partnerships aimed atdevelopment and community building;
• Command of Information Technology, includingthe industry percentage that use it effectively forinternal management as well as for analysis ofneighborhood trends and communitycommunication;
• Community Leadership, as shown by the share ofCDCs with a community planning process, withboards and staff representative of the neighborhoods
11 The NCDI in its first 10 years was managed by a Secretariat consisting of several consultants, working part time for NCDI, who staffed the Initiative onbehalf of the funders’ group and monitored the Initiative’s results.
Figure 2.1
CDC Industry Strength at the End of the 1990s
Source: Urban Institute field researcher ratings (Industry Size) and Local LISC/Enterprise staff (Industry Quality).
Note: Size is a composite of a number of groups and total operating expenses; quality is a composite of six CDCcapacity rating factors. See text.

20 Community Development Corporations and their Changing Support Systems
they serve, and participa-tion in civic bodies andadvocacy efforts.
• Effective Governmentand Management,as shown by the shareof CDCs with strongmanagement systems,staff expertise, and boardmembership;
• Capacity to Attract Funding and Staff, as shownby the industry share of CDCs that are financiallysound, broadly funded, and capably staffed.
Local staff assessments on each indicator were summedto produce an overall industry quality score for thecity. To produce an industry size estimate, the numberof capable CDCs, the percentage of top tier groups,and CDC operating expense levels were combinedinto a summary measure of industry size for 1991 and1997 (the last year of good operating expense data).12
Figure 2.1 shows the result.
The quadrants in the chart are defined by the averagesize of industries and the average quality scores thoseindustries received. Industries in the top right quadrantare comparatively large CDC industries with goodlocal quality reputations. Industries in the top leftquadrant are comparatively small CDC industrieswith good local quality reputations. Many cities donot fall into an extreme category as defined by thebox, but for 10 of the cities, assessments of overallindustry strength are relatively unambiguous. These10 are shown in table 2.3, below.
What Explains the Relative Performance ofthe 23 Cities?
In the discussions to follow, we will show that thestrongest industries as shown in figure 2.1 also havesome of the best functioning community develop-ment support systems. Research will show that NewYork City, Cleveland, Portland, OR, and Seattle havefour of the top five best functioning community devel-opment systems. (Boston has the fifth.) Washington,D.C.—one of the strong industries on the chart—has a superior capacity-building system, which helpsoffset its complex and inefficient production system.Research also will show that Los Angeles, Miami, and Dallas have the weakest production and capacity-building systems. The other city in the weakestquartile—Columbus—created competent produc-tion and capacity-building systems only in the pastseveral years.
But overall, CDC capacity improved in nearly everyNCDI city—primarily because one or more of thebuilding blocks of the community development systemimproved. We turn first to the production system andhow it changed.
Table 2.3
Categories of CDC Industry PerformanceGroup A Group B Group C Group D
Larger industries with fair to strong localreputations for quality
Smaller industries withfair to strong localreputations for quality
Larger industries withweak to fair localreputations for quality
Smaller industries withweak to fair localreputations for quality
New York CityWashington, D.C.Cleveland
Portland, OR Seattle Baltimore
Los AngelesMiami
ColumbusDallas
12 The reason for the lag in reporting is the typically late filing of I -990s (because no tax payments are ever required).

Changes inProduction Systems
3s e c t i o n
Historically complex and inefficient, community development production systems improvedover the 1990s, especially for affordable housing. New subsidies from federal and localsources helped stimulate new bank lending, which was widely viewed to be easier to
obtain for CDC projects as the 1990s progressed. National intermediaries, most notably the LocalInitiatives Support Corporation and The Enterprise Foundation, supplied large amounts of hard-to-get predevelopment funding to CDC projects, which went partway toward filling a long-standinggap in the affordable housing financing system. These funds also helped CDCs move into new typesof community development activities, most notably the development of for-sale housing, commer-cial centers, and community facilities. By the end of the decade, some CDCs were in position totake full advantage of new national sources of support for housing and commercial development.
Production System Characteristics and Problems
A community development production system includesthe relationships among people and institutions thatmobilize, allocate, and regulate the use of land andcapital for community development purposes.
Generating affordable housing is by far the primaryactivity of the community development productionsystem. For CDCs to produce homes and apartments,the production system must offer them access tofinancing. Two important developments occurred dur-ing the 1990s: (1) Local governments boosted theirfunding for production systems and (2) intermediariesincreased their role in making the production systemwork for CDCs.
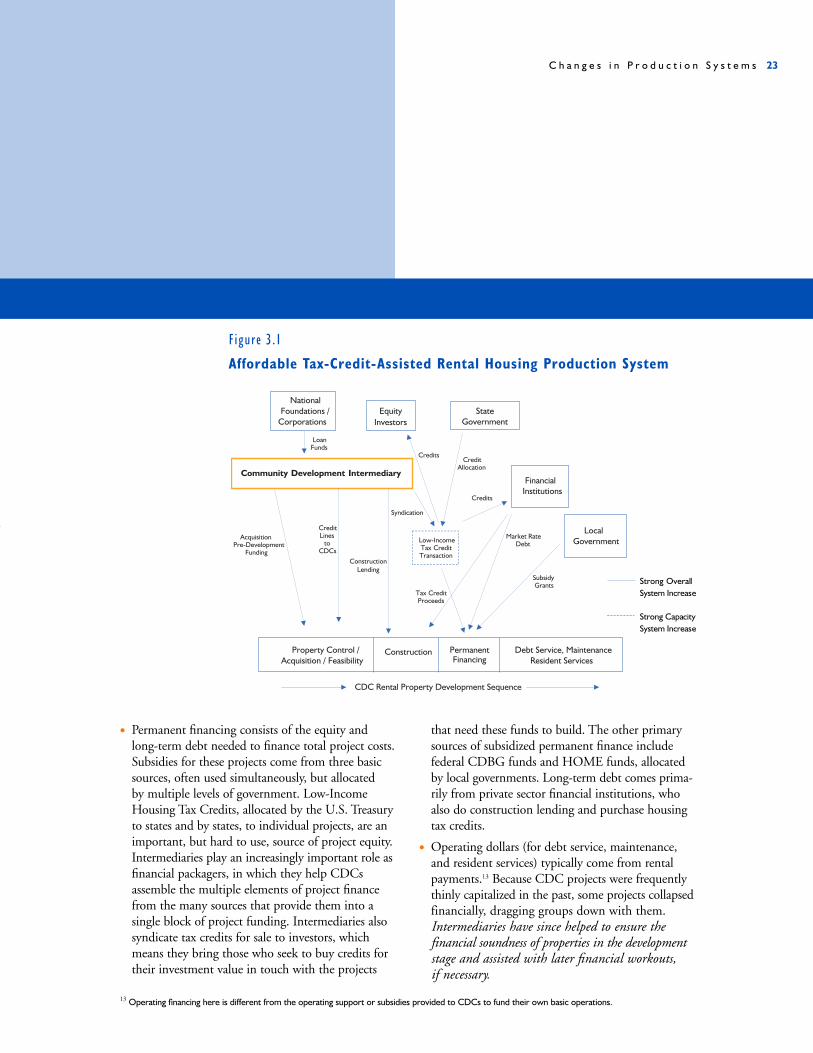
To understand the critical contribution made byintermediaries in supporting CDC participation inthe community development production systems,figure 3.1 graphically displays the complexity of thehousing finance system. As the figure illustrates, com-munity development intermediaries support housingdevelopment at multiple points in the process, thereby
reducing (but certainly not eliminating) the burdensuch a fragmented system places on CDCs.
At the bottom of figure 3.1 are the types of fundingrequired to finance affordable housing, displayed fromleft to right in the sequence in which these funds areusually provided.
• Predevelopment funds (for property control,acquisition, and feasibility studies) allow developersto acquire land and buildings and to develop designand financial documents needed to construct proj-ects. Traditionally in short supply, particularly forCDCs with few retained earnings from which tofinance new development, predevelopment fundingwas provided by intermediaries in large amountsover the 1990s to fill a chronic funding gap.
• Construction monies pay for actual project devel-opment. Funds for this high-risk project phase also have not traditionally been available from private lenders at favorable terms, particularly where CDCs had not yet established a strongreputation for competent project development or construction management.
C h a n g e s i n P r o d u c t i o n S y s t e m s 23
• Permanent financing consists of the equity andlong-term debt needed to finance total project costs.Subsidies for these projects come from three basicsources, often used simultaneously, but allocated by multiple levels of government. Low-IncomeHousing Tax Credits, allocated by the U.S. Treasuryto states and by states, to individual projects, are animportant, but hard to use, source of project equity.Intermediaries play an increasingly important role asfinancial packagers, in which they help CDCsassemble the multiple elements of project financefrom the many sources that provide them into asingle block of project funding. Intermediaries alsosyndicate tax credits for sale to investors, whichmeans they bring those who seek to buy credits fortheir investment value in touch with the projects
that need these funds to build. The other primarysources of subsidized permanent finance includefederal CDBG funds and HOME funds, allocatedby local governments. Long-term debt comes prima-rily from private sector financial institutions, whoalso do construction lending and purchase housingtax credits.
• Operating dollars (for debt service, maintenance,and resident services) typically come from rentalpayments.13 Because CDC projects were frequentlythinly capitalized in the past, some projects collapsedfinancially, dragging groups down with them.Intermediaries have since helped to ensure thefinancial soundness of properties in the developmentstage and assisted with later financial workouts, if necessary.
13 Operating financing here is different from the operating support or subsidies provided to CDCs to fund their own basic operations.
Figure 3.1
Affordable Tax-Credit-Assisted Rental Housing Production System

24 Community Development Corporations and their Changing Support Systems
Any one of these types of funding may be subsidized,typically from federal sources, but large amounts ofsubsidy are particularly important for permanentfinance, since low-income residents cannot generallyafford housing financed at market rates.
The production system includes regulatory elementstoo, such as zoning and other land use regulations,occupancy and other permitting requirements, andlaws relating to acquisition and disposition of tax-foreclosed properties. These financial and regulatoryelements interact in complex ways, and multipleagencies are almost always involved. The productionsystem for affordable housing is notoriously compli-cated and inefficient. The multiple levels of govern-ment, financing sources, and regulatory activitiesrarely work together easily.
Production System Changes over the 1990s
In general, over the 1990s, production systems nation-wide increased their performance in six important ways:
1. National community development intermediaries—LISC and Enterprise—moved aggressively tocreate new financial products that filled chronicgaps in the nonprofit portion of the affordablehousing finance system.
Two products were especially important: (1) predevel-opment and construction funding and (2) lines ofcredit and other sources of bridge funding. Financing
for these early project phases is especially difficult tosecure due to uncertainties over the financial viabilityof projects, the level of subsidies to be provided, cityregulatory approvals, and long-term financing.
As chart 3.1 illustrates, LISC and Enterprise suppliedmore than $300 million in predevelopment and con-struction loans and grants in the 23 NCDI cities dur-ing the 1990s. The two intermediaries committed an average of about $28 million per year from 1991through 1997, before a sharp upswing at the end ofthe decade, with 2000 levels approaching $60 million.14
In some cities, the LISC and Enterprise funds attractednew predevelopment and construction funds from private lenders, as shown by the extensive field researchconducted for this report. In Chicago, for example,NCDI funding no longer needs to be used for prede-velopment because local banks now provide it atcompetitive rates. Field research also suggested thatlong-term financing for CDC projects became morereadily available, that is, CDC projects that earliermight have struggled to find permanent finance fromprivate banks on affordable terms were in the enviableposition of having multiple banks vie with one anotherto make loans.
With the upswing in real estate markets during the1990s, many CDCs reported to field researchers thatthey had to compete more aggressively with privatedevelopers in their neighborhoods for land, and
Chart 3.1
Total Intermediary Acquisition, Predevelopment and Construction FinanceProvided to CDC Projects in NCDI Cities, 1991–2000
80
70
60
50
40
30
20
10
0
1991 1992 1993 1994 1995 1996 1997 1998 1999 2000
Year of Financial Transaction
Source: Compiled by the Urban Institute based on information supplied by the Local Initiatives Support Corporation andThe Enterprise Foundation. Includes all projects that received loans or grants from local intermediary offices.
Dol
lars
in M
illio
ns
14 The upswing in 1995 followed by a drop in 1996 is due to a one-time, idiosyncratic increase in project funding commitments made using NCDI funding.

C h a n g e s i n P r o d u c t i o n S y s t e m s 25
project costs typically rose. The competitive advantagewent to CDCs that could access capital quickly,move fast on real estate opportunities, and developa pipeline of projects that ensured that, as every dealwas completed, another revenue-generating projectwould be ready to begin. Intermediary fundingenabled CDCs to act faster and compete moresuccessfully with private sector builders.
2. The affordable housing industry learned how touse Low-Income Housing Tax Credits, in placesince 1986, far more efficiently (Cummings andDiPasquale, 1999). Intermediaries played a keyrole in helping CDCs compete with large nonprofitdevelopers as well as for-profit builders to obtaintax credits from state agencies responsible forallocating them.
Chart 3.2 shows the number of tax credit and non-taxcredit units supported by LISC and Enterprise in the23 NCDI cities between 1991 and 1998. Over theperiod, tax credit units represented about 46 percentof all units supported. The share of tax credit unitsmay be declining, however, reflecting increasing com-petition for credits in most states, the increasing costsof developing units in rising real estate markets, andthe slightly increasing share of homeownership units.Excluding the apparent single-year drop in non-creditunits in 1997 (an artifact of change in LISC projectreporting practices), chart 3.2 shows a gradual declinein the tax credit’s share of all units.
3. Private capital—at least for rental housing—became easier to secure during the 1990s, thanksto an overall upswing in rental housing produc-tion and the Community Reinvestment Act, whichencouraged banks to hike their lending volume,according to local informants. CDCs were amongthe principal beneficiaries.
Our analysis of data from the Home MortgageDisclosure Act confirms that the flow of mortgagecredit to low-income neighborhoods increased in the1990s in the 23 NCDI cities. The aggregate value ofhome purchase and home improvement mortgagesoriginated increased more in census tracts with over20 percent of the households in poverty than in less poor tracts. Total lending volume in central city poverty tracts in 1997 was 250 percent of totalvolume in 1990, compared with 200 percent forall metropolitan area tracts.
Field research uncovered considerable evidence thatthe Community Reinvestment Act (CRA) encouragedbanks to lend more aggressively to CDC-sponsoredprojects. The CRA obligates banks to make loans inareas where they take deposits, and bank performanceon this goal is monitored by federal regulatory agen-cies. Since enactment in 1977, CRA has been viewedby community activists as an important tool in keep-ing financial institutions involved in inner-citylending, and the bank mergers and acquisitions
Chart 3.2
Total CDC Units Developed with Intermediary Financial Assistance, 1991–1998
10,000
8,000
6,000
4,000
2,000
0
1991 1992 1993 1994 1995 1996 1997 1998
Year of First Transaction
Source: Compiled by the Urban Institute based on information supplied by the Local Initiatives Support Corporationand The Enterprise Foundation. Includes all projects that received loans or grants from local intermediary offices,and tax credit units syndicated by National Equity Fund and Enterprise Social Investment Fund.
Tota
l Num
ber
of U
nits
0
2000
4000
6000
8000
10000
n Non-Tax Credit
n Tax Credit

Chart 3.4
Change in Ease of CDC Access to Private Capital as Rated by Local Community Development Practitioners, 1991–2001
5
4
3
2
1
0
1991 1996 2001
Year
Source: Urban Institute field researcher ratings of NCDI city performance, 1997 and 2001.
Note: Rating range is from 1 (lowest) to 5 (highest). See text for definition of ‘5’ rating.
Ratin
g
26 Community Development Corporations and their Changing Support Systems
of the 1990s provided activists with new opportunitiesto review bank performance on CRA obligations. Inpart as a result, banks took care to ensure that theirlending records passed federal scrutiny, sometimessigning community lending agreements with localgovernments and other community representatives.At the same time, CDCs and others increased theirability to develop projects that met tests of financialsoundness, thereby creating effective demand forbank loans.
As uncovered in field research, CDC, local LISC and Enterprise, and local government staff generallypointed to an increase in availability of private capitalfor CDCs. These local community development prac-titioners were asked to rate—on a one-to-five scale—the ease with which CDCs could obtain private capitalfor real estate development deals. (The text box onpage 29, which displays the characteristics of a strongproduction system, describes what a “5” signifies onthis indicator.) Chart 3.4 displays the average ratings
Chart 3.3
Change in Home Purchase and Home Improvement MortgageVolume, 1992–1997 (Average of all 23 NCDI Cities)
250
225
200
175
150
100
1992 1993 1994 1995 1996 1997
Year
Source: Home Mortgage Disclosure Act data, 1992–1997.
Notes: Index is based on 1992 values, therefore all values in 1992 equal 100.
Inde
x of
Cha
nge
n MSA
n Central City
n Poor Tracts
n Poor Central Tracts

C h a n g e s i n P r o d u c t i o n S y s t e m s 27
across the 23 NCDI cities for 1991, 1996, and 2001.Average ratings increased from just under 3.0 in 1991to 4.3 in 2001, a 35 percent increase in the ratedavailability of private sector funds. Among all of theproduction system indicators we used, this one showedthe highest overall increase, one that pertained tonearly every NCDI city.
Banks continued to be perceived as strong supportersof community development nationwide, although not all banks were considered aggressive communitylenders. Nevertheless, our continuing investigationshave shown a perceived increase in the availability of private sector lending over the decade.15 Some ofthis increase may be due to short-term responses to
Table 3.1
Changing Character of CDC Activities Throughout the 1990s
Increased production of for-sale housing
The percentage of CDC for-saleunits increased over the 1990s, to20 percent of all CDC units. Theshift appears strongest in themost mature CDC industries:Boston, Chicago, Philadelphia, andCleveland, but signs of change areclear in many other cities.
Local policy shifted toward own-ership housing to build tax basesand stable neighborhoods. Shiftcame in part because the Low-Income Housing Tax Credit forrental housing became harder toget, and neighborhoods increas-ingly opposed even more low-income rental housing.
Increase in commercialredevelopment activities
More commercial activity found inhalf of NCDI cities, with specialemphasis in some, such asBoston, where over half of theCDCs became involved in com-mercial development.
In some cities, a move towardcommercial development came asCDCs exhausted the stock ofhousing in need of renovation. Inmany cities, commercial districtimprovements lagged behindthose in housing, suggesting needfor public policies toward retaildistricts.
Increase in communityfacilities investments
Increases appear to be a generaltrend, not limited to mature CDCindustries. Intermediaries fundedprojects in more than 13 cities,including Atlanta, Baltimore,Chicago, Columbus, Los Angeles,Miami, New York, Oakland,Philadelphia, Phoenix, Portland, OR,Seattle, and Washington, D.C.
CDCs became involved in devel-oping police substations, healthclinics, parks, charter schools,community centers, and day carecenters. New city policies inducedby need to renovate aging facilities,upswing in charter school move-ment, and increased attention byfoundation and other funders tothe need for comprehensiveapproaches to problems.
Increase in social servicesand community organizingactivities
Systems with strong CDC indus-tries urged CDCs to complementproduction with strategic neigh-borhood planning, includingtargeted needs assessments incommunities. Systems movedtoward social services, communityorganizing, and other non-bricks-and-mortar activities.
Intermediary support, especiallyin mature industries, improvedCDCs’ ability to identify and tar-get developments to communityneeds. Social service, organizing,and advocacy activities were amore natural link to core CDCactivities than some otheractivities—not as large a stretch.
Program Area Recent Changes Reasons for Changes
15 In view of the considerable difficulties in doing so, we did not collect information on the flow of funds to community development projects from privatesources. It is noteworthy that we found consensus in support of more easily available private lending among those who are sometimes skeptical of bankwillingness to lend on risky projects in poor neighborhoods. For an industry analysis that supports the view that CRA stimulates lending, see Nothaft andSurette (2002).

Chart 3.5
Intermediary Supplied Acquisition, Predevelopment, and Construction Financeto CDC-Sponsored, Non-Housing Projects in NCDI Cities, 1991–2000
20
15
10
5
0
1991 1992 1993 1994 1995 1996 1997 1998 1999 2000
Year of Financial Transaction
Source: Compiled by the Urban Institute based on information supplied by the Local Initiatives Support Corporationand The Enterprise Foundation. Includes all projects that received loans or grants from local intermediary offices.
Tota
l Fun
ding
in M
illio
ns o
f Dol
lars
28 Community Development Corporations and their Changing Support Systems
Community Reinvestment Act pressures and newlyavailable inner-city markets. Better knowledge ofurban markets and lenders’ heightened confidence inCDC developers also contributed.
4. Increased federal funding for housing substantiallyeased competitive pressures on local housing resourcesand opened up new opportunities for nonprofitdevelopers to expand production.
The new federal HOME program, authorized in 1991,doubled annual funding available to local govern-ments for affordable housing, from $1.5 billion to$3 billion nationwide (HUD 1997). CDCs were alsobetter able to compete effectively for these resources.
5. Throughout the country, some local governmentscreated their own funding sources for affordablehousing, particularly through capitalization of trust funds from the proceeds of dedicated tax revenues.
6. Together with improvements to capacity-buildingsystems, production systems encouraged entry ofCDCs into new types of community developmentactivities.
Not all CDCs could expand easily into non-housingareas. Moving into new areas stretches a CDC’s staffand operating systems because of the need to learnnew techniques and funding streams. In some cities,local funding was not freely available to all CDCsinterested in undertaking a broader range of
community development work. To enter into newareas, CDCs typically need to form new partnershipsor relationships with funders and other service pro-viders, both in and out of the neighborhood. Becauseexpansion can tax organizational resources, many fun-ders encourage CDCs to engage in partnerships withother providers rather than assume full responsibilityfor expanded community development activities.
These expansions of CDC activity have been encour-aged in some cities by creation of new production andcapacity-building programs. And commercial develop-ment expansion, in particular, is likely to get a strongboost from the New Markets Tax Credit and nationalintermediary efforts to encourage its use.
Over the 1990s, intermediary support for theseactivities grew, as local LISC and Enterprise officesresponded to heightened CDC demand for a moremultifaceted approach to neighborhood problems. City governments, too, became more willing to investin community development resources in an expandedarray of neighborhood projects. Chart 3.5 shows theexpansion of interim financial support by the inter-mediaries for non-housing projects in four areas:commercial development, industrial projects, com-munity facilities, and mixed-use projects (which contain several of community, commercial, industrial,or housing uses).
n Commercial
n Industrial
n Community Facility
n Mixed Use

C h a n g e s i n P r o d u c t i o n S y s t e m s 29
Beginning in 1993 after influx of new funding fromthe National Community Development Initiative,financial support for non-housing projects rose fromvery small annual figures to around $4 million. In1997, the investment grew sharply and continued to do so over the rest of the decade, reaching nearly$16.6 million in 2000. The amount is modest com-pared to the $60 million invested by intermediaries in all CDC project activities in 2000, but the amountsare substantial compared to 1991. The rise in 1997reflects a new influx of NCDI funding and theinitiation of a new emphasis on community facilitiesconstruction or renovation in NCDI cities.
Differences in Quality of Local Production Systems
Although throughout the 1990s, certain elements of production systems got better across the 23 cities,some cities have managed to put in place a compara-
tively efficient and effective financing and regulatorypackage. Others have not. Using some basic indica-tors of production system quality, Urban Instituteresearchers and local LISC and Enterprise staff separately rated the quality of local production systems. The box above shows the indicators used,and the standards that define the best possibleperformance on each indicator.
The strongest systems across the whole range of indicators are New York, Portland, OR, Seattle,Cleveland, Baltimore, and Boston. Weaker systemsinclude Detroit, San Antonio, Miami, and LosAngeles. The 1990s witnessed strongest improve-ments in Portland, OR, Seattle, and Indianapolis.
Generally speaking, the biggest influence on the overall size of the CDC industry across cities is the
Table 3.2
Indicators of a Strong Production System
1) City FundingCity government uses all or nearly all its federal community development funding (e.g., HOME and CDBG) tosupport housing and neighborhood improvements sponsored or implemented by community-based organiza-tions and contributes substantial amounts of its own revenues (special levies or other sources) as well.
2) State FundingState government provides strong housing and economic development project support in addition to mort-gage revenue bond finance and low-income tax credits, and inner-city neighborhoods and CDC projects areclearly favored in funding allocations.
3) Access to Project FinancingSufficient acquisition, predevelopment, construction, and permanent finance are always available from publicand private sources, and most CDCs have access to funding needed to get good projects completed in atimely way.
4) Efficiency of Financing DeliveryState and local, and public and private, sources of finance (permanent, construction, and predevelopment)are efficiently retailed to developers of for-sale and rental housing. And relatively inexperienced developerscan get both rental and for-sale deals done without extensive hand holding.
5) Private Sector FinancingRelative to its size and amount of public subsidy for housing and community development, the systemappears to mobilize large amounts of private sector lending for community development projects. CDCscan easily find private capital for development projects. Most bankable projects get funded on competitiveterms and transaction costs are the same as typical commercial lending deals.
6) Merit-based Project AwardsThe system of project financing as a whole can be described as having a very strong relationship betweenproject merit or “bankability” and the likelihood of its being subsidized. Political influence rarely causes lessmeritorious deals from being funded before more meritorious ones.
Source: NCDI City Portraits, completed by local LISC/Enterprise staff in NCDI cities.

30 Community Development Corporations and their Changing Support Systems
Examples of Strong Production SystemsCleveland: The key to Cleveland’s success is themarriage of the city’s public, private, and nonprofitsectors and increasingly sophisticated array of long-term project funding. Foundations and corporationscreated and funded Neighborhood Progress, Inc.(NPI) to provide a link between foundations, thecorporate world, and CDCs. By decade’s end, pre-development funding and commercial credit weremore readily accessible than in the early 1990s. Cityhousing funds went primarily to CDCs, and the city’sHousing Trust Fund required that all new construc-tion projects solicit CDC involvement The city hasbecome more efficient at foreclosing on tax-title anddelinquent land, which has brought properties online faster and helped CDCs take advantage of thesedeals. Another important feature of Cleveland’s sys-tem is the Cleveland Housing Network (CHN), anumbrella housing production network formed andcontrolled by area CDCs, which has grown to include 19 CDCs by 2000. In the early 1990s, Enter-prise staff noted that NCDI’s greatest impact in thecity was through the production boost it helped fundunder CHN’s lease-purchase program. In 1999,CHN raised over $1.65 million from the City ofCleveland, State of Ohio, HUD, ESIC, and Enter-prise for its Capital Improvements Fund and alsoused Enterprise funds to capitalize a new $800,000line of credit for its lease-purchase program. Today,CHN is reputed to be one of the most stable affordable housing organizations in the UnitedStates, producing 230 affordable, single-family homes every year.
New York City: By 1991, CDCs were effective hous-ing producers as a result of the continuous stream ofcity-owned (in rem) properties and financing fromthe city’s Department of Housing Preservation and
Development (HPD), which strongly supported nonprofit participation. As a result of the in rem pro-gram, funds flowed to the CDCs from several othersources, creating a highly structured financing sys-tem with established roles for the city, state, privatelenders, CDCs, intermediaries, and investors. LISC,Enterprise, and the city worked hard to structureworkable programs, and as the city’s vacant stockwas depleted, the two intermediaries were bothsuccessful in working with the city to develop newprograms for three new types of properties. NCDIenhanced LISC’s and Enterprise’s ability to diversifytheir activities, allowing them to undertake an inno-vative child care facilities program as well as (forLISC) a range of economic development projects.
Seattle: The City of Seattle had begun investing sub-stantial CDBG and HOME funds in housing early inthe decade, and had originated a total of $160 millionin bond issues in from 1980 to 1995. Furthermore,a special real estate tax levy was originated to payfor housing rehabilitation and development. Citysupport largely went to nonprofit developments.The Washington Community Reinvestment Alliance(WCRA) generated a $75 million fund to make per-manent mortgages at below-market rates. The StateHousing Finance Commission and several banks cap-italized the Washington Community InvestmentFund with $18 million in loans for acquisition andphase II development financing. Predevelopmentfunding became more readily available throughLISC/NCDI and several public sources, and com-mercial credit for construction and permanent loansalso became more readily available. Several lendersin the city described intense competition to lend toCDC projects due to CRA pressures and the poten-tial profitability of projects.
amount of federal housing and community develop-ment aid it receives. For example, Chicago’s vastlylarger amounts of federal CDGB and HOME fund-ing, and the city’s guaranteed allocation of low-incomehousing tax credits, account for much of the differ-ence between its production levels and those of smallercities, for example, Portland, OR.16 But once
differences in funding levels are taken into account,poor production system performance appears to con-strain CDC industry size. For example, Chicago andLos Angeles receive similar levels of federal funding,but Chicago’s CDC industry is substantially largerthan that of Los Angeles, in part the result of theformer’s generally superior production system.
16 See Walker and Weinheimer (1998) for an extended discussion of the relationship between industry size and the volume of subsidy available to fundprojects. By the end of the 1990s, subsidy volume was the single biggest influence over the size of CDC industries.

C h a n g e s i n P r o d u c t i o n S y s t e m s 31
Examples of Weak Production SystemsDetroit: The weaknesses and inefficiencies of thecity’s development department have lowered theappetite of private developers to work with thecity and CDCs, and generated little bank supportfor community development. The city’s inability toprocess HOME applications resulted in a backlogof funds (which the city almost lost as a result). It took anywhere from six to eight months fromproject award to a city contract, and then anotheryear for the funds to be available. Nonprofits areforced to seek other capital to complete projects,to be reimbursed at later dates. The city was alsoslow in moving land acquisition, permitting, andpublic infrastructure improvements and was notfully supportive of CDC involvement in affordablehousing. Michigan State Housing DevelopmentAgency (MSHDA) policies for allocating CDBG and HOME funds also were problematic becauseallocations to CDC projects were contingent upon the city providing matching funds. Lengthyprequalification processes and difficulties acquiringlocal matching funds made it difficult for CDCs tocircumvent city bureaucracy.
San Antonio: CDCs in San Antonio were relativelyyoung and funding for projects was initially limitedto HOME set-asides for CHDOs. The three largestCDCs in the city were favored by existing fundingsources, and city politics made it difficult for newand emerging CDCs to establish track records. In1999, respondents noted that the city’s $21 millionCDBG dollars were allocated largely on the basisof political ties, not merit. City inefficiencies inallocating the funds were also problematic. Butover the last several years, the San AntonioDevelopment Authority (SADA) and the city’sNeighborhood Action Department were restruc-tured to rely increasingly on nonprofits for housingservices. Bank lending improved slightly since theearly 1990s, but lack of awareness about suc-cessful lending models, as well as concern aboutcity slowness and CDC abilities, has dampenedtheir eagerness to support CDC projects.
Further, it appears as if improvements to productionsystems and the flow of project funding have helpedproduce increases in the size of CDC industries. Fivecities showed strong increases in industry expenditures,but not in the number and quality of groups (Seattle,Portland, OR, Oakland, Miami, and Indianapolis).Three of these showed strong production system
improvements over the decade (Seattle, Portland, OR,and Indianapolis), suggesting that changes in city pol-icy and production system quality may have increasedthe flow of resources to the CDC industry. Of theother two, Miami/Dade’s industry growth appearslinked to large increases in disaster assistance fundingthroughout the mid-1990s.

32 Community Development Corporations and their Changing Support Systems
Continuing Challenges and New Opportunities
The 1990s were an era of considerable growth in city production capacity and CDC participation inaffordable housing development. New federal fundsto subsidize housing development, new intermediarysources predevelopment and construction finance,more competitive application for low-income housingtax credits, and more easily available capital fromprivate financial institutions all came together toproduce this result.
The CDC industry in most cities is unlikely to see a second decade of growth resembling the first one. In most NCDI cities, CDCs are close to taking fulladvantage of available subsidies, which are beingsqueezed by rising development costs, more competi-tion within a growing CDCindustry, flat federal fundinglevels, and ups and downs instate and local funding.Indeed, in several cities wehave found that city officialshave begun to ration subsidyacross CDCs and other projectdevelopers by such methods asestablishing per-project fund-ing limits or restricting devel-opers to one project per year.
What are realistic targets for production system growthand improvement over the new decade? If CDCs andtheir local supporters can defend the territory alreadywon, we should expect to see the following:
• New emphasis on reforms to city production sys-tems, which have the potential for freeing up con-siderable amounts of tax-foreclosed, city-ownedproperty for transfer to CDCs. Although progresscan be expected to be slow, new political attentionto the quality of city services can be expected insome cities, as reform mayors seek to modernizecity management across a number of areas.17
• Attention to the CDC role in preservation ofaffordable housing, principally including the earliesttax credit projects and expiring-use Section 8 proj-ects. Successful CDC involvement in acquisition of these projects from for-profit owners is critical to their continuing ability to secure state tax creditallocations, as most states have already begun to earmark credits for renovation of “preservation”properties.
• Continuing build-out of the CDC portfolio ofcommunity facilities projects, which have begun toreceive new municipal government and local LISCand Enterprise funding, and which match someCDCs’ more diversified approaches to neighbor-hood change, including social services, education,workforce, and youth development programs.
• Aggressive CDC entry into commercial revitaliza-tion activities, supported by new federal tax credits
for economic developmentprojects, and building onrecent moves by some CDCindustries to support retailstrip improvements as a missing component of overall neighborhood revitalization strategies.
17 We averaged scores across all CDCs without taking into account differences across cities. What is remarkable is how well these results compare with theresults from our expert interviews.


Changes in Capacity-Building Systems
4s e c t i o n
The chronic organizational problems that afflict CDCs are long-standing, but over the 1990s,considerable progress was made in constructing or improving state-of-the-art capacity-building systems to help overcome these difficulties. Both local LISC and Enterprise staff
and CDC staff recognize the organizational improvements CDCs have made, especially in corefinancial systems, and their generally strong performance in establishing and maintaining communityties. But there is a clear sense that CDCs remain financially vulnerable, especially in view of themore expanded set of community development responsibilities they have assumed. But capacity-building systems that support CDCs have made very strong gains over the 1990s. Cities withalready solid capacity-building systems improved their systems and innovated; cities that began the1990s with rudimentary systems made considerable strides. Regardless of where and how gainstook place, national intermediaries played a key role in bringing about the advances.
How Capable Are CDCs and How Has This Changed?
Even though CDCs earn fees from the projects theybuild, the groups cannot fully pay for internal opera-tions from the profits of development deals. That’sbecause CDCs typically concentrate their redevelop-ment initiatives in one or two low-income neighbor-hoods, and they do not seek out the most profitabletransactions. On the contrary, CDCs often undertakethe hardest, least profitable developments in a neigh-borhood. They redevelop costly historic properties orbadly deteriorated buildings on prominent communitysites, or properties that cannot be fixed for a cost thatcan be recouped with rents that poor people can afford.CDCs’ community purposes drive them to take onneighborhood planning and community organizingactivities that impose additional organizational costs.
As shown below, community development corpora-tions have not resolved all of the capacity issues thathave plagued the sector for many years. According tolocal LISC and Enterprise staff, however strong CDCsmay be in their connections to the communities in
which they work, their funding bases tend to be nar-row and board and staff capacity has not kept up withincreases in programmatic responsibility. CDCs’ ownstated priorities for future organizational improvementscall for strengthened fundraising, above all. However,the larger and more comprehensive organizationsreport greater progress in building capacity, perhapsreflecting the priority attention they may receive fromcapacity-building systems.
The community development capacity-building systemconsists of the relationships among people and insti-tutions that serve to accumulate and allocate resourcesto strengthen organizations’ ability to pursue communitydevelopment purposes.
The core function of the capacity-building system isto bolster CDCs’ capacity to function effectively asredevelopment organizations. This capacity has sixgeneral elements: (1) program delivery; (2) ability todevelop alliances with other entities; (3) communityleadership; (4) command of information technology;

C h a n g e s i n C a p a c i t y - B u i l d i n g S y s t e m s 35
(5) effective internal governance and management;and (6) ability to attract and retain funding and staff.18
Detailed descriptions of these elements can be foundin the accompanying text box. (These descriptionswere used by local LISC and Enterprise staff as theyrated the quality of CDC industries in each city.)
Local LISC and Enterprise staff find that CDCs retainstrong links to their communities but need to improveas development entities. The ratings of various capacityelements in chart 4.1 show CDCs to be comparativelystrong on dimensions of community leadership and
the strength of the alliances they forge inside and out-side of their neighborhoods.19 This is the conclusionreached by local LISC and Enterprise staff across 23 NCDI cities, and is seconded by field researchconducted by members of the Urban Institute NCDIassessment team. This conclusion also is supported byCDCs’ own estimates of their capacity as reported insurvey research conducted for the NCDI assessment.But industries are weaker in terms of reputation foreffective program delivery and command of informa-tion technology.
18 With the exception of information technology, these capacity elements are discussed at greater length in Walker and Weinheimer (1998).
19 The chart shows average local LISC and Enterprise staff ratings for each general grouping of capacity indicators. The scale at the bottom of the chartshould be read as the approximate share of CDCs across the 23 cities that perform well on the indicator, using the following key: 1=no CDCs; 2=onequarter; 3=one half; 4=three quarters; and 5=all.
Chart 4.1
Local LISC and Enterprise Staff Ratings of CDC Industry Quality in NCDI Cities, 2001
CommunityLeadership
Strategic Alliances
Governance/Management
Effective ProgramDelivery
InformationTechnology
0 1 2 3 4 5
Average Rating
Source: Compiled by the Urban Institute based on city “portraits” prepared by local staff of the Local Initiatives SupportCorporation and The Enterprise Foundation, fall 2001.
Note: Ratings range from 1 (lowest) to 5 (highest). For definition of categories, see text.

36 Community Development Corporations and their Changing Support Systems
Effective Program Delivery
Share of CDCs with a reputationamong community developmentpractitioners (politicians, admin-istrators, bankers) for on-time,on-budget, and high-quality projects.
Share of CDCs with a reputationamong community developmentpractitioners for a mix of projectsand programs appropriate forneighborhoods they serve.
Share of CDCs that do projectsin ways likely to produce ademonstrable impact in neigh-borhoods, e.g., because theyare investing strategically or in a comprehensive way.
Share of CDCs able to produceprojects to scale.
Share of CDCs (by themselvesor through agents) able to man-age assets effectively, e.g., byensuring timely collections, ade-quate cash reserves, and goodtenant policies.
Strategic Alliances
Share of CDCs engaged inalliances and partnerships withactors within their neighbor-hoods—community organiza-tions, businesses, public agencyoffices—to do physical revital-ization activities.
Share of CDCs engaged inalliances and partnerships withactors outside their neighbor-hoods—political leaders, bankers,foundation staff—to implementphysical revitalization activities.
Share of CDCs engaged inalliances and partnerships withactors within their neighbor-hoods to implement a broadcommunity developmentagenda (e.g., community safety).
Share of CDCs engaged inalliances and partnerships withactors outside their neighbor-hoods to implement a broadcommunity development agenda.
Information Technology
Share of CDCs with computersystems able to handle manage-ment information, financial man-agement, e-mail communications,Internet research, and the like.
Share of CDCs routinely gather-ing and analyzing neighborhood,city, and regional data, throughcomputerized or other means,as part of community or pro-gram planning.
Share of CDCs maintaining web pages, neighborhood chatgroups, or computer technologyto communicate with their con-stituencies (or funders).
Indicators of CDC Industry Quality
Moreover, CDCs as a group do not have a particularlydiverse funding base and have not increased staff sizeand expertise commensurate with increases in programand project needs. These are shown by the ratingsfor individual items comprising the closely relatedGovernance and Management and the Staff Attractionand Retention categories—the areas along with pro-gram delivery in which most CDCs receive technicalsupport from local capacity-building systems. Chart4.2 shows that the highest-rated aspects of governanceand management are the expertise of CDC staff andleadership and the basic financial soundness of organi-zations. Most likely, researchers would not haveexpected this result if local LISC and Enterprise staff
had been asked to perform these ratings at the begin-ning of the 1990s.
These conclusions reached by intermediary staff areseconded, for the most part, by CDC staff assessmentsof changes in their own organizations and their priori-ties for the future. CDCs report that between 1995and 1999, they made the most progress in buildingdevelopment capacity, followed by gains in communitylinkages and community organizing. (See chart 4.3.20)Economic development ability and core capacityimproved, but not as strongly. The most comprehen-sive groups (those carrying out five community
20 Because the empirical relationships defined the groupings used in the chart, and the fact that CDCs were asked different questions than were local LISCand Enterprise staff, the indicators and dimensions shown on the chart do not correspond to those listed in the exhibit on this page.

C h a n g e s i n C a p a c i t y - B u i l d i n g S y s t e m s 37
Community Leadership
Share of CDCs with a process(strategic planning, neighborhoodmeetings) to obtain views ofstakeholders and residents andinform them of CDC policiesand programs.
Share of CDCs with boardsrepresentative of the neighbor-hoods they serve.
Share of CDCs with staffs that reflect the social anddemographic makeup of theneighborhoods they serve.
Share of CDCs with a voice inlocal and regional governmentalor civic associations thatadvocate for or carry outdevelopment, workforce, and other policies.
Share of CDCs that engage inadvocacy on local regulatory orresource allocation policies forcommunity development.
Effective Government and Management
Share of CDCs with effective,current, financial managementsystems, e.g., clean annual audits,annual operating budgets, solidfinancial recordkeeping, etc.
Share of CDCs with effectiveboards, i.e., that work effectivelywith staff, exercise appropriateoversight, and network effec-tively.
Share of CDCs that take advan-tage of, or create, trainingprograms for board and staff on important issues.
Capacity to Attract Funding and Staff
Share of CDCs that are finan-cially sound—e.g., maintainadequate cash reserves, maketimely payments to vendors andstaff—and are relatively stablefinancially.
Share of CDCs with seniorexecutive and project staff withskills to carry out projectseffectively.
Share of CDCs that haveincreased staff size and expertiseto match increases in programneeds over the past few years.
Share of CDCs with a diversefunding base, i.e., from founda-tions, corporations, city govern-ment, neighborhood individuals,and businesses and programincome.
Source: NCDI City Portraits, completedby local LISC/Enterprise staff in NCDIcities.
development activities or more) reported strongerimprovements in core capacity, community organiz-ing, and economic development programs than didless comprehensive groups, perhaps reflecting theamount and value of support larger groups receive incommunity development capacity-building systems.The corroboration of local LISC and Enterprise staffassessments by CDC self-assessments suggests thatcapacity-building program investments in core CDCcapacity have paid off.
Further, CDCs’ future priorities are consistent withintermediary staff assessments of CDC industry weak-ness. CDC staff placed highest priority, on average,to building core capacity, including fundraising andboard and staff development. But different groupsalso tended to have different future capacity-buildingpriorities. Although everyone prioritized fundraising,which would appear to be an endemic priority, com-prehensive groups seek future growth in the same areaswhere they registered gains in the past—communityorganizing and economic development. More narrowlyactive groups, which tend to have smaller staffs andbudgets, placed priority on partnerships and betterboard and staff.

38 Community Development Corporations and their Changing Support Systems
Creation and Growth ofNew Capacity-BuildingSystems in the 1990s
There is reason to believethat capacity within CDCindustries has grown, andalso that much remains tobe done. Creation of newcapacity-building programs,especially the increasingnumber of those that follow
best national practice in allocating operating support,appear to be responsible for much of the increase inCDC capacity over the 1990s. These programs are thecornerstone of the capacity-building system, and asthe next section will show, are important to the effec-tive exercise of community development leadership.These same programs are critical to continued abilityof CDCs to make progress in meeting organizationalcapacity-building goals.
The most critical element of the capacity-building system is the delivery of operating support. Thesefinancial subsidies pay for staff, overhead, facilitiesand equipment, and training. In recent years, capacitybuilding has expanded to include broader, systemicefforts to build human capital for the communitydevelopment sector by, for example, encouraging insti-tutions of higher education to train the next generationof practitioners.21
Until the 1990s, CDC capacity-building systemsconsisted primarily of the weakly coordinated, ad hocactivities by corporations, foundations, and city gov-ernments to support CDC operations. The mostcommon approach was to provide small, unrestrictedgrants for CDC operations, as illustrated in figure 4.1.(In the chart, only the funding relationship is shown,but CDCs, for their part, are obliged to report back to multiple funders.) The system was woefully ineffi-cient: CDC directors spent so much time seekingoperating grants that projects and thoughtful redevel-opment strategies suffered. Corporate, foundation,and government donors were bombarded withfunding requests. And when they said “yes,” fundersoften failed to specify any performance obligations orestablish measures to access and monitor performance.
The creation of new capacity-building systems usingintermediaries in key roles radically improved the sit-uation. The new systems enabled funders to collabo-rate on operating support. The systems demandedorganizational improvements by CDCs in return foroperating support and helped groups diagnose areasin need of improvement. They provided access totechnical aid and monitored whether or not perform-ance benchmarks were met. The net result was to givefunders much more assurance that their money wouldbe well spent.
In the new capacity-building systems, funders’ oper-ating grants went not to individual CDCs directly,but into a common pool managed by an operatingsupport collaborative, as shown in figure 4.2. (As infigure 4.1, the CDC reporting relationship to itsfunders is not shown.) The local office of LISC orEnterprise typically created and staffed the collabora-tive. These collaboratives took on a range of programs,including operating support, technical assistance,policy and communications, and others.
Percent of CDCs Citing ListedItem as One of Their Priorities forOrganizational Improvement, 1999
Percent
Core CapacityFundraising 45.3 Board and Staff 32.4
Development CapacityHousing Development 37.2 Asset Management 24.3 Financial Management 19.6
Community Organizing Community Organizing 23.6
Economic DevelopmentBusiness and Economic Programs 25.7 Workforce Programs 12.8
Organizational TiesPartnerships Inside Neighborhood 13.5 Resident Involvement 13.5 Partnerships Outside Neighborhood 8.8
Source: 1999 UI Capable CDC Survey. N=163
21 Together with the Ford Foundation, the NCDI funders created the Human Capital Development Initiative (HCDI), which aims to build the skills of com-munity development practitioners and encourage the entry of young professionals into the field. The HCDI experience is being documented by the Centerfor Urban Policy Research, Rutgers University.

C h a n g e s i n C a p a c i t y - B u i l d i n g S y s t e m s 39
Chart 4.2
Local LISC and Enterprise Ratings of the General Quality of CDC Governanceand Management in NCDI Cities, 2001
Leader and Staff Expertise
Financial Soundness
Effective Financial Systems
Board and Staff Training
Effective Boards
Diverse Funding Base
Staff Size Commensurate with Programs
0 1 2 3 4 5
Average Industry Rating
Source: Compiled by the Urban Institute based on city “portraits” prepared by local staff of the Local Initiatives SupportCorporation and The Enterprise Foundation, fall 2001.
Note: Ratings range from 1 (lowest) to 5 (highest). For definition of categories, see text.
Chart 4.3
CDC Staff Rating of Changes in Organizational Capacity, 1995–1999
Development Capacity
Organizational Ties
Community Organizing
Economic Development
Core Capacity
0 0.1 0.2 0.3 0.4 0.5 0.6 0.7 0.8
Average Rating on a Scale of -1 to 1
Source: 1999 UI Capable CDC Survey. N=163.
Note: Ratings may range from –1 (declined) to +1 (improved).
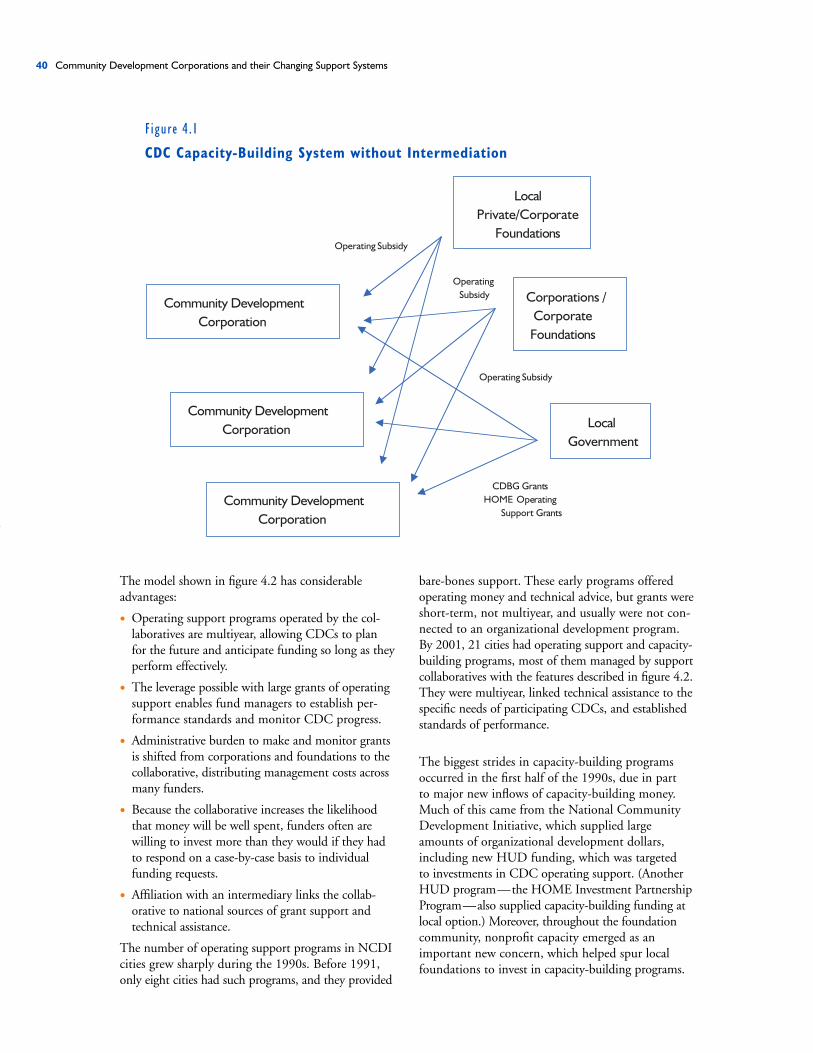
40 Community Development Corporations and their Changing Support Systems
Figure 4.1
CDC Capacity-Building System without Intermediation
The model shown in figure 4.2 has considerableadvantages:
• Operating support programs operated by the col-laboratives are multiyear, allowing CDCs to planfor the future and anticipate funding so long as theyperform effectively.
• The leverage possible with large grants of operatingsupport enables fund managers to establish per-formance standards and monitor CDC progress.
• Administrative burden to make and monitor grantsis shifted from corporations and foundations to thecollaborative, distributing management costs acrossmany funders.
• Because the collaborative increases the likelihoodthat money will be well spent, funders often arewilling to invest more than they would if they hadto respond on a case-by-case basis to individualfunding requests.
• Affiliation with an intermediary links the collab-orative to national sources of grant support andtechnical assistance.
The number of operating support programs in NCDIcities grew sharply during the 1990s. Before 1991,only eight cities had such programs, and they provided
bare-bones support. These early programs offeredoperating money and technical advice, but grants wereshort-term, not multiyear, and usually were not con-nected to an organizational development program. By 2001, 21 cities had operating support and capacity-building programs, most of them managed by supportcollaboratives with the features described in figure 4.2.They were multiyear, linked technical assistance to thespecific needs of participating CDCs, and establishedstandards of performance.
The biggest strides in capacity-building programsoccurred in the first half of the 1990s, due in part to major new inflows of capacity-building money.Much of this came from the National CommunityDevelopment Initiative, which supplied large amounts of organizational development dollars,including new HUD funding, which was targetedto investments in CDC operating support. (AnotherHUD program—the HOME Investment PartnershipProgram—also supplied capacity-building funding atlocal option.) Moreover, throughout the foundationcommunity, nonprofit capacity emerged as animportant new concern, which helped spur localfoundations to invest in capacity-building programs.
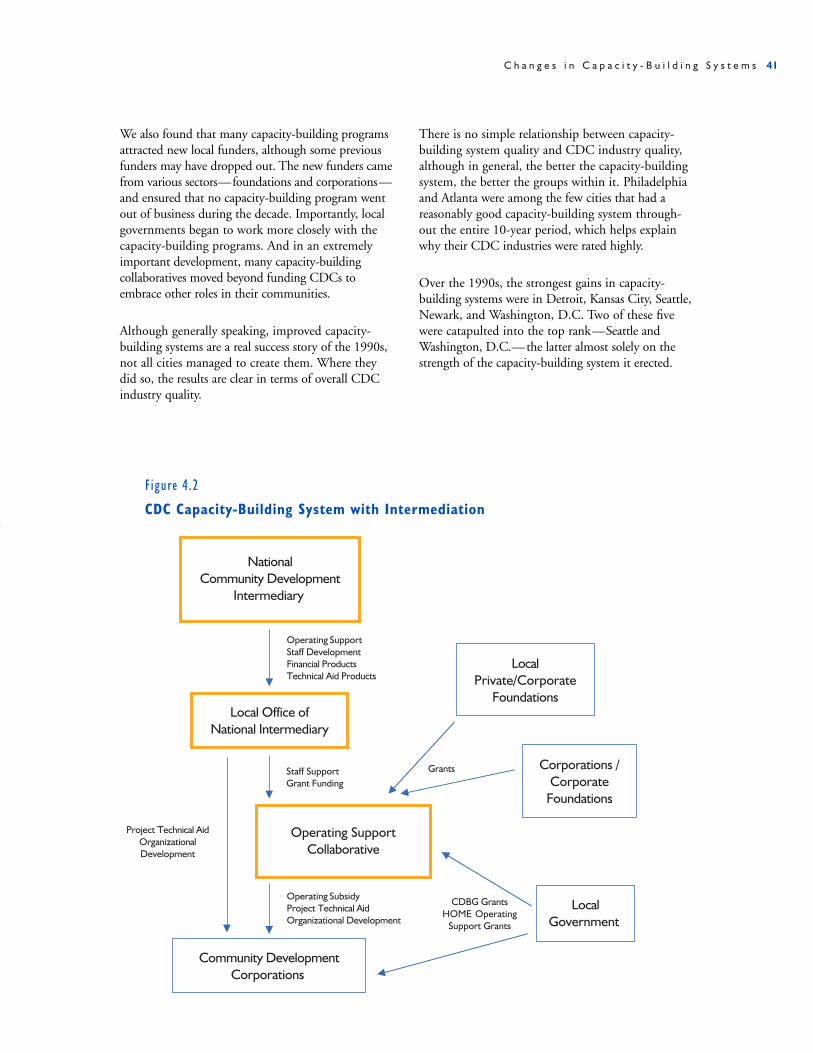
C h a n g e s i n C a p a c i t y - B u i l d i n g S y s t e m s 41
Figure 4.2
CDC Capacity-Building System with Intermediation
We also found that many capacity-building programsattracted new local funders, although some previousfunders may have dropped out. The new funders camefrom various sectors—foundations and corporations—and ensured that no capacity-building program wentout of business during the decade. Importantly, localgovernments began to work more closely with thecapacity-building programs. And in an extremelyimportant development, many capacity-buildingcollaboratives moved beyond funding CDCs toembrace other roles in their communities.
Although generally speaking, improved capacity-building systems are a real success story of the 1990s,not all cities managed to create them. Where theydid so, the results are clear in terms of overall CDCindustry quality.
There is no simple relationship between capacity-building system quality and CDC industry quality,although in general, the better the capacity-buildingsystem, the better the groups within it. Philadelphiaand Atlanta were among the few cities that had areasonably good capacity-building system through-out the entire 10-year period, which helps explainwhy their CDC industries were rated highly.
Over the 1990s, the strongest gains in capacity-building systems were in Detroit, Kansas City, Seattle,Newark, and Washington, D.C. Two of these fivewere catapulted into the top rank—Seattle andWashington, D.C.—the latter almost solely on thestrength of the capacity-building system it erected.

42 Community Development Corporations and their Changing Support Systems
Indicators of a Good Capacity-Building System
Operating SupportCapacity-building money, including generaloperating support and technical aid, isavailable from state, city, foundation, andcorporate sources—all large potential sourcesof operating support have been tapped fortheir fair share.
Operating support is provided by a consistentlyoperated formal collaborative with multiplefunders, who delegate decisionmaking to aboard or advisory committee able to makedecisions on merit.
Operating support is available to CDCs on a multiyear basis.
Links between the local funding collaborative/program’s operating support and technicalassistance are strong and direct—assistanceneeds are identified throughout the fundingprocess, and funding and programming address these needs.
The collaborative/program clearly articulatesand uses organizational performance standards.
Human CapitalMost CDCs and divisions within city commu-nity development departments have people onstaff who have come out of other industries,for example, former bankers, corporate staff,government officials, and others who havemade early and mid-career transfers intocommunity development professions.
Local colleges and universities, including com-munity colleges, have active, high-quality, andwell-attended affordable housing/communitydevelopment certificate programs, and there is clear evidence that industry leaders haveparticipated in these programs.
CDC associations and other communitydevelopment advocacy coalitions/associationsfrequently sponsor seminars and trainingsessions, scholarship programs, and otherefforts to build the human capital of existingCDC staff.
Source: NCDI City Portraits, completed by localLISC/Enterprise staff in NCDI cities.
The overall improvements of capacity-buildingsystems over the 1990s could not have taken placewithout the strong role of the national intermediariesand the value of the operating support and othercapacity-building assistance they provided, includingthe amounts funded by the National CommunityDevelopment Initiative.
In the 23 NCDI cities, the amounts of fundingsupport LISC and Enterprise provided to increaseCDC capacity rose substantially, as shown in chart 4.5. The chart shows that grant support fromboth intermediaries rose from a mere $5 million in 1991 to $20 million by the end of the decade.These funds consisted of dollars raised by intermediarieslocally, as well as the national support provided byNCDI and the U.S. Department of Housing andUrban Development, through NCDI.
The general improvement in operating supportprograms, including the formation of collaborativesthat meet new national standards of practice, alsoowes much to the national intermediaries, whichdisseminated best practices throughout their fieldnetworks, and to external funding, which played animportant role in helping foster local improvements.When HUD joined the NCDI at the beginning of 1994, the agency supplied substantial amounts of new, capacity-building funding. HUD’s entrytriggered intermediary development and implemen-tation of NCDI-wide organizational developmentprograms to help CDCs use and report on the newfunding. These programs were later expanded toinclude broader organizational support.

C h a n g e s i n C a p a c i t y - B u i l d i n g S y s t e m s 43
Chart 4.4
Changes in Operating Support Program Quality, As Rated by CommunityDevelopment Practitioners (1991–2001)
5
4
3
2
1
0Offers Multiyear Links to Operating Requires CDC to
Support Support and Meet Performance targetsTechnical Assistance
Source: Urban Institute field researcher ratings of NCDI city performance, 1997, 2001.
Note: Ratings range from 1 (lowest) to 5 (highest). See text for definition of ‘5’ rating.
Ratin
g
n 1991
n 1996
n 2001
Chart 4.5
Capacity-Building Funding Commitments, 1991–2000
20
15
10
5
0
1991 1992 1993 1994 1995 1996 1997 1998 1999 2000
Year of Financial Transaction
Source: Compiled by the Urban Institute based on information supplied by the Local Initiatives Support Corporationand The Enterprise Foundation. Includes all projects that received loans or grants from local intermediary offices.
Note: Capacity-building funding includes loans and grants for operating support, technical assistance, and programexpenditures (e.g., staff positions for community organizing).
Dol
lars
in m
illio
ns

44 Community Development Corporations and their Changing Support Systems
Quality of CDC Industries and Capacity-Building Systems
Quality of Capacity-Building Quality of CDC IndustriesSystems in 2000
Highest: Portland, OR, Boston, Cleveland, NewYork City, Seattle, Washington, D.C., Columbus
Four of the five cities—Portland, OR, Cleveland,New York, and Seattle—are the top-ranked citiesin terms of industry quality, as shown by programdelivery, alliances, information technology, govern-ment and management, capacity to attract andretain staff, and community leadership.
Mid-range: Baltimore, Philadelphia, Atlanta,Detroit, Kansas City, San Antonio, Denver,Oakland, St. Paul, Newark, Miami, Indianapolis
Highest quality industries in this group areBaltimore and Atlanta. Lowest are Miami and Columbus.
Lowest: Chicago, Phoenix, Los Angeles, Dallas Two of the four cities—Los Angeles and Dallas—are the lowest-ranked cities in terms of industryquality.
Generally speaking, operatingsupport programs act as a plat-form for strengthening each ofthe six CDC capacity elementsdiscussed above —effective pro-gram delivery, strategic alliances,information technology, govern-ment and management, abilityto attract and hold staff, andcommunity leadership. In mostcities, operating programs haveimproved the link betweenoperating dollars and comple-mentary technical assistance.Most programs have begun to adopt performancestandards to assess the progress of funded groups; insome cases, organizations that fail to make reason-able progress have lost funding. Performance testing,now used increasingly, has had important system-wide effects as funders, and CDCs themselves raiseexpectations to match the performance standardsused by the collaborative.
Continuing Challenges and New Opportunities
There can be little doubt that CDCs as a groupimproved their ability to carry out development proj-ects over the 1990s, supported by new operating sup-port programs and technical assistance, particularly aschanneled through local funding collaboratives. Local
LISC and Enterprise and CDCstaff agree that CDCs are strong,overall, in their ability to exer-cise leadership on behalf oflow-income communities, andhave been effective at partneringwith leaders and organizationsinside and outside the neigh-borhoods in which they work.Local intermediary staff are lesscomplimentary of CDC masteryof information technology,diversity of funding, boardeffectiveness, and the ability
of CDC staffing levels to keep pace with a broadenedcommunity development agenda.
Fortunately, the 1990s have laid the groundwork fora sustained effort to help CDCs take on new types oforganizational challenges. So long as operating supportcollaboratives can sustain the flow of core supportfunds and technical aid to CDCs, funders with a stakein the health of CDCs can direct resources to newareas of concern. Specifically, the links the collabora-tives have forged among funding, performancestandards, monitoring, organizational assessments,and technical support convey the leverage neededto improve CDC performance still further. Over thenext decade, we should expect to see the following:

C h a n g e s i n C a p a c i t y - B u i l d i n g S y s t e m s 45
Selected Top-Rated Capacity-Building Systems in 2000
ClevelandFormed in the late 1980s, the Cleveland Neighbor-hood Partnership Program (CNPP) was funded by Enterprise, LISC, Neighborhood Progress, Inc.(NPI), and the City of Cleveland. CNPP providedmultiyear operating funding based upon CDC busi-ness plans, their identification of target areas, andgoals for their neighborhoods. By 2001, CNPP’snine largest grantees were awarded $75,000 –$150,000 renewal grants to create and implementcomprehensive neighborhood plans for targetedareas. Six CDCs received renewals of specialpurpose grants averaging $40,000.
Portland, ORThe Portland Neighborhood Development SupportCollaborative (PNDSC), made up of the city, a consortium of private funders called the Neighborhood Partnership Fund (NPF), andthe Enterprise Foundation, provided operatingsupport to several of the city’s CDCs. By 2001,PNDSC had been through two cycles (in fouryears) of jointly allocating from the city and privatesources to CDCs. In the 1999 program year, forexample, of PNDSC’s $1.8 million annual alloca-tion, NCDI funds comprised 25 percent, NPF contributed 25 percent, and the City of Portlandinvested 50 percent. One of PNDSC’s mostimportant contributions was that it rationalizedproject funding by packaging several grants frommultiple funders into larger, single grants that covered multiple activities. Furthermore, PNDSCcooperated with the association of CDCs toimprove asset and property management practicesthrough training, joint learning, and benchmarking.
SeattleSeattle’s Community Development Collaborative(SCDC), a collaborative providing multiyear coreoperating support to CDCs, leveraged funds fromseveral organizations including LISC and the Cityof Seattle. In 1999, for example, SCDC leverageda five-year, annual disbursement of $900,000 from the city’s Office of Economic Development.Meanwhile, the city’s Office of Housing negotiatedto provide an additional $200,000 annual contribu-tion. SCDC also implemented a strategy to assistCDCs in developing and implementing five-yearbusiness plans which formed the bases for invest-ment decisions by the funders. In 1999, SCDCprovided $1.4 million in operating support toseven CDCs.
Washington, D.C.The Community Development SupportCollaborative (CDSC) is a consortium of 30 foun-dations, banks, and intermediaries. It provides policy guidance, operational support, and manage-ment assistance grants to 10 CDCs. CDSC drewthe support of LISC and Enterprise, and in the2000 program year, CDSC provided $840,000 incore operating support, technical assistance, andtraining to eight CDCs. In the early 1990s, LISCused $500,000 in NCDI funding to capitalize thecollaborative, bringing it closer to its target of$2 million. The collaborative has been extremelysuccessful and has grown to $3 million per three-year funding round.
46 Community Development Corporations and their Changing Support Systems
• Continuing efforts to complete unfinished businessin the area of CDC ability to manage their assets,including financial restructuring for projects thathad been poorly underwritten and financed inthe past, and in the area of basic production skills,which need to be continuously provided to offsetthe effects of turnover among technical staff;
• Increased attention to CDC ability to use the latestinformation technologies, including Internet-basedcommunity organizing and neighborhood outcomemonitoring, as well as the use of more sophisticatedapproaches to tracking project finances, distance-learning and skill building for staff, and communi-cation with and reporting to funders;
• New efforts to ensure organizational accountability,including stronger board development programsand other efforts to ensure better oversight by direc-tors, community members, and public and privatefunders of CDC operations and projects;
• More attempts to secure city government participa-tion in operating support collaboratives, whichwould help ensure that all local operating funding isprovided to CDCs based on merit, and that groupsreceiving funding are accountable for results.
As CDCs develop more diverse community develop-ment portfolios in response to neighborhood changes,shifts in city policy, and backing from LISC andEnterprise local offices and their partners, more and more operating support collaboratives can beexpected to expand their roles in community devel-opment. This may require them to take on new funding partners, but also to establish relationshipswith other institutions and organizations outside thefield’s traditional boundaries. These may include fun-ders and other groups devoted to family and childwelfare, prisoner reentry, parks and recreation, andworkforce development. This will place new chal-lenges before the community development collabora-tives, but also greatly expand the potential gains from their investments.


Leadership Systems
5s e c t i o n
The number one accomplishment of the community development leadership system in the1990s was the creation or strengthening of strong intermediary institutions—the collabora-tions, partnerships, coalitions and alliances, and other bodies that help engage leaders from
multiple sectors as contributors to community development. These intermediaries, which includethe local offices of the Local Initiatives Support Corporation and The Enterprise Foundation, helpengage citywide institutions—government, foundations, financial institutions—and communityorganizations in cooperative efforts to pursue community-based neighborhood revitalization.
Leadership Systems and Their Problems
Within cities, community development is among themany legitimate claimants on financial support andpublic attention. Cash-short municipal governmentsmust provide basic services, operate increasinglyexpensive criminal justice systems, pay huge publicpension costs, and pay for other urgent needs.Community developers, including CDCs and theirsupporters, must participate in the give and take overcompeting strategic and financial choices.
Their ability to successfully claim a share of publicresources in a contest with other powerful claimantscannot be taken for granted. Although a certain levelof affordable housing and community developmentfunding can be expected each year from federalsources, these funds are not always used to supportneighborhood revitalization strategies, versus scatter-shot investments throughout a city’s low-incomeareas. They are not always spent in ways that favorcommunity-based organizations or community-minded for-profit developers. And they are not alwaysused in ways that attract the support of other investorsin community change, such as banks, foundations,corporations, universities and hospitals, and othercity institutions.
It is the basic task of the leadership system to engagestakeholders in beneficial relationships with one anotherto mobilize and channel community developmentresources to neighborhoods. The leadership systemconsists of the relationships among CDCs and thosewho command community development resources.It is characterized by three sets of relationships:
• Among system-wide stakeholders, who includerepresentatives from the public sector, privatelenders and other corporations, foundations,and representatives of civic bodies;
• Among neighborhood stakeholders, includingleaders of prominent community corporations,community-based organizations, locally importantbusinesses, and political operatives and electedofficials; and
• Between system-wide and neighborhood stakehold-ers, where intermediary organizations stand, includ-ing local offices of national intermediaries, localintermediaries, community development coalitions,and other citywide advocacy groups.
To create strong leadership systems, community devel-opment practitioners and policymakers must engagesystem-wide and neighborhood stakeholders in jointpursuit of neighborhood revitalization.

L e a d e r s h i p S y s t e m s 49
Indicators of Strong System Leadership
Community Development Strategies
Local political leadership has articulated a formalstrategy for preservation or upgrade of low-incomecommunities that guides planning and investmentdecisions by infrastructure, housing, parks andrecreation, economic development, and publicsafety agencies.
However strategies are articulated (formal docu-ment, informal understandings), decisionmaking inmost agencies clearly reflects the strategies articu-lated by political leaders.
There is agreement among public, corporate,banking, philanthropic, and nonprofit developmentsectors on strategies for city and neighborhoodrevitalization.
Community and Nonprofit Roles inCommunity Development
Public agency funding and policy decisions accordCDCs a central role in the delivery of governmentprograms in low-income neighborhoods; e.g.,through direct delivery of programs, as communityplanners and organizers, as advisors to publicagencies, etc.
The system for awarding project and organiza-tional funding accords priority to projects andactivities sponsored by developers (nonprofit, CDC,and for-profit) that act according to neighborhood“strategies,” and as an explicit part of the projectreview and decisionmaking process. Project andorganizational funding requests must conform tocommunity-accepted neighborhood strategies.
The system funds development of neighborhoodstrategies that include a “meaningful” process ofcommunity stakeholder participation in plan devel-opment (e.g., plans clearly reflect priorities articu-lated by the community).
Each of the public, corporate, philanthropic, andnonprofit community development sectors has anidentified leader or leadership group that publiclyand forcefully advocates for community commit-ments to neighborhoods and has the stature/cloutto secure those commitments.
Collaboration Within and Across Sectors inSupport of Community Development
Collaboration within sectors can be described asroutine within each of the public, corporate, phil-anthropic, and nonprofit community developmentsectors. There are established venues for collec-tive decisionmaking (associations, task forces, funder/lender collaboratives, and working groups)within which sector leaders adopt a common posi-tion on major community development issues.
Collaboration across sectors can be described asroutine across all of the public, corporate, philan-thropic, and nonprofit community developmentsectors. There are established venues for collec-tive decisionmaking (associations, task forces,funder/lender collaboratives, and workinggroups) that encourage sector representativesto address major community development issues-collaboratives. (Note: they need not agree onpositions.)

50 Community Development Corporations and their Changing Support Systems
Methods of Engagement
All leadership systems consist of relationships amongstakeholders, but in ineffective systems, relationshipsare weak and link together only a few influential indi-viduals. For example, in ineffective leadership systems,city agencies do not coordinate their investments withone another; community leaders have little influenceover agency decisions; banking industry representativesmaintain few lending relationships with communitydevelopment corporations; and foundations have noway to use program funding to leverage public agencyactions. At worst, these relationships are not onlyweak, but antagonistic.
Strong systems look very different in terms of thenumber and diversity of relationships among commu-nity development actors. Here, most of the importantactors are linked somehow with one another in rela-tionships that allow easy exchange of information,mutually beneficial trading of favors, and frequent discussion, debate, and negotiation on importantissues of community development policy. At theirbest, these relationships permit coordinated action to solve community development problems.
To create strong systems, community developmentpractitioners and policymakers face the task of
engagement: How can stakeholders be connected to one another in sustainable ways that produce realchanges in the flow of resources to neighborhoods? In community development, there are three primaryways to promote and sustain engagement:
• First, publicly articulated community developmentstrategies guide agency planning and investmentdecisions, which are backed by general agreementamong corporate, banking, philanthropic, and non-profit development sectors.
• Second, public and private strategies, funding poli-cies and programs, and regulatory activities accordneighborhood stakeholders a central place in com-munity development decisionmaking, supported by identifiable leaders in each sector who advocatefor commitments to neighborhoods.
• Third, structures of cooperation within and acrosssectors bring multiple parties together, allowingthem to forge productive relationships with oneanother and to agree on concrete communityimprovement policies and programs.
The text box on the previous page shows howresearchers defined the strength of local strategies,nonprofit and community roles, and collaborationin their field investigations. The box shows how highperformance was defined for each indicator.
Chart 5.1
Changes in CDC Prominence in Public Agendas, 1991–2001
4
3
2
1
0
1991 1996 2001
Year
Source: Urban Institute field researcher ratings of NCDI city performance, 1997, 2001.
Note: Ratings range from 1 (lowest) to 5 (highest). See text for definition of ‘5’ rating.
Ratin
g

L e a d e r s h i p S y s t e m s 51
Collaboration, clear public strategies, and strong non-profit involvement helps produce sustained resourcecommitments from stakeholders, and allows systemsto weather short-term shifts in resource availability,leadership changes, and other temptations to with-draw from engagement in community development.
Trends over the 1990s
What happened over the 1990s, and where do systemsstand now? Based on field research, we draw four con-clusions regarding the community development lead-ership as it stood in 2001.
1. CDCs’ role in local program delivery increased.
City government resource commitments are critical to the pursuit of community development activities as both the local and federal funds needed to invest in community development are allocated at the discre-tion of local governments. Therefore, positive views by local government elected leaders and agency stafftoward CDCs are vital to CDC ability to garner theresources they need to improve neighborhoods. Thesepositive views and the resources they bring are animportant (although by no means the only) aspectof the neighborhood-system stakeholder relationship.
Over the decade, public agency funding and policydecisions more often accorded CDCs a central role inthe delivery of government programs in low-incomeneighborhoods. This occurred in almost every NCDIcity. Chart 5.1 shows how local experts rated the roleof CDCs in public community development agendasin 1991, 1996, and 2001, using a one-to-five scale.The chart shows that most of this gain came over thefirst half of the decade, when new federal housingdollars became available, some earmarked for CDCsand NCDI put large amounts of new project andcapacity-building funding into the nonprofit sector,and the Washington administrations of both partiesemphasized the role of community-based organizationsin urban development.
This commitment to CDCs and the implied commit-ment to neighborhoods it represents were not alwaysbacked by real dollars, as we know from field inter-views and CDC survey results. Even if concreteresources were not always forthcoming from local governments, however, important actors in most systems at least paid lip service to the value of com-munity-based development. In some cities, this was a considerable advance over the skepticism that pre-vailed in 1990.
Chart 5.2
Changes in Collaboration among Community Development Actors in NCDICities as Rated by Local Community Development Practitioners, 1991–2001
4
3
2
1
0
Within Sectors Across Sectors
Type of Collaboration
Source: Urban Institute field researcher ratings of NCDI city performance, 1997, 2001.
Note: Ratings is range from 1 (lowest) to 5 (highest). See text for definition of ‘5’ rating. A collaboration is withinor across government, finance, foundation, and CDC industry sectors.
Ave
rage
Rat
ing
n 1991
n 1996
n 2001

52 Community Development Corporations and their Changing Support Systems
2. Cooperation increased within and across sectors inpursuit of neighborhood development.
Relationships among system-stakeholders are a secondcomponent of community development leadershipsystems. We found a strengthening of relationshipsamong government and private-sector actors in themost mature community development systems. In nascent CDC industries, private-sector leadersbecame engaged around issues of neighborhooddevelopment, and rudimentary collaborations formedto craft and debate a new neighborhood agenda.
Chart 5.2 displays the results of our survey of localexperts on how well their leadership system collabo-rates for community development. These expertsreported that collaboration had increased across the board in the 1990s, both within sectors and across sectors.
3. Public community development strategies tendednot to be particularly strong or effectivelyimplemented.
Field interview results make clear that political andadministrative fragmentation remains a particularproblem for community developers across NCDI
Strong System Leadership in Selected Cit iesCleveland: Mayor Michael White supported theCDC system throughout his tenure, which gener-ated support from City Hall during the 1990s.Neighborhood Progress, Inc. has acted as leadintermediary with LISC and Enterprise to design a rational approach to capacity building. This col-laboration has increased the likelihood of effective-ness, attracted new resources, and created greateraccountability on the part of CDCs for meetingproduction and organizational development objec-tives. Organizing also has taken on new life inCleveland. Under the strong leadership of NPI, the concept of “neighborhood planning” in termsof spaces and places has become a focus of manyCDCs. The nine large grantees of the ClevelandNeighborhood Partnership Program (CNPP) areworking hard to create and implement compre-hensive neighborhood change plans for their target areas.
Portland, OR: Portland, OR is a star performer in terms of collaboration between the city, CDCs, intermediaries, and the private sector. The Portland Neighborhood Development SupportCollaborative (PNDSC) was formed in the mid-to-late 1990s and combined the previously separateprograms of The Neighborhood Partnership Fund(NPF) and The Enterprise Foundation with that ofthe City of Portland. NPF is an operating supportcollaborative that provides CDCs with multiyearfunding commitments tied to address both organi-zational development and community develop-ment needs. New leadership at PNDSC’s housing
division created more predictable procedures forpursuing funds and rationalized timing to try to fit with cycles of other funding sources and withproperty acquisition in a hot market. As a result,nonprofits were better able to compete for proj-ect subsidies and pursue tax credits and other outside resources.
Boston: Boston’s community development systemhas enjoyed strong mayoral support since the mid-1980s, and a Blue Ribbon committee of busi-ness people and practitioners was appointed in the late 1990s to find new sources of money and support for the housing production system.Broad support for the field exists in the privatesector, represented by an estimated 10 local inter-mediaries. Between 10 and 12 funders supportedNDSC through the 1990s, sponsoring several programs that have helped groups develop staff,do strategic planning and community organizing,and improve systems. Several lenders—such asBankBoston—were viewed as champions of theindustry locally, and have consistent track recordsof financing deals and creating institutions such as the city and state housing partnerships. Thereare also several new state-provided or -facilitatedfunding pools such as the $100 million state housingtrust fund, and two $100 million insurance pools.Each came about through intense lobbying by thehousing-advocate and CDC industries. And theentry of United Way as a major provider of operat-ing funding may be the best signal that CDC effortshave gained broad backing from local leaders.

L e a d e r s h i p S y s t e m s 53
cities, as few cities have worked out effective ways ofarticulating a consistent position on neighborhoodsand coordinating the work of multiple city agencies.Indeed, one reason why CDCs have gained promi-nence in the urban delivery system is that they becomede facto coordinators of public activities as a substitutefor bureaucratic methods of doing so.
4. Some cities have put together particularly strongleadership systems, others are notable for theirweaknesses.
As we found with other community development systems, cities were very different from one anotherin terms of their overall performance in system leader-
ship. As noted earlier, a strong leadership system is a composite of (a) city formulation of communitydevelopment strategies that have gained acceptancewithin the public, corporate, banking, philanthropic,and community development sectors and are backedby real resources, (b) advocacy, decisionmaking, andfunding practices that accord nonprofits and commu-nity leaders a central role, and (c) collaboration amongleaders with and across sectors. On these criteria, thestrongest leadership systems are those in Cleveland,Portland, OR, Boston, Indianapolis, Seattle, andAtlanta. The weakest are in Miami, Detroit, Oakland,Phoenix, and Denver.
Challenges to Leadership Systems in Selected Cit ies Denver: The consistent presence of NCDI through-out the decade made it possible for Enterprise tobe the leader of the Housing Development Project(a Denver umbrella group) and helped rationalizefunding resources to the CDC community. WhileHDP has been a real success and has broughttogether the city, the banks, Enterprise, and MileHigh United Way, the institutional base has notexpanded in the past several years nor has it beenreconfigured to deal with the sustained surge inthe real estate market. City Hall had been support-ive throughout the 1990s, but provided no sub-stantial increase in funding. Meanwhile, real estateprices rise and most new residential construction is priced far above the heads of the people forwhom CDCs are building. One of the biggestissues in Denver is how to get resources (land and subsidy) for affordable housing in a metroregion that is burgeoning and at the same time beincreasingly concerned with smart growth andurban sprawl.
Miami: Miami-Dade OCED (Office of Communityand Economic Development) has been criticizedby most community development industry partici-pants, including some within the public sector.Bureaucratic delays in permitting and contractinghave undermined the effectiveness of CDCs andhindered their ability to increase production levelsand broaden their range of community develop-ment activities. Several CDC directors called OCED“THE weak link in the system.” Further complicat-ing matters, the philanthropic community is smallrelative to other cities, and the corporate sectoris not noted for engagement in civic affairs.

54 Community Development Corporations and their Changing Support Systems
The Critical Role of Intermediation
Some cities made strides to build more effective systemleadership. Although these gains did not place themamong the top rank of community development leadership, researchers found strong improvement in Atlanta, Washington, D.C., Indianapolis, andColumbus. Three factors, in particular, brought aboutthe advances in community development leadershipsystems over the 1990s:
• Local LISC and Enterprise staff and leaders withinthe CDC industry worked actively to secure sup-port from bankers and city government officials toimprove production, and from foundation staff, cityofficials, and corporate supporters on the capacity-building side. The CDC industry created new coali-tions to advocate for CDCs and neighborhoods.
• As CDC industries in some of the larger, moredeveloped, community development systems becamemore rational in terms of support programs, performance standards, technical assistance, and financing techniques, they created standards
of practice that other cities could adopt to carryout community development more effectively. The availability of these standards helped convincefinancial institutions and foundations that theirinvestments would be better spent than they mayhave been in the past.
• The rise of funding collaboratives and their increas-ing operational sophistication helped mobilize andchannel new forms of support to CDCs and createda stability of policy and practice that did not exist a decade ago. The best of these collaboratives dis-played an adaptability to new public policies.
It is difficult to overestimate the importance of newfunding collaboratives to the strengthening of leader-ship systems in cities. In some systems—Cleveland,Washington, D.C., Philadelphia, Atlanta, Seattle—collaboratives have become indispensable intermedi-aries through which relationships among systemstakeholders and between system and neighborhoodstakeholders are forged and sustained. Communitydevelopment corporations recognize the importance
Figure 5.1
Role of Local Collaboratives in Leadership System

L e a d e r s h i p S y s t e m s 55
of collaboratives to their work: Together with thenational intermediaries, CDCs regard local intermedi-aries and funding collaboratives as more helpful totheir ability to carry out community developmentthan any other system actors.
How collaboratives engage other institutions isdepicted in figure 5.1. The collaborative recruitsboard members from all participating institutions,which contribute grant support as a condition ofmembership. Personnel from the local office of thenational intermediary often staff the collaborative.The national intermediary offers access to programmodels, finance, and grant support.
The collaborative administers the distribution of operating support among the CDCs and monitorsperformance. The collaborative also serves as a platformfor cooperation among its members. It encouragesthem to remain engaged, gets them to collaborate,provides an arena for raising and resolving commu-nity development issues, and offers CDCs access tomembers and the decisionmaking process.
By encouraging more diverse support for communitydevelopment, intermediation has made it easier forthe system to weather the departure of any single funder. The higher performance standards generatedby NCDI and others, through operating support collaborations and new norms of accountability, haveinspired confidence among less committed fundersand induced continued support, as reported by col-laboratives’ more committed funders. Funders’ highvisibility hedges against a quiet withdrawal of support.
In addition to the new collaboratives, which were aseminal factor, five other developments made commu-nity development leadership systems more productivein the 1990s:
• Improved production systems and higher CDCoutputs demonstrated the value of additionalinvestments.
CDCs’ growing reputations as developers made privatefinancial institutions more willing to support CDCs.Foundations also invested more heavily in CDC pro-duction systems, encouraged by the prospect of visibleneighborhood improvements.
• External support helped establish the politicallegitimacy of the CDC industry.
NCDI and the national intermediaries drew addi-tional support to CDCs. In cities where CDCs hadnot already carved out a prominent community devel-opment role, NCDI’s new money and prestigiousparentage in major national foundations helpedencourage city governments and private industry to recognize CDCs as credible actors on the policystage. NCDI and the intermediaries also added imme-diate value in the form of new operating support andproject finance.
• Improved urban economic conditions elevated thecommunity development agenda.
Nearly all 23 NCDI cities registered sharp improve-ments in city fiscal conditions. Attention shifted awayfrom downtown redevelopment and toward the neigh-borhoods.
• Foundations and civic organizations embracedcomprehensive change.
The persistence of chronic poverty—and the ongoingdysfunction of public systems—led foundations, civicinstitutions, and others to forgo piecemeal approachesand embrace comprehensive community building.Such an approach relies heavily on nonprofit organi-zations. In many cities, including Baltimore,Cleveland, Denver, and Kansas City, the rise in com-munity building coincided with a new civic spirit ofcollaboration among the corporate, nonprofit, andpublic sectors.
• Stronger local leadership for communitydevelopment emerged.
The flow of new money into community developmentand the growing strength of intermediaries created thefinancial and institutional pre-conditions for the exer-cise of stronger local leadership. In addition, electoralchanges in some cities signaled the end of an olderpolitics of race and class conflict and the creation ofnew, more consensual approach to urban problems.Mayoral changes in Washington, D.C., Detroit, andPhiladelphia, among others, led to the creation of new or reinvigorated partnerships among business and government to pursue new community improvementprojects. In some cities, universities became moreactive participants in community development.

56 Community Development Corporations and their Changing Support Systems
Continuing Challenges and New Opportunities
The strengthening ofnational community devel-opment intermediaries andnational networks of localoffices is one of the mostimportant changes in localurban policy in a decade. In addition to their directcontributions to production
and capacity building within the community develop-ment industry, intermediaries also have helped changethe local institutional and political landscape. Mostimportant, they have made it likely that private andpublic actors with a stake in neighborhood improve-ment will cooperate with one another over the longterm, not just episodically as short-term opportunitiespresent themselves.
Of course, doubts remain about how well institution-alized the CDC leadership system is in certain cities,particularly those cities in which nonprofit commu-nity development is a recent phenomenon. Cleveland,for example, appears highly able to resist shocks to the network of institutions and relationships formedto take on neighborhood issues. Other communities,such as the Bay Area, appear more fragile, especially as elected leadership in Oakland and elsewhere focuscity attention on reviving business districts andattracting middle-class residents.
The area of civic leadership is the most difficult one to predict, given the complexity of relationships withinand across components of the financial services indus-try, local and national philanthropy, and federal, state,and local government. Perhaps we can expect to seethe following:
• Stability of local funding commitments for commu-nity development from public and private sourcesas the network of relationships among local andnational funders helps reinforce commitments tothe field made through-out the 1990s;
• Increased attention tonew immigrant commu-nities as demographicchanges become reflectedin increased politicalpower for Hispanicneighborhoods, in partic-ular. This may stretchcommunity developmentresources more thinly, but also may heighten overallinvestments in neighborhoods and away from majordowntown projects.


58 Community Development Corporations and their Changing Support Systems
Conclusion
CDCs made strong gains in their ability to influence neighborhood markets and enhanced their capacity toaddress neighborhood problems. They produced more housing units, commercial square footage, and communityfacilities than ever before—and many groups started undertaking a comprehensive redevelopment agenda.
The emergence of local community development support systems in many cities made CDCs’ advances possible.Support for CDC initiatives had been weak and poorly coordinated before 1990. By decade’s end, local supportsystems had begun to deliver money, technical assistance, and political support in a more rational and organizedmanner. While the chronic inefficiencies plaguing community development have not been eliminated, such as cumbersome city bureaucracies and burdensome land use regulation, progress has been made in creating asmoother, functioning delivery system. New collaborative bodies, supported by mainstream institutions, werechanneling project capital, operating subsidies, and technical assistance to CDCs far more effectively.
The 1990s were also a decade of growth for LISC and Enterprise. These two national intermediaries can take major credit for the new local collaboratives and the improved community development support systems.Working through these intermediaries, through its funding support and national prominence, NCDI played animportant role in catalyzing CDC gains over the 1990s. Newly incorporated and committed to another ten yearsof investment as Living Cities: The National Community Development Initiative, this group will continue tomake investments that promote the vitality of America’s neighborhoods.
Over the coming decade, CDCs will remain vulnerable to shifts in funding policies that could make it moredifficult for them to carry out their traditional community development activities. Certainly, in cities withoutwell-established industries (and in some neighborhoods within more mature community development environ-ments), CDCs may fail to hold on to the gains they have made. That said, it is more likely that CDCs will diver-sify their agendas further and bolster those aspects of capacity that continue to lag behind. Production, capacitybuilding, and leadership systems will support this diversification, which may include the creation of new relation-ships among city agencies, foundations, corporations, and financial institutions within community development,and in other policy areas as well.

R e f e r e n c e s 59
References
Cummings, Jean, and Denise DiPasquale. 1999. “The Low-Income Housing Tax Credit: An Analysis of the FirstTen Years.” Housing Policy Debate 10(2): 251–307.
HUD. See U.S. Department of Housing and Urban Development.
National Congress for Community Economic Development. 1998. Coming of Age: Trends and Achievements ofCommunity-Based Development Organizations. Washington, D.C.: NCCED.
NCCED. See National Congress for Community Economic Development.
Nothaft, Frank E., and Brian J. Surette. 2002. “Industrial Structure of Affordable Mortgage Lending.” Journal ofHousing Research 12(2): 239-276.
Temkin, Kenneth, Chris Walker, George Galster, and Diane Levy. Forthcoming. The Impact of CommunityDevelopment Corporations on Neighborhoods: An Analysis of Five Communities. Washington, D.C.: The UrbanInstitute.
U.S. Department of Housing and Urban Development. 1997. Expanding the Supply of Affordable RentalHousing. Washington, D.C.: Office of Policy Development and Research.
Walker, Christopher, and Mark Weinheimer. 1998. Community Development in the 1990s. Washington, D.C.:The Urban Institute.

60 Community Development Corporations and their Changing Support Systems
Appendix A : The National Community Development Init iat ive
This paper makes frequent reference to the NationalCommunity Development Initiative (NCDI), which,over the 1990s has played an important role in elevat-ing CDC capacity by promoting improvements inproduction, capacity building, and leadership systems.Launched in 1991 by a group of private foundationsand financial services corporations, NCDI pooledfinancial support from corporate, nonprofit, andgovernment funders and through two national community development intermediaries—the LocalInitiatives Support Corporation and The EnterpriseFoundation—invested in CDCs and the localinstitutions that support them.
Over the decade, the presence of NCDI funding suc-ceeded in drawing new resources to community devel-opment, strengthened and institutionalized supportfor community development among key players inlocal communities, and had a major impact on raisingCDC operating capacity and performance standards.
The NCDI model relies on four coreprogrammatic concepts.
• National intermediation. NCDI communityinvestments are overseen by the local offices of twonational intermediary organizations: the Local
Initiatives Support Corporation (LISC) andThe Enterprise Foundation (Enterprise). LISC andEnterprise raise financial and technical resources at the national level and channel these resourceslocally into low-income neighborhoods. By NCDI’sbeginning in 1991, both intermediaries hadamassed substantial organizational assets andexpertise. NCDI funders chose to funnel theirresources through LISC and Enterprise becausethey were confident their funds would be wellspent and that their own investments would besupported by others.
• Multiple forms of local assistance. Two types ofassistance have proven to be the most needed byCDCs: loans for development activities and grantsfor operating support, community programs, tech-nical assistance, and other capacity-building activi-ties. NCDI provides both, channeling loans fromfinancial institutions and grants from foundationsand the Department of Housing and UrbanDevelopment (HUD).
• Local flexibility. Each LISC and Enterprise fieldoffice develops its own program for the use ofNCDI funds, consistent with objectives set by theintermediaries’ national offices and the consensus of local advisory committees. Local offices may, for example, use their loan funds to generate rental housing, build units for sale to homebuyers,renovate community facilities, or undertake otherdevelopment projects. The decentralized structure
National Community Development Initiative Funders
Initial FundersWilliam and Flora Hewlett Foundation* Pew Charitable TrustsJohn S. and James L. Knight Foundation Prudential Insurance Co. of AmericaLilly Endowment** Rockefeller FoundationJohn D. and Catherine T. MacArthur Foundation Surdna Foundation
Additional Round II FundersAnnie E. Casey Foundation J.P. Morgan & Co.McKnight Foundation U.S. Department of Housing and Urban DevelopmentMetropolitan Life Foundation
Additional Round III FundersDeutsche Bank (formerly Bankers Trust Co.) W.K. Kellogg FoundationChase Manhattan Bank Bank of America (formerly NationsBank)Robert Wood Johnson Foundation
Source: Urban Institute 2002.
* The Hewlett Foundation did not invest new funds for Round III.
** The Lilly Endowment did not participate with new funds after Round I.
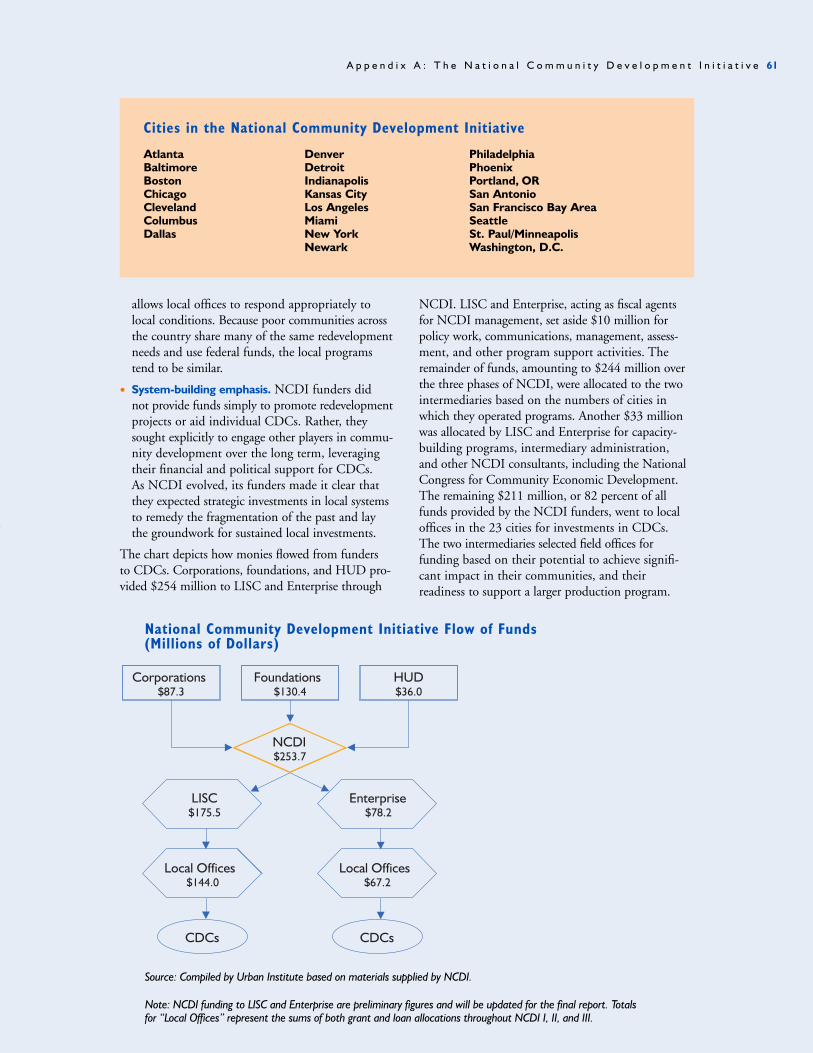
A p p e n d i x A : T h e N a t i o n a l C o m m u n i t y D e v e l o p m e n t I n i t i a t i v e 61
allows local offices to respond appropriately tolocal conditions. Because poor communities acrossthe country share many of the same redevelopmentneeds and use federal funds, the local programstend to be similar.
• System-building emphasis. NCDI funders didnot provide funds simply to promote redevelopmentprojects or aid individual CDCs. Rather, theysought explicitly to engage other players in commu-nity development over the long term, leveragingtheir financial and political support for CDCs. As NCDI evolved, its funders made it clear thatthey expected strategic investments in local systemsto remedy the fragmentation of the past and lay the groundwork for sustained local investments.
The chart depicts how monies flowed from funders to CDCs. Corporations, foundations, and HUD pro-vided $254 million to LISC and Enterprise through
NCDI. LISC and Enterprise, acting as fiscal agentsfor NCDI management, set aside $10 million forpolicy work, communications, management, assess-ment, and other program support activities. Theremainder of funds, amounting to $244 million overthe three phases of NCDI, were allocated to the twointermediaries based on the numbers of cities inwhich they operated programs. Another $33 millionwas allocated by LISC and Enterprise for capacity-building programs, intermediary administration,and other NCDI consultants, including the NationalCongress for Community Economic Development.The remaining $211 million, or 82 percent of allfunds provided by the NCDI funders, went to localoffices in the 23 cities for investments in CDCs.The two intermediaries selected field offices forfunding based on their potential to achieve signifi-cant impact in their communities, and theirreadiness to support a larger production program.
National Community Development Initiative Flow of Funds (Millions of Dollars)
Source: Compiled by Urban Institute based on materials supplied by NCDI.
Note: NCDI funding to LISC and Enterprise are preliminary figures and will be updated for the final report. Totalsfor “Local Offices” represent the sums of both grant and loan allocations throughout NCDI I, II, and III.
Cities in the National Community Development Initiative
Atlanta Denver PhiladelphiaBaltimore Detroit Phoenix Boston Indianapolis Portland, OR Chicago Kansas City San Antonio Cleveland Los Angeles San Francisco Bay AreaColumbus Miami SeattleDallas New York St. Paul/Minneapolis
Newark Washington, D.C.

62 Community Development Corporations and their Changing Support Systems
Appendix B: Research Methodology
This report relies on multiple sources of information and analysis carried out over a number of years. Thismethodology briefly describes the principal methods we used to collect and analyze data.
Field Reports
The analysis relies heavily on local interview information, compiled by researchers into “field reports,” whichsummarized the main conclusions to be drawn from the body of interviews conducted. Completed about every18 months, these reports followed a common format, typically covering each of the four system components—CDC industries, production systems, capacity-building systems, and leadership—but emphasized differentaspects of these components in each reporting cycle.
Field researchers gathered information through interviews with representatives from local intermediaries, CDCs,city agencies, banks, foundations, and other informed observers. These interview subjects were identified based on conversations with LISC and Enterprise field staff, supplemented by initial contacts with a preliminary list ofsuggested respondents. Over the course of seven years, the field teams compiled their own list of principal respon-dents, but also relied on local intermediary staff to indicate where staff turnover in banks, local government, andother institutions had occurred, or where new people had become important to the design and conduct of com-munity development programs.
Researcher Ratings of System Performance
In field data collection conducted in 1996, 1997, and 2001, researchers solicited information from local interviewsubjects on specific aspects of system performance, then produced summary “ratings” of performance. These rat-ings followed a five-point scale, with a description of each point on the scale supplied to aid researcher placementof each community on the scale.
Scale items included multiple indicators in each of several general systems categories: (a) system production, (b) community building, (c) CDC capacity building, (d) delivery of community development programs, (e) public and private strategies, and (f ) system leadership. Researchers used multiple interviews to arrive at a synthetic judgment on system performance for 1996, 2001, and retrospectively, 1991.
Researchers rated multiple cities based on first-hand field investigations, thereby giving them a comparative perspective from within the group of communities they had visited. Throughout the rating process, researcherscirculated their ratings to other field team members with knowledge of the city being rated as well as of othercities that the rating provider had not visited.
Mail Survey of Community Development Corporations
In 1998, we surveyed community development corporations to find out about their activities, self-assessment of capacities and priorities for the future, and ratings of other community development actors. We surveyedall organizations in the 23 NCDI cities that local LISC and Enterprise staff judged capable of producing 10 housing units per year or more (or the commercial space equivalent). We received 163 completed surveys from 270 surveys mailed, a 60 percent response rate.
A p p e n d i x B : R e s e a r c h M e t h o d o l o g y 63
National Center for Charitable Statistics
For each of the “capable” CDCs identified by local LISC and Enterprise staff, researchers downloaded informa-tion on their expenditures as reported to the Internal Revenue Service on Form 990, required to be filed by nonprofit organizations accepting more than $50,000 per year in public contributions. This information is from1989 through 1999, the most recent year for which good information was available at the time of this analysis.
National Intermediary Management Information Systems
Both LISC and the Enterprise Corporation maintain management information systems that obtain and storeinformation on the amount and purpose of thousands of loans and grants made by national and local inter-mediary offices. Researchers combined data from these loan-and-grant databases with information contained in databases on low-income-housing tax credit purchases by the National Equity Fund, the Enterprise SocialInvestment Corporation, and several regional funds.
NCDI Program Documents
Throughout NCDI’s first ten years, LISC and Enterprise submitted a variety of program documents intended to support national decisionmaking and monitoring of local performance. We relied on several of these:
• program workplans submitted at the beginning of each of three NCDI funding rounds, which containedspecifics on program activities, but also useful diagnoses of challenges and opportunities in local communitydevelopment systems;
• local intermediary annual reports submitted at the conclusion of every year, as well as summary reports filed at the end of every NCDI funding round;
• local system assessments, or “portraits,” compiled in 2001 in preparation for NCDI’s second decade, and which contained local intermediary ratings of various system components according to a format developed bythe Urban Institute research team and the NCDI secretariat.

The Urban Institute2100 M Street, NWWashington, DC 20037(202) 833-7200 /Fax: (202) 728-0232http://www.urban.org