community facilities asset management plan
TRANSCRIPT

Community Facilities
Asset Management Plan Version 1
May 2013

SHIRE OF ANYWHERE

Document Control
Document ID: compliance community facilities amp - 16-05-2013 (final).docx
Rev No Date Revision Details Author Reviewer Approver
1 June 2013 Draft Version 1 – June 2013 Rob Damhuis Ian Thew
Prepared By: _ _ _ _ _ _ _ _ _ _ _ _ _ _ _ _ Marie Sorrell Building Asset Management Consultant Opus International Consultants (PCA) Ltd Approved for Release By: _ _ _ _ _ _ _ _ _ _ _ _ _ _ _ _ Darren Friend Chief Executive Officer Shire of Coorow Shire of Coorow PO Box 42, Coorow, WA 6515, Australia Telephone: +61 8 9952 0100 Facsimile: +61 8 9952 1173 Date: 17 May 2013
Status: Final draft
Time Period of the Plan: The AMP covers a 10 year period.
Asset Management Plan Review Date: The AMP is reviewed every 4 years, and updated within 2 years of each Shire election.
The Shire of Coorow wishes to acknowledge funding provided by the Department of Local Government and
Department of Regional Development and Lands, through Royalties for Regions to support this project.

- i -
TABLE OF CONTENTS
EXECUTIVE SUMMARY ........................................................................................................................ - 1 - INTRODUCTION ............................................................................................................................... 2 1.1.1 Background ................................................................................................................................... 2 1.2 Goals and Objectives of Asset Management ................................................................................ 2 1.3 Corporate Document Relationships ............................................................................................. 3 1.4 Information Flow Requirements and Processes ........................................................................... 3 1.5 Legislative Requirements .............................................................................................................. 4 1.6 Core and Advanced Asset Management ...................................................................................... 4 1.7 Community Consultation .............................................................................................................. 4
RISK MANAGEMENT PLAN .............................................................................................................. 5 2. FUTURE DEMAND ........................................................................................................................... 6 3.3.1 Demand Forecast .......................................................................................................................... 6 3.2 Demand Management Strategy ................................................................................................... 6 3.3 New Assets for Growth ................................................................................................................. 7
LEVELS OF SERVICE .......................................................................................................................... 8 4.4.1 Background ................................................................................................................................... 8 4.2 Desired Levels of Service .............................................................................................................. 8 4.3 Current Levels of Service ............................................................................................................ 13 4.4 Level of Service Performance Monitoring .................................................................................. 13
FINANCIAL MANAGEMENT ........................................................................................................... 14 5.5.1 Asset valuations .......................................................................................................................... 14 5.2 Historical Revenue ...................................................................................................................... 15 5.3 Historical Expenditure ................................................................................................................ 16 5.4 Age data ...................................................................................................................................... 17 5.5 Asset Priority ............................................................................................................................... 17 5.6 Condition data ............................................................................................................................ 18 5.7 Future Lifecycle Costs ................................................................................................................. 18 5.8 Disposal Plan ............................................................................................................................... 20 5.9 Gap Analysis ................................................................................................................................ 21
PLAN IMPROVEMENT AND MONITORING .................................................................................... 24 6.6.1 Performance Measures .............................................................................................................. 24 6.2 Improvement Plan ...................................................................................................................... 24 6.3 Monitoring and Review Procedures ........................................................................................... 26
ASSET PORTFOLIO AND VALUATION .............................................................................. 27 Appendix A. RISK MANAGEMENT ANLYSIS ........................................................................................ 32 Appendix B. DEMAND FORECAST ...................................................................................................... 36 Appendix C. LEGISLATIVE ENVIRONMENT: ACTS AND REGULATIONS ............................................... 41 Appendix D. REFERENCES ................................................................................................................... 44 Appendix E. ABBREVIATIONS ............................................................................................................. 45 Appendix F. GLOSSARY ...................................................................................................................... 46 Appendix G.
Disclaimer
Any representation, statement, opinion or advice expressed or implied in this publication is made in good faith and on the basis that Opus, its employees and agents are not liable for any damage or loss whatsoever which may occur as a result of action taken or not taken, as the case may be, in respect of any representation, statement, opinion or advice referred to herein. Copyright
This work is copyright. The Copyright Act 1968 permits fair dealing for study, research, news reporting, criticism or review. Selected
passages, tables or diagrams may be reproduced for such purposes provided acknowledgment of the source is included.

This page is left blank intentionally

COMMUNITY FACILITIES ASSET MANAGEMENT PLAN - 1 -
EXECUTIVE SUMMARY
Context
This Community Facilities Asset Management Plan (AMP) is concerned with property and public open spaces’. This AMP has been compiled to comply with Local Government regulatory requirements including the Integrated Planning and Reporting requirements, and to demonstrate the Shire’s responsible management of assets (and services provided from these assets).
This Plan collates current property and public open space valuation, income and expenditure data, and compares it with the asset stock’s long term funding needs (that are required to provide an agreed and sustainable Level of Service).
This Plan investigates whether Council’s current level of asset operational, maintenance and renewal funding are sufficient to sustain the assets at a standard that will be acceptable to both asset owners and users.
This is the first asset management plan (AMP) that has been prepared for the Shire and its property and public open spaces’. As such whilst this AMP is comprehensive, it can also be considered as a “first cut plan” which will require ongoing refinement. Much of the data upon which this AMP is based is somewhat low in confidence, and many improvement actions have been identified.
What does it Cost?
The Shire of Coorow is responsible for a total of 67 properties / buildings and 11 public open spaces’ which make up its combined community facilities portfolio.
The property portfolio has an approximate Current Replacement Cost (CRC) of $6,860,277. The public open space portfolio has an approximate CRC of $518,912.
Managing the Risks
Analysis of the future demand influences show that
the Shire’s community facilities will either remain
unchanged or likely increase over the 10 year period
of this AMP. Four of the key driver areas show that a
combination of different pressures will require the
Shire to not only consider the physical aspects of
community facilities, in terms of provision, materials
and design, but also how community facilities are
operated and maintained.
This will require further investigation and better long
term planning in order to understand what can be
provided going forward. However, there are gaps in
the Shire’s current knowledge of its property and
public open spaces’ and some of the key risks
currently are:
A single building and public open space inventory
does not exist upon which to develop the Shire’s
asset management practices and processes; and
A formalised building and public open space
condition and maintenance inspection regime
does not exist, which is potentially exposing users
and the Shire to higher risk levels.
The Next Steps
The key actions over the short term resulting from this
AMP are to:
Develop a single corporate building and public
open space inventory database, with spatial
references;
Develop a building and public open space
condition and maintenance inspection cyclic
regime, and implement;
Prepare a long term building and public open
space renewal programme; and
Present and adopt this Community Facilities AMP.
Questions you may have
What is an Asset Management Plan (AMP)?
Asset management planning is a process to ensure delivery of infrastructure services is provided in a sustainable manner, both from a financial and environmental perspective.
An asset management plan (AMP) details information about infrastructure assets including actions required to provide an agreed level of service in the most cost effective manner. The AMP defines the services to be provided, how the services are provided and what funds are required to provide the services.

COMMUNITY FACILITIES ASSET MANAGEMENT PLAN - 2 -
SHIRE OF ANYWHERE
Road Asset Management Plan 2011/12 – 2020/21
INTRODUCTION 1.
1.1 Background
This Asset Management Plan (AMP) has been developed to demonstrate responsive management of assets (and services provided from assets), compliance with regulatory requirements, and to communicate funding needed to provide the required levels of service.
The AMP is to be read with the Shire’s Asset Management Policy, Asset Management Strategy and the following associated planning documents:
Shire of Coorow - Community Engagement Summary Report July 2012;
Shire of Coorow - Draft Long Term Financial Plan 2012 - 2022
Shire of Coorow Plan for the future July 2010 to June 2015
The asset categories covered by this AMP are shown in Source: Shire’s Asset Register February 2013
Table 1-1 below.
Asset Category Current Replacement Cost
Property $6,860,277
Public Open Spaces $518,912
Assets Total $7,379,188
Source: Shire’s Asset Register February 2013 Table 1-1: Assets covered by this Plan
1.2 Goals and Objectives of Asset Management
The Shire exists to provide services to its community. Some of these services are provided by building and public open space assets. The Shire has acquired assets by ‘purchase’, by contract, construction by Shire staff and by donation of assets constructed by developers and others to meet increased levels of service.
This asset management plan is prepared under the direction of the Shire’s vision as outlined in the Draft Our Future Coorow 2012-2022:
Shire’s vision is:
The Shire of Coorow will be a sustainable, progressive, desirable and caring
community which recognises and values its diversity.
The Shire’s goal in managing assets is to meet the required level of service in the most cost effective manner for present and future consumers. The goal of this asset management plan is to:
Document the services/levels of service to be provided and the costs of providing the service;
Communicate the consequences for levels of service and risk, where desired funding is not available; and
Provide information to assist decision makers in trading off levels of service, costs and risks to provide services in a financially sustainable manner.

COMMUNITY FACILITIES ASSET MANAGEMENT PLAN - 3 -
SHIRE OF ANYWHERE
Road Asset Management Plan 2011/12 – 2020/21
The key elements of asset management are:
Taking a whole life cycle approach;
Developing cost-effective management strategies for the long term;
Providing a defined level of service and monitoring performance;
Understanding and meeting the demands of growth through demand management and infrastructure investment;
Managing risks associated with asset failures;
Sustainable use of physical resources; and
Continuous improvement in asset management practices.
1.3 Corporate Document Relationships
The AMP integrates with key legislative requirements and Shire documents (adopted and in development). The Shire has adopted a corporate asset management framework similar to that detailed within the WA Asset Management Framework and Guidelines.
Figure 1-1 details the WA Asset Management Framework and Guidelines and demonstrates the relationship that exists between the Shire’s AMP’s and its Asset Management Strategy, other informing strategies and operational processes, plans and practices. The key relationships can be summarised as:
Asset Management Strategy: The Strategy outlines how the Shire’s asset portfolio will support the service needs of the community. Though reliant on a strong Strategic Community Plan, the Strategy should facilitate the provision of prioritised service delivery, thus informing what assets are required by the Shire.
Long Term Financial Plan: The Shire has a draft LTFP. A LTFP sets out in detail the financial strategy required to meet the Council’s long term expenditure needs. The AMP’s inform the LTFP about what level of resource is required to provide the agreed service levels.
1.4 Information Flow Requirements and Processes
The key information flows into this asset management plan are:
Shire strategic and operational plans;
5 year Building Plan;
Asset information, i.e. The asset register data on size, age, value, remaining life;
Current levels of service, expenditures, service deficiencies and service risks;
Projections of various factors affecting future demand for services and new assets acquired by the Shire;
Correlations between maintenance and renewal; and
Financial asset values. Other reference documents are contained in APPENDIX E at the end of this document.
Figure 1-1: The AMP's Corporate Document Relationships
(Department of Local Government Asset Management Framework &
Guidelines)

COMMUNITY FACILITIES ASSET MANAGEMENT PLAN - 4 -
SHIRE OF ANYWHERE
Road Asset Management Plan 2011/12 – 2020/21

COMMUNITY FACILITIES ASSET MANAGEMENT PLAN - 5 -
SHIRE OF ANYWHERE
Road Asset Management Plan 2011/12 – 2020/21
The key information flows from this asset management plan are:
The estimated budget and long term financial plan expenditure projections; and
Financial sustainability indicators.
1.5 Legislative Requirements
The Shire has to meet legislative requirements including Australian and State legislation and State regulations. Relevant legislation is stated in APPENDIX D.
1.6 Core and Advanced Asset Management
This asset management plan is prepared as a first cut ‘compliance’ asset management plan in accordance with the requirements of the DLG. It is prepared to meet minimum legislative and organisational requirements for sustainable service delivery and long term financial planning and reporting. The next step in asset management progression is ‘core’ asset management and is a ‘top down’ approach where analysis is applied at the ‘system’ or ‘network’ level.
1.7 Community Consultation
For the initial draft of the AMP, the principal audience of this AMP is the Shire’s Council and Chief Executive Officer (CEO) and is prepared to facilitate community consultation initially through feedback on public display of draft asset management plans prior to adoption by Council.
Future revisions of the asset management plan will incorporate community consultation on levels of service and costs of providing the service. This will assist the Shire and the community in matching the level of service needed by the community, service risks and consequences with the community’s ability to pay for the service.

COMMUNITY FACILITIES ASSET MANAGEMENT PLAN - 6 -
SHIRE OF ANYWHERE
Road Asset Management Plan 2011/12 – 2020/21
RISK MANAGEMENT PLAN 2.
The Shire provides a diverse range of services and facilities to the general public which exposes it to risks.
The Shire is currently working on developing a corporate Risk Management Plan and no previous risk analysis of the property or public open spaces’ portfolio has yet been undertaken. The risk assessment process identifies credible risks, the likelihood of the risk event occurring, the consequences should the event occur, develops a risk rating, evaluates the risk and develops a risk treatment plan for non-acceptable risks.
The draft Risk Management Analysis is included as Appendix B, in future revisions of the AMP, the details of the highest property and public open space risks, identified from the risk analysis will be summarised in this section.
The risk assesment will be reviewed and amended as future revisions to this AMP.

COMMUNITY FACILITIES ASSET MANAGEMENT PLAN - 7 -
SHIRE OF ANYWHERE
Road Asset Management Plan 2011/12 – 2020/21
FUTURE DEMAND 3.
3.1 Demand Forecast
Factors affecting demand include population change, changes in demographics, seasonal factors, ownership, consumer preferences and expectations, economic factors, environmental awareness, etc. The following influences have been discussed in further detail in Appendix C, and summarised in this section:
A range of influences that may affect demand for community facilities over the 10 year horizon of this AMP have been considered. The Shire will need to undertake further work in the future to refine its understanding of how future demand may change. These future improvements will then allow the Shire to produce quantitative forecasts on how it expects public open spaces’ to change over the life of the AMP.
For now, local knowledge and current Australian Bureau of Statistics (ABS) information has been used. Table 3-1 summarises the likely demand change effect each driver will have on community facilities.
Driver Demand
Change
Comment
Political No intended changes to policy that may affect demand.
Economic No change in community facilities from economic sources. Possible increase in
demand due to increased Shire financial capacity. Shire to ensure it can resource
the long term management of its assets and services.
Social No charge: Reduced demand due to population decline, increase due to
changing demographics, increase because of tourism, higher demand due to
recreation.
Technology Reduced demand: Reduction in the demand for community facilities, in
particular services such as libraries, due to technology changes.
Legal Increase in management resource demand because of legislative change.
Environmental Potentially higher whole of life costs due to climate change, no change from
sustainability pressures.
Health & Safety Increased demand through health and safety requirements for better service
levels.
Table 3-1: Demand Drivers
3.2 Demand Management Strategy
A sound demand change strategy identifies how services delivered by the Shire are expected to change to meet emerging needs, or changing use. Based upon local knowledge and ABS data, the Shire has determined that future demand of its community facilities will either remain unchanged or likely increase over the 10 year period of this AMP. Four of the key driver areas show that a combination of different pressures will require the Shire to not only consider the physical aspects of community facilities, in terms of provision, materials and design, but also how community facilities are operated and maintained.

COMMUNITY FACILITIES ASSET MANAGEMENT PLAN - 8 -
SHIRE OF ANYWHERE
Road Asset Management Plan 2011/12 – 2020/21
However, for the Shire to fully understand the implications of demand change on community facilities, further information is required across a number of key areas, including:
• Developing a building and robust public open space inventory;
• Understanding the extent of any future community facilities;
• Understanding the desired community service levels;
• Understanding the Shire’s future resource capacity;
• Developing an understanding of how community facilities fit in with any applicable Shire plans and policies; and
• Developing a robust building and public open space inspection and maintenance programme.
Due to the limitations in the Shire’s current building and public open space asset data and knowledge, our ability to accurately predict the scope of future demand and how we will respond to this is not possible. However, through undertaking the actions listed in this AMP, we will be able to work towards a clearer long term understanding of our community facilities.
3.3 New Assets for Growth
The new assets required to meet growth will be acquired free of cost from land developments, or constructed / acquired by Council.
Acquiring new assets will commit council to fund ongoing operations and maintenance costs for the period that the service provided from the assets is required. Given the long life‐cycle of Community Facilities, the impact of this growth (future renewal costs) is only likely to be material after ten years. These future costs are identified and considered in developing forecasts of future operations and maintenance costs.

COMMUNITY FACILITIES ASSET MANAGEMENT PLAN - 9 -
SHIRE OF ANYWHERE
Road Asset Management Plan 2011/12 – 2020/21
LEVELS OF SERVICE 4.
4.1 Background
This section details the methodology used to determine Levels of Service that the Shire has set out to achieve and provide. Tables 4-1 and 4-2 details the Levels of Service to be monitored for performance and identify areas of deficiency or over-provision.
The Levels of Service measures also allow the Shire to ensure that its property and public open spaces’ are fit for purpose and provided at an efficient cost. As such, it is important to ensure that the Service Levels reflect the Shire’s Strategic Community Plan (Our Future Coorow 2012 - 2022) outcomes.
By considering the Shire’s objectives and values, particularly focussing on those which conflict or appear frequently, two sets of high level service levels were created;
• Community Levels of Service; and • Technical Levels of Service
4.1.1 Community Levels of Service - relate to the service outcomes that the community wants in terms of safety, quality, quantity, reliability, responsiveness, cost effectiveness and legislative compliance.
Community levels of service measures used in the asset management plan are:
Function Does it meet users’ needs?
Safety Is the service safe?
Quality How good is the service?
4.1.2 Technical Levels of Service - Supporting the community levels of service are operational or technical measures of performance. These technical measures relate to the allocation of resources to service activities that the council undertakes to best achieve the desired community outcomes.
Technical service measures are linked to annual budgets covering:
Operations – the regular activities to provide services (eg condition inspections);
Maintenance – the activities necessary to retain an assets as near as practicable to its original condition (eg building and structure repairs);
Renewal – the activities that return the service capability of an asset up to that which it had originally (eg building component replacement); and
Upgrade – the activities to provide a higher level of service (eg additional assets within a public open space) or a new service that did not exist previously (eg a new park bench).
4.2 Desired Levels of Service
At present, indications of desired levels of service are obtained from various sources including residents’ feedback to Councillors and staff, service requests and correspondence. These initial Desired Levels of Service will be documented in future versions of this AMP.
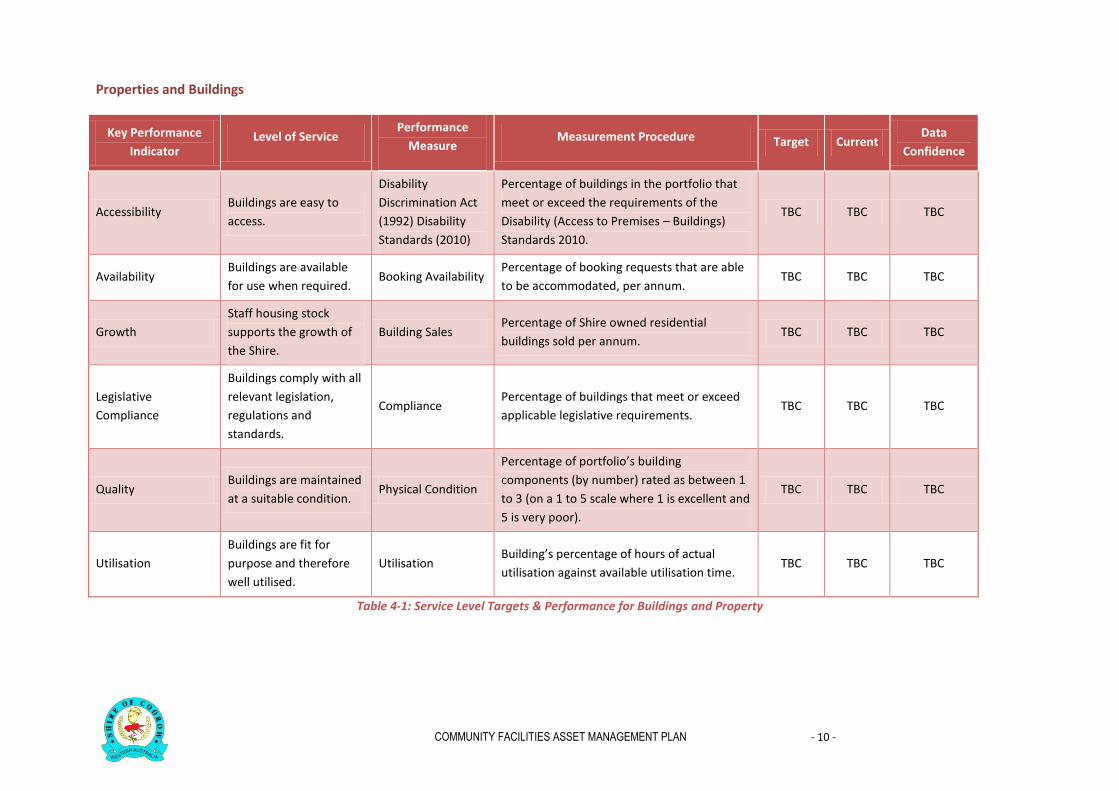
Table 4-1 and 4-2 on the following pages, details the key service levels against which the Shire will benchmark its property and public open spaces’ performance. At present no target or current performance levels are recorded due to a lack of supporting information. These sections will be progressively developed, and suitable targets set at a level similar to that currently delivered by the Shire.
COMMUNITY FACILITIES ASSET MANAGEMENT PLAN - 10 -
SHIRE OF ANYWHERE
Road Asset Management Plan 2011/12 – 2020/21
Properties and Buildings
Key Performance
Indicator Level of Service
Performance
Measure Measurement Procedure Target Current
Data
Confidence
Accessibility Buildings are easy to
access.
Disability
Discrimination Act
(1992) Disability
Standards (2010)
Percentage of buildings in the portfolio that
meet or exceed the requirements of the
Disability (Access to Premises – Buildings)
Standards 2010.
TBC TBC TBC
Availability Buildings are available
for use when required. Booking Availability
Percentage of booking requests that are able
to be accommodated, per annum. TBC TBC TBC
Growth
Staff housing stock
supports the growth of
the Shire.
Building Sales Percentage of Shire owned residential
buildings sold per annum. TBC TBC TBC
Legislative
Compliance
Buildings comply with all
relevant legislation,
regulations and
standards.
Compliance Percentage of buildings that meet or exceed
applicable legislative requirements. TBC TBC TBC
Quality Buildings are maintained
at a suitable condition. Physical Condition
Percentage of portfolio’s building
components (by number) rated as between 1
to 3 (on a 1 to 5 scale where 1 is excellent and
5 is very poor).
TBC TBC TBC
Utilisation
Buildings are fit for
purpose and therefore
well utilised.
Utilisation Building’s percentage of hours of actual
utilisation against available utilisation time. TBC TBC TBC
Table 4-1: Service Level Targets & Performance for Buildings and Property

COMMUNITY FACILITIES ASSET MANAGEMENT PLAN - 11 -
SHIRE OF ANYWHERE
Road Asset Management Plan 2011/12 – 2020/21
Public Open Spaces
Key
Performance
Indicator
Level of Service Performance
Measure Explanation Measurement Procedure Target Current
Data
Confidence
Accessible
Public open spaces’
are easy to access
from the majority
of town site
properties.
Connectivity
Properties within the
town site can readily
access the public open
space.
Percentage of town site lots
with a safe route to the
public open space.
TBC TBC TBC
Available
Public open spaces’
are available (i.e.
operational) when
required.
Public Open
Space Closures
Time that public open
spaces are closed is
minimised.
Percentage of days per
annum that one or more
public open spaces are
closed due to works,
condition and/or safety.
TBC TBC TBC
Health & Safety
Public open spaces’
are provided and
maintained in order
to help achieve
‘zero harm’ to
users, and minimise
Council’s exposure
to risk.
Risk Management
Council operates a risk
register for their public
open spaces’.
Number of risks identified
high or above shall be
mitigated.
TBC TBC TBC
Safety &
Maintenance
Defects
Public open spaces’ are
inspected at suitable
intervals.
Percentage of public open
spaces’ inspected within the
specified period.
TBC TBC TBC
Safety &
Maintenance
Defects
Public open space safety
and maintenance defects
are corrected within the
Shire’s target timeframes.
Percentage of public open
space defects corrected
within the intervention time.
TBC TBC TBC
Accidents
The number of
harm/damage claims
against Council is
minimised.
Percentage of claims
successfully defended, per
annum, by number.
TBC TBC TBC

COMMUNITY FACILITIES ASSET MANAGEMENT PLAN - 12 -
SHIRE OF ANYWHERE
Road Asset Management Plan 2011/12 – 2020/21
Key
Performance
Indicator
Level of Service Performance
Measure Explanation Measurement Procedure Target Current
Data
Confidence
Maintenance
Public open spaces’
are clean and well
maintained.
Cleaning
Requests
Public open spaces’ are
maintained appropriately
so as to limit the number
of requests for
maintenance received
from external sources.
Number of requests for
maintenance received per
public open space.
TBC TBC TBC
Maintenance
Public open spaces’ are
routinely cleaned so as to
proactively remove
rubbish and obstructions.
Percentage of public open
space within the Shires
agreed cleaning programme
timeframes.
TBC TBC TBC
Quality
The Shire’s public
open spaces’ are
provided at a level
of quality, agreed
by stakeholders.
Condition
Public open spaces’ are
maintained in a good
condition.
Percentage of public open
spaces’ rated as between a
condition 1 and 3, on a 1 to 5
scale, where 1 is very good
(new) and 5 very poor.
TBC TBC TBC
Condition
The Shire’s public open
spaces are free from
hazards.
Average number of hazards
detected, per public open
space.
TBC TBC TBC
Aesthetics
The public open space is
aesthetically pleasing and
adds to the town’s appeal.
The annual number of public
open space aesthetic
complaints received, per
public open space.
TBC TBC TBC

COMMUNITY FACILITIES ASSET MANAGEMENT PLAN - 13 -
SHIRE OF ANYWHERE
Road Asset Management Plan 2011/12 – 2020/21
Key
Performance
Indicator
Level of Service Performance
Measure Explanation Measurement Procedure Target Current
Data
Confidence
Satisfaction
Users are happy
with the public
open spaces’.
Satisfaction Users are happy with the
public open spaces’.
Through the use of an annual
questionnaire percentage of
users who are at least
satisfied with the Shire’s
public open spaces’.
TBC TBC TBC
Sustainability
The Shire’s public
open space is
sustainable.
Financial
Sustainability
The Shire is able to afford
the whole of life costs of
the public open space.
The percentage of 10 year
whole of life cost in the
public open space AMP that
is allowed for in the LTFP.
TBC TBC TBC
Utilisation
The Shire’s public
open spaces’ are
well used.
Utilisation Users readily use the
public open spaces’.
The amount of visitors to the
Shire’s public open space. TBC TBC TBC
Table 4-2: Service Level Targets & Performance for Public Open Spaces’

COMMUNITY FACILITIES ASSET MANAGEMENT PLAN - 14 -
SHIRE OF ANYWHERE
Road Asset Management Plan 2011/12 – 2020/21
4.3 Current Levels of Service
The Shire does not have condition assessments for their buildings and public open spaces’. When condition data is available, the results will be detailed in future Appendices of this AMP. In addition, when information is available Safety and Maintenance information will be located future Appendices.
4.4 Level of Service Performance Monitoring
Levels of Service will be monitored and reported in future versions of the AMP and reported in the Annual Report.
Figure 4-1: Leeman Entrance statement

COMMUNITY FACILITIES ASSET MANAGEMENT PLAN - 15 -
SHIRE OF ANYWHERE
Road Asset Management Plan 2011/12 – 2020/21
FINANCIAL MANAGEMENT 5.
5.1 Asset valuations
The Shire is responsible for a total of 67 Properties and Buildings and the total property CRC is valued to be
approximately $6,860,277 this is shown in Figure 5-1 below. The building valuation and financial data has been
provided from the Shire’s financial records and the asset register.
The Shire is responsible for a total of 11 public open spaces’ and the total public open space CRC is valued to be
approximately $518,912 this is shown in Figure 5-1 below. The public open space valuation and financial data has
been provided from the Shire’s financial records and the asset register.
A full list of each building, public open space and the individual CRC, as of February 2013, is included in Appendix A.
The CRC is based the Accumulative Historical Cost (Historical Cost plus purchases and additions), as at the time of
writing this AMP, there was no other information available.
Figure 5-1: Property and Public Open Spaces’ Current Replacement Cost
$518,912.00
$6,860,277.00
Community Facilites Current Replacement Costs
Public Open Spaces
Property

COMMUNITY FACILITIES ASSET MANAGEMENT PLAN - 16 -
SHIRE OF ANYWHERE
Road Asset Management Plan 2011/12 – 2020/21
5.2 Historical Revenue
The Shire receives revenue from a number of its property and public open space assets, usually by way of either:
Government grants;
Staff and Aged Housing rental income;
Property and Commercial Leases and Charges; and
Public open spaces’ annual charges.
Historical revenue on properties and public open spaces’ has been extracted from the Shires Annual Budgets for the past five years. Table 5-1 and Table 5-2 summarises the income sources for the past 5 financial years.
Income Source 2007/08 2008/09 2009/10 2010/11 2011/12
Council Income
Rec & Culture $ 2,400
Public Halls / Civic Centres $ 86,573
Other housing $ 37,691 $ 38,229
Staff housing $ 20,502 $ 2,550 $ 82,642 $ 46,012 $ 123,931
Libraries $ 1,775
Disposals
$ 113,945
Non Council Income
Grants - Royalties for regions
$ 353,642
Housing Grant $ 50,000
Fesa Capital Grant
$ 1,196
Government grants
$ 15,546
Charges Leeman Rec centre
$ 1,513 $ 575 $ 1,059 $ 1,689
Coorow hall other income
$ 10,079
Reimbursements - library
Admin alloc income
$ 764
Building licenses
$ 15,183
Medical Centre hire
Coorow aged persons housing
rent $ 2,550 $ 7,650 $ 7,950 $ 7,800
Leeman aged persons housing
rent $ 19,910 $ 19,900 $ 19,310 $ 20,680
Aged persons units-
reimbursement (GST free) $ 5,356 $ 110
Charges Maley park function
$ 358 $ 154 $ 569
Total Income $ 198,941 $ 112,876 $ 111,234 $ 74,484 $ 622,256
Table 5-1: 2007/08 - 2011/12 Building Income

COMMUNITY FACILITIES ASSET MANAGEMENT PLAN - 17 -
SHIRE OF ANYWHERE
Road Asset Management Plan 2011/12 – 2020/21
Income Source 2007/08 2008/09 2009/10 2010/11 2011/12
Council Income
Rec& Culture $ 13,765
Other Rec & Culture $ 337,478
Swimming Pools & Beaches $ 11,810
Disposals
Non Council Income
Grants/contributions
$ 12,802 $ 16,464 $ 16,355 $ 2,440
Government grants subsidy
$ 3,000 $ 3,000 $ 3,000 $ 3,000
Charges - pool admission
$ 3,256 $ 4,305 $ 3,381 $ 4,709
Admin Alloc income (swimming
areas + other rec and sport) $ 7,515
Csrff grants and contributions
$ 43,605 $ 56,941 $ 2,999
Maley park grants and
contributions $ 10,000
Reimbursements Ssl interest maley
park grant and contributions $ 17,627 $ 22,324 $ 32,038 $ 25,511
Reimbursements - sundry
$ 2,139 $ 3,477 $ 5,501 $ 4,848
Leeman reserves annual charges
$ 1,105 $ 1,009
Coorow reserves annual charges
$ 5,005 $ 2,636 $ 5,640 $ 5,897
Coorow leases
$ 509 $ 547 $ 573 $ 930
Green head leases
$ 2,718 $ 4,500 $ 3,091 $ 3,536
Leeman leases
$ 2,800 $ 3,100 $ 4,764 $ 5,131
Nacc coastal rehab grant
$ 14,893
Reimburse various pool
$ 1,000
Recreation boating facilities fund
grant $ 60,000
Trans from PoS trust
$ 9,530
Total Income $ 363,053 $ 112,081 $ 133,196 $ 77,342 $ 126,532
Table 5-2: 2007/08 – 2011/12 POS Income
5.3 Historical Expenditure
Historical expenditure levels on property (building) and public open spaces’ has been extracted from the Shire’s budget expenditure reports for the past five years. Table 5-3 and Table 5-4 summarises the expenditure which has occurred for the past 5 financial years. Whilst the four activity types of a property’s and public open spaces’ lifecycle have been listed, the Shire has not historically recorded expenditure in this way. An improvement project has been identified to begin recording future expenditure more accurately against activity type, especially between operation, maintenance, renewals, upgrades and acquisitions.

COMMUNITY FACILITIES ASSET MANAGEMENT PLAN - 18 -
SHIRE OF ANYWHERE
Road Asset Management Plan 2011/12 – 2020/21
2007/08 2008/09 2009/10 2010/11 2011/12
Maintenance / Operation $ 359,165 $ 367,126 $ 388,460 $ 390,194 $ 349,865
Renewal $ 167,521 $ 12,627 $ 355,997 $ 32,801 $ 449,006
Upgrade / New $ 0 $ 0 $ 25,000 $ 27,273 $ 20,055
Total $ 526,686 $ 379,753 $ 769,457 $ 450,267 $ 818,925
Table 5-3: Property (Building) Historical Expenditure
2007/08 2008/09 2009/10 2010/11 2011/12
Maintenance / Operation $ 706,650 $ 1,392,509 $ 644,911 $ 772,322 $ 569,397
Renewal $ 0 $ 111,133 $ 231,325 $ 5,016 $ 68,865
Upgrade / New $ 0 $ 20,651 $ 175,494 $ 82,109 $ 64,182
Total $ 706,650 $ 1,524,294 $ 1,051,730 $ 859,447 $ 702,444
Table 5-4: Public Open Space Historical Expenditure
5.4 Age data
The life of an asset depends on its construction, usage, maintenance levels among other factors. If renewal funding does not keep pace with the natural rate of deterioration, it is reasonable to expect that most assets will deteriorate to a point where they require major renewal works or demolition.
Older assets may be less flexible in use, or no longer meet the users’ needs, and be less efficient to operate. The age profile of the Shire’s property (building) assets is shown in Appendix A.
There is limited information on public open spaces’ in the Shire’s POS asset register. This has been identified as an improvement, and will be improved in future versions of this AMP.
5.5 Asset Priority
An asset priority provides a framework for structuring data in an information system to assist in collection of data, reporting information and making decisions. The priority may include the asset class and component,used for asset planning and financial reporting and service level priority used for service planning and delivery.
The Shire currently has no asset priority information for its buildings. It has been listed in the Improvement Plan to develop a component hierarchy for buildings and collect attributes with condition rating process.
The Shire does have a basic asset hierarchy for its public open spaces’, this is shown in Table 5-5. This should be further developed into a public open spaces’ priority, this has been listed as in improvement action.
Hierarchy of Public Open Spaces’ CRC Over
Basic LOS park Grassed only $ 0
Med Low Grass, path, beds, benches $ 10,000
Med LOS park Grass, path, beds, benches, basic playground on soft area $ 30,000
Med High Grass, path, beds, benches, Top notch playground on soft area $ 60,000
High Grass, path, beds, benches, Top notch playground on soft area, BBQ, Pergola $ 100,000
Table 5-5: Asset Priority for Public Open Spaces’

COMMUNITY FACILITIES ASSET MANAGEMENT PLAN - 19 -
SHIRE OF ANYWHERE
Road Asset Management Plan 2011/12 – 2020/21
5.6 Condition data
There is currently no condition data for the Shire’ property and public open space assets. There is also no documented
condition rating methodology or process. These two critical improvement actions have been identified in the
Improvement Plan.
5.7 Future Lifecycle Costs
Lifecycle costing (LCC) is a process, which aims to determine the sum of all expenses associated with assets, including
acquisition, operation, maintenance, renewal, upgrading and disposal. The principal concern for community facility
assets is that whilst the upfront acquisition costs are usually significant, the recurrent ongoing expenditure is usually
sunstantially higher.
It is the Shire’s intention, through improved management practices and knowledge, to develop an improved lifecycle
cost model of its property and public open space assets, in order to better understand the true costs of service
delivery. Furthermore, this will then allow the Shire to ensure that it can close any funding shortfall that exists.
Financial data for maintenance, upgrades, operations and renewals have been provided from the Shire’s financial budgets. While the 5 Year Building Plan does contains expenditure by different types of property or public open space assets, it is not recorded by maintenance, upgrades, operations and renewals. For this AMP, it has been assumed that future expenditure levels will be similar to historical expenditure, and planned expenditure has been calculated as the average between the 2011/12 historical and the 2012/13 budgeted expenditure figures.
Further refinement of the Shire’s recording of activity cost expenditure practices is required to improve the following
lifecycle projections. In addition, the financial projections will be improved as the level of data confidence improves.

COMMUNITY FACILITIES ASSET MANAGEMENT PLAN - 20 -
SHIRE OF ANYWHERE
Road Asset Management Plan 2011/12 – 2020/21
Table 5-6 and Table 5-7 illustrate expected planned expenditure levels over the life of this AMP for property and public open spaces’.
2012/13(Budget) 2013/14 2014/15 2015/16 2016/17 2017/18 2018/19 2019/20 2020/21 2021/22
New/
Upgrade $48,500 $34,277 $34,277 $34,277 $34,277 $34,277 $34,277 $34,277 $34,277 $34,277
Operation /
Maintenance $389,547 $369,706 $369,706 $369,706 $369,706 $369,706 $369,706 $369,706 $369,706 $369,706
Renewal $116,020 $282,513 $282,513 $282,513 $282,513 $282,513 $282,513 $282,513 $282,513 $282,513
Total $554,067 $686,496 $686,496 $686,496 $686,496 $686,496 $686,496 $686,496 $686,496 $686,496
Table 5-6: Planned Expenditure for Property
2012/13(Budget) 2013/14 2014/15 2015/16 2016/17 2017/18 2018/19 2019/20 2020/21 2021/22
New/ Upgrade $1,691,762 $117,237 $117,237 $117,237 $117,237 $117,237 $117,237 $117,237 $117,237 $117,237
Operation /
Maintenance $808,827 $689,112 $689,112 $689,112 $689,112 $689,112 $689,112 $689,112 $689,112 $689,112
Renewal $127,688 $98,277 $98,277 $98,277 $98,277 $98,277 $98,277 $98,277 $98,277 $98,277
Total $2,628,277 $904,626 $904,626 $904,626 $904,626 $904,626 $904,626 $904,626 $904,626 $904,626
Table 5-7: Planned Expenditure for Public Open Spaces’

COMMUNITY FACILITIES ASSET MANAGEMENT PLAN - 21 -
SHIRE OF ANYWHERE
Road Asset Management Plan 2011/12 – 2020/21
Table 5-8 and Table 5-9 illustrate the required expenditure over the life of this AMP, this has been based on the 5 Year Building and Public Open Spaces’ Plans and includes Operation, Maintenance and Renewals, however the confidence levels of this calculation is low.
2011/12 2012/13 2013/14 2014/15 2015/16
Buildings $775,188 $3,500,430 $527,730 $475,630 $123,730
POS $346,150 $206,950 $360,00 $117,000 $14,000
Total Budget Amount $1,121,388 $3,710,280 $551,530 $600,430 $137,230
Table 5-8: 5 Year Building and Public Open Spaces’ Plans Total Required Expenditure
Source: 5 Year Building and Public Open Spaces’ Plans and includes Operation, Maintenance, Renewals and Upgrades.
2016/17 2017/18 2018/19 2019/20 2020/21 2021/22
Buildings $1,080,542 $1,080,542 $1,080,542 $1,080,542 $1,080,542 $1,080,542
POS $144,020 $144,020 $144,020 $144,020 $144,020 $144,020
Total Budget
Amount $1,224,562 $1,224,562 $1,224,562 $1,224,562 $1,224,562 $1,224,562
Table 5-9: 5 Year Average of Total Required Expenditure based on the 5 Year Building and Public Open Spaces’ Plans
5.8 Disposal Plan
Disposal includes any activity associated with disposal of a decommissioned asset including sale, demolition or relocation. The Table 5-11 shows the proposed disposals from the 2012/13 budget.
Housing Net Book
Value Sale Proceeds
(Asset 1086 ) Sale of 520 Tuart Street Leeman $204,900 $540,000
(Asset 1062 ) Sale of Lot 103 Bristol Street Coorow
$19,060 $85,000
Table 5-10: Source: Disposal of Assets, Housing – 2012/13 Budget

COMMUNITY FACILITIES ASSET MANAGEMENT PLAN - 22 -
SHIRE OF ANYWHERE
Road Asset Management Plan 2011/12 – 2020/21
5.9 Gap Analysis
This section analyses the variance between the predicted full life cycle cost (including operations, maintenance, renewal, upgrade, but excluding new growth), and planned expenditure. This variance indicates the life cycle gap, showing insufficient asset expenditure, or a surplus, showing excessive expenditure. This gap indicates whether further work is required to manage required Levels of Service and funding to eliminate any funding gap. Providing services in a sustainable manner will require matching of predicted asset expenditure to meet agreed Levels of Service with planned capital works programs and available revenue.
At this stage it is not possible to estimate the expenditure gap since the required Capital Renewal expenditure has been assumed to be equal to the planned Capital Renewal expenditure as the construction / installation dates are missing for Public Open Spaces assets and current condition data available for Property or Public Open Spaces are not available.
Gap analysis summary
With further work set to continue with the asset register data (asset age and regular condition assessments), the reprioritisation of maintenance, and any the backlog of renewals is completed, the accuracy of these forecasts will improve, allowing a gap analysis to be undertaken.
5.9.1 Asset Sustainability Ratios
As part of the Department of Local Government (DLG) Asset Management Framework and Guidelines the Shire will need to report three ratios. The Shire’s current ratios for the assets covered in this plan are shown below and will be monitored and reported annually.
Description Value
Current Replacement Cost
Property and Buildings - $6,860,276.50
Public Open Spaces - $518,912.26
$7,379,187.76
Depreciated Replacement Cost (DRC)
Property and Buildings - $5,079,629.69
Public Open Spaces - $376,086.56
$5,455,716.25
Annual Depreciation Expense
Property and Buildings - $159,098.04
Public Open Spaces - $14,241.19
$173,339.23
Planned Capital Renewal Expenditure
Property and Buildings - $2,658,637
Public Open Spaces - $1,012,181
$3,670,818
Required Capital Renewal Expenditure *
Property and Buildings - $2,658,637
Public Open Spaces - $1,012,181
$3,670,818
* At this stage it is not possible to estimate the required Capital Renewal expenditure since there is no current condition data
available for Property or Public Open Spaces and construction / installation dates are missing for Public Open Spaces assets,
therefore for this AMP, it has been assumed that the required capital renewal expenditure is the same as the planned capital
renewal expenditure.
Table 5-11: Asset Sustainability Rates

COMMUNITY FACILITIES ASSET MANAGEMENT PLAN - 23 -
SHIRE OF ANYWHERE
Road Asset Management Plan 2011/12 – 2020/21
Ratio Value DLG’s target ranges
Asset Sustainability Ratio
(Annual Planning Capital Renewal expenditure/Annual Depreciation Expense)
211.77% 90% - 110%
Asset Renewal Funding Ratio
(Planned Capital Renewal Expenditure/Required Capital Renewal Expenditure)
100% 95% -100%
Asset Consumption Ratio
(Depreciated Replacement Cost/Current Replacement Cost) 69.71% 50% - 75%
Table 5-12: Asset Ratios
The Asset Sustainability Ratio indicates that planning renewal expenditure exceeds the annual depreciation expense. Given the low conference of the historical expenditure data, it likely that both the annual depreciation expense and the planning renewal expenditure values are not correct, leading to incorrect ratios being reported.
To provide services in a financially sustainable manner, as a minimum, the Shire will need to ensure that it is renewing assets at the rate they are being consumed over the medium-long term, and funding the life cycle costs for all new assets and services in its long term financial plan.
5.9.2 Key Assumptions made in Financial Forecasts
This section details the key assumptions made in presenting the information contained in this asset management plan and in preparing forecasts of required operating and capital expenditure and asset values, depreciation expense and carrying amount estimates. It is presented to enable readers to gain an understanding of the levels of confidence in the data behind the financial forecasts.
Key assumptions made in this asset management plan are:
The asset registers, including values, unit rates and useful lives are accurate;
The current Levels of Service will remain constant over the life of this AMP; and
Income and Expenditure details have been extracted from previous budgets are correct and complete;
All predicted financial figures are based on 2012 rates and are not adjusted by the inflation rate for the particular year of works.
5.9.3 Data confidence
The Shire does not currently have historical financial readily available data broken into categories such as property and public open spaces’. Therefore, the financial data has been extracted from the Shire’s annual budgets. It is considered that these figures are not accurate resulting in poor data confidence levels. The data confidence levels will improve in future revisions of the AMP as the data quality improves.
Table 5-13 below summarises the confidence levels of financial data obtained for this AMP.
Asset Category
Confidence Rating
Operations Maintenance Renewals Upgrades New/
Acquisitions
Expenditure (Historical) C C C C C
Forecast Expenditure C C D D D
Lifecycle Expenditure C C D D D
Table 5-13: Financial Data levels of confidence

COMMUNITY FACILITIES ASSET MANAGEMENT PLAN - 24 -
SHIRE OF ANYWHERE
Road Asset Management Plan 2011/12 – 2020/21
Table 5-14 below outlines the data confidence limits used in this AMP.
Confidence Description
A Highly Reliable < 2% uncertainty
Data based on sound records, procedure, investigations and analysis which is properly documented and recognised as the best method of assessment
B
Reliable ± 2-10% uncertainty
Data based on sound records, procedures, investigations, and analysis which is properly documented but has minor shortcomings’ for example the data is old, some documentation is missing and reliance is placed on unconfirmed reports or some extrapolation.
C
Reasonably Reliable ± 10 – 25 % uncertainty
Data based on sound records, procedures, investigations, and analysis which is properly documented but has minor shortcomings’ for example the data is old or incomplete, some documentation is missing and reliance is placed on unconfirmed reports or significant extrapolation.
D Uncertain ± 25 –50% uncertainty
Data based on uncertain records, procedures, investigations and analysis which is incomplete or unsupported, or extrapolation from a limited sample for which grade A or B data is available.
E Very Uncertain > 50% uncertainty
Data based on unconfirmed verbal reports and/or cursory inspection and analysis
Table 5-14: Levels of Confidence Definitions

COMMUNITY FACILITIES ASSET MANAGEMENT PLAN - 25 -
SHIRE OF ANYWHERE
Road Asset Management Plan 2011/12 – 2020/21
PLAN IMPROVEMENT AND MONITORING 6.
6.1 Performance Measures
The effectiveness of the asset management plan can be measured in the following ways:
The degree to which the required cashflows identified in this asset management plan are incorporated into the organisation’s long term financial plan and Community/Strategic Planning processes and documents; and
The degree to which the 5 year detailed works programs, budgets, corporate business plans and organisational structures take into account the ‘global’ works program trends provided by the asset management plan.
6.2 Improvement Plan
The improvement plan generated from this asset management plan is shown in Table 6-1.
Act
ion
Nu
mb
er
Act
ion
Pre
req
uis
ite
Act
ion
Pri
ori
ty (
Hig
h =
1 -
2 y
ear
,
Me
diu
m =
2 –
4 y
ear
s,
Low
=3
- 6
ye
ars
Service Focus
1 Procure and implement a suitable property and public open spaces’ management system.
Nil High
2 Develop a component hierarchy / priority for property and public open spaces’ and collect attributes with condition rating process.
Nil High
3 Carry out audit of assets, review and update the Property and PoS asset registers.
Nil High
4 Develop a process for community engagement on Levels of Service. Nil High
5 Link asset hierarchy to Levels of Service. 2,4 High
6 Develop Levels of Service based on performance criteria / needs & affordability.
1,2,3,4 Medium
7 Investigate the feasibility of implementing a maintenance management system, including the capture & categorisation of customer requests.
Nil Medium
Knowledge
8 Carry out 5% audit on assets with regard to physical asset data, date acquired, dimensions, structure, and condition. Increase audit if results are poor and update inventory data.
1-3,8 High
9 Develop a diagram that defines the organisation’s asset management documentation structure and include in the AM Strategy.
Nil High
10 Configure the Shire’s corporate financial system and works management system to record asset expenditure at the individual asset level according to maintenance type and activity.
Nil High
11 Develop process to split project expenditure crossing multiple expenditure categories (renewals, upgrade and new) for financial reporting and sustainability ratio reporting purposes.
Nil High

COMMUNITY FACILITIES ASSET MANAGEMENT PLAN - 26 -
SHIRE OF ANYWHERE
Road Asset Management Plan 2011/12 – 2020/21
Act
ion
Nu
mb
er
Act
ion
Pre
req
uis
ite
Act
ion
Pri
ori
ty (
Hig
h =
1 -
2 y
ear
,
Me
diu
m =
2 –
4 y
ear
s,
Low
=3
- 6
ye
ars
12 Develop an asset inventory updating procedure to ensure ongoing integrity. Nil High
13 Implement the condition inspection programme for roads and paths. Nil Medium
14 Develop Councils Data Collection Manuals to ensure repeatability and on‐going improvement of condition data collection and modelling processes.
1-3,8-10 Medium
15 Create definitions around which activities constitute operational, maintenance, renewal, upgrade, new and disposal works.
Nil High
16 Improve the manner with which the Shire carries out the forward works planning to increase the reliability of the planned upgrade and new forward works expenditure levels.
8 Medium
17 Develop safety and maintenance inspection programmes and methodologies for assets.
Nil Low
18 Implement safety and maintenance inspection programme for assets. Nil Low
Governance
19 Revalue the assets within the AMP. 3 High
20 Develop a process to capture Property and POS maintenance activities by cost, asset or action.
Nil High
21 Determine split in costs between renewal and upgrades for all future upgrades.
15 High
22 Develop a corporate set of unit rates for property and public open spaces’, and test against past projects.
Nil High
23 Define the asset responsibilities of Shire financial staff. 8 High
24 Update long term capital works programme after undertaking condition inspections.
1-3,8-10, Medium
25 Link AMP to LTFP and review AMP against LTFP outputs prior to each new version of the AMP.
24 Medium
26 Develop a corporate risk register to allow aggregation of identified risks. Nil Medium
27 Link Workforce Management Plan to the AM Strategy. Nil Medium
28 Develop a framework for reporting AM outcomes to Council and customers. Nil Low
29 Develop a Shire population & demographic model for infrastructure planning purposes.
Nil Low
Skills
30 Develop a formal staff AM training programme, including induction awareness. 23 High
31 Develop a business continuity plan for AM activities. 23 Medium
32 Develop a formal Councillor AM training programme. 23 Medium
33 Develop staff AM performance measures and link KPIs to individual job descriptions.
30,31,32 Low
Table 6-1: Improvement Plan for Property and Public Open Spaces’
COMMUNITY FACILITIES ASSET MANAGEMENT PLAN - 27 -
SHIRE OF ANYWHERE
Road Asset Management Plan 2011/12 – 2020/21
6.3 Monitoring and Review Procedures
This asset management plan will be reviewed during annual budget preparation and amended to recognise any material changes in levels of service and/or resources available to provide those services as a result of the budget decision process.
The AMP has a life of 4 years and is due for revision and updating within 2 years of each Council election.

COMMUNITY FACILITIES ASSET MANAGEMENT PLAN - 28 -
SHIRE OF ANYWHERE
Road Asset Management Plan 2011/12 – 2020/21
ASSET PORTFOLIO AND VALUATION APPENDIX A.
Property and Buildings
Asset
Number Asset Name
Date
Acquired
Accumulate
Historical Cost
(CRC)
Accumulated
Depreciation
Annual
Depreciation
Depreciation
Replacement
Cost (DRC)
1001 Vacant Land Lot 2 Main St 1/02/1980 $2,237.95
1002 Vacant Land Lot 3 Main St 1/02/1980 $400.00
1003 Vacant Land Lot 4 Main St 1/02/1980 $400.00
1006 Vacant Lots 42/43 Commercial 1/02/1980 $3,698.00
1010 Townpark Lot 44 Commercial 28/05/2007 $607.05 $27.60 $15.08 $579.45
1014 Vacant Lot 30 Spain St Commercial 1/02/1980 $450.00
1036 Vacant Land Lot 16 Long St 1/02/1980 $305.00
1039 Vacant Land Lot 10 Midland 1/02/1980 $3,000.00
1042 Vacant Land Lot 31 Marchagee 22/06/1995 $1,329.50
1000 Bowling Club Lot 12 Main 1/11/1975 $76,247.00 $34,315.41 $1,906.37 $41,931.59
1004 Coorow Administration Centre 30/06/2006 $165,183.97 $35,441.19 $3,887.01 $129,742.78
1005 Coorow District Hall Main 30/06/2008 $269,171.53 $40,156.89 $6,339.09 $229,014.64
1009 House Lot 5 Bristol St Coorow 30/06/2006 $43,439.28 $11,692.97 $907.18 $31,746.31
1010 Green Head Sporting Club 30/06/2010 $100,785.14 $6,533.97 $6,533.97 $94,251.17
1012 Coorow Works Depot Lot M58 30/06/2006 $161,673.72 $53,961.67 $4,041.74 $107,712.05
1013 House Lot 29 Spain St Coorow 30/06/2007 $128,755.62 $53,290.48 $3,172.09 $75,465.14
1019 Dining Hall Maley Park 1/05/1975 $9,589.88 $4,315.08 $239.71 $5,274.80
1021 Change Rooms Maley Park 30/06/2008 $481,879.08 $41,982.89 $12,046.91 $439,896.19
1022 Swimming Pool Coorow 30/06/2005 $293,257.21 $80,814.04 $6,726.71 $212,443.17
1023 Maley Park Community Centre 30/06/2010 $303,626.58 $96,232.28 $7,590.61 $207,394.30
1025 Hall Waddi Forest 21/07/1998 $110.00 $8.10 $2.70 $101.90
1027 Change Rooms Wann Park 1/01/1999 $15,783.00 $7,102.09 $394.55 $8,680.91
1029 Wynmara Well Cw/Lth Rd 21/07/1998 $108.00 $7.86 $2.62 $100.14
1030 Leeman Country Club Lot 9 1/05/1990 $71,000.00 $31,949.75 $1,774.97 $39,050.25
1032 Ablution Block Leeman 30/06/2011 $27,492.84 $11,814.58 $687.27 $15,678.26
1033 Ablution Block Cliff Park 30/06/2010 $74,247.81 $14,817.92 $1,856.11 $59,429.89
1035 House Lot 49 Nairn St Leeman 1/07/1993 $56,851.05 $17,771.62 $984.54 $39,079.43
1038 House Lot 131 Spain St Coorow 1/07/1993 $128,068.68 $46,788.23 $2,756.78 $81,280.45
1040 House Lot 64 Nairn St Leeman 17/01/2007 $165,025.62 $36,749.92 $4,074.91 $128,275.70

COMMUNITY FACILITIES ASSET MANAGEMENT PLAN - 29 -
SHIRE OF ANYWHERE
Road Asset Management Plan 2011/12 – 2020/21
Asset
Number Asset Name
Date
Acquired
Accumulate
Historical Cost
(CRC)
Accumulated
Depreciation
Annual
Depreciation
Depreciation
Replacement
Cost (DRC)
1041 LGCHP Lot 490 Tamarisk St 13/06/2000 $64,979.35 $29,239.81 $1,624.37 $35,739.54
1044 Receival Depot Greenhead 22/06/2000 $4,061.70 $4,061.70
1045 Sanitation Depot Coast 11/02/1978 $2,848.22 $1,281.16 $71.14 $1,567.06
1046 Environmental Restoration 11/02/1978 $5,918.33 $5,918.33
1050 Environmental Rehabilitation 1/01/2000 $5,083.09 $5,083.09
1052 Leeman Works Depot & Dog 30/08/1993 $80,015.86 $34,505.80 $1,916.96 $45,510.06
1053 Caravan Park Coorow 1/07/1993 $165,381.13 $52,137.38 $2,896.48 $113,243.75
1054 Admin/Lib Building Morcombe 30/06/2010 $385,462.92 $129,395.19 $9,150.19 $256,067.73
1055 Community Centre Greenhead 30/06/2010 $181,363.99 $54,748.95 $4,434.04 $126,615.04
1056 House Pool Manager's Resident 27/01/2006 $139,358.79 $47,267.20 $2,791.41 $92,091.59
1057 Greenhead Works Depot 1/07/1993 $20,476.20 $5,688.39 $401.86 $14,787.81
1059 2x25,000 Gal Concrete Water tank 12/12/1991 $12,520.72 $5,633.75 $312.95 $6,886.97
1060 Lot 539 Thornbill St Greenhead 20/08/1991 $20,000.00
1061 Drainage Greenhead Townsite 10/09/1992 $690.93 $310.20 $17.18 $380.73
1062 Lot 103 Bristol St Coorow 19/10/1993 $34,456.02 $12,742.93 $831.79 $21,713.09
1063 Warradarge Emergency Service 30/03/1994 $82,952.65 $10,948.97 $2,073.79 $72,003.68
1064 Leeman Recreation Centre 1/01/1996 $1,311,229.14 $424,212.12 $32,189.71 $887,017.02
1065 Child Care Centre 426 1/06/1996 $71,114.00 $21,333.52 $1,422.19 $49,780.48
1066 Green Head Tennis Courts 1/05/1996 $62,589.69 $43,501.88 $3,129.44 $19,087.81
1067 Emergency Shed Leeman 24/06/1997 $61,937.22 $20,943.04 $1,548.39 $40,994.18
1068 Green Head Retransmission 1/03/1997 $71,484.55 $5,808.90 $447.68 $65,675.65
1069 House Lot 42 Commercial 24/06/1997 $186,971.43 $48,907.55 $3,598.78 $138,063.88
1070 HACC Shed 1/07/1997 $1,095.53 $355.65 $27.34 $739.88
1071 House Lot 50 Nairn St Leeman 30/06/1998 $196,152.00 $52,487.43 $4,046.18 $143,664.57
1072 Leeman Back Beach Ablution 31/05/2000 $35,114.32 $9,730.25 $877.79 $25,384.07
1073 Green Head Chess Pavilion 31/05/2000 $7,447.99 $2,063.62 $186.15 $5,384.37
1078 Green Head Fire Station 30/06/2001 $57,623.45 $13,693.09 $1,440.56 $43,930.36
1079 Aged Persons Accommodation 30/06/2001 $46,849.95 $12,118.84 $1,171.17 $34,731.11
1080 House Lot 123 Commercial 30/11/2000 $280,170.49
1081 Ablution Block Morphett 30/06/2001 $36,607.48 $9,140.05 $915.12 $27,467.43
1083 Drummaster Compound 18/03/2001 $2,166.00 $554.48 $54.08 $1,611.52
1085 Medical Centre - Main St 30/06/2002 $113,257.59 $22,707.82 $2,831.37 $90,549.77

COMMUNITY FACILITIES ASSET MANAGEMENT PLAN - 30 -
SHIRE OF ANYWHERE
Road Asset Management Plan 2011/12 – 2020/21
Asset
Number Asset Name
Date
Acquired
Accumulate
Historical Cost
(CRC)
Accumulated
Depreciation
Annual
Depreciation
Depreciation
Replacement
Cost (DRC)
1086 House Lot 520 Tuart Street 29/11/2002 $284,575.67 $58,480.98 $6,888.74 $226,094.69
1089 Ablution Block - Coorow 20/02/2011 $19,813.10 $3,993.73 $495.25 $15,819.37
1090 House Lot 11 Spain Street 19/05/2006 $104,519.86 $2,612.98 $2,612.92 $101,906.88
1091 Coorow Aged Persons Units 7/06/2006 $73,657.73 $1,612.17 $1,612.11 $72,045.56
3071 Coorow Fire Station Shed 30/06/2005 $35,377.54 $884.43 $884.37 $34,493.11
3500 Leeman Retransmission Building 9/10/2007 $10,228.36 $766.89 $255.62 $9,461.47
Totals 67 buildings
$6,860,276.50 $1,780,646.81 $159,098.04 $4,767,638.75
Table 6-2: Property / Buildings and 2012 CRC
The above information has been extracted from the Shire’s Asset Register. However, the level of data confidence is considered low. This section will be improved as more information becomes available and the level of data confidence improves. The Current Replacement Cost is based the Accumulative Historical Cost (Historical Cost plus purchases and additions).

COMMUNITY FACILITIES ASSET MANAGEMENT PLAN - 31 -
SHIRE OF ANYWHERE
Road Asset Management Plan 2011/12 – 2020/21
Public Open Spaces
Asset Numbers Included in PoS
Asset Name Level of Service
Current Replacement
Cost
Accumulated Depreciation
Annual Deprecation
DRC
1048 Rotary Park Med LOS
Park $8,673.34 $ 8,673.34 $0 $0
- Town Park High $240,301.76 $ 74,009.10 $ 6,007.47 $166,292.66
1016-1018, 1020 and 1082
Maley Park Med High $119,528.00 $ 19,857.63 $ 2,988.16 $ 99,670.37
1026, 1028 and 5006
Wann Park Med High $6,258.18 $ 3,441.24 $ 156.36 $ 2,816.94
- Back Beach Med High $28,155.49 $ 7,505.24 $ 703.85 $ 20,650.25
1037 and 1084 Foreshore Park High $55,227.25 $ 20,653.34 $ 1,380.65 $ 34,573.91
- Morphett Park High $15,393.00 $ 1,760.69 $ 1,924.03 $ 13,632.31
1077 Dynamite Bay High $20,523.36 $ 304.72 $ 459.54 $ 20,218.64
- Cliff Park High $16,872.88 $ 4,449.44 $ 421.77 $ 12,423.44
- Battersby Park Med Low $7,778.00 $ 2,155.08 $ 194.40 $5,622.92
-
1024 Lakes Park Med Low $200.00 $ 14.88 $ 4.96 $ 185.12
Totals 11 $518,912 $142,824.70 $14,241.19 $376,086.56
Table 6-3: Public Open Spaces’ and 2012 CRC
Level of Service Description CRC Over
Basic LOS park Grassed only $0
Med Low Grass, path, beds, benches $10,000
Med LOS park Grass, path, beds, benches, basic playground on soft area $30,000
Med High Grass, path, beds, benches, Top notch playground on soft area $60,000
High Grass, path, beds, benches, Top notch playground on soft area, BBQ, Pergola $100,000
Table 6-4: Public Open Spaces Level of Service Description

COMMUNITY FACILITIES ASSET MANAGEMENT PLAN - 32 -
SHIRE OF ANYWHERE
Road Asset Management Plan 2011/12 – 2020/21
Public Open Spaces Date Acquired
Rotary Park
Rotary Park Lot 92 1/01/1992
Town Park
Maley Park
Tennis Courts 30/06/2010
Basketball Courts 30/04/2009
Oval Reticulation 12/05/1994
Skate Park - Coorow 31/10/2000
Wann Park
Basketball Courts & Retic 2/02/2005
Playground Equipment 19/01/2011
Back Beach
Foreshore Park
Playground Foreshore Park 30/06/2010
Skate Park Leeman 15/03/2002
Morphett Park
Dynamite Bay
Dynamite Bay Rotunda 30/06/2000
Cliff Park
Battersby Park
Lakes Park
Tennis Courts Waddi Forest 21/07/1993
Table 6-5: Age Profile for Public Open Spaces’
The above information has been provided from the Shire’s Asset Register. The level of data confidence is low. This section will be improved as more information becomes available and the level of data confidence improves.

COMMUNITY FACILITIES ASSET MANAGEMENT PLAN - 33 -
SHIRE OF ANYWHERE
Road Asset Management Plan 2011/12 – 2020/21
RISK MANAGEMENT ANLYSIS APPENDIX B.
The risk analysis has been undertaken to be compliant with AS 4360, and has been conducted on a broad (macro)
portfolio basis given the lack of knowledge of certain critical community facility areas. In-lieu of a corporate risk policy
and objectives, the following statement defines what an ‘acceptable’ level of risk is, in regards to the community
facility assets.
Through risk management, the Shire aims to:
Protect the quality of services provided from community facilities;
Protect users of properties and public open spaces’;
Protect the Shire’s assets and public image;
Reduce the Shire’s exposure to risk;
Promote effective financial and asset management practices.
This will be achieved through:
Identifying, decreasing the likelihood, and mitigating the consequences of risk, within the constraints of
sensible commercial objectives and practices;
Applying risk based practices to the management of the portfolio and associated decision making;
Maintaining safe and reliable equipment and infrastructure;
Preparing appropriate contingencies;
Reviewing the risk profile of properties and public open spaces’ at appropriate intervals and when
circumstances dictate;
Maintaining an up to date community facilities asset management plan.
Risk Criteria
Table 6-5 details the likelihood and consequence levels and scale which has been applied to the risk analysis. The
combined values for each are then identified on the risk matrix to determine a risk value between low and extreme.
The Risk Criteria has been used to produce the Risk Analysis of the Shires community facilities AMP, this is displayed in
Table 6-6.

COMMUNITY FACILITIES ASSET MANAGEMENT PLAN - 34 -
SHIRE OF ANYWHERE
Road Asset Management Plan 2011/12 – 2020/21
Table 6-6: Risk Matrix
LIKELIHOOD (LK.) TABLE
5. Almost Certain
The event is expected to occur > once per year Event has more than a 75% chance of occurring Will occur within the next 6 months
4. Likely
The event will probably occur once per year Event has 50-74% chance of occurring Will occur within 18 months
3. Possible
Risk event could occur at some time Event has 25-49% chance of occurring Will occur within 30 months
2. Unlikely
Risk event is unlikely to occur Event has less than 25% chance of occurring May occur within 5 years
1. Rare
Event may only occur in exceptional circumstances Not likely to occur within next 5 years
CONSEQUENCE (CON.) TABLE
5.Catastrophic Financial impact > $3 million Very high Member sensitivity Irreparable damage to ARRB’s image and reputation Cessation of business due to Agreement non-compliance
4. Major Financial impact $500K - $3m Significant Member sensitivity, damage to reputation Financial impact on business or strategic objectives
3.Moderate Financial impact $50K - $500K Moderate Participant sensitivity, damage to reputation Moderate impact on business and strategic objectives
2. Minor Financial impact < $50K Minimal damage to image and reputation Minimal impact on business and strategic objectives
1. Insignificant Consequences are dealt with by routine operations
LIK
ELIH
OO
D
5- Almost Certain
6 7 8 9 10
4 – Likely 5 6 7 8 9
3 –Possible 4 5 6 7 8
2 – Unlikely 3 4 5 6 7
1 – Rare 2 3 4 5 6
1 –
Insignificant 2 – Minor 3 – Moderate 4 – Major 5 - Catastrophic
CONSEQUENCE
9 – 10 Critical Risk – Must implement control measures.
7 – 8 High Risk – Must complete control evaluation.
5 – 6 Medium Risk – Management of responsibility.
2 - 4 Low Risk – Monitor. Examination of controls is not specifically required.

COMMUNITY FACILITIES ASSET MANAGEMENT PLAN - 35 -
SHIRE OF ANYWHERE
Road Asset Management Plan 2011/12 – 2020/21
Risk Analysis
Asset: Property and Public Open Space Compiled by: Marie Sorrell Date: 20 February 2013
Reviewed by: Darren Friend Date of risk review:
Ref No. The Risk Event (What
happens)
Cause (How this
happens)
Consequence
(What results)
Existing
controls
Effectiveness
of existing
controls
Analysis (1 (Low) – 5 (High))
Risk
Priority
Treat
Risk
(Y/N)
Further Action Likeli-
hood
Conse-
quence
Level
of
risk
1
No single corporate
property or public
open space
inventory exists.
Buildings and
public open
spaces managed
sub-optimally.
No structured
asset
management
practices.
Higher whole of
life costs, lower
service levels.
Ad-hoc
inventories. Low 5 4
High
(9) =1 Y
Develop single,
spatially referenced,
corporate inventory
for buildings and
public open spaces’.
3
No single corporate
property or public
open space
inventory exists.
Individual
components not
recorded.
No structured
asset
management
practices.
Renewal
suboptimal, ORC
unknown.
Nil N/A 5 4 High
(9) =1 Y
Develop single,
spatially referenced,
corporate inventory
for buildings and
public open spaces’.
2
There is no property
or public open
space condition
data and no
formalised
inspection regime.
Buildings and
public open
spaces’ renewed
sub-optimally.
Asset becomes
unusable because
of poor condition.
No formal rating
programme.
Higher whole of
life costs, and
lower service
levels.
Ad-hoc
inspections,
stakeholder
maintenance
requests.
Low 5 4 High
(9) =1 Y
Develop formal
inspection regimes
for buildings and
public open spaces’
and implement.
4
No formalised
maintenance
management
regime for buildings
and public open
spaces’.
Buildings and
public open
spaces’ reactively
maintained.
No inspection
process and/or
intervention
framework.
Higher costs,
higher exposure
to H&S risk, mis-
prioritisation.
Adhoc
inspections,
stakeholder
maintenance
requests.
Low 5 4 High
(9) =1 Y
Develop cyclical
maintenance regimes
for buildings and
public open spaces’.

COMMUNITY FACILITIES ASSET MANAGEMENT PLAN - 36 -
SHIRE OF ANYWHERE
Road Asset Management Plan 2011/12 – 2020/21
Asset: Property and Public Open Space Compiled by: Marie Sorrell Date: 20 February 2013
Reviewed by: Darren Friend Date of risk review:
Ref No. The Risk Event (What
happens)
Cause (How this
happens)
Consequence
(What results)
Existing
controls
Effectiveness
of existing
controls
Analysis (1 (Low) – 5 (High))
Risk
Priority
Treat
Risk
(Y/N)
Further Action Likeli-
hood
Conse-
quence
Level
of
risk
5
No long term
renewal
programme.
Buildings and
public open
spaces’ managed
sub-optimally.
No formal rating
programme.
Higher whole of
life costs, lower
service levels.
Nil N/A 5 4 High
(9) =1 Y
Develop renewal
programme for
buildings and public
open spaces’ from
condition ratings.
Table 6-7: Risk Analysis

COMMUNITY FACILITIES ASSET MANAGEMENT PLAN - 37 -
SHIRE OF ANYWHERE
Road Asset Management Plan 2011/12 – 2020/21
DEMAND FORECAST APPENDIX C.
This AMP considers a 10 year planning horizon and therefore the factors that may influence the potential demand of
community facilities must be recognised over this time. The following section provides commentary on different
factors that may be subject to change and that in turn, may affect the demand for building and public open space
facilities.
In undertaking this analysis of possible demand, selected Australian Bureau of Statistics (ABS) and Western Australia
Tomorrow information has been used to develop first cut demand projections, as well as Shire documentation and
knowledge. The projections will require future revision as the Shire’s community facilities knowledge improves.
Political
Policy Change
Local government policy change, as well as state government service reallocation, can often affect the demand for
community facilities. At present, no specific changes to policy have been identified which will affect demand on the
Shire’s property or public open space portfolio.
Given that that the Shire is not aware of any intended changes to policy that may affect demand, and that major
increases in development levels are not expected, it is concluded that policy driven demand will remain unchanged.
Demand Change: No change
Economic
Local Economic Change
The Shire’s primary industry is agriculture. In 2006, the most common industries in which people in the Shire of Coorow worked were Agriculture, Forestry and Fishing (40%); Mining (12%); Construction (8%); Retail trade (8%); and Education and Training (7%). The remainder of the population were employed in services such as: public safety and administration, accommodation and food services, and transport postal and warehousing.
As things currently stand, it is thought that there will be no change in community facilities demand from economic sources.
Demand Change: No change
Shire Financial Capacity
The cost of providing community facilities to the community is primarily funded from the municipal budget, and
community services must compete for funds along with other services and assets that the Shire provides. However,
recent studies on WA Local Government suggest that many are not financially sustainable. Subsequent recent changes
to the WA Local Government Act are now driving Councils towards measuring and achieving long term financial
sustainability. It should be noted that at present it is unclear as to how financially sustainable the Shire of Coorow is.
However, it can be expected that through its integrated planning framework, that future consideration of sustainable
asset service levels will be considered.
Therefore, a possible increase in demand could reasonably be expected due to increased Shire financial capacity.
Demand Change: Likely increase in demand

COMMUNITY FACILITIES ASSET MANAGEMENT PLAN - 38 -
SHIRE OF ANYWHERE
Road Asset Management Plan 2011/12 – 2020/21
Shire Resource Capacity
In recent years many sectors of the WA economy have felt the “squeeze” from a highly competitive labour market.
This has been exasperated by a strong resource sector, as well as an ageing population. The local government market
is certainly not immune to this and over recent years, has certainly had to seriously consider its recruitment and
retention practices in order to maintain sufficient staffing levels.
For local government, an ageing professional work force, combined with a labour shortage and an increase in
statutory obligations has meant that resource capacity is stretched. A key concern is whether the Shire will be able to
maintain the provision of its assets and services to the same service level in to the future if its resourcing level
continues to be further restrained. Consideration will be needed by the Shire to ensure that it can resource the long
term management of its assets and services.
Demand Change: No Change, although further research required
Social
Population
According to population projections, by 2026, the population of the Shire of Coorow is expected to increase then fall to approximately 1,200. The 2011 census shows the actual population in 2011 was lower than earlier estimated, with only 1,067 persons recorded compared with an expected 1,600.
Figure 6-1: ABS Estimated Shire Population 2001-2010 (Draft – Our future Coorow 2012-2022)
Demand Change: Likely lower demand for community facilities
Demographics
The median age of persons in the Shire is 46 years of age, which is higher than the Mid- West region, at 38 years of age. Compared with the Mid West, the Shire consistently shows fewer people through all age groups up to 45 years of age, and then more people in each age group from 45 years of age through to 84 years of age.
The population has aged since 2001 with the percentage of those aged 0-14, 25-34 and 35-44 significantly reducing, while those in the age groups 55-64, 65-74 and 75-84 all increasing sharply. The average age in 2001 was 36.
Demand Change: Reducing demand for roads, increased demand for paths

COMMUNITY FACILITIES ASSET MANAGEMENT PLAN - 39 -
SHIRE OF ANYWHERE
Road Asset Management Plan 2011/12 – 2020/21
Figure 6-2: Shire Population Age (Draft – Our future Coorow 2012-2022)
Demographic Change
By 2021 the largest age group living in the Shire of Coorow will be those aged 35-39 years old. The number of people aged 15 years and under is forecast to decrease by 1.8 %, and will make up 21.3 % of the population. The number of people aged 65 years and over is expected to decrease by 0.3 % to make up 13 % of the population by 2021.
Demand Change: Likely change in demand of types of community facilities provided
Tourism Growth
The Tourism Forecasting Committee is an independent body charged with providing present and future activity
forecasts. Tourism Research Australia also publishes the Forecast publication twice a year with contains forecasts for
the next 10 years. Figure 6-3 details the actual and forecasted total number of visitor nights between 2000 and 2020.
These figures exclude visitors staying in Perth. Between 2011 and 2020, total visitor nights are forecast to grow by
9.26% in total. This represents an increase of 1,820,000 extra visitor nights over this time.
0
5,000,000
10,000,000
15,000,000
20,000,000
25,000,000
30,000,000
20
00
20
01
20
02
20
03
20
04
20
05
20
06
20
07
20
08
20
09
20
10
20
11
20
12
20
13
20
14
20
15
20
16
20
17
20
18
20
19
20
20
Vis
ito
r N
igh
ts
Year
Tourism Change
Domestic Visitors
Inbound Visitors

COMMUNITY FACILITIES ASSET MANAGEMENT PLAN - 40 -
SHIRE OF ANYWHERE
Road Asset Management Plan 2011/12 – 2020/21
Figure 6-3: Past &Forecasted WA (non-Perth) Annual Visitor Nights
Within the Shire, the town sites of Leeman and Greenhead are coastal communities which are experiencing growth
due to tourism.
It is reasonable to expect tourism demand to grow in the Shire of Coorow. With sensible strategic investment into key
tourist assets, as well as in assets that contribute to overall town site aesthetics (e.g. public open spaces’), the Shire
could see tourism growth figures potentially rise above the expected state average of 9.26% by 2020 . However, any
future tourism growth will be strongly linked to both governmental and private industry investment within the Shire.
Overall, with predictions of increased tourism, this will result in higher utilisation of community facilities. This in turn
would mean the Shire will incur higher costs for asset replacement.
Demand Change: Likely higher demand for community facilities and enhanced maintenance practices
Recreation Change
One of the Shire’s aspirations and objectives is for a healthy community with an active lifestyle. One of the key
strategies to achieving this objective is to through recreation facilities and programs.
Therefore, for the Shire to meet and maintain its healthy lifestyle objective there will be a requirement to continually
improve and upgrade the existing community facilities.
Trends affect peoples’ participation and engagement, in particular levels of active sport and recreation participation.
By 2021 the largest age group living in the Shire of Coorow will be those aged 35-39 years old. This is a shift from the
current situation where the largest age group is those aged 50-54 years. Therefore, it is reasonable to expect a change
in demand for the types of community facilities available.
Demand growth driven by change in the largest age group may force the Shire to consider the types of community
facilities it provides. In summary, it is expected that there will be a change in demand which will likely lead to higher
costs for new community facility assets.
Demand Change: Likely increase in demand
Technology
The only significant technological change that has been identified as possibly affecting service demand is that of the
National Broadband Network (NBN). It is proposed that construction will commence from November 2013 (source:
NBN Website), the shire will provisionally receive fibre optic connections, resulting in significantly enhanced internet
speeds. This will allow residents and businesses to access emerging services, such as remote health care, streamed
entertainment (i.e. television and radio), social networking and so on. As more of the resident population having
internet access, demand for services such as the library may fall. There could even be further scope for staff to work
more remotely reducing demand for operational buildings. It seems likely though that demand will fall, unless some
services such as the library are redesigned to meet more modern standards.
Demand Change: Decrease in demand
Legal
Legislation
The Shire is bound to meet a range of legislative obligations, the majority of which are discussed elsewhere in this
AMP, which if altered, could affect the Shire’s management obligations.
COMMUNITY FACILITIES ASSET MANAGEMENT PLAN - 41 -
SHIRE OF ANYWHERE
Road Asset Management Plan 2011/12 – 2020/21
A current legislative driver of change is the proposed amendment of the Local Government Act. The Act is being
amended to promote integrated planning and ensure that long term financial planning, asset management planning
and workforce planning become standard business practices for all local governments. This outcome means that the
majority of WA local government organisations will have to notably improve their current practices and processes.
The production of this Community Facilities AMP is a step forward in improving the Shire’s capacity, however further
significant improvement will be required. Aside from an increase in resources being needed to improve the current
asset management practices, a change in demand may result if it is established that there are significant community
facilities issues, and/or that there is a large renewal funding gap.
In summary, the changes to the Local Government Act suggest that there will be an increased demand in resources
needed to undertake robust asset management practices, but that the outcomes and effects of this are not yet
known.
Demand Change: Increase in management resources
Environmental
Climate
The Federal Department of Sustainability, Environment, Water, Population and Communities suggests that future
temperature changes due to increasing greenhouse gas concentrations, could rise by 0.4 to 2.0⁰C by 2030 across
much of Australia (CSIRO 2001, Lindesay 2003). By 2070, temperatures are expected to be between 1.0 to 6.0⁰C
higher than in 1990, with the largest increases projected to occur in summer. Further, when severe weather events do
occur, these are also expected to become more frequent and more severe.
Whilst climatic change may not directly affect demand of the services provided by the Shire, an increase in climatic
variation may potentially reduce the attainable life of community facilities. Further, if as expected, resource costs
continue to increase proportionally above normal CPI levels, the financial cost of maintaining and operating
community facilities will rise.
Demand Change: Potentially higher whole-of-life costs and reduced community facility lives
Sustainability
At present, there is no particular legislative driver for community facilities to be environmentally sustainable. New
community facilities could be designed to be more environmentally sustainable (e.g. Green Star) and options exist for
the Shire to increase the sustainability of its existing community facilities, but this will involve a change of construction
and reuse practices, rather than specifically affecting demand.
Demand Change: No Change
Health & Safety
Health and safety is particularly relevant when considering the maintenance of buildings and public open spaces’, and
use in support of sports and recreational facilities.
A key consideration for health and safety is the development of a more robust inspection and maintenance regime for
community facilities, in order to proactively identify defects that may pose a safety hazard. An improved regime will
not only provide a higher service level to users, but potentially also reduce the whole of life costs of the network
through preventative maintenance. The cost of such a regime may also be potentially recovered through reduced
insurance premiums.
Demand Change: Increase in maintenance practices, but costs could be offset, while providing higher service level

COMMUNITY FACILITIES ASSET MANAGEMENT PLAN - 42 -
SHIRE OF ANYWHERE
Road Asset Management Plan 2011/12 – 2020/21
LEGISLATIVE ENVIRONMENT: ACTS AND REGULATIONS APPENDIX D.
The Shire has to meet many legislative requirements including Australian and State Legislation and State Regulations.
Many of these requirements are drivers for minimum service levels in that they are levels which the Shire must meet.
The current legislation which influences the Shire’s property and public open space management are:
Legislation applicable to Buildings and Public Open Spaces’
Legislation Requirement
Local Government Act,
1995 (WA)
The Act provides the principal legislative framework around which the roles, purpose,
responsibilities and powers of local governments as set out. Under the Act, regulations
set out a minimum requirement for all WA local governments to develop and maintain a
Strategic Community Plan and Corporate Business Plan. This compels the local
governments to establish long term service and asset strategies through robust asset
management practices.
Environmental
Protection Act, 1986
(WA)
The Environmental Protection Act 1986 provides for the formation of the Environmental
Protection Authority (EPA). It also provides for the prevention, control and abatement of
pollution and environmental harm and for the conservation, preservation, protection,
enhancement and management of the environment.
Disability
Discrimination Act
1992
The Federal Disability Discrimination Act 1992 (D.D.A.) provides protection for everyone
in Australia against discrimination based on disability. It encourages everyone to be
involved in implementing the Act and to share in the overall benefits to the community
and the economy that flow from participation by the widest range of people.
Occupational Health &
Safety Act 1984
The Occupational Health and Safety Act is concerned with protecting the safety, health
and welfare of people engaged in work or employment. The Act’s primary goal is to instil
health and safety programs to foster a safe work environment, but as a secondary effect,
may also protect co-workers, family members, employers, customers, suppliers etc. In
considering any property as a work site, and in planning, initiating and undertaking work
on sites, full consideration and application of the Act should be given in order to identify,
manage and reduce or mitigate the risk of harm to the Shire’s employees and
contractors.
Aboriginal Heritage Act
1972
Regulations and requirements that the Shire must comply with relating to aboriginal
heritage.
Native Title Act 1999 Regulations and requirements that the Shire must comply with in relation to the use of
land.
Town Planning &
Development Act 1928
Regulations and requirements that the Shire must comply with in relation to the use of
land.
Conservation and Land
Management Act 1984
Regulations and requirements that the Shire must comply with relating to the use of land
and vegetation.
Heritage Act, 1990 (WA)
The Heritage Act provides for, and encourages, the conservation of places which have
significance to the cultural heritage in the State, as well as to establish the Heritage
Council of WA. Amongst other activities, the Council maintains a state register of heritage
places, which are given legal protection under the Act. Generally, buildings on the
register must be maintained and cannot be diminished, destroyed or concealed.
Emergency The Act establishes the basis for a broader framework of regulations (Emergency

COMMUNITY FACILITIES ASSET MANAGEMENT PLAN - 43 -
SHIRE OF ANYWHERE
Road Asset Management Plan 2011/12 – 2020/21
Legislation applicable to Buildings and Public Open Spaces’
Legislation Requirement
Management Act, 2005
(WA)
Management Regulations 2006), a committee structure, the prescription of agencies to
fulfil the roles as hazard management agencies, combat agencies and support
organisations and a suite of State level plans and policies that link the operations of
emergency management. Generally, local governments often manage fire stations, as
well as use buildings for emergency management centres.
Table 6-8: Legislation, Acts and Regulations for all Asset Categories
Property
Legislation Requirement
Building Code of
Australia 2011
The Building Code of Australia (BCA) provides a nationally accepted and uniform set of
technical requirements for all areas of building, from design to construction. Developed
by the Australian Building Codes Board (ABCB) on behalf of the Commonwealth, State
and Territory Governments, the BCA is referred to as the building regulation in all States
and Territories.
All relevant Australian
Standards and Codes of
Practice
The Building Code of Australia references a number of other key standards and codes of
practice which must be considered for buildings. Typically, this covers:
Design;
Construction;
Services;
Management works (i.e. painting); and
Demolition.
Table 6-9: Legislation, Acts and Regulations for Property
Public Open Space
Legislation Requirement
Environment Protection Act (unauthorised
discharges) Regulations 2004 States that pesticides cannot be discharged into the environment.
OSH Regulations 1996 The guidelines for employees and employers to undertake within the work environment.
Rights in Water and Irrigation Act 1914 Licence to take water from the groundwater aquifer for the purposes
of irrigation of public open space.
Dividing Fences Act Local government exempt from 50/50 contribution for dividing fences
abutting public open space.
Bush Fires Act 1954 Regulates the specifications of firebreaks.
Health (Pesticides) Regulations 1956 Regulates the possession and use of pesticides.
Health Act 1911 Discharging causing pollution to waterways.
Wildlife Conservation Act 1950 Provides for the conservation and protection of native flora and fauna.

COMMUNITY FACILITIES ASSET MANAGEMENT PLAN - 44 -
SHIRE OF ANYWHERE
Road Asset Management Plan 2011/12 – 2020/21
Public Open Space
Legislation Requirement
Department of Employment & Workplace Relations - Code of Practice - Management of Hazardous Substances (NOH:1994)
Regulates the possession and use of poisons.
Other Standards and Regulations
Other relevant documents include, but are not limited to:
Contaminated Sites Act 2003
Contaminated Sites Regulations 2006
Aboriginal Heritage Regulations 1974
Agricultural and Veterinary Chemicals Act 1994
Agricultural and Related Resources Protection Act 1976
Biological Control Act 1986
Dangerous Goods Safety Act 2004
Poisons Act 1964
All other relevant State and Federal Acts & Regulations
All Local Laws and relevant policies of the organisation
Table 6-10: Legislation, Acts and Regulations for Public Open Space

COMMUNITY FACILITIES ASSET MANAGEMENT PLAN - 45 -
SHIRE OF ANYWHERE
Road Asset Management Plan 2011/12 – 2020/21
REFERENCES APPENDIX E.
1. Shire of Coorow, Community Engagement Policy, February, 2012
2. Shire of Coorow, Community Engagement Summary Report, July 2012
3. Our Future Coorow 2012 – 2022, The Shire of Coorow Strategic Community Plan, Draft
4. Shire of Coorow, Draft Long Term Financial Plan 2012 - 2022
5. Shire of Coorow, Forward Capital Works Plan 1st July to 30th June 2015
6. ABS (2012) Australian Demographic Statistics (3101.0 Table 55). Australian Bureau of Statistics, Canberra.
7. ABS (2012) Basic Community Profile (2001.0). Australian Bureau of Statistics, Canberra.
8. ABS (2012) Regional Population Growth, Australia (3218.0 Table 5). Australian Bureau of Statistics, Canberra.
9. Australian Bureau of Statistics, 2011 Time Series Profile: Coorow (S) (Local Government Area)
10. CSIRO (2001) Climate Change Projections for Australia. CSIRO Atmospheric Research, Melbourne.
11. Tourism Forecasting Committee (2012) Forecast 2012 Issue 1 – Regional forecast tables. Tourism Research
Australia, Canberra.
12. WAPC (2012) Western Australia Tomorrow Population Report No. 7, 2006 to 2026. Forecast Profile – Coorow
(S) Local Government Area. Western Australian Planning Commission, Perth.
13. IPWEA, 2011, International Infrastructure Management Manual, Institute of Public Works Engineering
Australia, Sydney, www.ipwea.org.au.

COMMUNITY FACILITIES ASSET MANAGEMENT PLAN - 46 -
SHIRE OF ANYWHERE
Road Asset Management Plan 2011/12 – 2020/21
ABBREVIATIONS APPENDIX F.
AAAC Average annual asset consumption
AMP Asset management plan
ARI Average recurrence interval
BOD Biochemical (biological) oxygen demand
CRC Current replacement cost
CWMS Community wastewater management systems
DA Depreciable amount
EF Earthworks/formation
IRMP Infrastructure risk management plan
LCC Life Cycle cost
LCE
LOS
Life cycle expenditure
Level of service
MMS Maintenance management system
PCI Pavement condition index
RV Residual value
SS Suspended solids
vph Vehicles per hour

COMMUNITY FACILITIES ASSET MANAGEMENT PLAN - 47 -
SHIRE OF ANYWHERE
Road Asset Management Plan 2011/12 – 2020/21
GLOSSARY APPENDIX G.
Annual service cost (ASC) 1) Reporting actual cost The annual (accrual) cost of providing a service
including operations, maintenance, depreciation, finance/opportunity and disposal costs less revenue.
2) For investment analysis and budgeting An estimate of the cost that would be tendered,
per annum, if tenders were called for the supply of a service to a performance specification for a fixed term. The Annual Service Cost includes operations, maintenance, depreciation, finance/ opportunity and disposal costs, less revenue.
Asset A resource controlled by an entity as a result of past events and from which future economic benefits are expected to flow to the entity. Infrastructure assets are a sub-class of property, plant and equipment which are non-current assets with a life greater than 12 months and enable services to be provided.
Asset class A group of assets having a similar nature or function in the operations of an entity, and which, for purposes of disclosure, is shown as a single item without supplementary disclosure.
Asset condition assessment The process of continuous or periodic inspection, assessment, measurement and interpretation of the resultant data to indicate the condition of a specific asset so as to determine the need for some preventative or remedial action.
Asset management (AM) The combination of management, financial, economic, engineering and other practices applied to physical assets with the objective of providing the required level of service in the most cost effective manner.
Average annual asset consumption (AAAC)* The amount of an organisation’s asset base consumed during a reporting period (generally a year). This may be calculated by dividing the depreciable amount by the useful life (or total future economic benefits/service potential) and totalled for each and every asset OR by dividing the carrying amount (depreciated replacement cost) by the remaining useful life (or remaining future economic benefits/service potential) and totalled for each and every asset in an asset category or class.
Borrowings A borrowing or loan is a contractual obligation of the borrowing entity to deliver cash or another financial asset to the lending entity over a specified period of time or at a specified point in time, to cover both the initial capital provided and the cost of the interest incurred for providing this capital. A borrowing or loan provides the means for the borrowing entity to finance outlays (typically physical assets) when it has insufficient funds of its own to do so, and for the lending entity to make a financial return, normally in the form of interest revenue, on the funding provided.
Capital expenditure Relatively large (material) expenditure, which has benefits, expected to last for more than 12 months. Capital expenditure includes renewal, expansion and upgrade. Where capital projects involve a combination of renewal, expansion and/or upgrade expenditures, the total project cost needs to be allocated accordingly.
Capital expenditure - expansion Expenditure that extends the capacity of an existing asset to provide benefits, at the same standard as is currently enjoyed by existing beneficiaries, to a new group of users. It is discretionary expenditure, which increases future operations and maintenance costs, because it increases the organisation’s asset base, but may be associated with additional revenue from the new user group, eg. extending a drainage or road network, the provision of an oval or park in a new suburb for new residents.
Capital expenditure - new Expenditure which creates a new asset providing a new service/output that did not exist beforehand. As it increases service potential it may impact revenue and will increase future operations and maintenance expenditure.
Capital expenditure - renewal Expenditure on an existing asset or on replacing an existing asset, which returns the service capability of the asset up to that which it had originally. It is periodically required expenditure, relatively large (material) in value compared with the value of the components or sub-components of the asset being renewed. As it reinstates existing service potential, it generally has no impact on revenue, but may reduce future operations and maintenance expenditure if completed at the optimum time, eg. resurfacing or resheeting a material part of a road network, replacing

COMMUNITY FACILITIES ASSET MANAGEMENT PLAN - 48 -
SHIRE OF ANYWHERE
Road Asset Management Plan 2011/12 – 2020/21
a material section of a drainage network with pipes of the same capacity, resurfacing an oval.
Capital expenditure - upgrade Expenditure, which enhances an existing asset to provide a higher level of service or expenditure that will increase the life of the asset beyond that which it had originally. Upgrade expenditure is discretionary and often does not result in additional revenue unless direct user charges apply. It will increase operations and maintenance expenditure in the future because of the increase in the organisation’s asset base, eg. widening the sealed area of an existing road, replacing drainage pipes with pipes of a greater capacity, enlarging a grandstand at a sporting facility.
Capital funding Funding to pay for capital expenditure.
Capital grants Monies received generally tied to the specific projects for which they are granted, which are often upgrade and/or expansion or new investment proposals.
Capital investment expenditure See capital expenditure definition
Capitalisation threshold The value of expenditure on non-current assets above which the expenditure is recognised as capital expenditure and below which the expenditure is charged as an expense in the year of acquisition.
Carrying amount The amount at which an asset is recognised after deducting any accumulated depreciation / amortisation and accumulated impairment losses thereon.
Class of assets See asset class definition
Component Specific parts of an asset having independent physical or functional identity and having specific attributes such as different life expectancy, maintenance regimes, risk or criticality.
Cost of an asset The amount of cash or cash equivalents paid or the fair value of the consideration given to acquire an asset at the time of its acquisition or construction, including any costs necessary to place the asset into service. This includes one-off design and project management costs.
Current replacement cost (CRC) The cost the entity would incur to acquire the asset on the reporting date. The cost is measured by reference to the lowest cost at which the gross future economic benefits could be obtained in the normal course of business or the minimum it would cost, to replace the existing asset with a technologically modern equivalent new asset (not a second hand one) with the same economic benefits (gross service potential) allowing for any differences in the quantity and quality of output and in operating costs.
Depreciable amount The cost of an asset, or other amount substituted for its cost, less its residual value.
Depreciated replacement cost (DRC) The current replacement cost (CRC) of an asset less, where applicable, accumulated depreciation calculated on the basis of such cost to reflect the already consumed or expired future economic benefits of the asset.
Depreciation / amortisation The systematic allocation of the depreciable amount (service potential) of an asset over its useful life.
Economic life See useful life definition.
Expenditure The spending of money on goods and services. Expenditure includes recurrent and capital.
Fair value The amount for which an asset could be exchanged, or a liability settled, between knowledgeable, willing parties, in an arms length transaction.
Funding gap A funding gap exists whenever an entity has insufficient capacity to fund asset renewal and other expenditure necessary to be able to appropriately maintain the range and level of services its existing asset stock was originally designed and intended to deliver. The service capability of the existing asset stock should be determined assuming no additional operating revenue, productivity improvements, or net financial liabilities above levels currently planned or projected. A current funding gap means levels of service have already or are currently falling. A projected funding gap if not addressed will result in a future diminution of existing levels of service.

COMMUNITY FACILITIES ASSET MANAGEMENT PLAN - 49 -
SHIRE OF ANYWHERE
Road Asset Management Plan 2011/12 – 2020/21
Heritage asset An asset with historic, artistic, scientific, technological, geographical or environmental qualities that is held and maintained principally for its contribution to knowledge and culture and this purpose is central to the objectives of the entity holding it.
Impairment Loss The amount by which the carrying amount of an asset exceeds its recoverable amount.
Infrastructure assets Physical assets that contribute to meeting the needs of organisations or the need for access to major economic and social facilities and services, eg. roads, drainage, footpaths and cycleways. These are typically large, interconnected networks or portfolios of composite assets. The components of these assets may be separately maintained, renewed or replaced individually so that the required level and standard of service from the network of assets is continuously sustained. Generally the components and hence the assets have long lives. They are fixed in place and are often have no separate market value.
Investment property Property held to earn rentals or for capital appreciation or both, rather than for: (a) use in the production or supply of goods or
services or for administrative purposes; or (b) sale in the ordinary course of business.
Key performance indicator A qualitative or quantitative measure of a service or activity used to compare actual performance against a standard or other target. Performance indicators commonly relate to statutory limits, safety, responsiveness, cost, comfort, asset performance, reliability, efficiency, environmental protection and customer satisfaction.
Level of service The defined service quality for a particular service/activity against which service performance may be measured. Levels of service usually relate to quality, quantity, reliability, responsiveness, environmental impact, acceptability and cost.
Life Cycle Cost 1. Total LCC The total cost of an asset throughout its
life including planning, design, construction, acquisition, operation, maintenance, rehabilitation and disposal costs.
2. Average LCC The life cycle cost (LCC) is average cost to provide the service over the longest asset life cycle. It comprises annual operations, maintenance and asset consumption expense, represented by depreciation expense. The Life Cycle Cost does not indicate the funds required to provide the service in a particular year.
Life Cycle Expenditure The Life Cycle Expenditure (LCE) is the actual or planned annual operations, maintenance and capital renewal expenditure incurred in providing the service in a particular year. Life Cycle Expenditure may be compared to average Life Cycle Cost to give an initial indicator of life cycle sustainability.
Loans / borrowings See borrowings.
Maintenance All actions necessary for retaining an asset as near as practicable to its original condition, including regular ongoing day-to-day work necessary to keep assets operating, eg road patching but excluding rehabilitation or renewal. It is operating expenditure required to ensure that the asset reaches its expected useful life. • Planned maintenance
Repair work that is identified and managed through a maintenance management system (MMS). MMS activities include inspection, assessing the condition against failure/breakdown criteria/experience, prioritising scheduling, actioning the work and reporting what was done to develop a maintenance history and improve maintenance and service delivery performance.
• Reactive maintenance Unplanned repair work that is carried out in response to service requests and management/supervisory directions.
• Significant maintenance Maintenance work to repair components or replace sub-components that needs to be identified as a specific maintenance item in the maintenance budget.
• Unplanned maintenance Corrective work required in the short-term to restore an asset to working condition so it can continue to deliver the required service or to maintain its level of security and integrity.
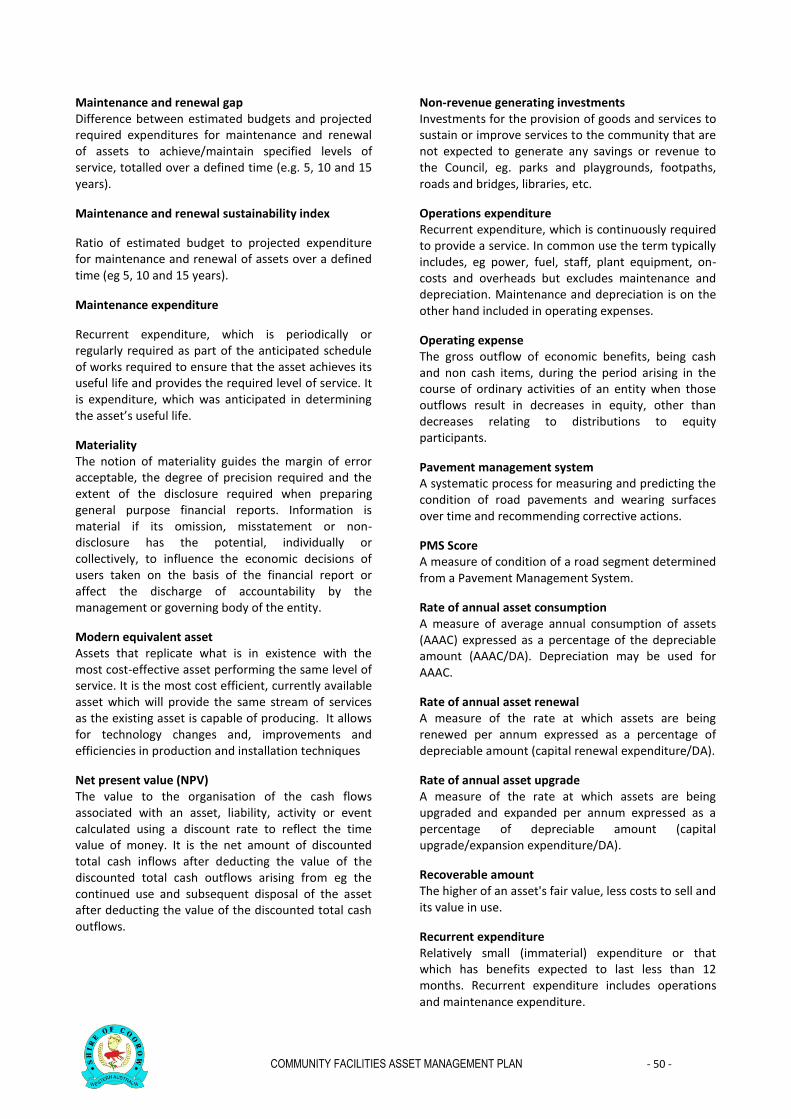
COMMUNITY FACILITIES ASSET MANAGEMENT PLAN - 50 -
SHIRE OF ANYWHERE
Road Asset Management Plan 2011/12 – 2020/21
Maintenance and renewal gap Difference between estimated budgets and projected required expenditures for maintenance and renewal of assets to achieve/maintain specified levels of service, totalled over a defined time (e.g. 5, 10 and 15 years).
Maintenance and renewal sustainability index
Ratio of estimated budget to projected expenditure for maintenance and renewal of assets over a defined time (eg 5, 10 and 15 years).
Maintenance expenditure
Recurrent expenditure, which is periodically or regularly required as part of the anticipated schedule of works required to ensure that the asset achieves its useful life and provides the required level of service. It is expenditure, which was anticipated in determining the asset’s useful life.
Materiality The notion of materiality guides the margin of error acceptable, the degree of precision required and the extent of the disclosure required when preparing general purpose financial reports. Information is material if its omission, misstatement or non-disclosure has the potential, individually or collectively, to influence the economic decisions of users taken on the basis of the financial report or affect the discharge of accountability by the management or governing body of the entity.
Modern equivalent asset Assets that replicate what is in existence with the most cost-effective asset performing the same level of service. It is the most cost efficient, currently available asset which will provide the same stream of services as the existing asset is capable of producing. It allows for technology changes and, improvements and efficiencies in production and installation techniques
Net present value (NPV) The value to the organisation of the cash flows associated with an asset, liability, activity or event calculated using a discount rate to reflect the time value of money. It is the net amount of discounted total cash inflows after deducting the value of the discounted total cash outflows arising from eg the continued use and subsequent disposal of the asset after deducting the value of the discounted total cash outflows.
Non-revenue generating investments Investments for the provision of goods and services to sustain or improve services to the community that are not expected to generate any savings or revenue to the Council, eg. parks and playgrounds, footpaths, roads and bridges, libraries, etc.
Operations expenditure Recurrent expenditure, which is continuously required to provide a service. In common use the term typically includes, eg power, fuel, staff, plant equipment, on-costs and overheads but excludes maintenance and depreciation. Maintenance and depreciation is on the other hand included in operating expenses.
Operating expense The gross outflow of economic benefits, being cash and non cash items, during the period arising in the course of ordinary activities of an entity when those outflows result in decreases in equity, other than decreases relating to distributions to equity participants.
Pavement management system A systematic process for measuring and predicting the condition of road pavements and wearing surfaces over time and recommending corrective actions.
PMS Score A measure of condition of a road segment determined from a Pavement Management System.
Rate of annual asset consumption A measure of average annual consumption of assets (AAAC) expressed as a percentage of the depreciable amount (AAAC/DA). Depreciation may be used for AAAC.
Rate of annual asset renewal A measure of the rate at which assets are being renewed per annum expressed as a percentage of depreciable amount (capital renewal expenditure/DA).
Rate of annual asset upgrade A measure of the rate at which assets are being upgraded and expanded per annum expressed as a percentage of depreciable amount (capital upgrade/expansion expenditure/DA).
Recoverable amount The higher of an asset's fair value, less costs to sell and its value in use.
Recurrent expenditure Relatively small (immaterial) expenditure or that which has benefits expected to last less than 12 months. Recurrent expenditure includes operations and maintenance expenditure.

COMMUNITY FACILITIES ASSET MANAGEMENT PLAN - 51 -
SHIRE OF ANYWHERE
Road Asset Management Plan 2011/12 – 2020/21
Recurrent funding Funding to pay for recurrent expenditure.
Rehabilitation See capital renewal expenditure definition above.
Remaining useful life The time remaining until an asset ceases to provide the required service level or economic usefulness. Age plus remaining useful life is useful life.
Renewal See capital renewal expenditure definition above.
Residual value The estimated amount that an entity would currently obtain from disposal of the asset, after deducting the estimated costs of disposal, if the asset were already of the age and in the condition expected at the end of its useful life.
Revenue generating investments Investments for the provision of goods and services to sustain or improve services to the community that are expected to generate some savings or revenue to offset operating costs, eg public halls and theatres, childcare centres, sporting and recreation facilities, tourist information centres, etc.
Risk management The application of a formal process to the range of possible values relating to key factors associated with a risk in order to determine the resultant ranges of outcomes and their probability of occurrence.
Section or segment A self-contained part or piece of an infrastructure asset.
Service potential The total future service capacity of an asset. It is normally determined by reference to the operating capacity and economic life of an asset. A measure of service potential is used in the not-for-profit sector/public sector to value assets, particularly those not producing a cash flow.
Service potential remaining A measure of the future economic benefits remaining in assets. It may be expressed in dollar values (Fair Value) or as a percentage of total anticipated future economic benefits. It is also a measure of the percentage of the asset’s potential to provide services that is still available for use in providing services (Depreciated Replacement Cost/Depreciable Amount).
Strategic Longer-Term Plan A plan covering the term of office of councillors (4 years minimum) reflecting the needs of the community for the foreseeable future. It brings together the detailed requirements in the council’s longer-term plans such as the asset management plan and the long-term financial plan. The AMP is prepared in consultation with the community and details where the council is at that point in time, where it wants to go, how it is going to get there, mechanisms for monitoring the achievement of the outcomes and how the AMP will be resourced.
Specific Maintenance Replacement of higher value components/sub-components of assets that is undertaken on a regular cycle including repainting, building roof replacement, cycle, replacement of air conditioning equipment, etc. This work generally falls below the capital/ maintenance threshold and needs to be identified in a specific maintenance budget allocation.
Sub-component Smaller individual parts that make up a component part.
Useful life Either: (a) the period over which an asset is expected to be
available for use by an entity, or (b) the number of production or similar units expected
to be obtained from the asset by the entity. It is estimated or expected time between placing the asset into service and removing it from service, or the estimated period of time over which the future economic benefits embodied in a depreciable asset, are expected to be consumed by the council. Value in Use The present value of future cash flows expected to be derived from an asset or cash generating unit. It is deemed to be depreciated replacement cost (DRC) for those assets whose future economic benefits are not primarily dependent on the asset's ability to generate net cash inflows, where the entity would, if deprived of the asset, replace its remaining future economic benefits.
Source: IPWEA, 2009, Glossary