community insight profile report - oxford€¦ · web viewlocal insight profile for ‘headington...
TRANSCRIPT
1
Local Insight profile for ‘Headington Quarry’ area
Oxford City Council and District Data Service
Report created 9 March 2018
Finding your way around this Local Insight profile 2
Introduction Page 3 for an introduction to this report
Population
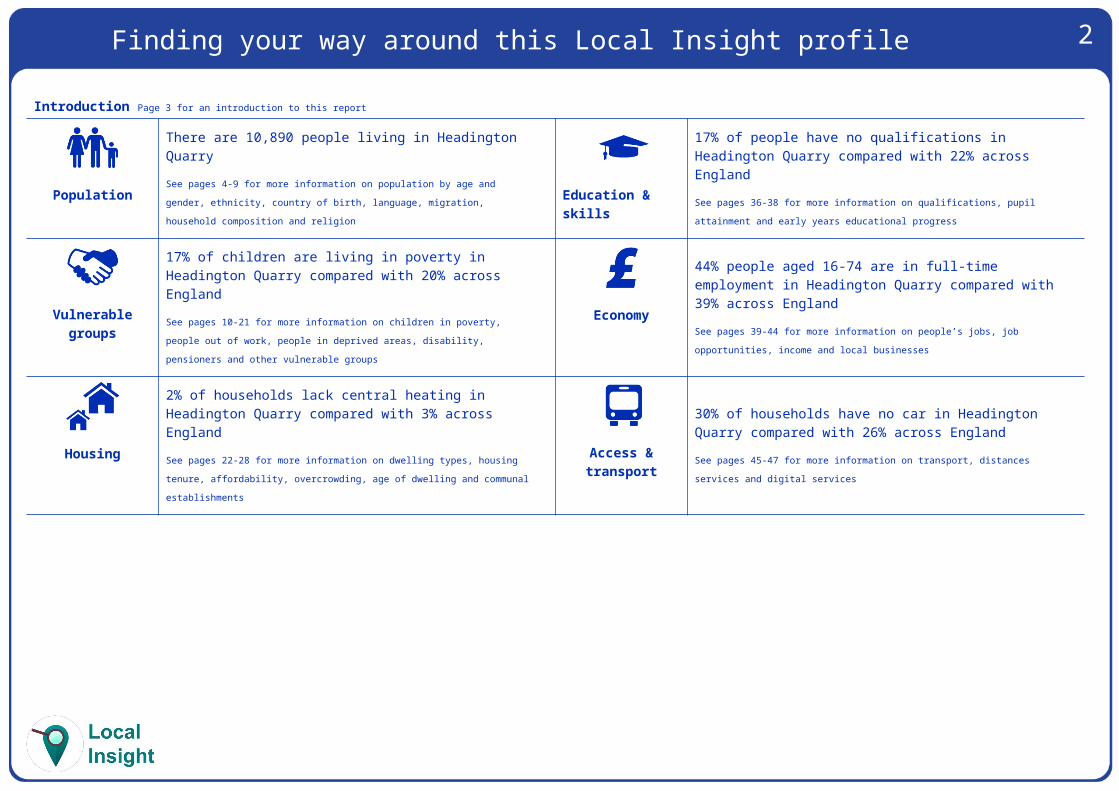
There are 10,890 people living in Headington QuarrySee pages 4-9 for more information on population by age and gender, ethnicity, country of birth, language, migration, household composition and religion
Education & skills
17% of people have no qualifications in Headington Quarry compared with 22% across EnglandSee pages 36-38 for more information on qualifications, pupil attainment and early years educational progress
Vulnerable groups
17% of children are living in poverty in Headington Quarry compared with 20% across EnglandSee pages 10-21 for more information on children in poverty, people out of work, people in deprived areas, disability, pensioners and other vulnerable groups
Economy
44% people aged 16-74 are in full-time employment in Headington Quarry compared with 39% across EnglandSee pages 39-44 for more information on people’s jobs, job opportunities, income and local businesses
Housing
2% of households lack central heating in Headington Quarry compared with 3% across EnglandSee pages 22-28 for more information on dwelling types, housing tenure, affordability, overcrowding, age of dwelling and communal establishments
Access & transport
30% of households have no car in Headington Quarry compared with 26% across EnglandSee pages 45-47 for more information on transport, distances services and digital services
Crime & safety
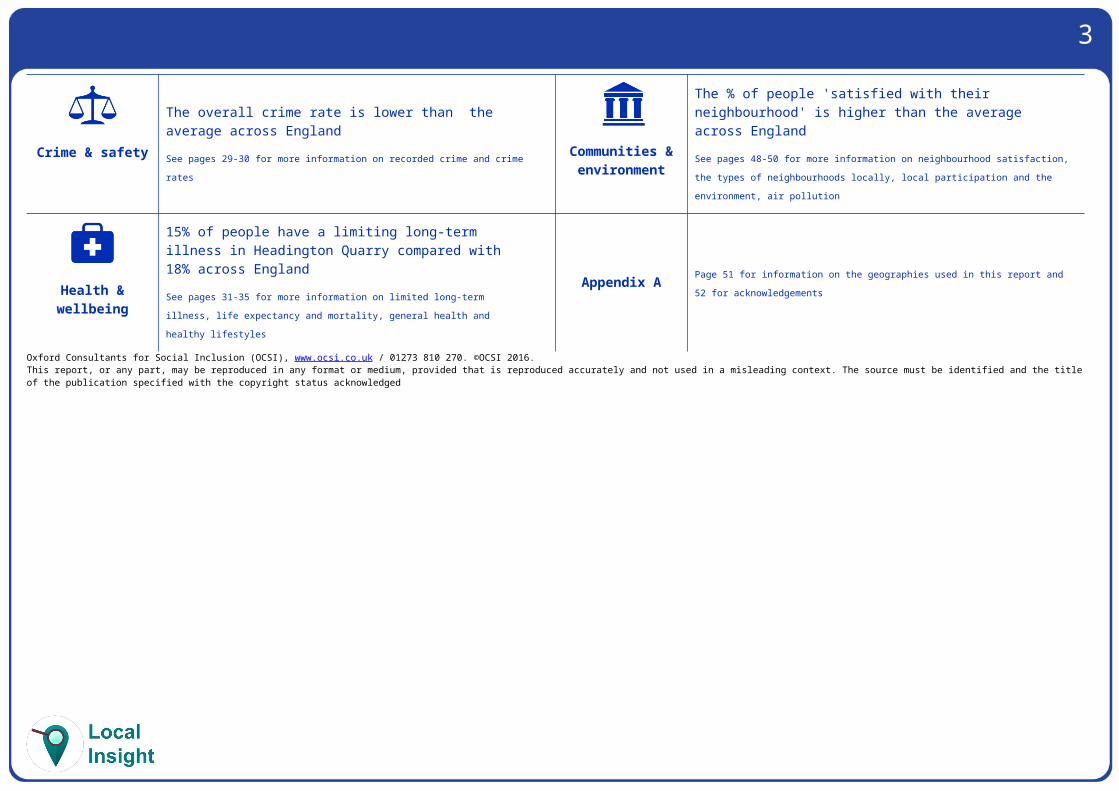
The overall crime rate is lower than the average across EnglandSee pages 29-30 for more information on recorded crime and crime rates Communities &
environment
The % of people 'satisfied with their neighbourhood' is higher than the average across EnglandSee pages 48-50 for more information on neighbourhood satisfaction, the types of neighbourhoods locally, local participation and the environment, air pollution
Health & wellbeing
15% of people have a limiting long-term illness in Headington Quarry compared with 18% across EnglandSee pages 31-35 for more information on limited long-term illness, life expectancy and mortality, general health and healthy lifestyles
Appendix A Page 51 for information on the geographies used in this report and 52 for acknowledgements
3Oxford Consultants for Social Inclusion (OCSI), www.ocsi.co.uk / 01273 810 270. ©OCSI 2016. This report, or any part, may be reproduced in any format or medium, provided that is reproduced accurately and not used in a misleading context. The source must be identified and the title of the publication specified with the copyright status acknowledged
4
Local Insight for Oxford City Council and District Data Service
Local Insight gives you access to interactive maps and reports at small area level. These reports show key social and economic indicators and allow you to compare the area selected to comparator areas.OCSI
Local Insight is a tool developed by Oxford Consultants for Social Inclusion (OCSI) based on a project developed jointly between OCSI and HACT.OCSI develop and interpret the evidence base to help the public and community organisations deliver better services. A 'spin-out' from the University of Oxford Social Policy Institute, OCSI have worked with more than 100 public and community sector clients at local, national and international level. See www.ocsi.co.uk for more.
About the indicators
Information published by government as open data – appropriately visualised, analysed and interpreted – is a critical tool for Local Authorities.OCSI collect all local data published by more than 50 government agencies, and have identified key indicators relevant to local authorities to use in this report and the interactive webtool (local.communityinsight.org).How we have identified the “Headington Quarry” area
This report is based on the definition of the “Headington Quarry” area created by Oxford City Council and District Data Service, (you can view this area on the Local Insight map, through finding the area on the ‘show services’ dropdown in the top left hand corner of the map). We have aggregated data for all the neighbourhoods in “Headington Quarry” to create the charts and tables used in this report.Alongside data for the “Headington Quarry”, we also show data for selected comparator areas: Oxfordshire and England.
Introduction)

5
Local Insight profile for Headington Quarry© OCSI 2016.
Population: Age and genderWhat information is shown here?
The information on this page shows the number of people living in Headington Quarry. These population figures provide detail of the structure of the population by broad age bands and sex.The first information box shows the total number of people usually resident in the area, with the male female breakdown. Also shown are numbers by sex and age, and the ‘dependency ratio’. This is the ratio of non-working age (those aged 0-15 and over 65) to working age population and is useful in understanding the pressure on a productive population in providing for the costs of services and benefits used by the youngest and oldest in a population. For example, a ratio of 25% for example would imply one person of non-working age for every four people of working age.The population pyramid compares the proportion of males and females by five year age bands. The line chart shows how the population is changing over time in Headington Quarry and comparator areas. The stacked bar chart, below, shows the age breakdown of the population in Headington Quarry and comparator areas by broad age band.
Total Population Aged 0-15 Working age
population Aged 65+ Dependency ratio
10,890 2,195 7,065 1,625 0.5449.4% male;50.6% female
20.2% (Englandaverage = 19.1%)
64.9% (Englandaverage = 63.1%)
14.9% (Englandaverage = 17.9%)
England average= 0.59
Source: Mid-Year Estimates (ONS) 2016Figure: Population estimates by 5 year age bandSource: Mid-Year Estimates (ONS) 2016
Figure: Population by ageSource: Mid-Year Estimates (ONS) 2016
Figure: % change in total population from 2001-2016Source: Mid-Year Estimates (ONS)
2001 2002 2003 2004 2005 2006 2007 2008 2009 2010 2011 2012 2013 2014 2015 2016-2%0%2%
4%6%8%
10%12%14%
Cha
nge
over
tim
e fr
om 2
001
Headington Quarry Oxfordshire England
20.2 18.6 19.1
64.9 63.6 63.1
14.9 17.7 17.9
Headington Quarry Oxfordshire England0%
10%20%30%40%50%60%70%80%90%
100%
% o
f tot
al p
opul
atio
n
Aged 0-15 Working age Aged 65+
8.26.9
5.14.6
8.58.1
8.78.0
6.76.6
5.94.9
4.14.6
3.42.2
1.71.7
6.96.9
5.14.2
9.07.8
8.48.0
6.65.5
5.84.6
5.04.4
3.52.8
2.53.0
0-45-9
10-1415-1920-2425-2930-3435-3940-4445-4950-5455-5960-6465-6970-7475-7980-84
85+
10 5 0 510% of total population in each age band
Females Males
6
Local Insight profile for Headington Quarry© OCSI 2016.
Population: Ethnicity
7
Local Insight profile for Headington Quarry© OCSI 2016.
What information is shown here?
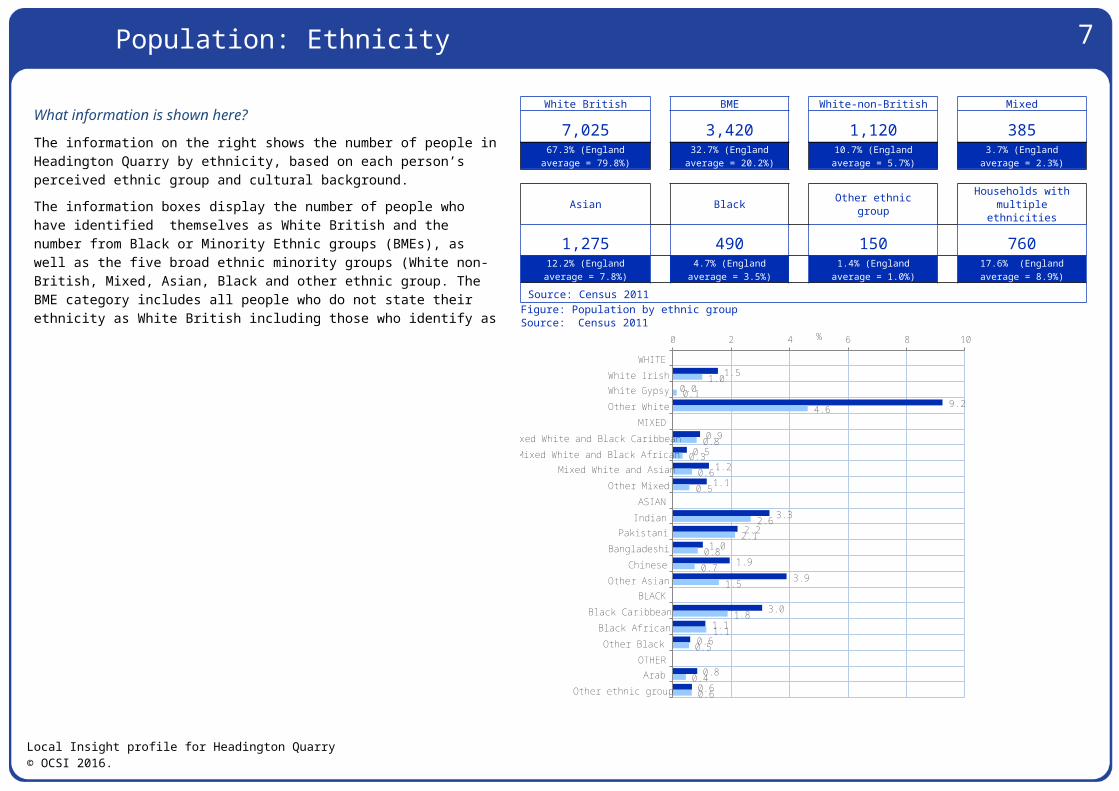
The information on the right shows the number of people in Headington Quarry by ethnicity, based on each person’s perceived ethnic group and cultural background.The information boxes display the number of people who have identified themselves as White British and the number from Black or Minority Ethnic groups (BMEs), as well as the five broad ethnic minority groups (White non-British, Mixed, Asian, Black and other ethnic group. The BME category includes all people who do not state their ethnicity as White British including those who identify as White but of a different ethnic identity.The final information box shows the proportion of households where not all household members are of the same ethnicity (households with multiple ethnic groups).The bar chart on the right shows a detailed breakdown of the percentage of people in BME groups by ethnic category.
White British BME White-non-British Mixed
7,025 3,420 1,120 38567.3% (England average
= 79.8%)32.7% (England
average = 20.2%)10.7% (Englandaverage = 5.7%)
3.7% (England average= 2.3%)
Asian Black Other ethnic group Households with multiple ethnicities
1,275 490 150 76012.2% (England average
= 7.8%)4.7% (England
average = 3.5%)1.4% (England average
= 1.0%)17.6% (Englandaverage = 8.9%)
Source: Census 2011Figure: Population by ethnic groupSource: Census 2011
1.50.0
9.2
0.90.5
1.21.1
3.32.2
1.01.9
3.9
3.01.1
0.6
0.80.6
1.00.1
4.6
0.80.3
0.60.5
2.62.1
0.80.7
1.5
1.81.1
0.5
0.40.6
WHITEWhite Irish
White GypsyOther White
MIXEDMixed White and Black Caribbean
Mixed White and Black AfricanMixed White and Asian
Other MixedASIANIndian
PakistaniBangladeshi
ChineseOther Asian
BLACKBlack Caribbean
Black AfricanOther Black
OTHERArab
Other ethnic group
1086420 %
Headington Quarry England
8
Local Insight profile for Headington Quarry© OCSI 2016.
Population: Country of birth and household language
What information is shown here?
The information on the right shows the number of people in Headington Quarry by country of birth.The top row information boxes display the number of people in Headington Quarry who were born in England and outside the UK as well as the number of people with a UK passport and non-UK passport.The second row information boxes show the language breakdown of households, identifying the number of households in Headington Quarry with one or more members who cannot speak English.The bar chart on the right shows a detailed breakdown of the percentage of people in Headington Quarry born outside of England by the geographic region of birth.
Born in England Born Outside the UK With a UK passport With a non-UK
passport
7,450 2,650 7,300 2,04071.3% (England
average = 83.5%)25.4% (England
average = 13.8%)69.9% (England
average = 75.8%)19.5% (Englandaverage = 8.8%)
All people in households have English as main
language
At least one adult (not all) has
English as main language
No adults but some children have
English as main language
No household members have English as main
language
3,590 335 70 34582.7% (England
average = 90.9%)7.7% (England
average = 3.9%)1.6% (England
average = 0.8%)8.0% (England
average = 4.4%)Source: Census 2011
Figure: Population born outside EnglandSource: Census 2011
9.1
3.7
3.5
3.7
1.5
2.6
1.2
1.0
0.6
0.6
4.8
2.4
2.0
1.7
1.3
1.3
0.7
0.5
0.4
0.3
Middle East and Asia
Africa
EU Accession countries
Other EU Member countries
Scotland
The Americas and the Caribbean
Republic of Ireland
Rest of Europe
Northern Ireland
Oceana
1086420
%
Headington Quarry England

9
What information is shown here?
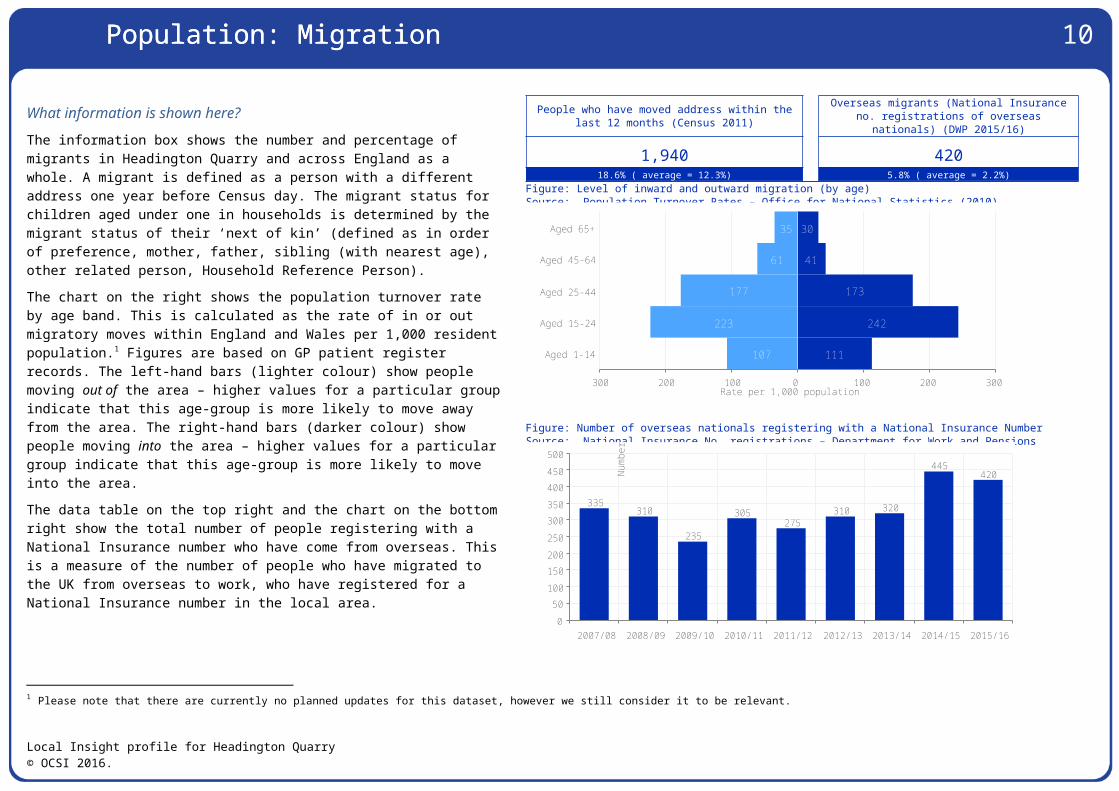
The information box shows the number and percentage of migrants in Headington Quarry and across England as a whole. A migrant is defined as a person with a different address one year before Census day. The migrant status for children aged under one in households is determined by the migrant status of their ‘next of kin’ (defined as in order of preference, mother, father, sibling (with nearest age), other related person, Household Reference Person).The chart on the right shows the population turnover rate by age band. This is calculated as the rate of in or out migratory moves within England and Wales per 1,000 resident population.1 Figures are based on GP patient register records. The left-hand bars (lighter colour) show people moving out of the area – higher values for a particular group indicate that this age-group is more likely to move away from the area. The right-hand bars (darker colour) show people moving into the area – higher values for a particular group indicate that this age-group is more likely to move into the area.The data table on the top right and the chart on the bottom right show the total number of people registering with a National Insurance number who have come from overseas. This is a measure of the number of people who have migrated to the UK from overseas to work, who have registered for a National Insurance number in the local area.
People who have moved address within the last 12 months (Census 2011)
Overseas migrants (National Insurance no. registrations of overseas nationals) (DWP
2015/16)
1,940 42018.6% ( average = 12.3%) 5.8% ( average = 2.2%)
Figure: Level of inward and outward migration (by age)Source: Population Turnover Rates – Office for National Statistics (2010)
Figure: Number of overseas nationals registering with a National Insurance NumberSource: National Insurance No. registrations – Department for Work and Pensions (2015/16)
1 Please note that there are currently no planned updates for this dataset, however we still consider it to be relevant.
Local Insight profile for Headington Quarry© OCSI 2016.
335310
235
305275
310 320
445420
2007/08 2008/09 2009/10 2010/11 2011/12 2012/13 2013/14 2014/15 2015/160
50100
150200
250
300350
400450
500
Num
ber
of p
eopl
e
107
223
177
61
35
111
242
173
41
30
Aged 1-14
Aged 15-24
Aged 25-44
Aged 45-64
Aged 65+
300 200 100 0 100200300Rate per 1,000 population
People moving in (inward migration) People moving out (outward migration)
Population: MigrationPopulation: Migration
10
What information is shown here?
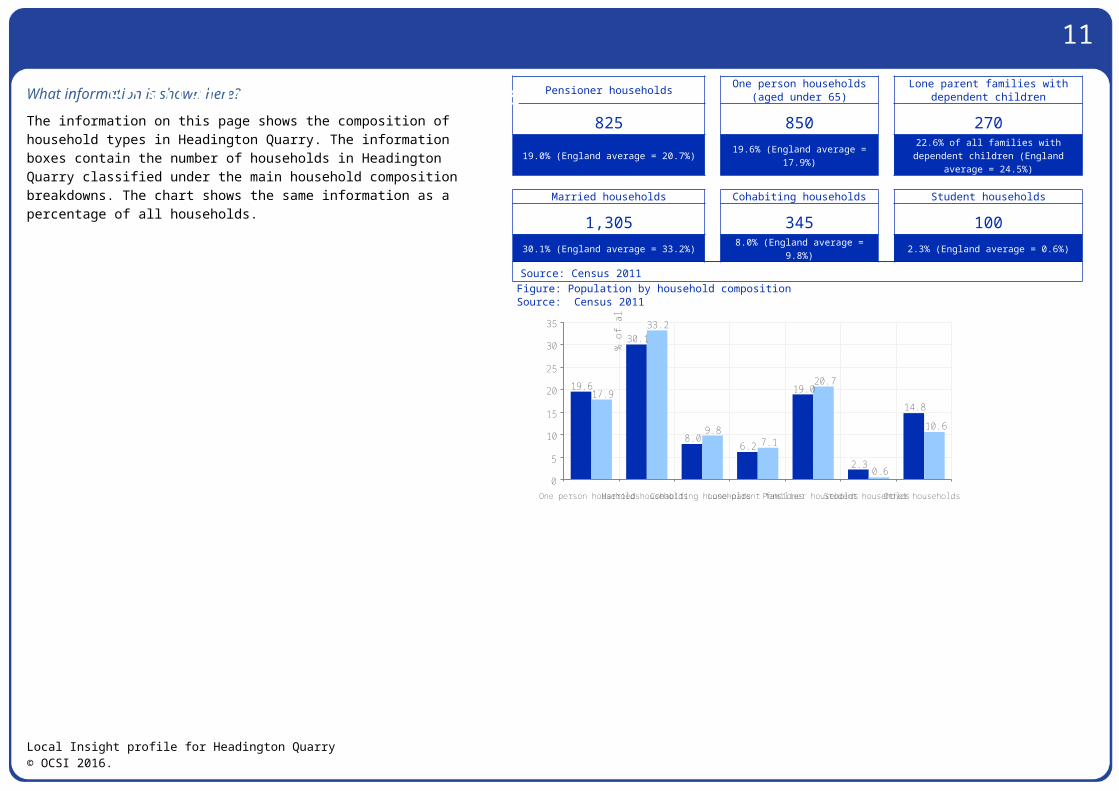
The information on this page shows the composition of household types in Headington Quarry. The information boxes contain the number of households in Headington Quarry classified under the main household composition breakdowns. The chart shows the same information as a percentage of all households.
Pensioner households One person households (aged under 65)
Lone parent families with dependent children
825 850 27019.0% (England average = 20.7%) 19.6% (England average =
17.9%)22.6% of all families with dependentchildren (England average = 24.5%)
Married households Cohabiting households Student households
1,305 345 10030.1% (England average = 33.2%) 8.0% (England average =
9.8%) 2.3% (England average = 0.6%)
Source: Census 2011Figure: Population by household compositionSource: Census 2011
Local Insight profile for Headington Quarry© OCSI 2016.
19.6
30.1
8.06.2
19.0
2.3
14.817.9
33.2
9.87.1
20.7
0.6
10.6
One person householdsMarried householdsCohabiting householdsLone-parent familiesPensioner householdsStudent householdsOther households
0
5
10
15
20
25
30
35
% o
f all
hous
ehol
ds
Headington Quarry England
Population: All households
11
What information is shown here?
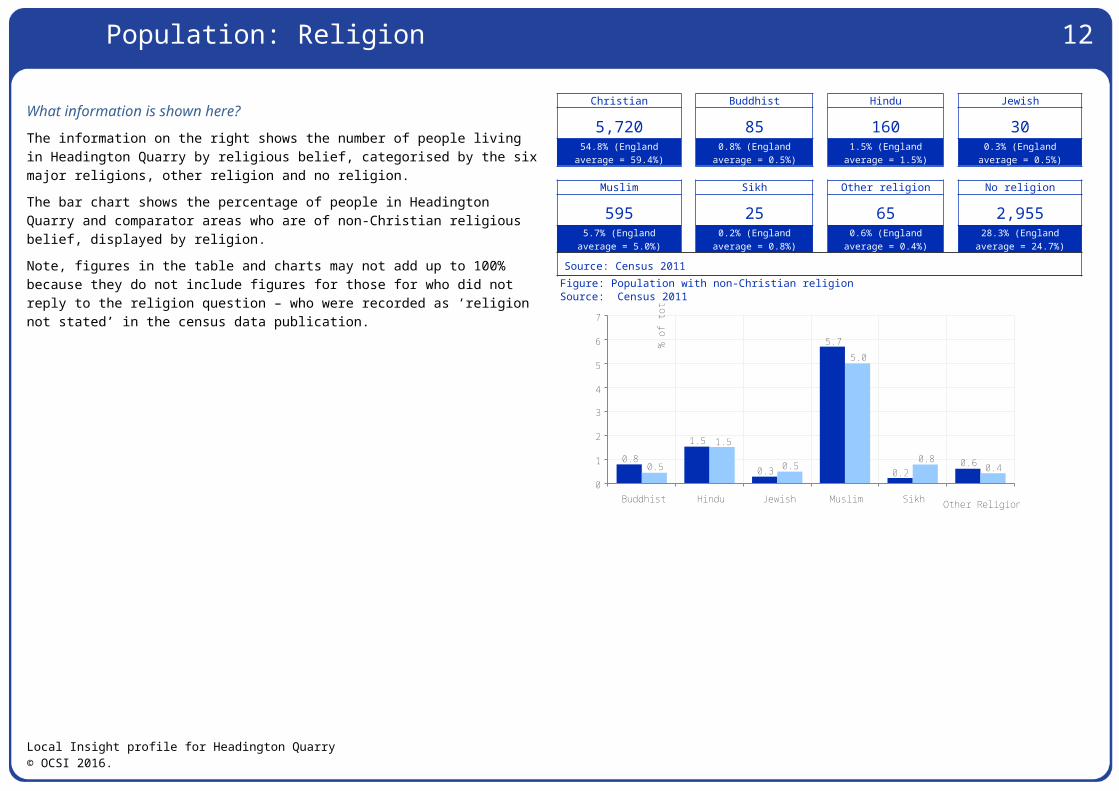
The information on the right shows the number of people living in Headington Quarry by religious belief, categorised by the six major religions, other religion and no religion.The bar chart shows the percentage of people in Headington Quarry and comparator areas who are of non-Christian religious belief, displayed by religion.Note, figures in the table and charts may not add up to 100% because they do not include figures for those for who did not reply to the religion question – who were recorded as ‘religion not stated’ in the census data publication.
Christian Buddhist Hindu Jewish
5,720 85 160 3054.8% (England
average = 59.4%)0.8% (England
average = 0.5%)1.5% (England
average = 1.5%)0.3% (England average
= 0.5%)
Muslim Sikh Other religion No religion
595 25 65 2,9555.7% (England average
= 5.0%)0.2% (England
average = 0.8%)0.6% (England
average = 0.4%)28.3% (England
average = 24.7%)
Source: Census 2011Figure: Population with non-Christian religionSource: Census 2011
Local Insight profile for Headington Quarry© OCSI 2016.
0.8
1.5
0.3
5.7
0.20.60.5
1.5
0.5
5.0
0.80.4
Buddhist Hindu Jewish Muslim Sikh Other Religions
0
1
2
3
4
5
6
7
% o
f tot
al p
opul
atio
n
Headington Quarry England
Population: Religion
Vulnerable groups: People out of work (1) 12
What information is shown here?
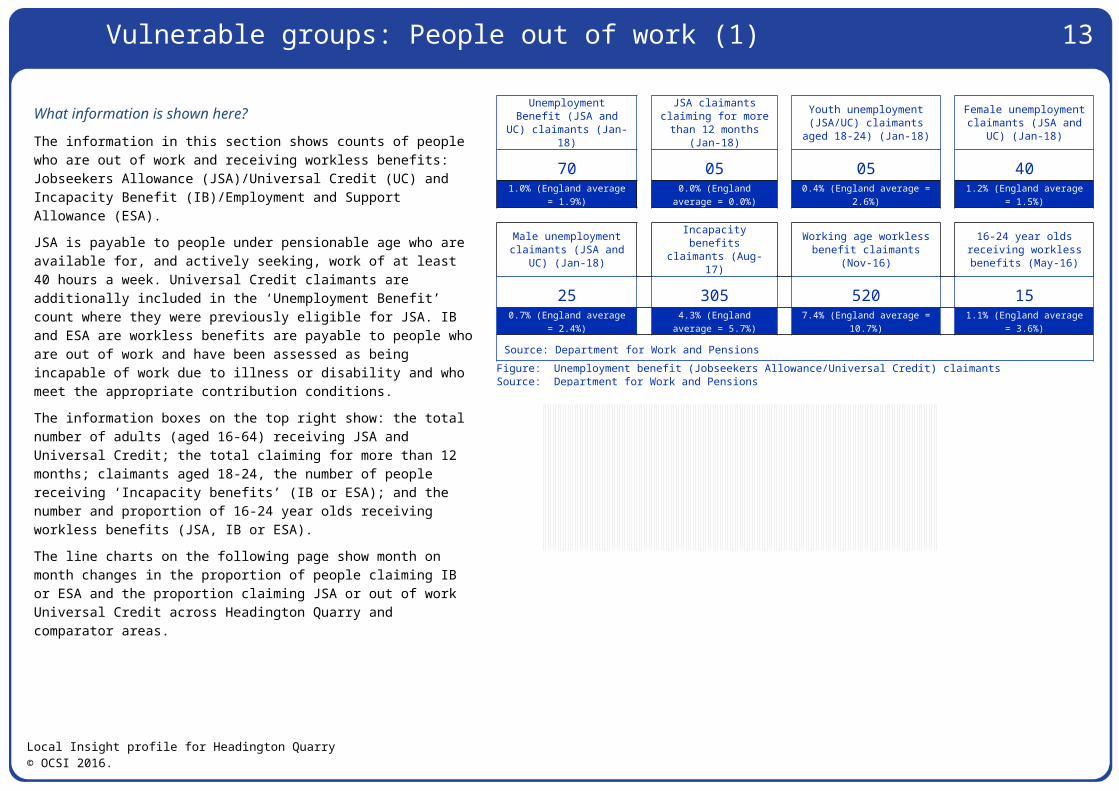
The information in this section shows counts of people who are out of work and receiving workless benefits: Jobseekers Allowance (JSA)/Universal Credit (UC) and Incapacity Benefit (IB)/Employment and Support Allowance (ESA).JSA is payable to people under pensionable age who are available for, and actively seeking, work of at least 40 hours a week. Universal Credit claimants are additionally included in the ‘Unemployment Benefit’ count where they were previously eligible for JSA. IB and ESA are workless benefits are payable to people who are out of work and have been assessed as being incapable of work due to illness or disability and who meet the appropriate contribution conditions.The information boxes on the top right show: the total number of adults (aged 16-64) receiving JSA and Universal Credit; the total claiming for more than 12 months; claimants aged 18-24, the number of people receiving ‘Incapacity benefits’ (IB or ESA); and the number and proportion of 16-24 year olds receiving workless benefits (JSA, IB or ESA).The line charts on the following page show month on month changes in the proportion of people claiming IB or ESA and the proportion claiming JSA or out of work Universal Credit across Headington Quarry and comparator areas.
Unemployment Benefit (JSA and UC) claimants
(Jan-18)
JSA claimants claiming for more than 12 months
(Jan-18)
Youth unemployment (JSA/UC) claimants aged
18-24) (Jan-18)
Female unemployment claimants (JSA and UC)
(Jan-18)
70 05 05 401.0% (England average =
1.9%)0.0% (England average
= 0.0%)0.4% (England average =
2.6%)1.2% (England average =
1.5%)
Male unemployment claimants (JSA and UC)
(Jan-18)Incapacity benefits claimants (Aug-17)
Working age workless benefit claimants (Nov-
16)
16-24 year olds receiving workless benefits (May-16)
25 305 520 150.7% (England average =
2.4%)4.3% (England average
= 5.7%)7.4% (England average =
10.7%)1.1% (England average =
3.6%)
Source: Department for Work and PensionsFigure: Unemployment benefit (Jobseekers Allowance/Universal Credit) claimantsSource: Department for Work and Pensions
Local Insight profile for Headington Quarry© OCSI 2016.
Oct-04Apr
-05
Oct-05Apr
-06
Oct-06Apr
-07
Oct-07Apr
-08
Oct-08Apr
-09
Oct-09Apr
-10
Oct-10Apr
-11
Oct-11Apr
-12
Oct-12Apr
-13
Oct-13Apr
-14
Oct-14Apr
-15
Oct-15Apr
-16
Oct-16Apr
-17
Oct-17
011
2233
445
% o
f wor
king
age
pop
ulat
ion(
16-6
4)Headington Quarry Oxfordshire England
Vulnerable groups: People out of work (2) 13
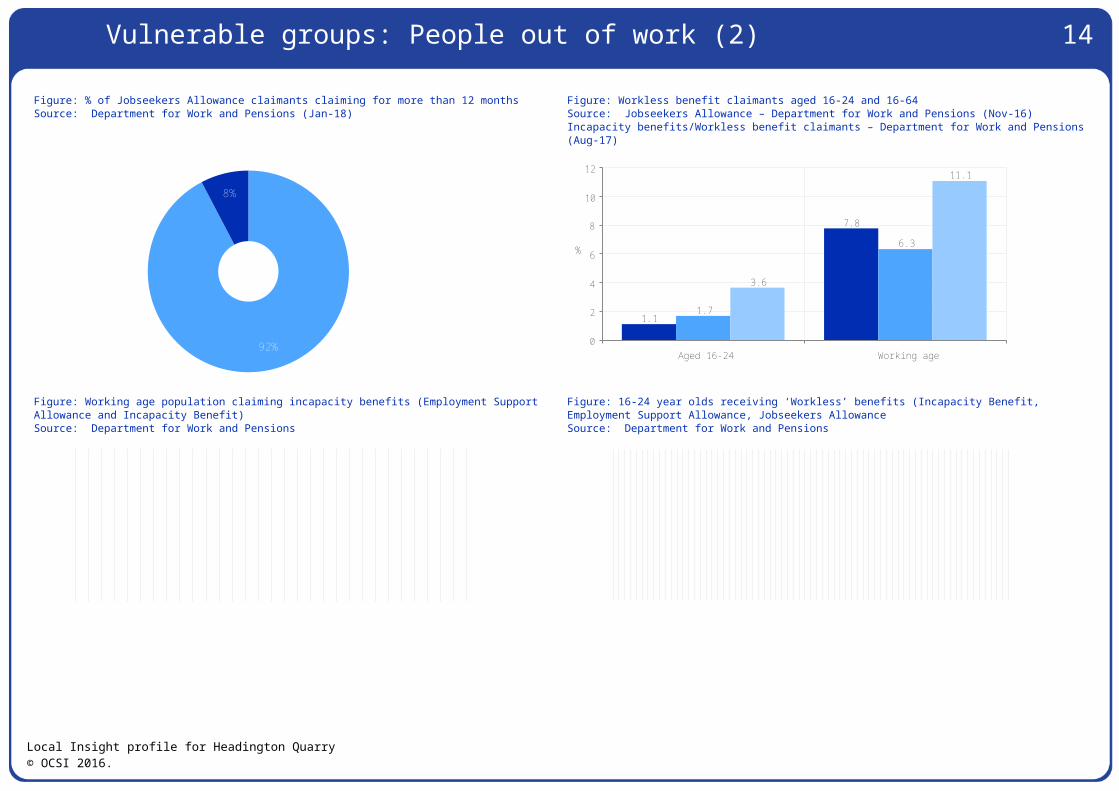
Figure: % of Jobseekers Allowance claimants claiming for more than 12 monthsSource: Department for Work and Pensions (Jan-18)
Figure: Workless benefit claimants aged 16-24 and 16-64Source: Jobseekers Allowance – Department for Work and Pensions (Nov-16) Incapacity benefits/Workless benefit claimants – Department for Work and Pensions (Aug-17)
Figure: Working age population claiming incapacity benefits (Employment Support Allowance and Incapacity Benefit)Source: Department for Work and Pensions
Figure: 16-24 year olds receiving ‘Workless’ benefits (Incapacity Benefit, Employment Support Allowance, Jobseekers AllowanceSource: Department for Work and Pensions
Local Insight profile for Headington Quarry© OCSI 2016.
92%
8%
Less than 12 months
More than 12 months
1.1
7.8
1.7
6.3
3.6
11.1
Aged 16-24 Working age0
2
4
6
8
10
12
%
Headington Quarry Oxfordshire England
Feb-
10May-1
0Aug
-10
Nov-1
0Fe
b-11May
-11
Aug-1
1Nov
-11
Feb-
12May-1
2Aug
-12
Nov-1
2Fe
b-13
May-1
3Aug
-13
Nov-1
3Fe
b-14
May-1
4Aug
-14
Nov-1
4Fe
b-15May
-15
Aug-1
5Nov
-15
Feb-
16May-1
6Aug
-16
Nov-1
6Fe
b-17May
-17
Aug-1
7
0
1
2
3
4
5
6
7
% o
f wor
king
age
pop
ulat
ion
Headington Quarry Oxfordshire England
Aug
-99
May
-00
Feb-
01 Nov
-01
Aug
-02
May
-03
Feb-
04 Nov
-04
Aug
-05
May
-06
Feb-
07 Nov
-07
Aug
-08
May
-09
Feb-
10 Nov
-10
Aug
-11
May
-12
Feb-
13Nov-1
3Aug
-14
May-1
5Fe
b-16
0123456789
10
% o
f all
aged
16
to 2
4
Headington Quarry Oxfordshire England
Vulnerable groups: Disability 14
What information is shown here?
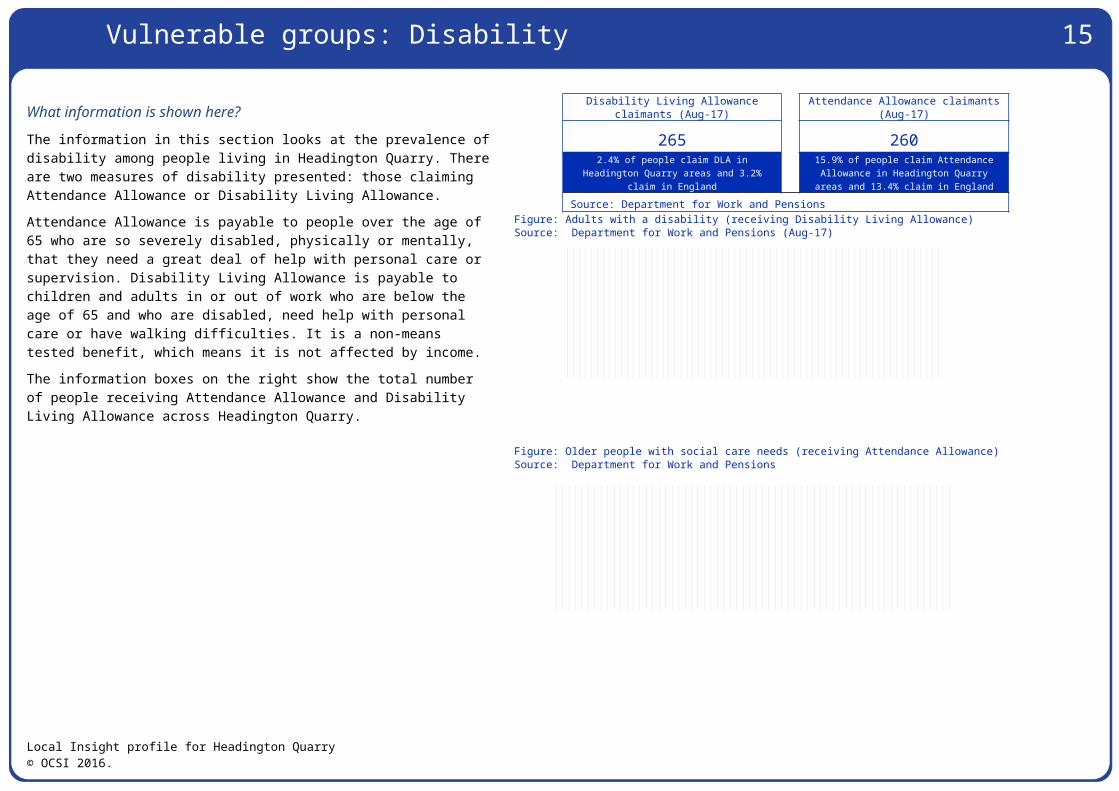
The information in this section looks at the prevalence of disability among people living in Headington Quarry. There are two measures of disability presented: those claiming Attendance Allowance or Disability Living Allowance.Attendance Allowance is payable to people over the age of 65 who are so severely disabled, physically or mentally, that they need a great deal of help with personal care or supervision. Disability Living Allowance is payable to children and adults in or out of work who are below the age of 65 and who are disabled, need help with personal care or have walking difficulties. It is a non-means tested benefit, which means it is not affected by income.The information boxes on the right show the total number of people receiving Attendance Allowance and Disability Living Allowance across Headington Quarry.
Figure: Adults with a disability (receiving Disability Living Allowance)Source: Department for Work and Pensions (Aug-17)
Figure: Older people with social care needs (receiving Attendance Allowance)Source: Department for Work and Pensions
Local Insight profile for Headington Quarry© OCSI 2016.
May-0
2Nov
-02
May-0
3Nov
-03
May-0
4Nov
-04
May-0
5Nov
-05
May-0
6Nov
-06
May-0
7Nov
-07
May-0
8Nov
-08
May-0
9Nov
-09
May-1
0Nov
-10
May-1
1Nov
-11
May-1
2Nov
-12
May-1
3Nov
-13
May-1
4Nov
-14
May-1
5Nov
-15
May-1
6Nov
-16
May-1
7
0.0
1.0
2.0
3.0
4.0
5.0
6.0
% o
f all
peop
le
Headington Quarry Oxfordshire England
May-0
2Nov
-02
May-0
3Nov
-03
May-0
4Nov
-04
May-0
5Nov
-05
May-0
6Nov
-06
May-0
7Nov
-07
May-0
8Nov
-08
May-0
9Nov
-09
May-1
0Nov
-10
May-1
1Nov
-11
May-1
2Nov
-12
May-1
3Nov
-13
May-1
4Fe
b-15Aug
-15
Feb-
16Aug-1
6Fe
b-17Aug
-17
0
5
10
15
20
25
% a
ll pe
ople
of p
ensi
onab
le a
ge
Headington Quarry Oxfordshire England
Increasein 2009 followingchangein definitionofpensionableage (excludingfemalesaged 60-64)
Disability Living Allowance claimants (Aug-17)
Attendance Allowance claimants (Aug-17)
265 2602.4% of people claim DLA in HeadingtonQuarry areas and 3.2% claim in England
15.9% of people claim AttendanceAllowance in Headington Quarry areas
and 13.4% claim in EnglandSource: Department for Work and Pensions
Vulnerable groups: Working age benefit claimants (1) 15
What information is shown here?
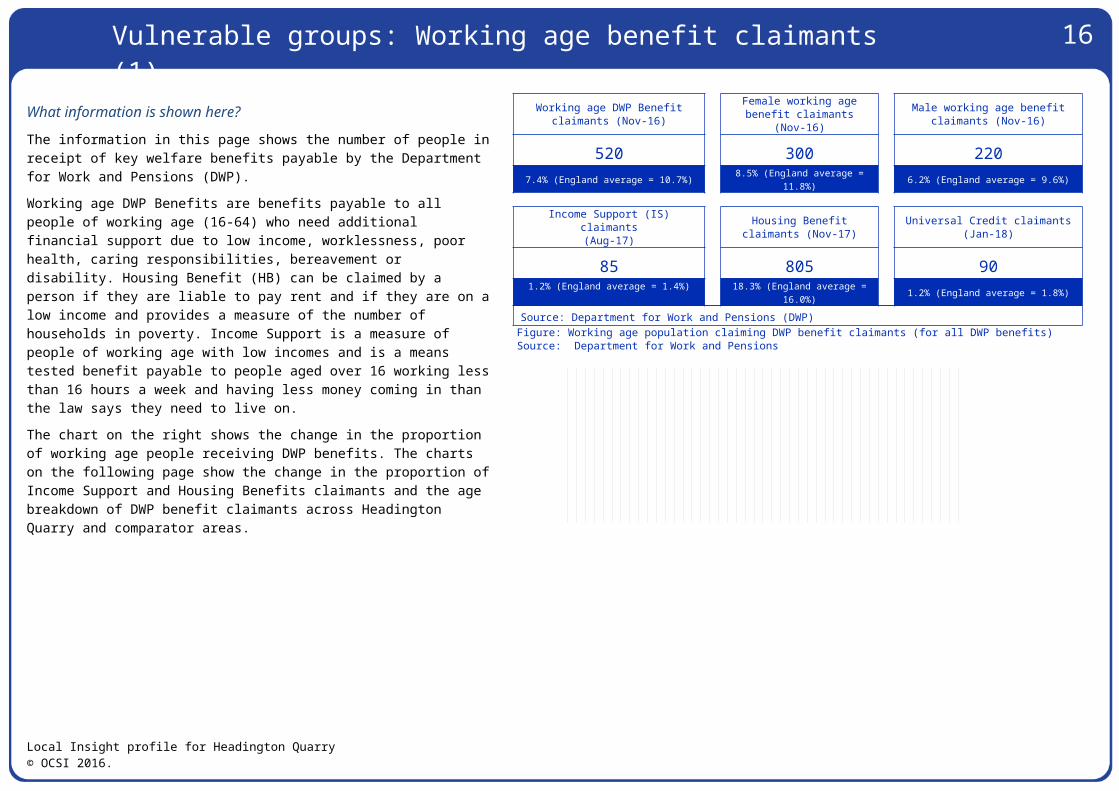
The information in this page shows the number of people in receipt of key welfare benefits payable by the Department for Work and Pensions (DWP).Working age DWP Benefits are benefits payable to all people of working age (16-64) who need additional financial support due to low income, worklessness, poor health, caring responsibilities, bereavement or disability. Housing Benefit (HB) can be claimed by a person if they are liable to pay rent and if they are on a low income and provides a measure of the number of households in poverty. Income Support is a measure of people of working age with low incomes and is a means tested benefit payable to people aged over 16 working less than 16 hours a week and having less money coming in than the law says they need to live on.The chart on the right shows the change in the proportion of working age people receiving DWP benefits. The charts on the following page show the change in the proportion of Income Support and Housing Benefits claimants and the age breakdown of DWP benefit claimants across Headington Quarry and comparator areas.
Working age DWP Benefit claimants (Nov-16)
Female working age benefit claimants (Nov-16)
Male working age benefit claimants (Nov-16)
520 300 2207.4% (England average = 10.7%) 8.5% (England average =
11.8%) 6.2% (England average = 9.6%)
Income Support (IS) claimants(Aug-17)
Housing Benefit claimants (Nov-17)
Universal Credit claimants (Jan-18)
85 805 901.2% (England average = 1.4%) 18.3% (England average =
16.0%) 1.2% (England average = 1.8%)
Source: Department for Work and Pensions (DWP)Figure: Working age population claiming DWP benefit claimants (for all DWP benefits)Source: Department for Work and Pensions
Local Insight profile for Headington Quarry© OCSI 2016.
Feb-
06Aug-0
6Fe
b-07Aug
-07
Feb-
08Aug-0
8Fe
b-09Aug
-09
Feb-
10Aug-1
0Fe
b-11Aug
-11
Feb-
12Aug-1
2Fe
b-13Aug
-13
Feb-
14Aug-1
4Fe
b-15Aug
-15
Feb-
16Aug-1
6
0
2
4
6
8
10
12
14
16
% o
f wor
king
age
pop
ulat
ion
Headington Quarry Oxfordshire England
Vulnerable groups: Working age benefit claimants (2) 16
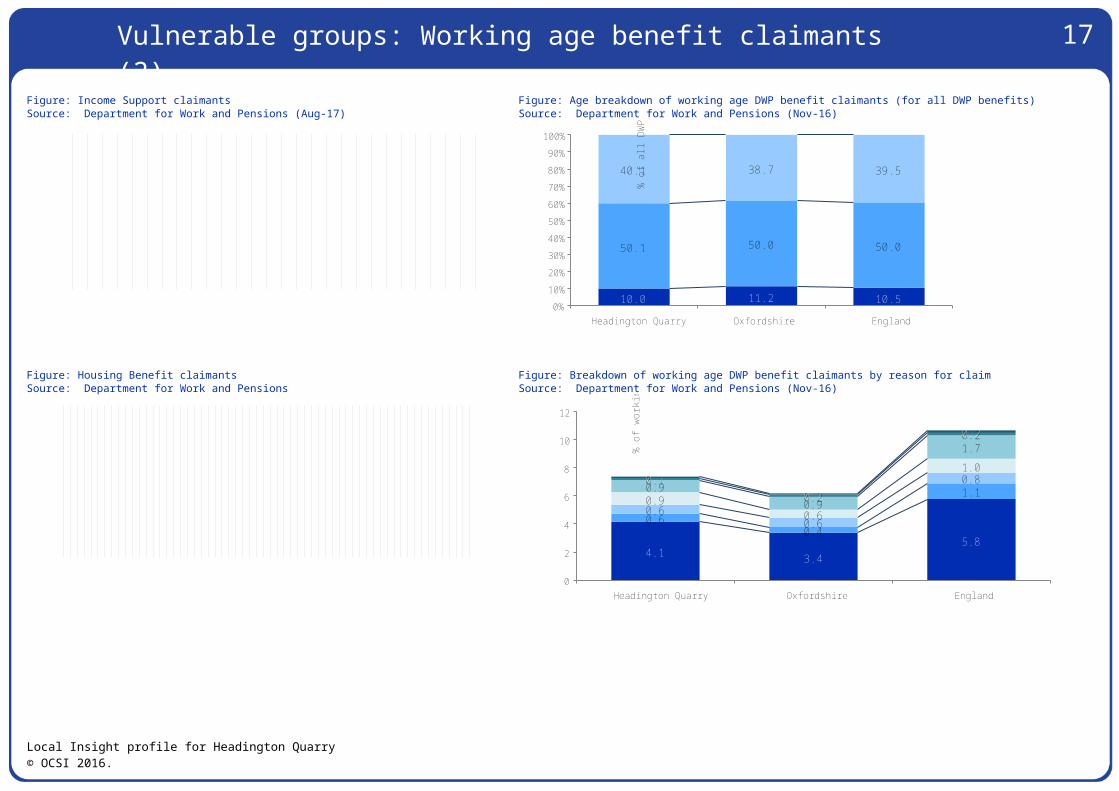
Figure: Income Support claimantsSource: Department for Work and Pensions (Aug-17)
Figure: Age breakdown of working age DWP benefit claimants (for all DWP benefits)Source: Department for Work and Pensions (Nov-16)
Figure: Housing Benefit claimantsSource: Department for Work and Pensions
Figure: Breakdown of working age DWP benefit claimants by reason for claimSource: Department for Work and Pensions (Nov-16)
Local Insight profile for Headington Quarry© OCSI 2016.
Feb-
04Aug-0
4Fe
b-05Aug
-05
Feb-
06Aug-0
6Fe
b-07Aug
-07
Feb-
08Aug-0
8Fe
b-09Aug
-09
Feb-
10Aug-1
0Fe
b-11Aug
-11
Feb-
12Aug-1
2Fe
b-13Aug
-13
Feb-
14Aug-1
4Fe
b-15Aug
-15
Feb-
16Aug-1
6Fe
b-17Aug
-17
0
1
2
3
4
5
6
7%
of a
ll w
orki
ng a
ge a
dults
Headington Quarry Oxfordshire England
10.0 11.2 10.5
50.1 50.0 50.0
40.1 38.7 39.5
Headington Quarry Oxfordshire England0%
10%
20%
30%
40%
50%
60%
70%
80%
90%
100%
% o
f all
DW
P be
nefit
cla
iman
ts
Aged 16-24 Aged 25-49 Aged 50-64
Jan-1
1Mar-
11May-1
1Jul-1
1Se
p-11Nov
-11
Jan-1
2Mar-
12May-1
2Jul-1
2Se
p-12Nov
-12
Jan-1
3Mar-
13May-1
3Jul-1
3Se
p-13Nov
-13
Jan-1
4Mar-
14May-1
4Jul-1
4Se
p-14Nov
-14
May-1
5Nov
-15
May-1
6Nov
-16
May-1
7Nov
-17
0
5
10
15
20
25
% o
f all
hous
ehol
ds
Headington Quarry Oxfordshire England
4.1 3.45.8
0.60.4
1.10.6
0.6
0.8
0.90.6
1.0
0.90.9
1.7
0.10.2
0.2
0.10.1
0.2
Headington Quarry Oxfordshire England0
2
4
6
8
10
12
% o
f wor
king
age
pop
ulat
ion
Work limiting illness Jobseeeker Disabled Lone Parent Carer Bereaved Other
17
What information is shown here?
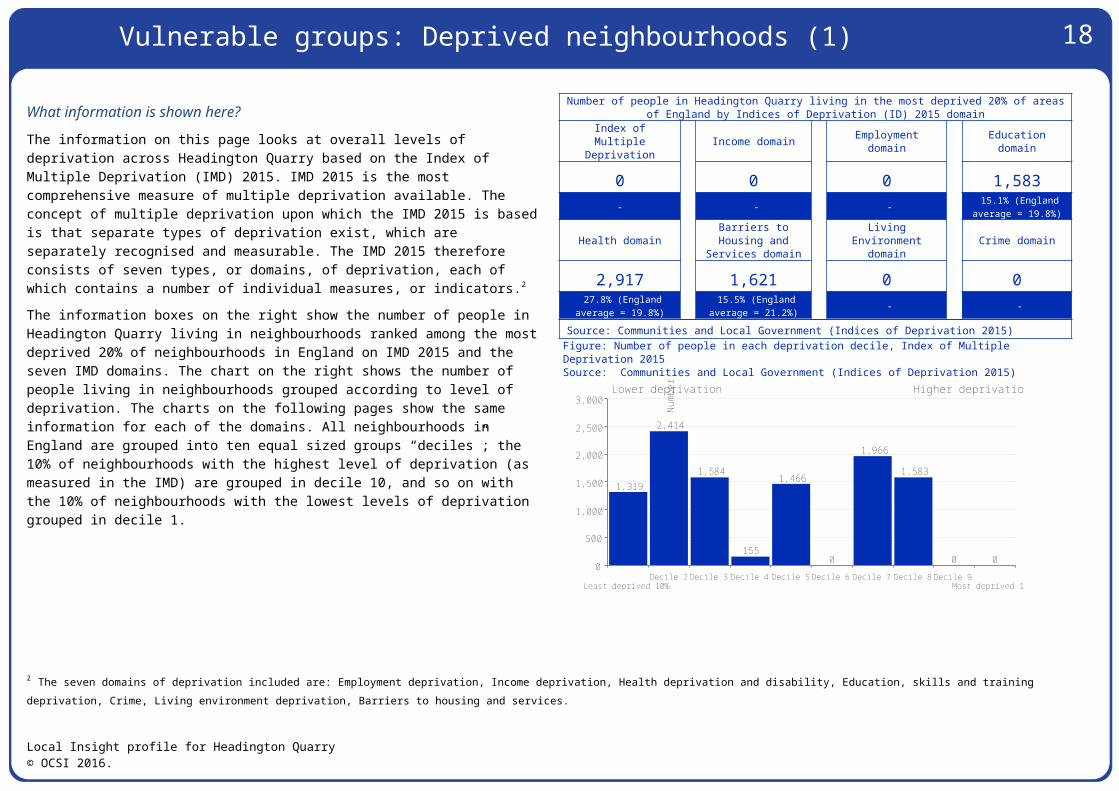
The information on this page looks at overall levels of deprivation across Headington Quarry based on the Index of Multiple Deprivation (IMD) 2015. IMD 2015 is the most comprehensive measure of multiple deprivation available. The concept of multiple deprivation upon which the IMD 2015 is based is that separate types of deprivation exist, which are separately recognised and measurable. The IMD 2015 therefore consists of seven types, or domains, of deprivation, each of which contains a number of individual measures, or indicators.2
The information boxes on the right show the number of people in Headington Quarry living in neighbourhoods ranked among the most deprived 20% of neighbourhoods in England on IMD 2015 and the seven IMD domains. The chart on the right shows the number of people living in neighbourhoods grouped according to level of deprivation. The charts on the following pages show the same information for each of the domains. All neighbourhoods in England are grouped into ten equal sized groups “deciles”; the 10% of neighbourhoods with the highest level of deprivation (as measured in the IMD) are grouped in decile 10, and so on with the 10% of neighbourhoods with the lowest levels of deprivation grouped in decile 1.
Number of people in Headington Quarry living in the most deprived 20% of areas of England by Indices of Deprivation (ID) 2015 domain
Index of Multiple Deprivation Income domain Employment
domainEducation domain
0 0 0 1,583- - - 15.1% (England
average = 19.8%)
Health domainBarriers to
Housing and Services domain
Living Environment domain Crime domain
2,917 1,621 0 0 27.8% (England
average = 19.8%) 15.5% (England
average = 21.2%) - -
Source: Communities and Local Government (Indices of Deprivation 2015)Figure: Number of people in each deprivation decile, Index of Multiple Deprivation 2015Source: Communities and Local Government (Indices of Deprivation 2015)
2 The seven domains of deprivation included are: Employment deprivation, Income deprivation, Health deprivation and disability, Education, skills and training deprivation, Crime, Living environment deprivation, Barriers to housing and services.
Local Insight profile for Headington Quarry© OCSI 2016.
1,319
2,414
1,584
155
1,466
0
1,966
1,583
0 0
Least deprived 10%Decile 2 Decile 3 Decile 4 Decile 5 Decile 6 Decile 7 Decile 8 Decile 9
Most deprived 10%
0
500
1,000
1,500
2,000
2,500
3,000
Num
ber
of p
eopl
e
Higher deprivationLower deprivation
Vulnerable groups: Deprived neighbourhoods (1)
Vulnerable groups: Deprived neighbourhoods (2) 18
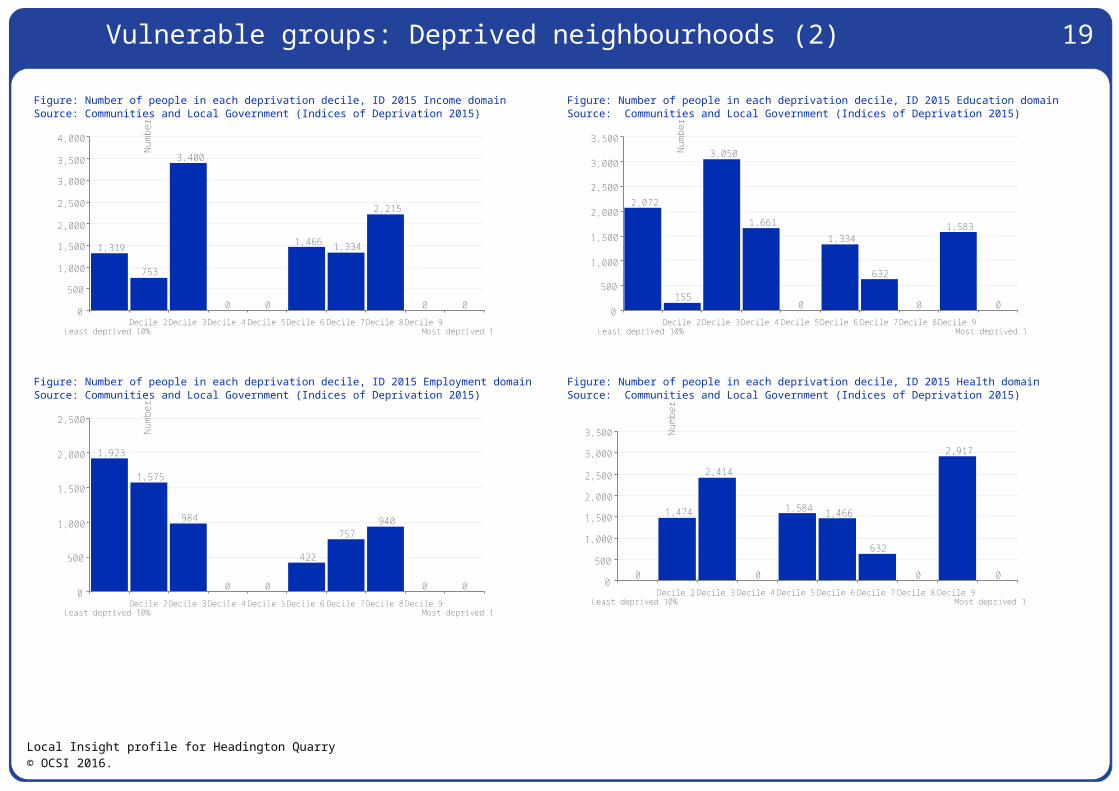
Figure: Number of people in each deprivation decile, ID 2015 Income domainSource: Communities and Local Government (Indices of Deprivation 2015)
Figure: Number of people in each deprivation decile, ID 2015 Education domainSource: Communities and Local Government (Indices of Deprivation 2015)
Figure: Number of people in each deprivation decile, ID 2015 Employment domainSource: Communities and Local Government (Indices of Deprivation 2015)
Figure: Number of people in each deprivation decile, ID 2015 Health domainSource: Communities and Local Government (Indices of Deprivation 2015)
Local Insight profile for Headington Quarry© OCSI 2016.
1,319
753
3,400
0 0
1,466 1,334
2,215
0 0
Least deprived 10%Decile 2 Decile 3 Decile 4 Decile 5 Decile 6 Decile 7 Decile 8 Decile 9
Most deprived 10%
0
500
1,000
1,500
2,000
2,500
3,000
3,500
4,000N
umbe
r of
peo
ple
HigherincomedeprivationLower income deprivation
2,072
155
3,050
1,661
0
1,334
632
0
1,583
0
Least deprived 10%Decile 2 Decile 3 Decile 4 Decile 5 Decile 6 Decile 7 Decile 8 Decile 9
Most deprived 10%
0
500
1,000
1,500
2,000
2,500
3,000
3,500
Num
ber
of p
eopl
e
HighereducationdeprivationLower education deprivation
1,923
1,575
984
0 0
422
757940
0 0
Least deprived 10%Decile 2 Decile 3 Decile 4 Decile 5 Decile 6 Decile 7 Decile 8 Decile 9
Most deprived 10%
0
500
1,000
1,500
2,000
2,500
Num
ber
of p
eopl
e
HigheremploymentdeprivationLower employment deprivation
0
1,474
2,414
0
1,584 1,466
632
0
2,917
0
Least deprived 10%Decile 2 Decile 3 Decile 4 Decile 5 Decile 6 Decile 7 Decile 8 Decile 9
Most deprived 10%
0
500
1,000
1,500
2,000
2,500
3,000
3,500 Num
ber
of p
eopl
e
HigherhealthdeprivationLower health deprivation
Vulnerable groups: Deprived neighbourhoods (3) 19
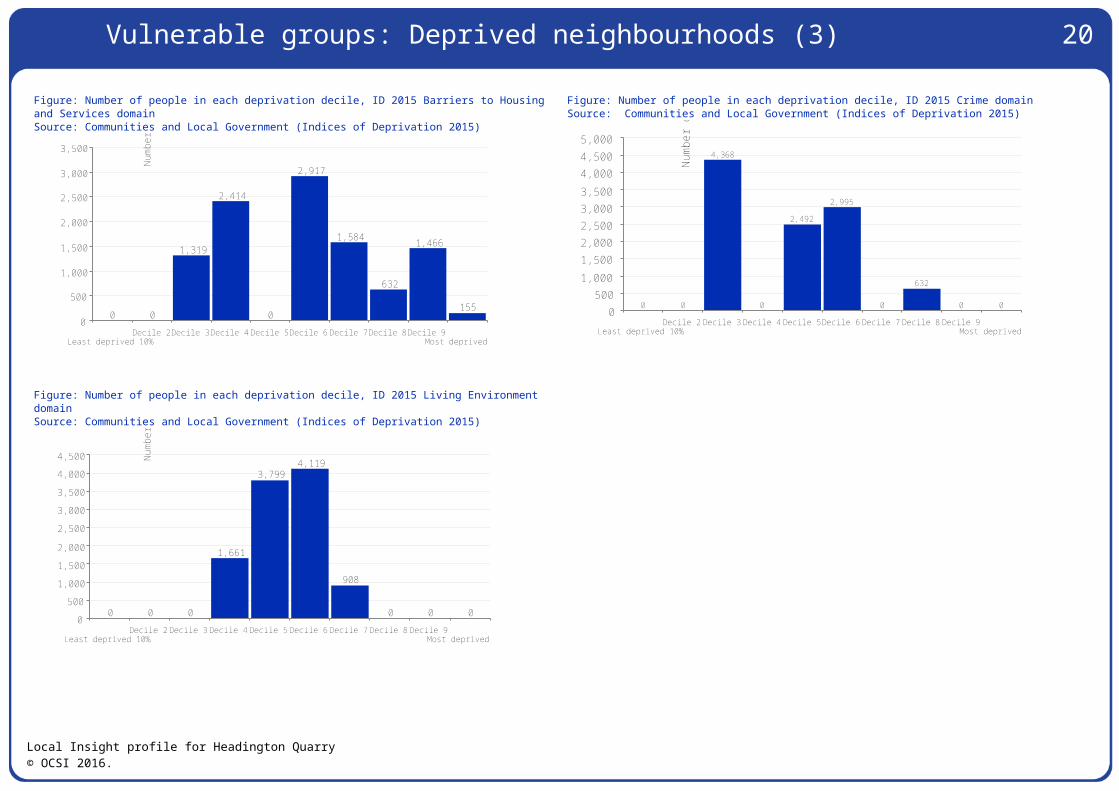
Figure: Number of people in each deprivation decile, ID 2015 Barriers to Housing and Services domainSource: Communities and Local Government (Indices of Deprivation 2015)
Figure: Number of people in each deprivation decile, ID 2015 Crime domainSource: Communities and Local Government (Indices of Deprivation 2015)
Figure: Number of people in each deprivation decile, ID 2015 Living Environment domainSource: Communities and Local Government (Indices of Deprivation 2015)
Local Insight profile for Headington Quarry© OCSI 2016.
0 0
1,319
2,414
0
2,917
1,584
632
1,466
155
Least deprived 10%Decile 2 Decile 3 Decile 4 Decile 5 Decile 6 Decile 7 Decile 8 Decile 9
Most deprived 10%
0
500
1,000
1,500
2,000
2,500
3,000
3,500N
umbe
r of
peo
ple
Higherbarrierstohousingandservicesdeprivation
Lowerbarrierstohousingandservicesdeprivation
0 0
4,368
0
2,492
2,995
0
632
0 0
Least deprived 10%Decile 2 Decile 3 Decile 4 Decile 5 Decile 6 Decile 7 Decile 8 Decile 9
Most deprived 10%
0500
1,0001,5002,0002,5003,0003,5004,0004,5005,000
Num
ber
of p
eopl
e
HighercrimelevelsLower crime levels
0 0 0
1,661
3,7994,119
908
0 0 0
Least deprived 10%Decile 2 Decile 3 Decile 4 Decile 5 Decile 6 Decile 7 Decile 8 Decile 9
Most deprived 10%
0
500
1,000
1,500
2,000
2,500
3,000
3,500
4,000
4,500 Num
ber
of p
eopl
e
HigherlivingenvironmentdeprivationLower living environment deprivation
Vulnerable groups: Children (1) 20
What information is shown here?
This page looks at children in out of work households, children in poverty and children in lone parent households. Children in ‘out of work’ households, are defined as dependent children living in families where all adults are in receipt of Jobseeker\'s Allowance, Income Support,
Children in ‘out of work’ households (2016)
Children in lone parent households
(2012)Children in poverty
(2014)
235 540 33510.7% (England average =
14.0%)24.3% (England average
= 27.2%)16.7% (England average =
20.1%)
Source: HM Revenue and Customs, Department for Work and Pensions
Local Insight profile for Headington Quarry© OCSI 2016.
10.7
24.3
16.7
8.0
18.9
11.514.0
27.2
20.1
Children in 'out of work' householdsChildren in lone parent households Children in poverty0
5
10
15
20
25
30
% o
f all
child
ben
efit
reci
pien
ts
Headington Quarry Oxfordshire England
2006 2007 2008 2009 2010 2011 2012 2013 20140
5
10
15
20
25
% o
f all
child
ben
efit
reci
pien
ts
Headington Quarry Oxfordshire England
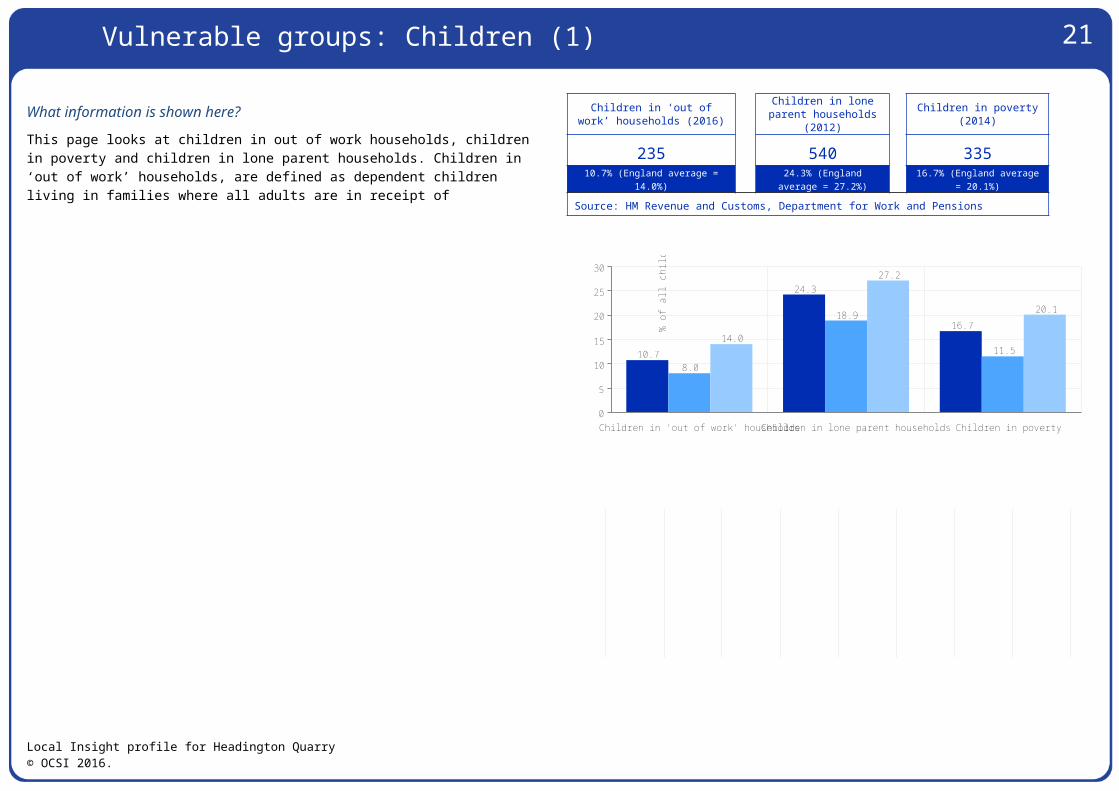
21Employment and Support Allowance, Incapacity Benefit/Severe Disablement Allowance or Pension Credit. This measure includes Universal Credit claimants. The children in poverty measure shows the proportion of children (aged 0-15) in families in receipt of out of work benefits, or in receipt of tax credits where their reported income is less than 60% median income. Out of work means-tested benefits include: Income-Based Jobseekers Allowance, incapacity benefits and Income Support.
The information boxes on the right show the count of people in each of these three categories in Headington Quarry. The bar chart shows the percentage of people in each of these categories across Headington Quarry and comparator areas (as a percentage of all children receiving Child Benefit). The line chart shows the year on year change in the proportion of children in out of work households.
Figure: Children living in poverty, worklessness and lone parent householdsSource: HM Revenue and Customs (2012-2014), Department for Work and Pensions (2012-2014)
Figure: Children living in povertySource: HM Revenue and Customs, Department for Work and Pensions
Local Insight profile for Headington Quarry© OCSI 2016.

Vulnerable groups: Children (2) - Child Wellbeing Index 22
What information is shown here?
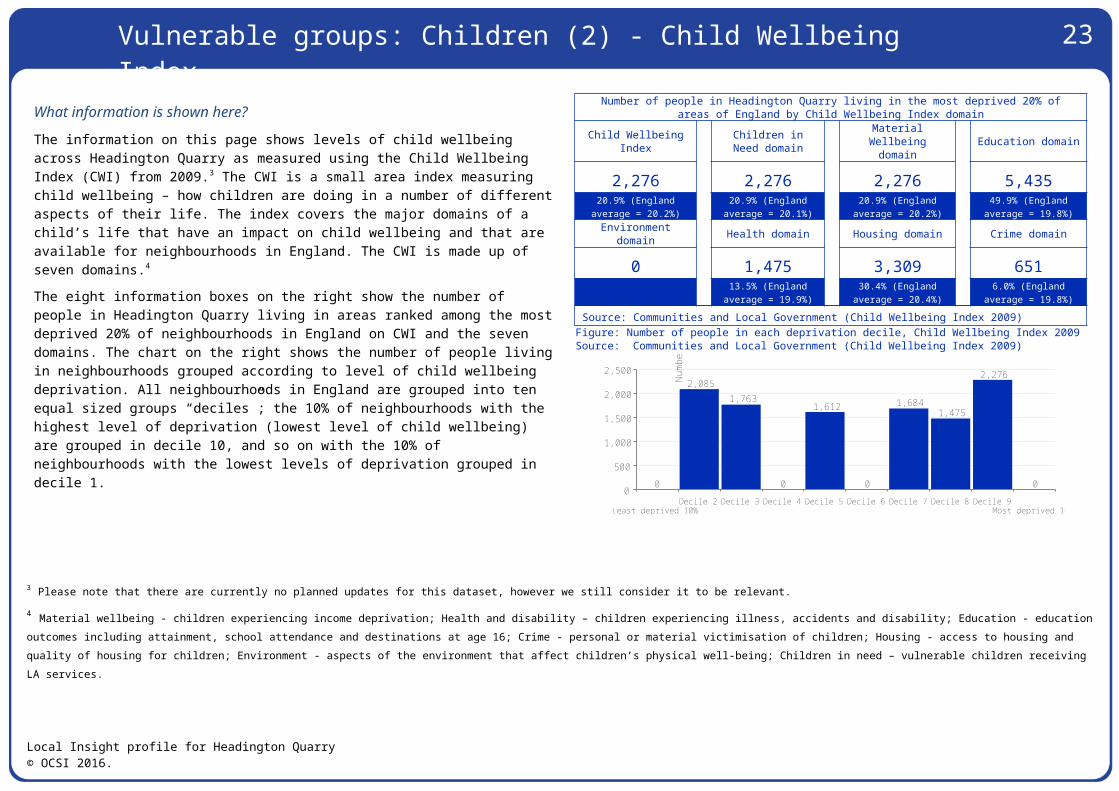
The information on this page shows levels of child wellbeing across Headington Quarry as measured using the Child Wellbeing Index (CWI) from 2009.3 The CWI is a small area index measuring child wellbeing – how children are doing in a number of different aspects of their life. The index covers the major domains of a child’s life that have an impact on child wellbeing and that are available for neighbourhoods in England. The CWI is made up of seven domains.4
The eight information boxes on the right show the number of people in Headington Quarry living in areas ranked among the most deprived 20% of neighbourhoods in England on CWI and the seven domains. The chart on the right shows the number of people living in neighbourhoods grouped according to level of child wellbeing deprivation. All neighbourhoods in England are grouped into ten equal sized groups “deciles”; the 10% of neighbourhoods with the highest level of deprivation (lowest level of child wellbeing) are grouped in decile 10, and so on with the 10% of neighbourhoods with the lowest levels of deprivation grouped in decile 1.
Number of people in Headington Quarry living in the most deprived 20% of areas of England by Child Wellbeing Index domain
Child Wellbeing Index
Children in Need domain
Material Wellbeing domain Education domain
2,276 2,276 2,276 5,43520.9% (England
average = 20.2%)20.9% (England
average = 20.1%)20.9% (England
average = 20.2%)49.9% (England
average = 19.8%)Environment
domain Health domain Housing domain Crime domain
0 1,475 3,309 65113.5% (England
average = 19.9%)30.4% (England
average = 20.4%)6.0% (England
average = 19.8%)Source: Communities and Local Government (Child Wellbeing Index 2009)
Figure: Number of people in each deprivation decile, Child Wellbeing Index 2009Source: Communities and Local Government (Child Wellbeing Index 2009)
3 Please note that there are currently no planned updates for this dataset, however we still consider it to be relevant.4 Material wellbeing - children experiencing income deprivation; Health and disability – children experiencing illness, accidents and disability; Education - education outcomes including attainment, school attendance and destinations at age 16; Crime - personal or material victimisation of children; Housing - access to housing and quality of housing for children; Environment - aspects of the environment that affect children’s physical well-being; Children in need – vulnerable children receiving LA services.
Local Insight profile for Headington Quarry© OCSI 2016.
0
2,0851,763
0
1,612
0
1,6841,475
2,276
0
Least deprived 10%Decile 2 Decile 3 Decile 4 Decile 5 Decile 6 Decile 7 Decile 8 Decile 9
Most deprived 10%
0
500
1,000
1,500
2,000
2,500
Num
ber
of p
eopl
e
LowerchildwellbeingHigherchildwellbeing
Vulnerable groups: Pensioners 23
What information is shown here?
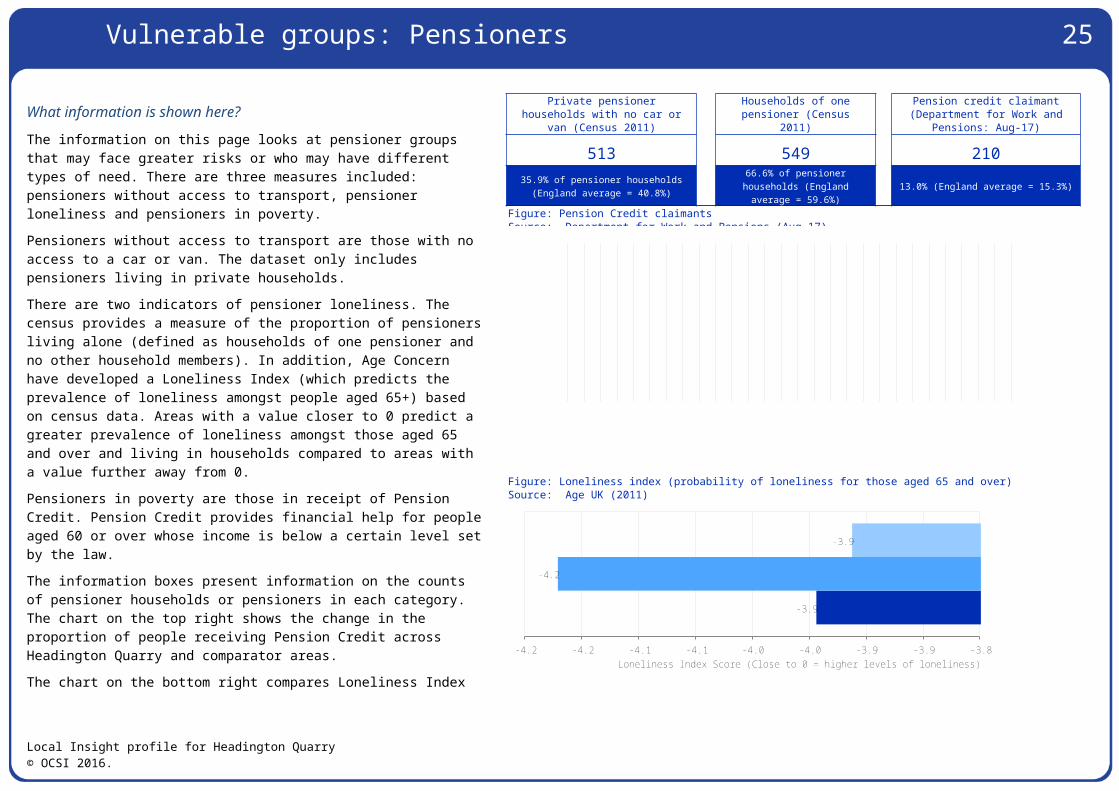
The information on this page looks at pensioner groups that may face greater risks or who may have different types of need. There are three measures included: pensioners without access to transport, pensioner loneliness and pensioners in poverty.Pensioners without access to transport are those with no access to a car or van. The dataset only includes pensioners living in private households.There are two indicators of pensioner loneliness. The census provides a measure of the proportion of pensioners living alone (defined as households of one pensioner and no other household members). In addition, Age Concern have developed a Loneliness Index (which predicts the prevalence of loneliness amongst people aged 65+) based on census data. Areas with a value closer to 0 predict a greater prevalence of loneliness amongst those aged 65 and over and living in households compared to areas with a value further away from 0.Pensioners in poverty are those in receipt of Pension Credit. Pension Credit provides financial help for people aged 60 or over whose income is below a certain level set by the law.
Private pensioner households with no car or van (Census
2011)Households of one
pensioner (Census 2011)Pension credit claimant
(Department for Work and Pensions: Aug-17)
513 549 21035.9% of pensioner households
(England average = 40.8%)
66.6% of pensionerhouseholds (England average
= 59.6%)13.0% (England average = 15.3%)
Figure: Pension Credit claimantsSource: Department for Work and Pensions (Aug-17)
Figure: Loneliness index (probability of loneliness for those aged 65 and over)Source: Age UK (2011)
Local Insight profile for Headington Quarry© OCSI 2016.
Nov-0
3May
-04
Nov-0
4May
-05
Nov-0
5May
-06
Nov-0
6May
-07
Nov-0
7May
-08
Nov-0
8May
-09
Nov-0
9May
-10
Nov-1
0May
-11
Nov-1
1May
-12
Nov-1
2May
-13
Nov-1
3May
-14
Nov-1
4May
-15
Nov-1
5May
-16
Nov-1
6May
-17
0
5
10
15
20
25
30
% o
f all
peop
le o
f pen
sion
able
age
Headington Quarry Oxfordshire England
Increasefrom2010due to new definitionof pensionableage (all peopleaged 65+)
-3.9
-4.2
-3.9
-3.8-3.9-3.9-4.0-4.0-4.1-4.1-4.2-4.2 Loneliness Index Score (Close to 0 = higher levels of loneliness)
Headington Quarry Oxfordshire England
24
The information boxes present information on the counts of pensioner households or pensioners in each category. The chart on the top right shows the change in the proportion of people receiving Pension Credit across Headington Quarry and comparator areas.The chart on the bottom right compares Loneliness Index scores across Headington Quarry and comparator areas - a value closer to 0 predicts a greater prevalence of loneliness amongst those aged 65.
Local Insight profile for Headington Quarry© OCSI 2016.
25
What information is shown here?
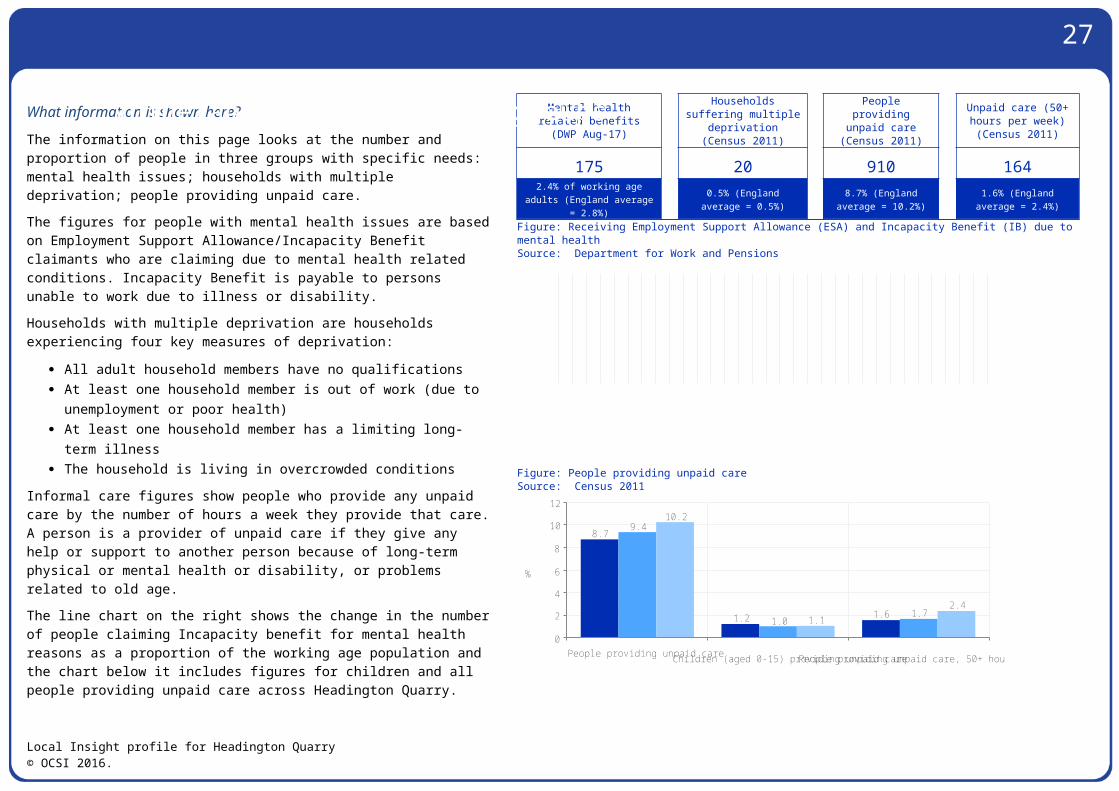
The information on this page looks at the number and proportion of people in three groups with specific needs: mental health issues; households with multiple deprivation; people providing unpaid care.The figures for people with mental health issues are based on Employment Support Allowance/Incapacity Benefit claimants who are claiming due to mental health related conditions. Incapacity Benefit is payable to persons unable to work due to illness or disability.Households with multiple deprivation are households experiencing four key measures of deprivation:
All adult household members have no qualifications At least one household member is out of work (due to
unemployment or poor health) At least one household member has a limiting long-term illness The household is living in overcrowded conditions
Informal care figures show people who provide any unpaid care by the number of hours a week they provide that care. A person is a provider of unpaid care if they give any help or support to another person because of long-term physical or mental health or disability, or problems related to old age.The line chart on the right shows the change in the number of people claiming Incapacity benefit for mental health reasons as a proportion of the working age population and the chart below it includes figures for children and all people providing unpaid care across Headington Quarry.
Mental health related benefits (DWP Aug-17)
Households suffering multiple deprivation
(Census 2011)
People providing unpaid care
(Census 2011)
Unpaid care (50+ hours per week) (Census 2011)
175 20 910 1642.4% of working age adults(England average = 2.8%)
0.5% (England average= 0.5%)
8.7% (Englandaverage = 10.2%)
1.6% (Englandaverage = 2.4%)
Figure: Receiving Employment Support Allowance (ESA) and Incapacity Benefit (IB) due to mental healthSource: Department for Work and Pensions
Figure: People providing unpaid careSource: Census 2011
Local Insight profile for Headington Quarry© OCSI 2016.
Feb-
10May-1
0Aug
-10
Nov-1
0Fe
b-11May
-11
Aug-1
1Nov
-11
Feb-
12May-1
2Aug
-12
Nov-1
2Fe
b-13May
-13
Aug-1
3Nov
-13
Feb-
14May-1
4Aug
-14
Nov-1
4Fe
b-15May
-15
Aug-1
5Nov
-15
Feb-
16May-1
6Aug
-16
Nov-1
6Fe
b-17May
-17
Aug-1
7
0
1
2
3
4
% o
f wor
king
age
pop
ulat
ion
Headington Quarry Oxfordshire England
8.7
1.2 1.6
9.4
1.01.7
10.2
1.12.4
People providing unpaid careChildren (aged 0-15) providing unpaid carePeople providing unpaid care, 50+ hours per week
0
2
4
6
8
10
12
%
Headington Quarry Oxfordshire England
Vulnerable groups: Other groups
26
What information is shown here?
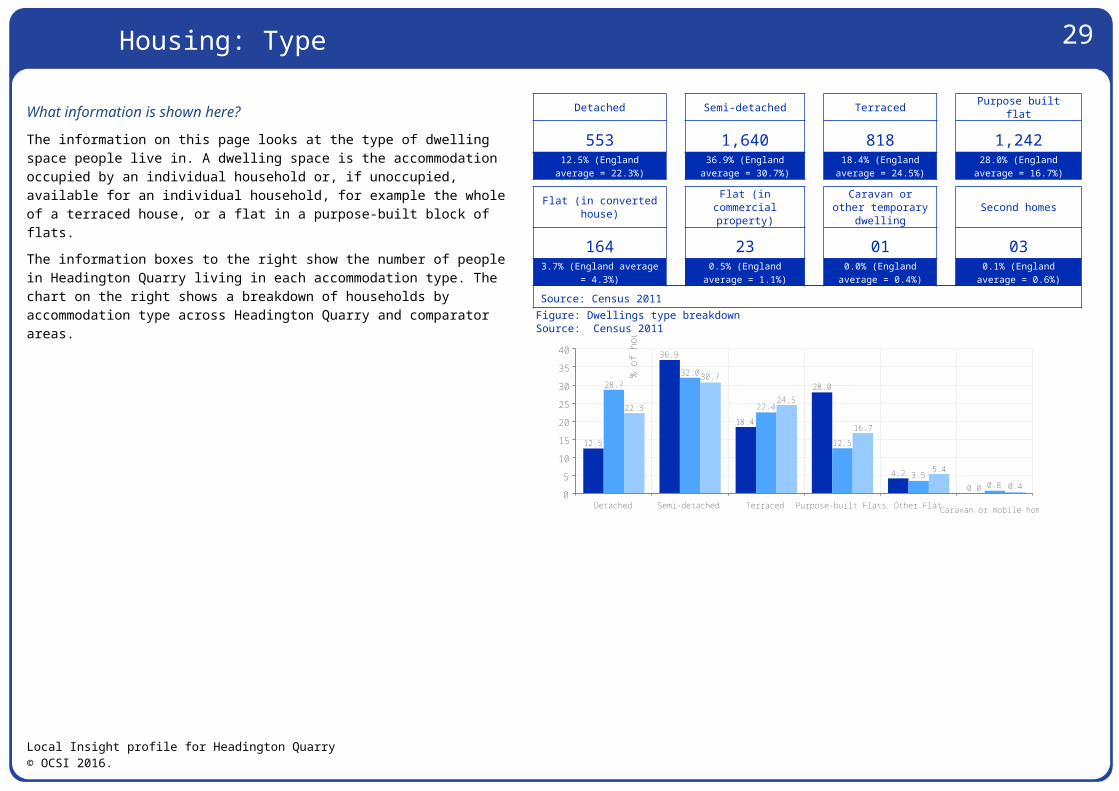
The information on this page looks at the type of dwelling space people live in. A dwelling space is the accommodation occupied by an individual household or, if unoccupied, available for an individual household, for example the whole of a terraced house, or a flat in a purpose-built block of flats.The information boxes to the right show the number of people in Headington Quarry living in each accommodation type. The chart on the right shows a breakdown of households by accommodation type across Headington Quarry and comparator areas.
Detached Semi-detached Terraced Purpose built flat
553 1,640 818 1,24212.5% (England average
= 22.3%)36.9% (England
average = 30.7%)18.4% (England
average = 24.5%)28.0% (England
average = 16.7%)
Flat (in converted house)
Flat (in commercial property)
Caravan or other temporary dwelling
Second homes
164 23 01 033.7% (England average
= 4.3%)0.5% (England
average = 1.1%)0.0% (England
average = 0.4%)0.1% (England average
= 0.6%)Source: Census 2011
Figure: Dwellings type breakdownSource: Census 2011
Local Insight profile for Headington Quarry© OCSI 2016.
12.5
36.9
18.4
28.0
4.2
0.0
28.732.0
22.4
12.5
3.50.8
22.3
30.7
24.5
16.7
5.4
0.4
Detached Semi-detached Terraced Purpose-built Flats Other Flat Caravan or mobile home
0
5
10
15
20
25
30
35
40
% o
f hou
seho
ld s
pace
s
Headington Quarry Oxfordshire England
Housing: Type
27
What information is shown here?
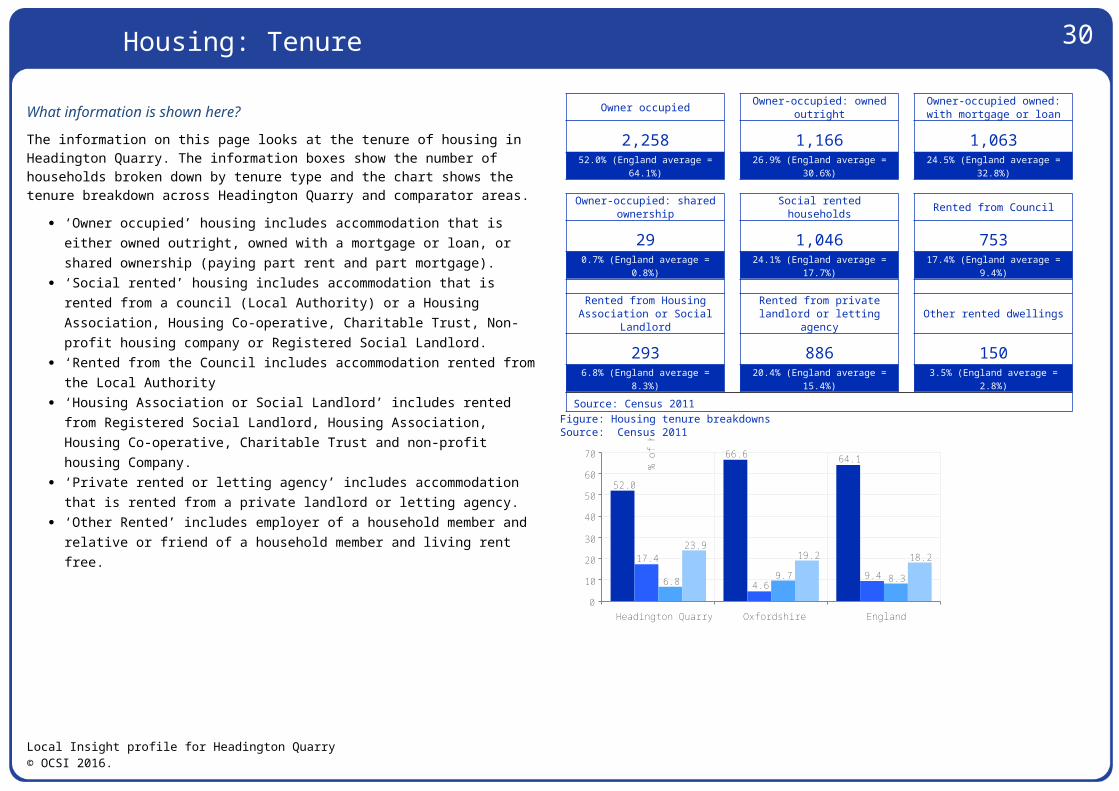
The information on this page looks at the tenure of housing in Headington Quarry. The information boxes show the number of households broken down by tenure type and the chart shows the tenure breakdown across Headington Quarry and comparator areas.
‘Owner occupied’ housing includes accommodation that is either owned outright, owned with a mortgage or loan, or shared ownership (paying part rent and part mortgage).
‘Social rented’ housing includes accommodation that is rented from a council (Local Authority) or a Housing Association, Housing Co-operative, Charitable Trust, Non-profit housing company or Registered Social Landlord.
‘Rented from the Council includes accommodation rented from the Local Authority
‘Housing Association or Social Landlord’ includes rented from Registered Social Landlord, Housing Association, Housing Co-operative, Charitable Trust and non-profit housing Company.
‘Private rented or letting agency’ includes accommodation that is rented from a private landlord or letting agency.
‘Other Rented’ includes employer of a household member and relative or friend of a household member and living rent free.
Owner occupied Owner-occupied: owned outright
Owner-occupied owned: with mortgage or loan
2,258 1,166 1,06352.0% (England average =
64.1%)26.9% (England average =
30.6%)24.5% (England average =
32.8%)
Owner-occupied: shared ownership Social rented households Rented from Council
29 1,046 7530.7% (England average =
0.8%)24.1% (England average =
17.7%)17.4% (England average =
9.4%)
Rented from Housing Association or Social
LandlordRented from private
landlord or letting agency Other rented dwellings
293 886 1506.8% (England average =
8.3%)20.4% (England average =
15.4%)3.5% (England average =
2.8%)Source: Census 2011
Figure: Housing tenure breakdownsSource: Census 2011
Local Insight profile for Headington Quarry© OCSI 2016.
52.0
66.6 64.1
17.4
4.69.46.8 9.7 8.3
23.919.2 18.2
Headington Quarry Oxfordshire England0
10
20
30
40
50
60
70
% o
f hou
seho
lds
Owner Occupied Local Authority Rented Housing Association rented Other Rented
Housing: Tenure

28
What information is shown here?
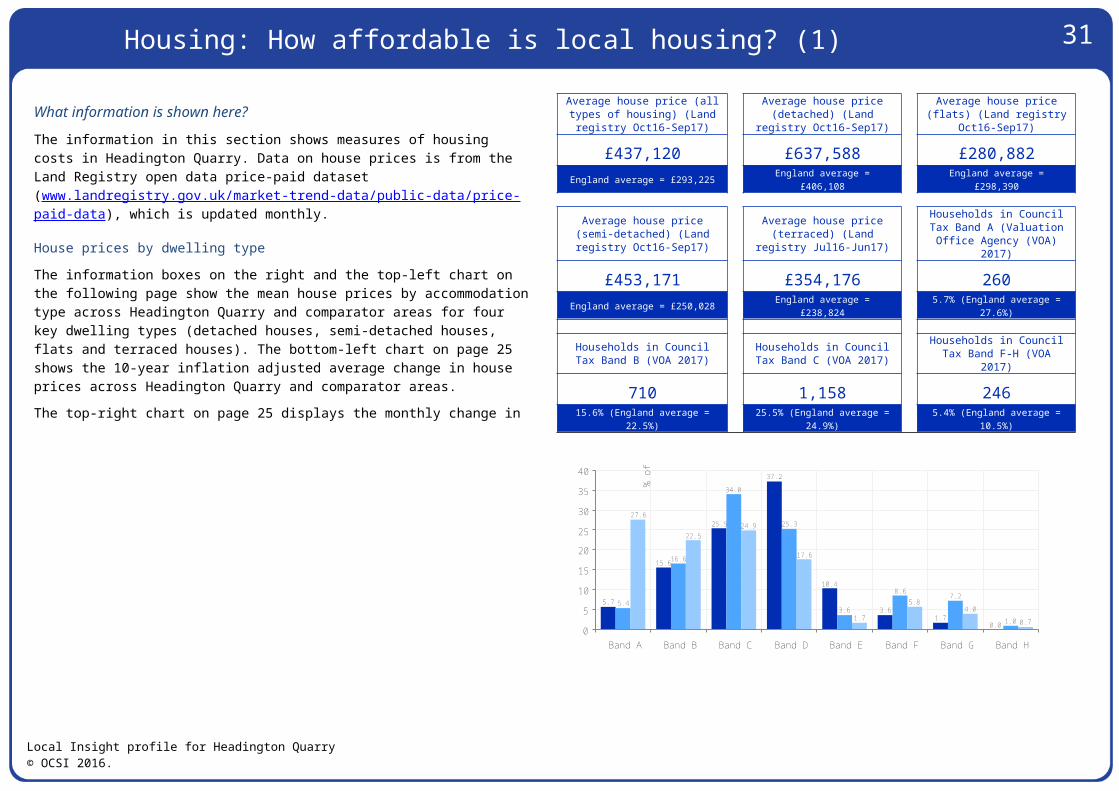
The information in this section shows measures of housing costs in Headington Quarry. Data on house prices is from the Land Registry open data price-paid dataset (www.landregistry.gov.uk/market-trend-data/public-data/price-paid-data), which is updated monthly.
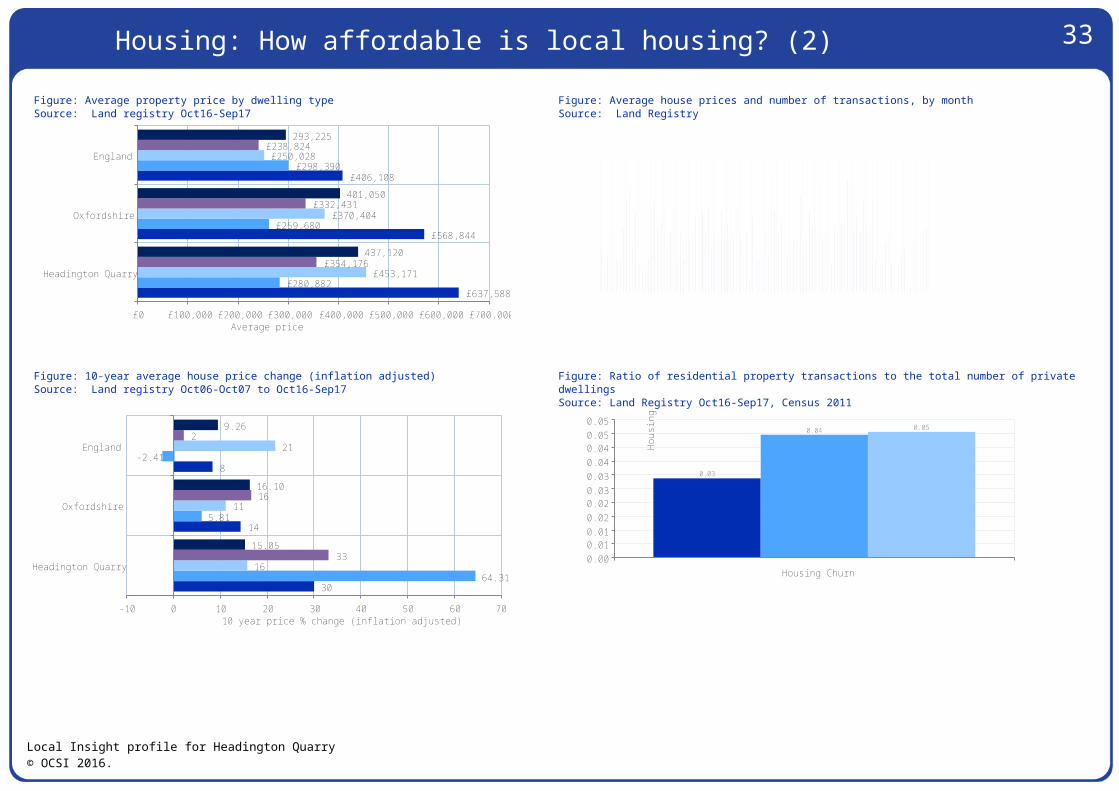
House prices by dwelling typeThe information boxes on the right and the top-left chart on the following page show the mean house prices by accommodation type across Headington Quarry and comparator areas for four key dwelling types (detached houses, semi-detached houses, flats and terraced houses). The bottom-left chart on page 25 shows the 10-year inflation adjusted average change in house prices across Headington Quarry and comparator areas.The top-right chart on page 25 displays the monthly change in the number of transactions and average price across Headington Quarry and the bottom-right chart displays the ratio of the number of residential property transactions (Land Registry Oct16-Sep17) to the number of owner occupied and privately rented dwellings (Census 2011) – an approximate measure of the proportion of housing stock that has change hands of the year, or the housing ‘churn’.
Council tax bandsThe data on Council Tax bands shows the number (and proportion) of houses in bands A, B or C (the lowest price bands) and F, G and H (the highest price bands) locally. These price bands are set nationally, so can be used to show how the cost of all local property (not just those properties that have recently been sold) compares with other areas; the chart on the right compares Headington Quarry and comparator areas for these Council Tax bands.
Average house price (all types of housing) (Land registry Oct16-Sep17)
Average house price (detached) (Land registry
Oct16-Sep17)
Average house price (flats) (Land registry
Oct16-Sep17)
£437,120 £637,588 £280,882England average = £293,225 England average = £406,108 England average = £298,390
Average house price (semi-detached) (Land registry
Oct16-Sep17)
Average house price (terraced) (Land registry
Jul16-Jun17)
Households in Council Tax Band A (Valuation Office
Agency (VOA) 2017)
£453,171 £354,176 260England average = £250,028 England average = £238,824 5.7% (England average =
27.6%)
Households in Council Tax Band B (VOA 2017)
Households in Council Tax Band C (VOA 2017)
Households in Council Tax Band F-H (VOA 2017)
710 1,158 24615.6% (England average =
22.5%)25.5% (England average =
24.9%)5.4% (England average =
10.5%)Figure: Dwelling stock by council tax bandSource: Valuation Office Agency (2017)
Local Insight profile for Headington Quarry© OCSI 2016.
5.7
15.6
25.5
37.2
10.4
3.61.7
0.0
5.4
16.6
34.0
25.3
3.6
8.67.2
1.0
27.6
22.524.9
17.6
1.7
5.84.0
0.7
Band A Band B Band C Band D Band E Band F Band G Band H0
5
10
15
20
25
30
35
40
% o
f hou
seho
lds
Headington Quarry Oxfordshire England
Housing: How affordable is local housing? (1)
29
Figure: Average property price by dwelling typeSource: Land registry Oct16-Sep17
Figure: Average house prices and number of transactions, by monthSource: Land Registry
Figure: 10-year average house price change (inflation adjusted)Source: Land registry Oct06-Oct07 to Oct16-Sep17
Figure: Ratio of residential property transactions to the total number of private dwellingsSource: Land Registry Oct16-Sep17, Census 2011
Local Insight profile for Headington Quarry© OCSI 2016.
£637,588
£568,844
£406,108
£280,882
£259,680
£298,390
£453,171
£370,404
£250,028
£354,176
£332,431
£238,824
437,120
401,050
293,225
Headington Quarry
Oxfordshire
England
£700,000£600,000£500,000£400,000£300,000£200,000£100,000£0Average price
Detached Flat Semi-detached Terrraced All
Jan-09M
ay-09Sep-09
Jan-10M
ay-10Sep-10
Jan-11M
ay-11Sep-11
Jan-12M
ay-12Sep-12
Jan-13M
ay-13Sep-13
Jan-14M
ay-14Sep-14
Jan-15M
ay-15Sep-15
Jan-16M
ay-16Sep-16
Jan-17M
ay-17Sep-17
0
5
10
15
20
25
£0
£100,000
£200,000
£300,000
£400,000
£500,000
£600,000
£700,000
Num
ber
of t
rans
actio
ns (
bars
)Av
erag
e pr
ice
(line
cha
rt)
Number of transactions Average price
30
14
8
64.31
5.81
-2.41
16
11
21
33
16
2
15.05
16.10
9.26
Headington Quarry
Oxfordshire
England
706050403020100-1010 year price % change (inflation adjusted)
All Detached Flats Semi-detached Terraced
0.03
0.04 0.05
Housing Churn0.000.010.010.020.020.030.030.040.040.050.05
Hou
sing
chu
rn r
atio
Headington Quarry Oxfordshire England
Housing: How affordable is local housing? (2)
30
What information is shown here?
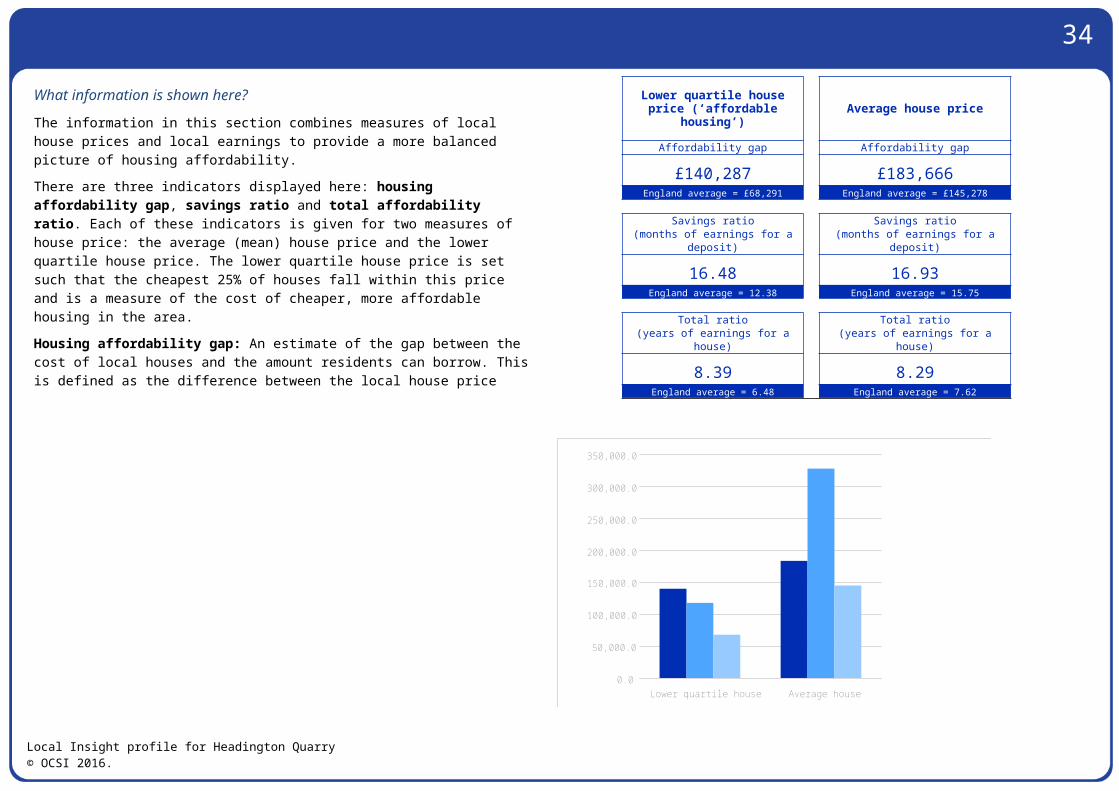
The information in this section combines measures of local house prices and local earnings to provide a more balanced picture of housing affordability.There are three indicators displayed here: housing affordability gap, savings ratio and total affordability ratio. Each of these indicators is given for two measures of house price: the average (mean) house price and the lower quartile house price. The lower quartile house price is set such that the cheapest 25% of houses fall within this price and is a measure of the cost of cheaper, more affordable housing in the area.Housing affordability gap: An estimate of the gap between the cost of local houses and the amount residents can borrow. This is defined as the difference between the local house price (either average or lower quartile) and 4.5 times local annual earnings (mortgage lenders are typically willing
Lower quartile house price (‘affordable
housing’)Average house price
Affordability gap Affordability gap
£140,287 £183,666England average = £68,291 England average = £145,278
Savings ratio(months of earnings for a
deposit)
Savings ratio(months of earnings for a
deposit)
16.48 16.93England average = 12.38 England average = 15.75
Total ratio(years of earnings for a house)
Total ratio(years of earnings for a house)
8.39 8.29England average = 6.48 England average = 7.62
Local Insight profile for Headington Quarry© OCSI 2016.
Lower quartile house Average house0.0
50,000.0
100,000.0
150,000.0
200,000.0
250,000.0
300,000.0
350,000.0
£
Headington Quarry
Oxfordshire
England
31
to lend 4-5 times annual salaries). Higher figures represent more unaffordable houses.Savings ratio: The ratio between 15% of the house price (an estimate of the savings required for a deposit) and monthly earnings. It can be interpreted as the number of months’ worth of earnings required for a deposit (not accounting for inflation or changes in earnings or house prices).Total affordability ratio: This is the ratio between the total house price and annual earnings. It can be interpreted as the number of years’ worth of earnings required for a deposit (not accounting for inflation or changes in earnings or house prices).The data for these measures come from the Land Registry (house prices) and ONS (earnings data). Earnings data is published at MSOA level. Average house price data is published at postcode level whilst lower quartile house prices are published at MSOA level. Where necessary, we have modelled data to LSOA and OA geographies.
Figure: Housing affordability gap for lower quartile house prices and average house prices.Source: Land registry house price data (Dec15-Nov16); ONS earnings data 2013/2014
Local Insight profile for Headington Quarry© OCSI 2016.
Housing: How affordable is local housing? (3)
32
What information is shown here?
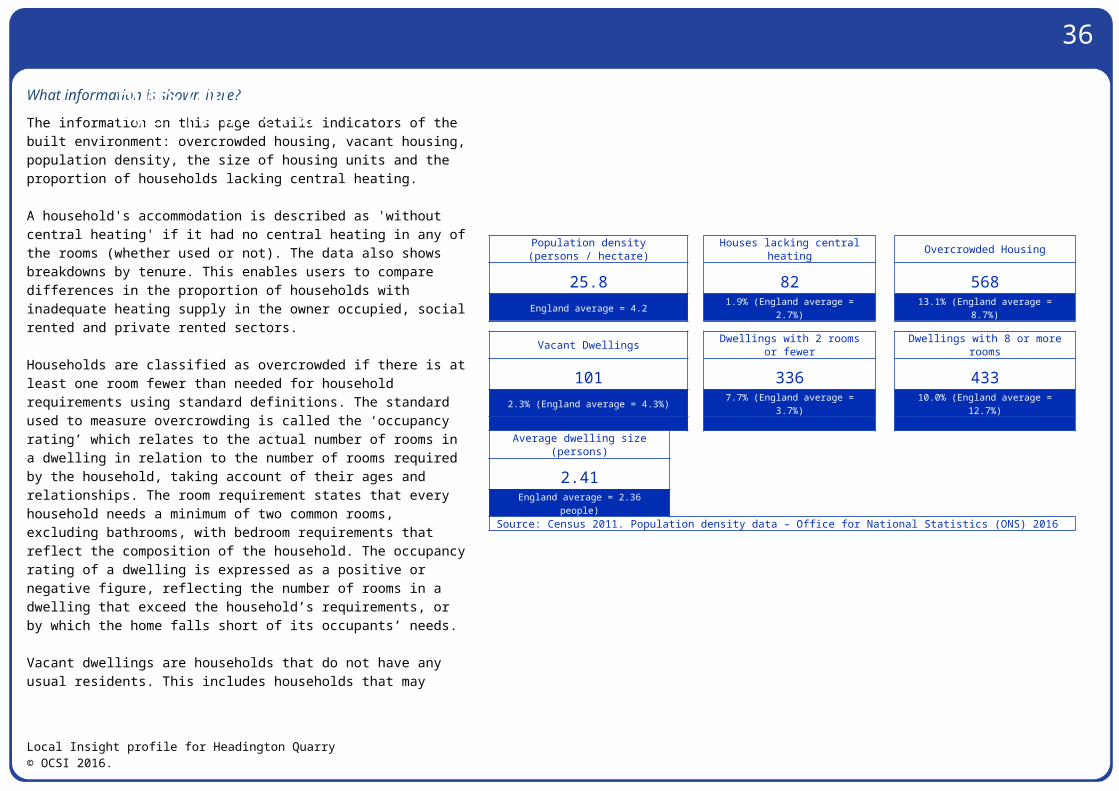
The information on this page details indicators of the built environment: overcrowded housing, vacant housing, population density, the size of housing units and the proportion of households lacking central heating.
A household's accommodation is described as 'without central heating' if it had no central heating in any of the rooms (whether used or not). The data also shows breakdowns by tenure. This enables users to compare differences in the proportion of households with inadequate heating supply in the owner occupied, social rented and private rented sectors.
Households are classified as overcrowded if there is at least one room fewer than needed for household requirements using standard definitions. The standard used to measure overcrowding is called the ‘occupancy rating’ which relates to the actual number of rooms in a dwelling in relation to the number of rooms required by the household, taking account of their ages and relationships. The room requirement states that every household needs a minimum of two common rooms, excluding bathrooms, with bedroom requirements that reflect the composition of the household. The occupancy rating of a dwelling is expressed as a positive or negative figure, reflecting the number of rooms in a dwelling that exceed the household’s requirements, or by which the home falls short of its occupants’ needs.
Vacant dwellings are households that do not have any usual residents. This includes households that may still be used by short-term residents, visitors who were present on census night, or a combination of short-term residents and visitors. It also includes vacant household spaces and household spaces that are
Population density (persons / hectare)
Houses lacking central heating Overcrowded Housing
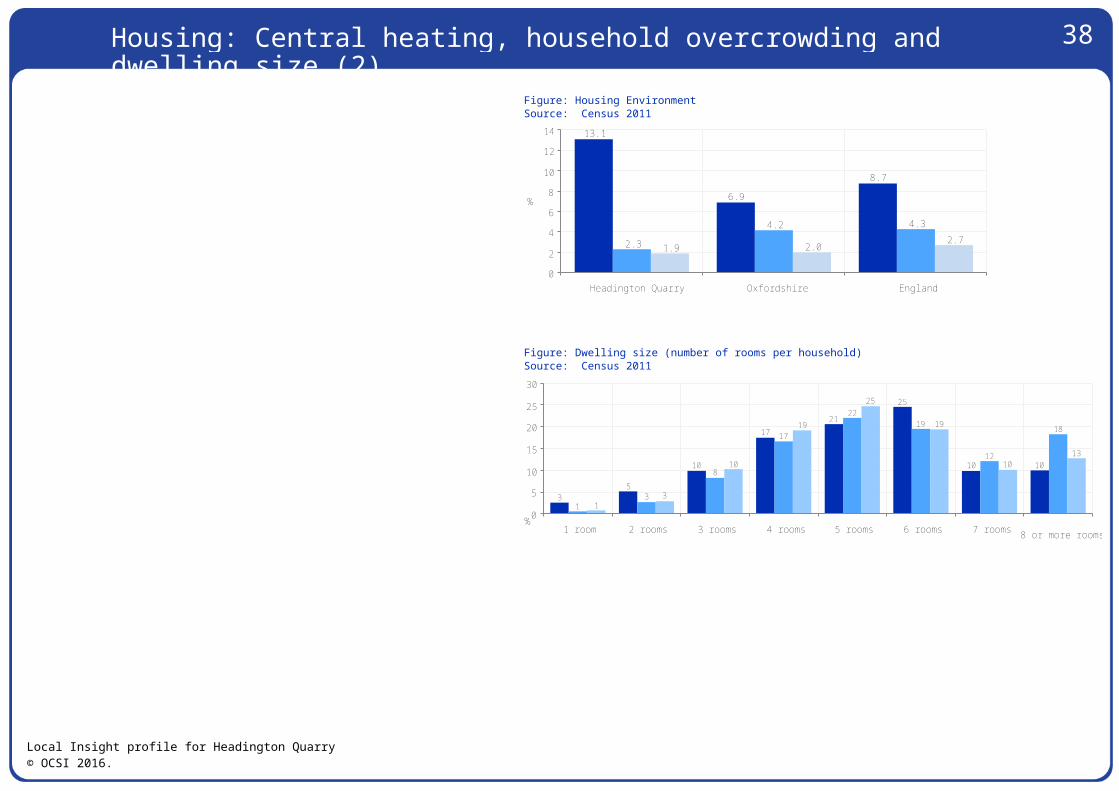
25.8 82 568England average = 4.2 1.9% (England average = 2.7%) 13.1% (England average = 8.7%)
Vacant Dwellings Dwellings with 2 rooms or fewer
Dwellings with 8 or more rooms
101 336 4332.3% (England average = 4.3%) 7.7% (England average = 3.7%) 10.0% (England average = 12.7%)
Average dwelling size (persons)
2.41England average = 2.36 people)
Source: Census 2011. Population density data – Office for National Statistics (ONS) 2016
Local Insight profile for Headington Quarry© OCSI 2016.
Housing: Central heating, household overcrowding and dwelling size
33used as second addresses.
Local Insight profile for Headington Quarry© OCSI 2016.
34
Figure: Housing EnvironmentSource: Census 2011
Figure: Dwelling size (number of rooms per household)Source: Census 2011
Local Insight profile for Headington Quarry© OCSI 2016.
13.1
6.9
8.7
2.3
4.2 4.3
1.9 2.02.7
Headington Quarry Oxfordshire England0
2
4
6
8
10
12
14
%
Overcrowded housing Vacant Dwellings Lacking central heating
35
10
1721
25
10 10
13
8
17
2219
12
18
13
10
19
25
19
1013
1 room 2 rooms 3 rooms 4 rooms 5 rooms 6 rooms 7 rooms 8 or more rooms
0
5
10
15
20
25
30
%
Headington Quarry Oxfordshire England
Housing: Central heating, household overcrowding and dwelling size (2)
35
What information is shown here?
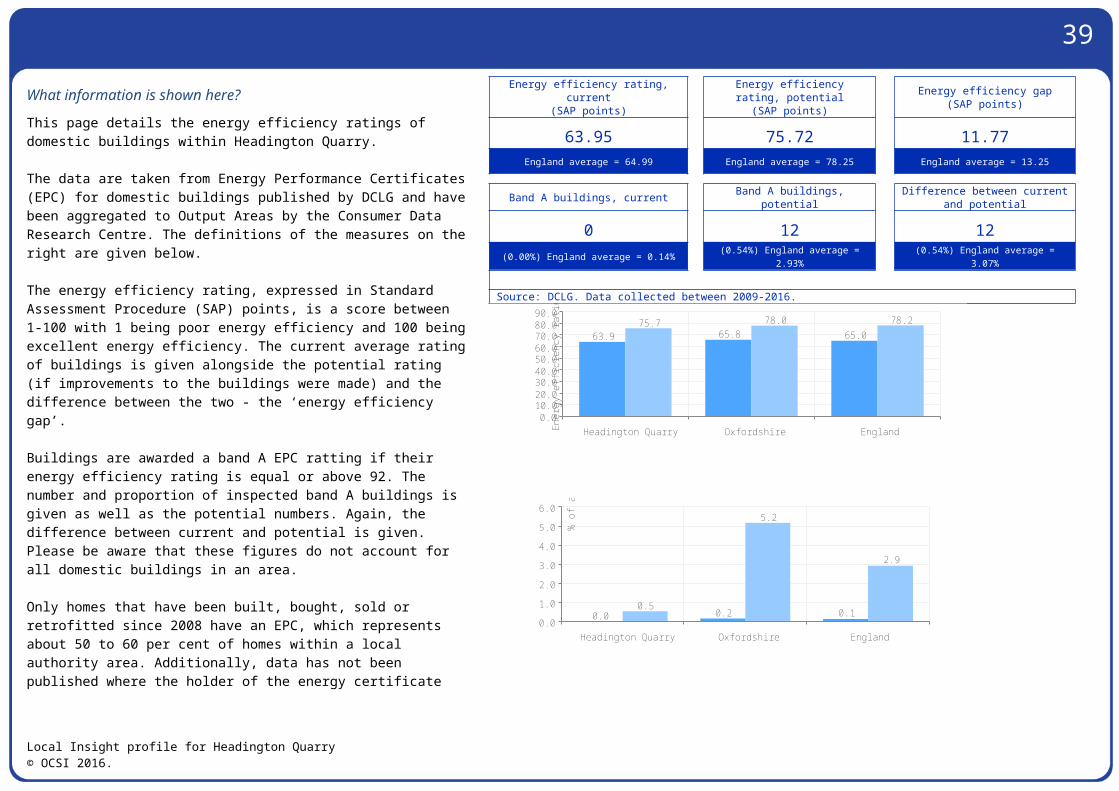
This page details the energy efficiency ratings of domestic buildings within Headington Quarry.
The data are taken from Energy Performance Certificates (EPC) for domestic buildings published by DCLG and have been aggregated to Output Areas by the Consumer Data Research Centre. The definitions of the measures on the right are given below.
The energy efficiency rating, expressed in Standard Assessment Procedure (SAP) points, is a score between 1-100 with 1 being poor energy efficiency and 100 being excellent energy efficiency. The current average rating of buildings is given alongside the potential rating (if improvements to the buildings were made) and the difference between the two - the ‘energy efficiency gap’.
Buildings are awarded a band A EPC ratting if their energy efficiency rating is equal or above 92. The number and proportion of inspected band A buildings is given as well as the potential numbers. Again, the difference between current and potential is given. Please be aware that these figures do not account for all domestic buildings in an area.
Only homes that have been built, bought, sold or retrofitted since 2008 have an EPC, which represents about 50 to 60 per cent of homes within a local authority area. Additionally, data has not been published where the holder of the energy certificate has opted-out of disclosure, energy certificates are excluded on grounds of national security or energy certificates are marked as “cancelled” or “not for issue”.
Energy efficiency rating, current(SAP points)
Energy efficiency rating, potential
(SAP points)Energy efficiency gap
(SAP points)
63.95 75.72 11.77England average = 64.99 England average = 78.25 England average = 13.25
Band A buildings, current Band A buildings, potential Difference between current and potential
0 12 12(0.00%) England average = 0.14% (0.54%) England average =
2.93% (0.54%) England average = 3.07%
Source: DCLG. Data collected between 2009-2016.
Local Insight profile for Headington Quarry© OCSI 2016.
63.9 65.8 65.075.7 78.0 78.2
Headington Quarry Oxfordshire England0.0
10.020.030.040.050.060.070.080.090.0
Ener
gy e
ffici
ency
rat
ing
(Sta
ndar
d A
sses
smen
t Pr
oced
ure
units
)
Current energy efficiency Potential energy efficiency
0.0 0.2 0.10.5
5.2
2.9
Headington Quarry Oxfordshire England0.0
1.0
2.0
3.0
4.0
5.0
6.0
% o
f ass
esse
d pr
oper
ties
Current band A rating Potential band A rating
36
Local Insight profile for Headington Quarry© OCSI 2016.
Housing: Energy efficiency of domestic buildings
37
What information is shown here?
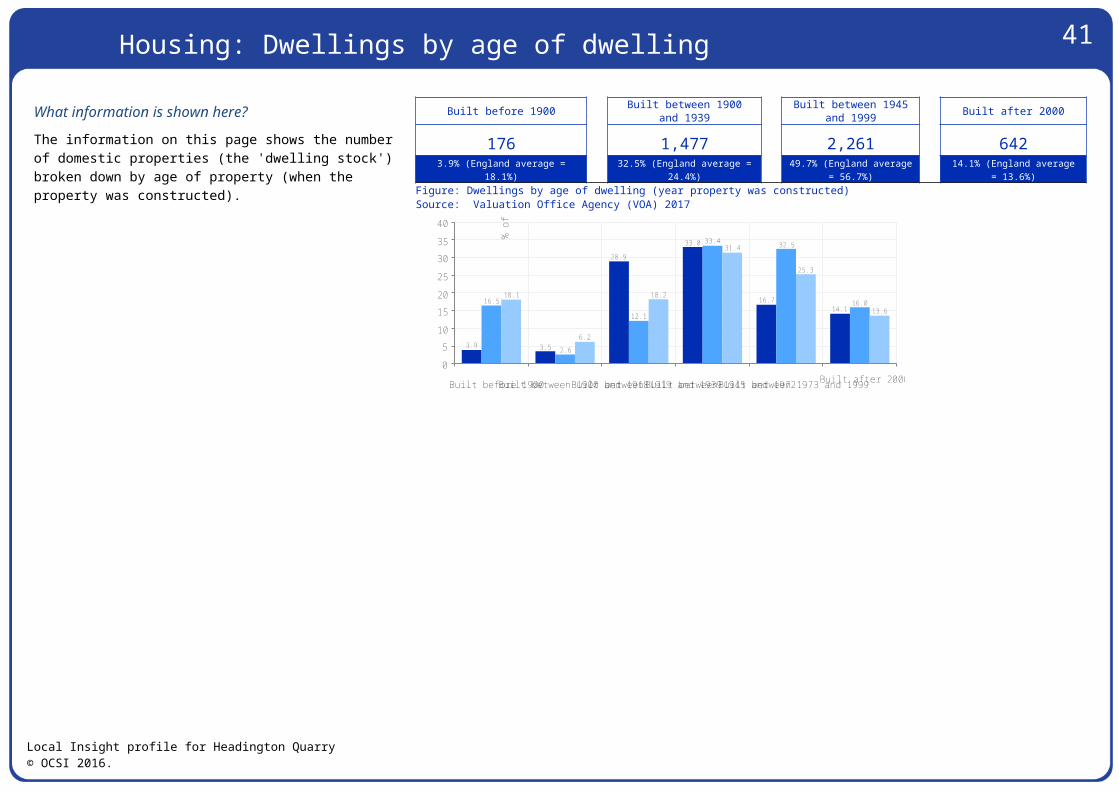
The information on this page shows the number of domestic properties (the 'dwelling stock') broken down by age of property (when the property was constructed).
Built before 1900 Built between 1900 and 1939
Built between 1945 and 1999 Built after 2000
176 1,477 2,261 6423.9% (England average = 18.1%) 32.5% (England average =
24.4%)49.7% (England average
= 56.7%)14.1% (England average =
13.6%)Figure: Dwellings by age of dwelling (year property was constructed)Source: Valuation Office Agency (VOA) 2017
Local Insight profile for Headington Quarry© OCSI 2016.
3.9 3.5
28.9
33.0
16.714.1
16.5
2.6
12.1
33.4 32.5
16.018.1
6.2
18.2
31.4
25.3
13.6
Built before 1900Built between 1900 and 1918Built between 1919 and 1939Built between 1945 and 1972Built between 1973 and 1999Built after 20000
5
10
15
20
25
30
35
40
% o
f hou
seho
lds
Headington Quarry Oxfordshire England
Housing: Dwellings by age of dwelling
38
What information is shown here?
The information on this page shows the number of people living in communal establishments, with breakdowns by the main types.A communal establishment is defined as an establishment providing managed (full-time or part-time supervised) residential accommodation.The information boxes on the right show the number and proportion of people in communal establishments by main type of establishment. Medical and care establishments include psychiatric hospital / homes, other hospital homes children's homes, residential care homes, nursing homes managed by the NHS, Local Authority or private organisation; Educational establishments include primarily University halls of residence; Defence establishments include barracks, air bases and naval ships; Other establishments include prison service establishments, bail hostels, hotels, boarding houses or guest houses, hostels and civilian ships.The chart on the top right provides the same information with associated comparator areas.
All in communal establishments
Medical and care
establishmentsEducation
establishmentsDefence
establishmentsOther
establishments
110 88 00 00 031.1% (England
average = 1.8%)0.8% (England
average = 0.7%)0.0% (England
average = 0.7%)0.0% (England
average = 0.1%)0.0% (England
average = 0.1%)Source: Census 2011
Figure: Communal establishments by typeSource: Census 2011
Local Insight profile for Headington Quarry© OCSI 2016.
0.1
0.8
0.0 0.0 0.00.2
0.0
0.0
0.6 0.50.2
3.1
0.1 0.10.1
0.7
0.1 0.1
0.7
0.1 0.1
NHS/LA Medical establishmentsPrivate medical establishmentsDefence establishmentsPrison/probation service establishmentsEducational establishmentsHotels/Hostels and other temporary accommodation
Other establishments
0.00
0.50
1.00
1.50
2.00
2.50
3.00
3.50
%
Headington Quarry Oxfordshire England
Housing: Communal establishment residents
39
What information is shown here?
The information on this page and the following shows the level of recorded crime in Headington Quarry and comparator areas. This is based on data for individual crime incidents published via the www.police.uk open data portal, which has been linked by Local Insight to selected neighbourhoods. Further information on how these crimes and incidents have been categorised, as well as which crimes and incidents have been mapped and why, is available at: www.police.uk/about-this-site/faqs/#why-are-some-crimes-not-displayed-on-the-mapThe information boxes show counts and rates for the main crime types and anti-social behaviour incidents. The overall crime rate is presented for monthly, quarterly and annual snapshots, with the underlying crime types shown as annual totals.The line charts to the right and on the following page track monthly change in recorded crime across five key offences (violent crime, anti-social behaviour, burglaries, criminal damage and vehicle crime) across Headington Quarry and comparator areas for the last 12 months of data.
All crimesSep 2017 monthly total
All crimesJul17-Sep17
All crimesOct16-Sep17
57 168 61106 per 1,000 population(England average = 10)
17 per 1,000 population(England average = 31)
63.7 per 1,000 population(England average = 117.1)
Violent crimesOct16-Sep17
Criminal damage incidentsOct16-Sep17
Anti-social behaviour incidents
Oct16-Sep17
148 68 9113.6 per 1,000 population(England average = 23.3)
6.0 per 1,000 population(England average = 9.7)
8.4 per 1,000 population(England average = 28.9)
BurglariesOct16-Sep17
RobberiesOct16-Sep17
Vehicle crimesOct16-Sep17
58 02 6513.2 per 1,000 households(England average = 17.7)
0.2 per 1,000 population(England average = 1.2)
6.0 per 1,000 population(England average = 7.6)
Source: Recorded crime offences – www.police.uk (2017)Figure: Violent crime offencesSource: www.police.co.uk (2017)
Local Insight profile for Headington Quarry© OCSI 2016.
Dec-1
0Mar
-11
Jun-1
1Se
p-11Dec
-11
Mar-1
2Jun
-12
Sep-
12Dec-1
2Mar
-13
Jun-1
3Se
p-13Dec
-13
Mar-1
4Jun
-14
Sep-
14Dec-1
4Mar
-15
Jun-1
5Se
p-15Dec
-15
Mar-1
6Jun
-16
Sep-
16Dec-1
6Mar
-17
Jun-1
7Se
p-17
0.0
0.5
1.0
1.5
2.0
2.5
rate
per
1,0
00 p
opul
atio
n
Headington Quarry Oxfordshire England
Crime and safety: Recorded crime (1) (b)
40
Figure: Anti-social behaviour offencesSource: www.police.co.uk (2017)
Figure: Burglary offencesSource: www.police.co.uk (2017)
Figure: Criminal damage offencesSource: www.police.co.uk (2017)
Figure: Vehicle crime offencesSource: www.police.co.uk (2017)
Local Insight profile for Headington Quarry© OCSI 2016.
Dec-1
0Mar
-11
Jun-1
1Se
p-11Dec
-11
Mar-1
2Jun
-12
Sep-
12Dec-1
2Mar
-13
Jun-1
3Se
p-13Dec
-13
Mar-1
4Jun
-14
Sep-
14Dec-1
4Mar
-15
Jun-1
5Se
p-15Dec
-15
Mar-1
6Jun
-16
Sep-
16Dec-1
6Mar
-17
Jun-1
7Se
p-17
0.0
1.0
2.0
3.0
4.0
5.0
6.0ra
te p
er 1
,000
pop
ulat
ion
Headington Quarry Oxfordshire England
Dec-1
0Mar
-11
Jun-1
1Se
p-11Dec
-11
Mar-1
2Jun
-12
Sep-
12Dec-1
2Mar
-13
Jun-1
3Se
p-13Dec
-13
Mar-1
4Jun
-14
Sep-
14Dec-1
4Mar
-15
Jun-1
5Se
p-15Dec
-15
Mar-1
6Jun
-16
Sep-
16Dec-1
6Mar
-17
Jun-1
7Se
p-17
0.00.51.01.52.02.53.03.54.04.55.0
rate
per
1,0
00 h
ouse
hold
s
Headington Quarry Oxfordshire England
Sep-
11Dec-1
1Mar
-12
Jun-1
2Se
p-12Dec
-12
Mar-1
3Jun
-13
Sep-
13Dec-1
3Mar
-14Jun-1
4Se
p-14Dec
-14
Mar-1
5Jun-1
5Se
p-15Dec
-15
Mar-1
6Jun-1
6Se
p-16Dec
-16
Mar-1
7Jun-1
7Se
p-17
0.0
0.5
1.0
1.5
2.0
2.5
3.0
rate
per
1,0
00 p
opul
atio
n
Headington Quarry Oxfordshire England
Dec-1
0Mar
-11
Jun-1
1Se
p-11Dec
-11
Mar-1
2Jun
-12
Sep-
12Dec-1
2Mar
-13
Jun-1
3Se
p-13Dec
-13
Mar-1
4Jun
-14
Sep-
14Dec-1
4Mar
-15
Jun-1
5Se
p-15Dec
-15
Mar-1
6Jun
-16
Sep-
16Dec-1
6Mar
-17
Jun-1
7Se
p-17
0.00.20.40.60.81.01.21.41.61.82.0
rate
per
1,0
00 p
opul
atio
n
Headington Quarry Oxfordshire England
Crime and safety: Recorded crime (2) (b)
41
What information is shown here?
The information in this section explores variations in life expectancy and premature mortality. Life expectancy is a measure of the age a person born today can expect to live until, if they experience current mortality rates throughout their life. The chart on the right shows life expectancy at birth for females and males in Headington Quarry and comparator areas.The first chart on the following page shows the standardised mortality ratio for all causes and all ages for Headington Quarry. This indicator highlights the ratio of observed to expected deaths (given the age profile of the population). A mortality ratio of 100 indicates an area has a mortality rate consistent with the age profile of the area, less than 100 indicates that the mortality rate is lower than expected and higher than 100 indicates that the mortality rate is higher than expected.The second chart on the following page show incidence of cancer (with breakdowns for the most common forms of cancer). The data is presented as an incidence ratio (ratio of observed incidence vs expected incidence given the age profile of the population).
Figure: Life expectancySource: Office for National Statistics (2011-2015)
Figure: Healthy Life ExpectancySource: Office for National Statistics (2009-2013)
Figure: Disability-free Life ExpectancySource: Office for National Statistics (2009-2013)
Local Insight profile for Headington Quarry© OCSI 2016.
79 8281 8479
83
Males Females0
10
20
30
40
50
60
70
80
90 Age
in
year
s
Headington Quarry Oxfordshire England
65 6863.566 69
64.8
Headington Quarry Oxfordshire England0
10
20
30
40
50
60
70
80 Age
in y
ears
Male Female
66 686466 69 65
Headington Quarry Oxfordshire England0
10
20
30
40
50
60
70
80 Age
in y
ears
Male Female
Health and wellbeing: Life expectancy and mortality
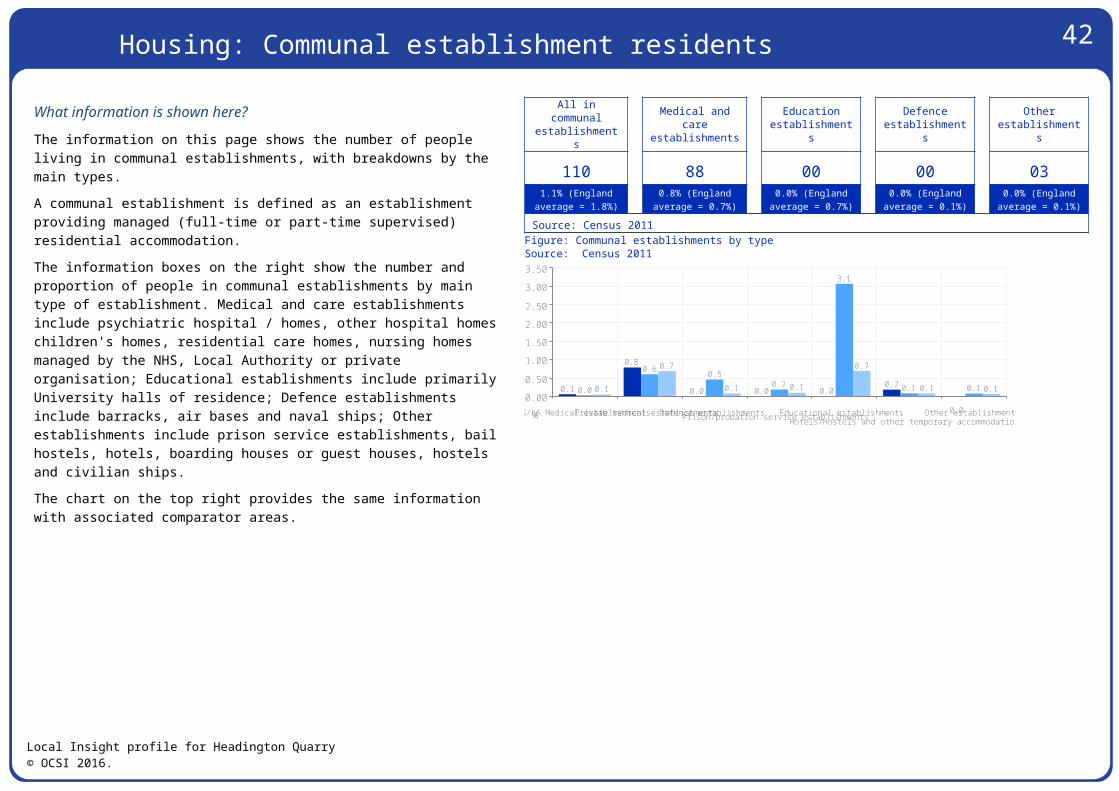
42
Local Insight profile for Headington Quarry© OCSI 2016.

43
Figure: Incidence of cancer: Standardised incidence ratio (select causes)Source: Office for National Statistics (2011/12-2014/15)
Figure: Standardised mortality ratio (select causes)Source: Office for National Statistics (2011/12-2014/15)
Local Insight profile for Headington Quarry© OCSI 2016.
93 97 100
8579
98108
100
80
111100 100 100 100 100
All cancers Berast cancer Colorectal cancer Lung cancer Prostate cancer0
20
40
60
80
100
120
Ratio
Headington Quarry Oxfordshire England
If an area is above 100, there is a higher incidence of cancer than had been expected. If it is below 100, there is a lower incidence of cancer than expected.
106119
83 90
1119791 93
81 86 8695100 100 100 100 100 100
All causes Cancer Coronary Heart DiseaseCirculatory DiseaseRespiratory Disease Stroke0
20
40
60
80
100
120
140
Ratio
Headington Quarry Oxfordshire England
If an area is above 100, there is a higher proportion of deaths than had been expected. If it is below 100, there is a lower proportion of deaths than expected.
Health and wellbeing: Life expectancy and mortality (2)
44
What information is shown here?
The information in this section looks at general levels of health, focusing on the number of people living in neighbourhoods with poor levels of overall health (health deprivation hotspots) and the number of people with a limiting long-term illness.Limiting long-term illness is defined as any long-term illness, health problem or disability which limits someone's daily activities or the work they can do. Health deprivation ‘hotspots’ are neighbourhoods ranked among the most deprived 20% of neighbourhoods in England on the Indices of Deprivation 2015 Health domain. The domain measures morbidity, disability and premature mortality. All neighbourhoods in England are grouped into ten equal sized groups “deciles”; the 10% of neighbourhoods with the highest level of health deprivation are grouped in decile 10, and so on with the 10% of neighbourhoods with the lowest levels of health deprivation grouped in decile 1.The chart on the right shows the number of people in Headington Quarry living in each health decile. The charts below shows the proportion of residents in Headington Quarry with a limiting long-term illness by age.
Number of people living in health
deprivation ‘hotspots’ (Indices
of Deprivation 2015)
People with a limiting long-term
illness (Census 2011)
People aged 16-64 with a limiting long-term illness (Census 2011)
Babies born with a low birth
weight (ONS 2007-2011)
2,917 1,550 675 55 27.8% (England
average = 19.8%)14.8% (England=
17.6%)9.7% (England=
12.7%)6.5% (England=
7.4%)Figure: Number of people in each deprivation decile, Health domainSource: Indices of Deprivation 2015
Figure: People with a limiting long-term illnessSource: Census 2011
Local Insight profile for Headington Quarry© OCSI 2016.
0
1,474
2,414
0
1,584 1,466
632
0
2,917
0
Least deprived 10%Decile 2 Decile 3 Decile 4 Decile 5 Decile 6 Decile 7 Decile 8 Decile 9
Most deprived 10%
0
500
1,000
1,500
2,000
2,500
3,000
3,500
Num
ber
of p
eopl
e
HigherhealthdeprivationLower health deprivation
Health and wellbeing: General health and limiting long-term illness
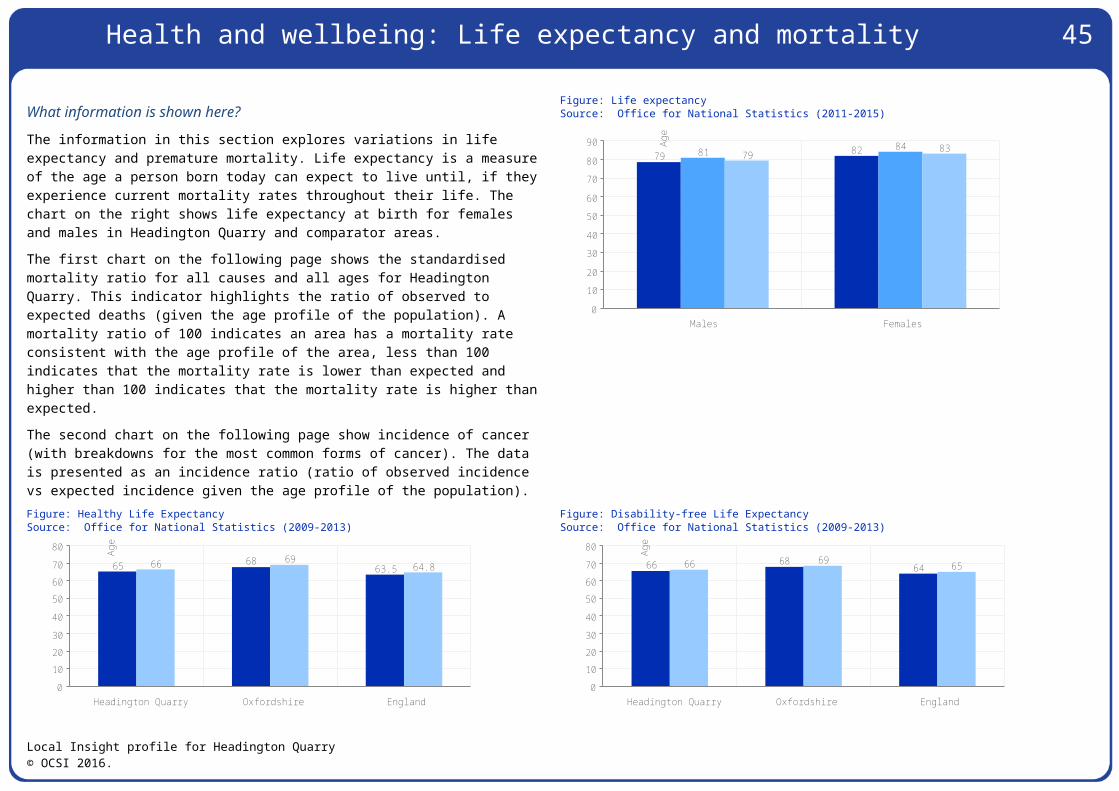
45
Local Insight profile for Headington Quarry© OCSI 2016.
14.8
2.6
9.7
13.7
2.8
8.9
17.6
3.7
12.7
All people with limiting long-term illness (LTTI)
LTTI aged 0-15
LTTI aged 16-64
20151050%
Headington Quarry Oxfordshire England

46
What information is shown here?
The information in this section looks at admissions to hospital by main health condition. The chart on the top right shows emergency admissions to hospital across Headington Quarry and comparators. The chart on the bottom right shows elective in-patient hospital admissions (admissions that have been arranged in advance).The data are presented as standardised ratios; a ratio of 100 indicates an area has an admission rate consistent with the national average, less than 100 indicates that the admission rate is lower than expected and higher than 100 indicates that the admission rate is higher than expected.
Figure: Emergency hospital admissions: Standardised ratio (select causes)Source: Hospital Episode Statistics, Information Centre for Health and Social Care, Office for National Statistics (2011/12-2014/15)
Figure: Elective hospital admissions: Standardised ratio (select causes)Source: Hospital Episode Statistics, Information Centre for Health and Social Care, Office for National Statistics (2011/12-2014/15)
Local Insight profile for Headington Quarry© OCSI 2016.
9983
94
134
92 928778
67
10283 85
100 100 100 100 100 100
All causes Coronary heart diseaseChronic-obstructive pulmonary disease
Hip fracture Myocardial infarction Stroke0
20406080
100120140160
Ratio
Headington Quarry Oxfordshire England
If an area is above 100, there is a higher proportion of admissions than had been expected. If it is below 100, there is a lower proportion of admissions than expected.
89
72
102
62
87
69
114
60
100 100 100 100
All causes Coronary heart diseaseHip-replacement Knee-replacement0
20
40
60
80
100
120
Ratio
Headington Quarry Oxfordshire England
If an area is above 100, there is a higher proportion of admissions than had been expected. If it is below 100, there is a lower proportion of admissions than expected.
Health and wellbeing: Hospital admissions
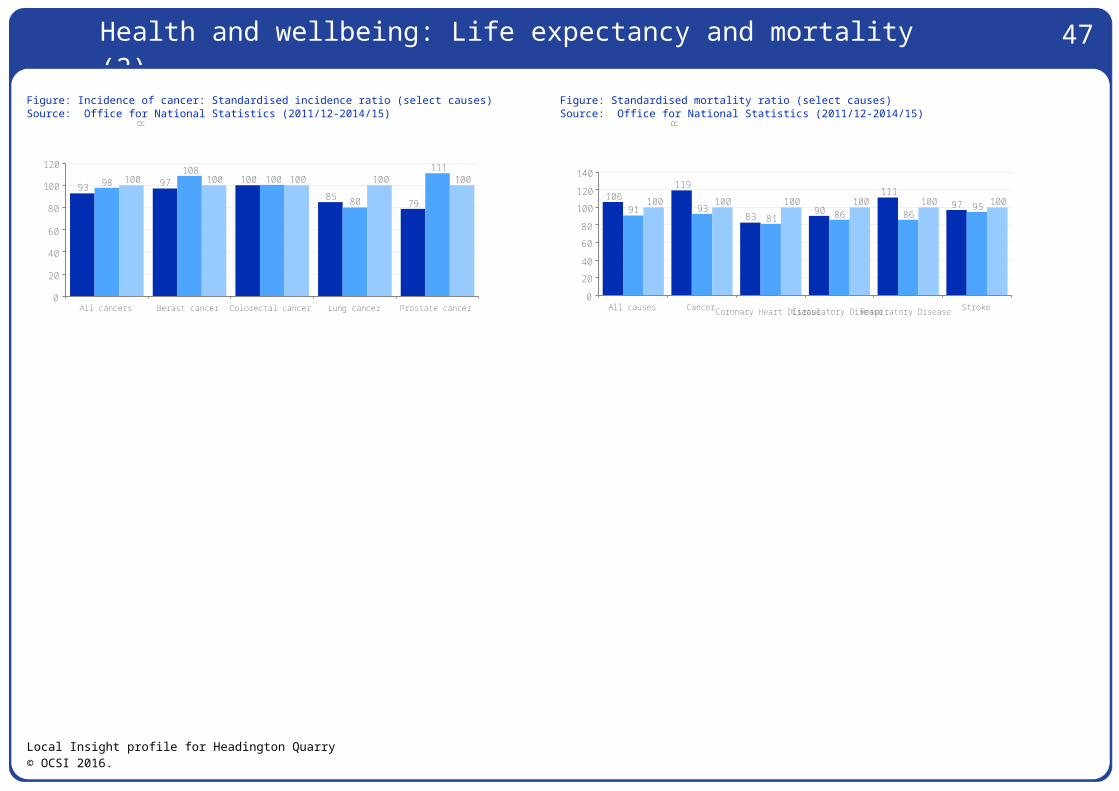
47
What information is shown here?
Arthritis UK have partnered with Imperial College London to produce modelled estimates of the prevalence of musculoskeletal conditions for MSOAs in England. The estimates were calculated by identifying risk factors, sourcing suitable data sources and using statistical techniques to produce synthetic estimates of the numbers of people with hip osteoarthritis, knee osteoarthritis and back pain.We have defined percentages consistently with Arthritis UK’s methodology. Knee and hip osteoarthritis figures are expressed as a percentage of the population aged 45 and over. Back pain figures are express as a fraction of the total population.
People are deemed to have severe pain if they have pain most of the time or they are unable to walk a quarter of a mile unaided or they have previously undergone hip or knee replacement due to arthritis.For more information visit https://www.arthritisresearchuk.org/arthritis-information/data-and-statistics/musculoskeletal-calculator.aspx© Arthritis Research UK
Figure: Prevalence of hip and knee arthritis in people aged 45 and overSource: Arthritis UK (2011)
Figure: Prevalence of back pain in people of all agesSource: Arthritis UK (2011)
Local Insight profile for Headington Quarry© OCSI 2016.
9.9
16.2
2.7
5.1
10.5
17.1
2.9
5.5
10.9
18.2
3.2
6.1
Hip Knee Hip severe Knee severe0.0
2.04.0
6.08.0
10.012.0
14.016.0
18.020.0
% o
f peo
ple
ages
45
and
over
Headington Quarry Oxfordshire England
14.7
8.5
16.8
10.2
16.9
10.3
Back Back severe0.02.0
4.06.0
8.0
10.0
12.014.0
16.018.0
% o
f peo
ple
all a
ges
Headington Quarry Oxfordshire England
Health and wellbeing: Musculoskeletal conditions
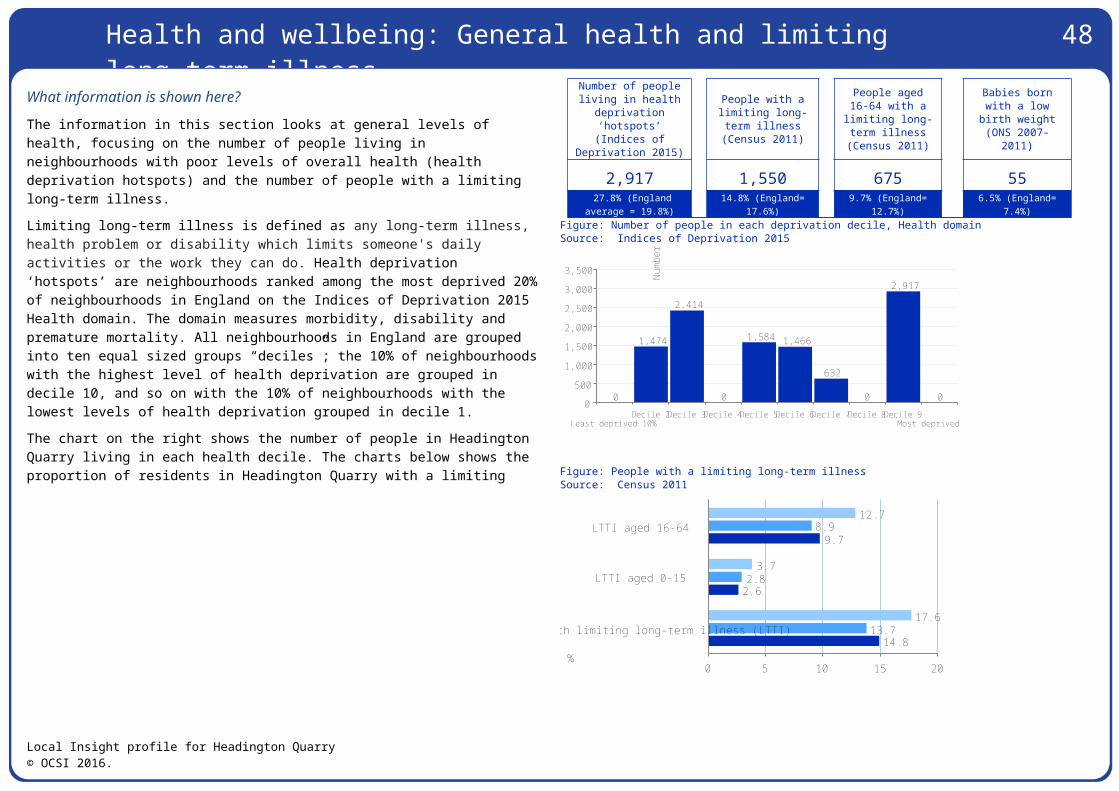
48
What information is shown here?
The information on this page looks at lifestyle behaviours of people living in Headington Quarry. Lifestyle behaviours are risk factors which play a major part in an individual’s health outcomes and will have varying physical and psychological consequences.The chart on the top right shows the healthy eating levels (consumption of five or more portions of fruit and vegetables a day among adults) in Headington Quarry. It also shows smoking prevalence and levels of binge drinking in these areas. Binge drinking is defined as the consumption of at least twice the daily recommended amount of alcohol in a single drinking session (8 or more units for men and 6 or more units for women).The chart on the bottom right shows the percentage of people children (in reception year and year 6) and adults classified as obese in Headington Quarry. People are considered obese when their body mass index (BMI) a measurement obtained by dividing a person's weight by the square of the person's height, exceeds 30 kg/m2.Data for adult health are modelled estimates created from Health Survey for England 2006-2008. This is due to a lack of alternative small-area data for these indicators.
Figure: “Healthy eating” (consumptions of 5+ fruit and veg a day), binge drinking and smokingSource: Health Survey for England 2006-2008
Figure: Children and adults classified as obeseSource: National Child Measurement Programme (NCMP) (2013-2015), Health Survey for England 2006-2008
Local Insight profile for Headington Quarry© OCSI 2016.
31.2
24.4
19.7
30.2
20.418.7
28.7
20.022.2
Healthy eating Binge drinking Smoking0
5
10
15
20
25
30
35
% o
f tot
al p
opul
atio
n
Headington Quarry Oxfordshire England
7.9
17.8 17.5
7.1
16.4
20.7
9.4
19.4
24.1
Children (reception year) Children (year 6) Adults0
5
10
15
20
25
30
% o
f tot
al p
opul
atio
nHeadington Quarry Oxfordshire England
Health and wellbeing: Healthy lifestyles
49
What information is shown here?
This chart shows estimates of the levels of physical activity among adults. The data have been produced by Sport England using a Small Area Estimation technique - modelling down from a National Survey (the Active Lives Survey (November 2015-2016)) to Middle Layer Super Output Area (MSOA) based on the local demographic characteristics of the local population. For more information on the modelling method see https://www.sportengland.org/media/12667/16-092901-01_sae_techreport_final.pdfThe categories of physical activity follow the guidelines set by the Chief Medical Officer and are defined below:Physically active: undertaking at least 150 minutes per week in the past month excluding gardeningPhysically inactive: undertaking less than 30 minutes in the past month excluding gardeningPhysical activity at least twice a month: undertaking physical activity on at least two occasions in the past month
Figure: Physical activity among adultsSource: Sport England (Active Lives Survey) 2015/16
Local Insight profile for Headington Quarry© OCSI 2016.
0.7
0.2
0.9
0.7
0.2
0.8
0.6
0.2
0.8
Physically active Physically inactive Physically active 2 times a month
0
0
0
0
0
1
1
1
1
1
% o
f adu
lt po
pula
tion
Headington Quarry Oxfordshire England
Health and wellbeing: Healthy lifestyles 2
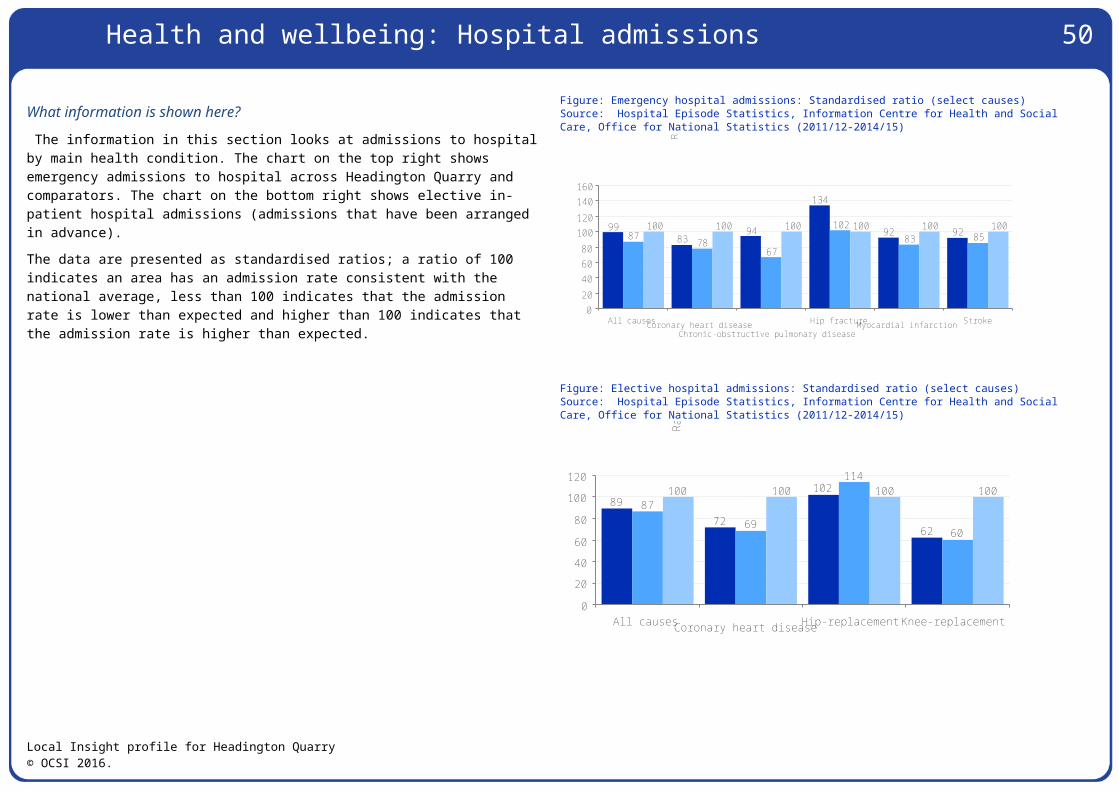
50
What information is shown here?
The information boxes and chart on the right show the education levels of residents in Headington Quarry, showing the number and proportion of adults (aged 16+) by highest level of qualification.Note, figures in the table and charts may not add up to 100% because they do not include figures for those for who with other qualifications or unknown qualifications.
People with no qualifications
People with highest
qualification level 1
People with highest
qualification level 2
People with highest
qualification level 3
1,440 910 800 90016.9% of working
age people(England= 22.5%)
10.7% of workingage people
(England= 13.3%)
9.4% of working agepeople (England=
15.2%)
10.6% of working agepeople (England=
12.4%)
People with highest
qualification level 4+ (degree)
‘Level 1’ qualifications are equivalent to a single O-level, GCSE or NVQ. ‘Level 2’ qualifications are equivalent to five O-levels or GCSEs. ‘Level 3’ qualifications are equivalent to two A levels. ‘Level 4’ qualifications are equivalent to degree level or higher.3,630
42.6% of working agepeople (England=
27.4%)Source: Census 2011
Figure: People with no qualifications and degree level qualificationsSource: Census 2011
Local Insight profile for Headington Quarry© OCSI 2016.
16.9
42.6
16.7
35.7
22.527.4
People with no qualifications People with Level 4+ (degree) qualifications05
10
15202530
354045 %
age
d 16
-74
Headington Quarry Oxfordshire England
Education and skills: Qualifications

51
What information is shown here?
The information on this page shows the outcomes of children in the Early Years Foundation Stage (EYFS), a series of tests measuring children's progress in terms of Personal, Social and Emotional Development (PSED) and Communication, Language and Literacy (CLL). These are typically 5 year old pupils; however a minority of slightly older and younger pupils may have been assessed.The new Early Years Foundation Stage Profile requires practitioners to make a best fit assessment of whether children are emerging, expected or exceeding against each of the new 17 Early Learning Goals (ELGs). Children have been deemed to have reached a Good Level of Development (GLD) in the new profile if they achieve at least the expected level in the ELGs in the prime areas of learning (personal, social and emotional development; physical development; and communication and language) and in the specific areas of mathematics and literacy. These are 12 of the 17 ELGs. The Department for Education has also introduced a supporting measure which measures the total number of points achieved across all 17 ELGs and reports the average of every child’s total point score.The chart on the right shows the percentage of pupils achieving 17 ELGs, the average point score at Early Years Foundation stage and the percentage of pupils achieving a good level of development.
Figure: Early years foundation stage profileSource: Department for Education (2013-2014)
Local Insight profile for Headington Quarry© OCSI 2016.
53.358.5 58.0
32.8 33.7 33.8
55.260.4 60.0
Headington Quarry Oxfordshire England0
10
20
30
40
50
60
70
% o
f all
pupi
ls in
yea
r 1
Pupils achieving at least the expected level in all 17 Early Learning GoalsPupils average point scorePupils achieving a good level of development
Education and skills: Early years progress
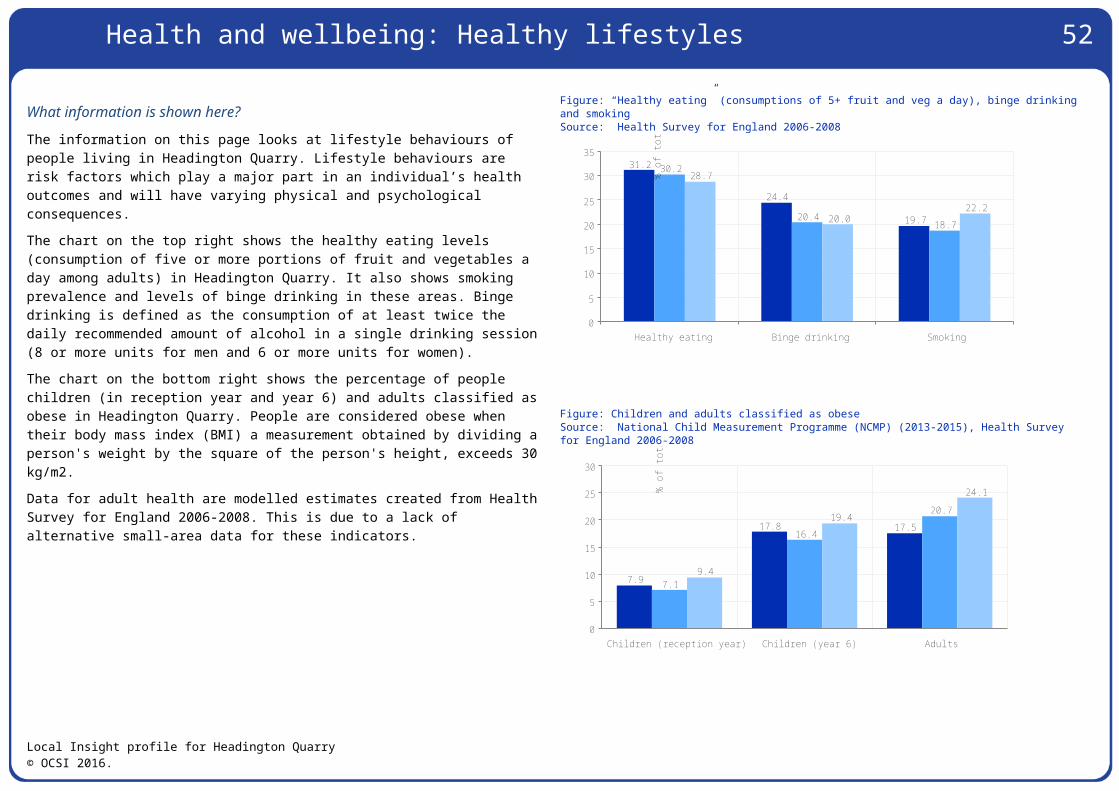
52
What information is shown here?
The chart on the top right show the education levels of pupils in HeadingtonQuarry, showing the examination results at Key Stage 1 (tests set at aged 7) Key Stage 2 (tests set at aged 11) and Key Stage 4 (GCSEs).The figures show the Average Point Score of pupils from each of the Key Stage examinations. This adjusts for high achieving pupils as well as pupils achieving expected levels.The chart on the top right shows Average Point Score (across all examinations) per pupil at Key Stage 1 and Key Stage 2. The chart on the bottom right compares the gap in Average Point Score at Key Stage 4 (GCSE) per pupil between Headington Quarry and the national average over time. The gap is measured as the point difference against the England average. Areas with a score of greater than 1 are performing better than the national average, while areas with a score of less than 1 are performing below.
Figure: Pupil attainment at Key Stage 1 and Key Stage 2Source: Department for Education (2013-2014)
Local Insight profile for Headington Quarry© OCSI 2016.
16.6
29.5
16.1
28.9
15.9
29.0
Key Stage 1 Key Stage 205
101520253035
Aver
age
Poin
t Sc
ore
Headington Quarry Oxfordshire England
KS1 AveragePointScoreperpupilis madeupfromtheReading,Writing,MathematicsandSciencepointscoreswherescoreof 27=level4, 21=level3, 15=level2 (theexpectedlevel),9=level1, 3=belowlevel1. KS2 AveragePointScoreperpupilismadeupfromtheReading,Writing,MathematicsandSciencepointscoreswherescoreof33=level5, 27=level4 (theexpectedlevel),21=level3, 15=level2.
KS1 AveragePointScoreperpupilis madeupfromtheReading,Writing,MathematicsandSciencepointscoreswherescoreof 27=level4, 21=level3, 15=level2 (theexpectedlevel),9=level1, 3=belowlevel1. KS2 AveragePointScoreperpupilismadeupfromtheReading,Writing,MathematicsandSciencepointscoreswherescoreof33=level5, 27=level4 (theexpectedlevel),21=level3, 15=level2.
Education and skills: Pupil attainment

53Figure: Pupil attainment at Key Stage 4Source: Department for Education (2013-2014)
Figure: Gap in pupil attainment at Key Stage 4 (difference from the national average)Source: Department for Education
Local Insight profile for Headington Quarry© OCSI 2016.
353.2 375.9 366.3
Key Stage 40
50100150200250300350400
Aver
age
Poin
t Sc
ore
Headington Quarry Oxfordshire England
KS4Average Point Score is made up of all GCSE examinations sat, with a point score of 58=A*, 52=A, 46=B, 40=C, 34=D,28=E, 22=F, 16=G.
2003
/0420
04/0
52005
/0620
06/0
72007
/0820
08/0
92009
/1020
10/1
12011
/1220
12/1
32013
/14
-80
-70
-60
-50
-40
-30
-20
-10
0
Aver
age
Poin
t Sc
ore
gap
(nat
iona
l ave
rage
= 0
)
Scores above 0 show an improvement on the National average. Average Point Score is made up of all GCSE examinations sat, with a point score of 58=A*, 52=A, 46=B, 40=C, 34=D, 28=E, 22=F, 16=G.
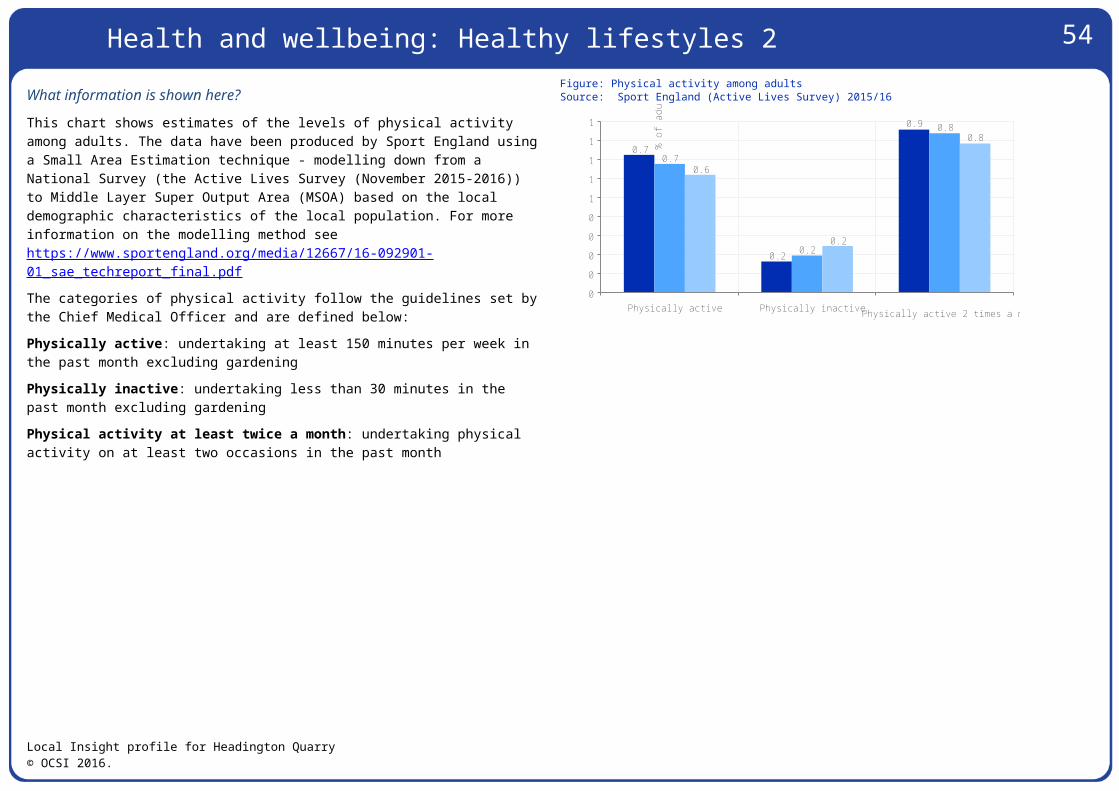
54
What information is shown here?
The information on this page looks at three types of income category: average household income; average household income after housing costs; and households living in fuel poverty. Fuel poverty is said to occur when in order to heat its home to an adequate standard of warmth a household needs to spend more than 10% of its income on total fuel use.The information boxes on the top right provide an estimate of the number of households in Headington Quarry below the poverty line and an estimate for the number of households in fuel poverty.The chart on the right shows the average weekly household income estimate (equivalised to take into account variations in household size) across Headington Quarry and comparator areas (before and after housing costs).
Weekly household income (Office for National Statistics
2013/14)
Weekly household income, after housing costs (Office
for National Statistics 2013/14)
Households living in ‘Fuel Poverty’
Department for Energy and Climate Change
(2015)
£921 £569 0England Average = £766 England Average = £495 0.0% of households
(England = 11.0%)Figure: Weekly household earnings (£)Source: Office for National Statistics (2013/14)
Local Insight profile for Headington Quarry© OCSI 2016.
£921 £968
£766
£569£648
£495
Headington Quarry Oxfordshire England0
200
400
600
800
1,000
1,200
(£)
Total weekly household income estimate Net weekly household income estimate after housing costs
Economy: Income and fuel poverty
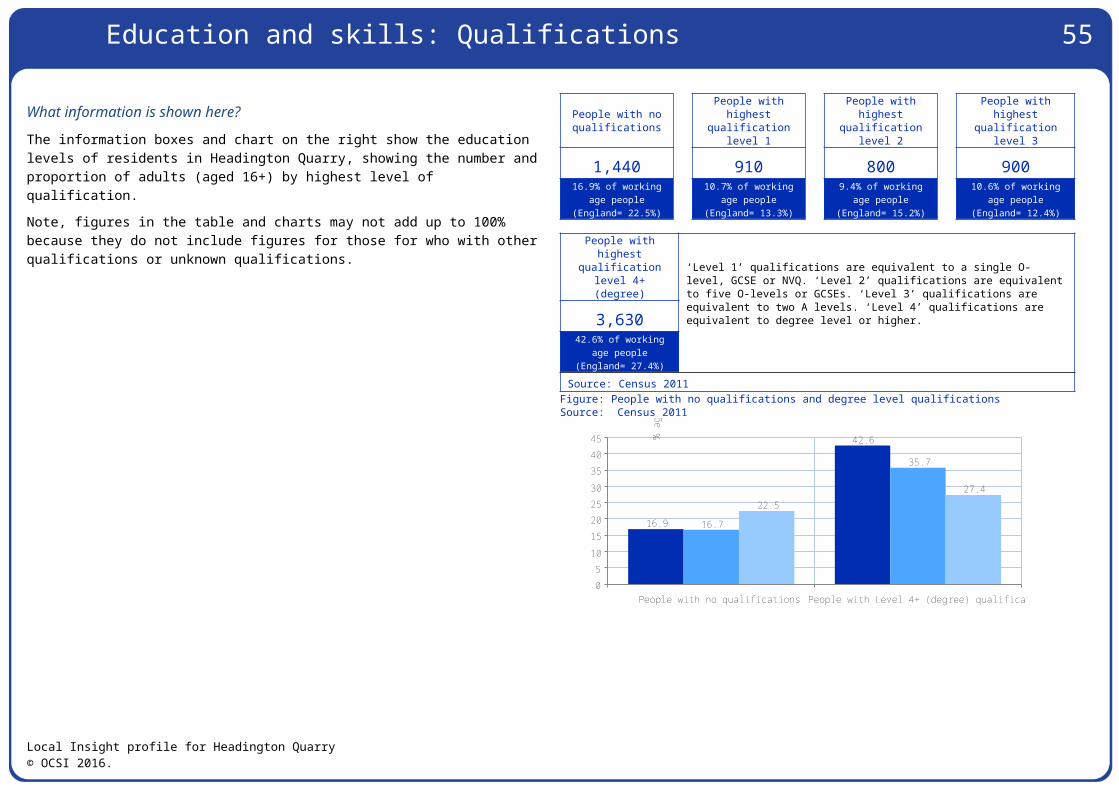
55
What information is shown here?
The levels of private debt, in the form of unsecured loans and mortgage debt, for Headington Quarry are displayed here.These figures, available at postcode sector level, are published by UK Finance and account for around 60% of borrowing in the UK. OCSI have modelled this data to Output Areas using an address based lookup from postcode sector to Output Area in combination with the number of local households and the local population.The personal debt figure is the total amount of borrowing outstanding on customer accounts divided by the population aged 18+. Personal debt includes all unsecured loans such as credit cards, credit for new cars (eg when buying on finance) and other personal loans. Student debt is not included.The mortgage debt figure is the total borrowing outstanding on customer accounts for residential mortgages divided by the total number of households.
Personal debt Residential mortgage debt
£0,608 £41,817England Average =
£0,745England Average = £38,520
Source: UK Finance (March-2017)
Local Insight profile for Headington Quarry© OCSI 2016.
Economy: Debt
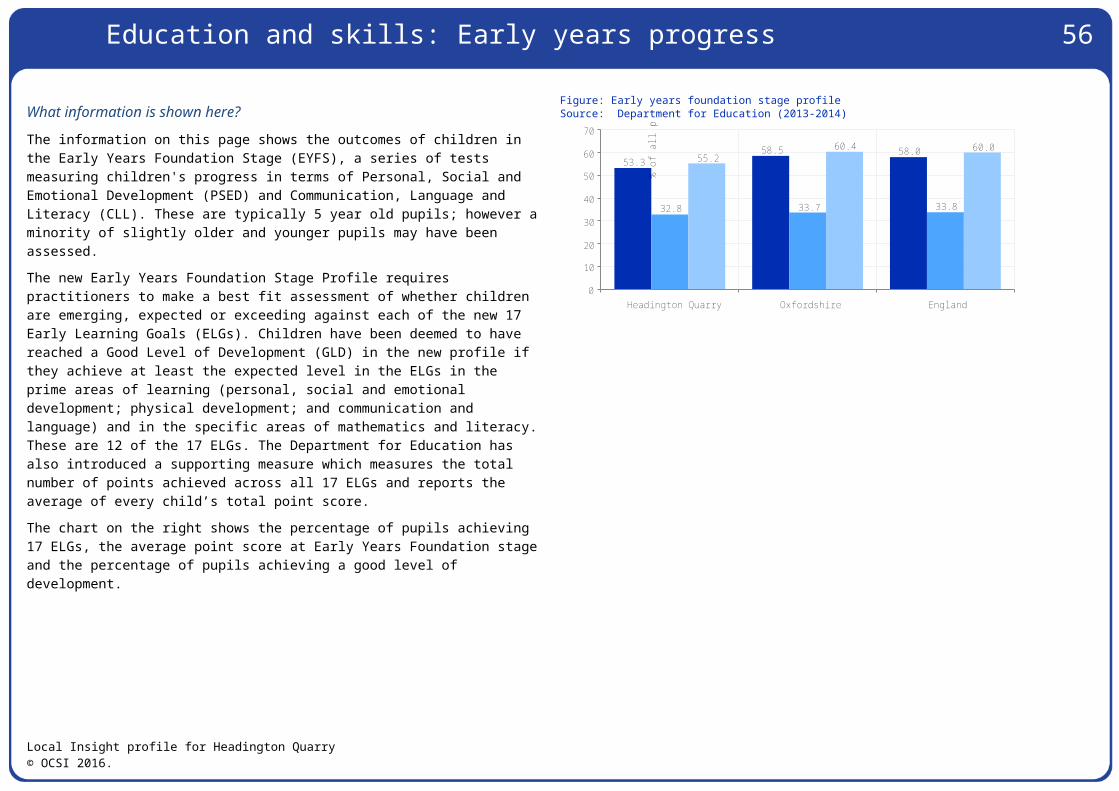
56
What information is shown here?
The information on this page shows economic activity breakdowns for adults aged 16-74 in Headington Quarry.The data in the information boxes shows the number and proportion of residents who are economically active, with breakdowns for those working part time, full time or are self-employed (note, these figures do not add up to all those economically active as it excludes those economically active who are unemployed or full-time students).
Economically active
Full-time employees
Part-time employees
Self-employed people
Economically inactive
5,596 3,428 948 593 2,13572.4% (England
average = 69.9%)44.3% (England
average = 38.6%)
12.3% (Englandaverage =
13.7%)
7.7% (Englandaverage = 9.8%)
27.6% (Englandaverage =
30.1%)Source: Census 2011
Figure: Economic ActivitySource: Census 2011
Local Insight profile for Headington Quarry© OCSI 2016.
72.4
27.6
44.3
12.37.7
72.6
27.4
42.6
13.4 10.5
69.9
30.138.6
13.79.8
Economically activeEconomically inactiveFull-time employeesPart-time employeesSelf-employed people
010
20
304050
60
7080
% o
f peo
ple
in a
ged
16-7
4
Headington Quarry Oxfordshire England
Economy: Economic activity
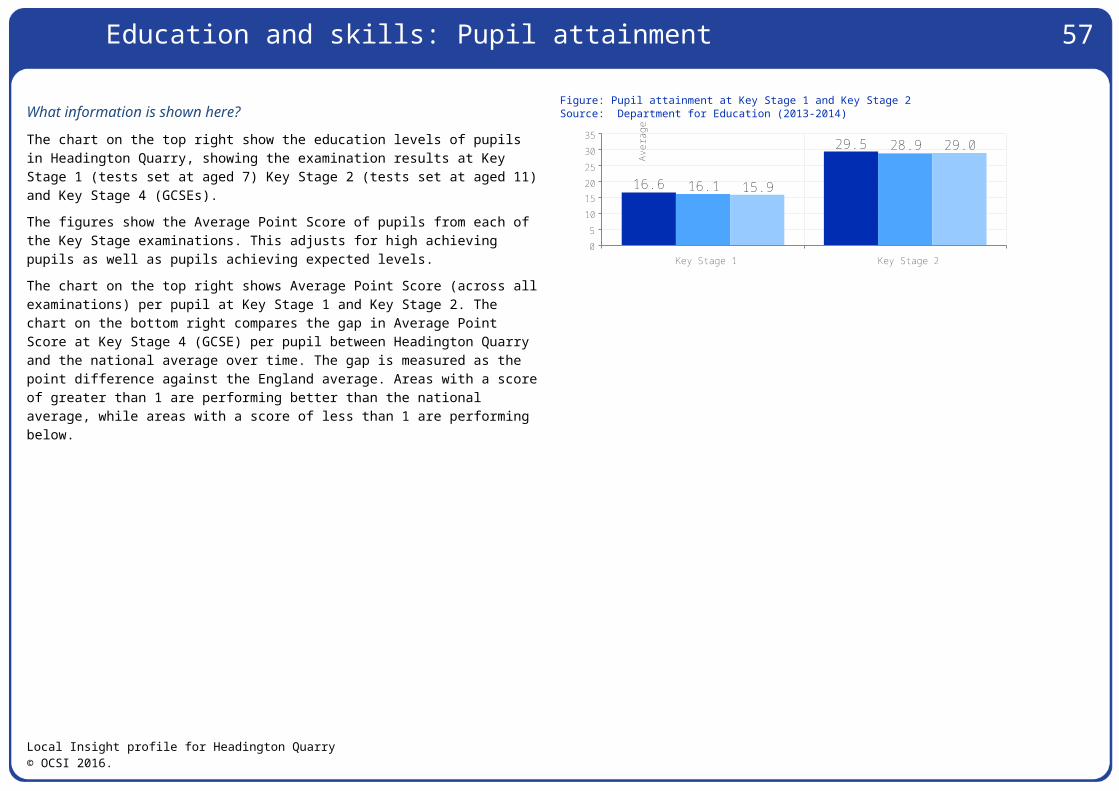
57
What information is shown here?
The information on this page shows breakdowns of the main industry sectors people in Headington Quarry are working in, and their occupational status.The data in the top information boxes shows the three largest employment sectors for residents in the local area, also the number and percentage of employed people working in each of these sectors. The lower information boxes and the chart on the right show the numbers of residents in Headington Quarry by type of occupation (e.g., managers, professional, administrative).
Largest employment sector
Second largest employment sector
Third largest employment sector
Health & socialwork Education Retail
1,240 employees (24% of5,275 of people in
employment)
1,035 employees (20% of 5,275of people in employment)
565 employees (11% of 5,275of people in employment)
Managerial occupations
Professional (or associate) occupations
Administrative or secretarial occupations
Skilled trades
occupationsElementary occupations
460 2,415 490 410 5158.8% of 5,275
people inemployment(England =
10.9%)
45.7% of 5,275people in
employment(England =
30.3%)
9.3% of 5,275people in
employment(England =
11.5%)
7.8% of 5,275people in
employment(England =
11.4%)
9.8% of 5,275people in
employment(England =
11.1%)Source: Census 2011
Figure: People in professional and elementary occupationsSource: Census 2011
Local Insight profile for Headington Quarry© OCSI 2016.
54.4
9.8
48.3
9.7
41.1
11.1
People working in managerial, professional or associate professional occupationsPeople working in elementary occupations0
10
20
30
40
50
60
% o
f peo
ple
in e
mpl
oym
ent
Headington Quarry Oxfordshire England
Economy: Job type
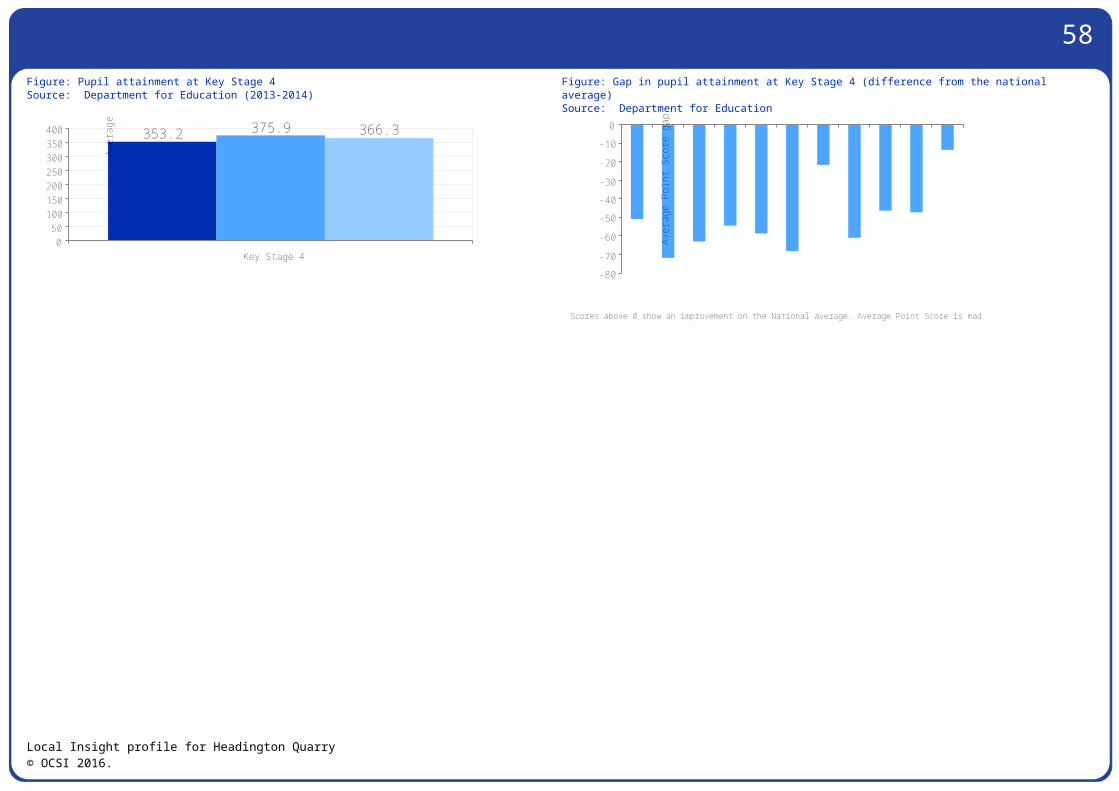
58
What information is shown here?
The information on this page shows the number of vacant jobs in Headington Quarry compared against the overall unemployment levels in the area.The ‘Unemployment to ‘Available Jobs’ ratio, shown in the information box on the right and the line chart below is the total number of people claiming unemployment benefit (Jobseekers Allowance) divided by the total number of job vacancies notified to Jobcentre Plus expressed as a ratio.The bar chart on the bottom right shows month-on-month changes in the number of job vacancies notified to Jobcentre Plus, that are located in the area covering Headington Quarry (based on postcode location of the job). Note this data was last updated by Jobcentre Plus for November 2012.
Unemployment to ‘Available Jobs’ ratio
Source: Job Centre Vacancies - Office for National Statistics/Jobcentre Plus (Nov-12), Jobseekers Allowance claimant count – Department for Work and Pensions (Nov-12)
2.50 claimants perjob
England average = 3.43
Figure: Total number of vacancies notified to Job CentreSource: Office for National Statistics/Job Centre Plus
Figure: Ratio of unemployment (JSA claimants) to jobs (vacancies notified to Jobcentre PlusSource: Office for National Statistics/Job Centre Plus, Department for Work and Pensions
Local Insight profile for Headington Quarry© OCSI 2016.
Jan-1
1Feb-
11Mar-1
1Apr-1
1May
-11Jun
-11Jul
-11Aug
-11
Sep-
11Oct-11Nov
-11Dec
-11Jan
-12Feb-
12Mar-1
2Apr-1
2May
-12Jun
-12Jul
-12Aug
-12
Sep-
12Oct-12Nov
-12
0
2
4
6
8
10
12
14
Une
mpl
oym
ent
to a
vaila
ble
jobs
rat
io
Headington Quarry Oxfordshire England
2529
15
25
58
28 26
44
2225 24
53
2023
37 3531
53
43 43
31
6054
Jan-1
1Feb-
11Mar-1
1Apr-1
1May
-11Jun
-11Jul
-11Aug
-11
Sep-
11Oct-11Nov
-11
Dec-1
1Jan-1
2Feb-
12Mar-1
2Apr-1
2May
-12Jun-1
2Jul-1
2Aug-1
2Se
p-12Oct-
12Nov-1
2
0
10
20
30
40
50
60
70
Vaca
ncie
s no
tified
to
JobC
entr
e Pl
us
Economy: Job opportunities
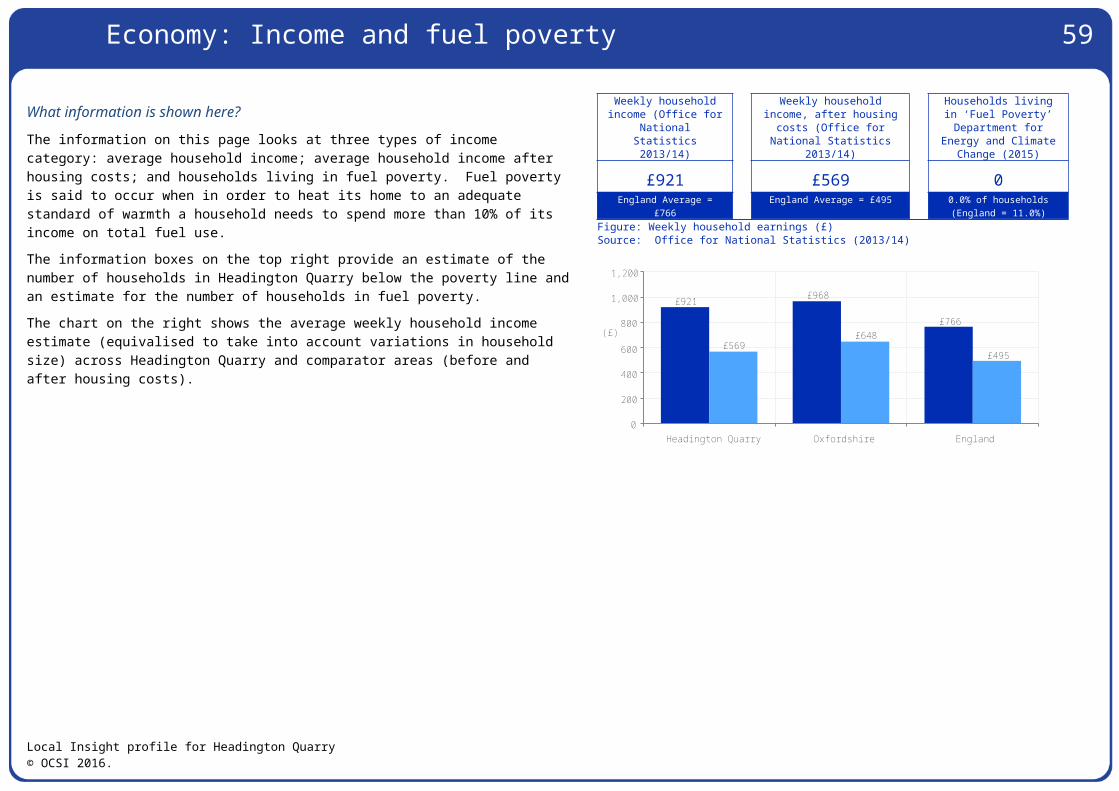
Economy: Local jobs 59
What information is shown here?
The information in this section shows the concentration of workforce jobs in Headington Quarry. Workforce jobs are taken from the Business Register and Employment Survey (BRES) which publishes employee and employment estimates based on a survey of approximately 80,000 businesses and weighted to represent all sectors of the UK economy.The information boxes show the three largest industry groups for workforce jobs based in Headington Quarry. The bar chart on the top right shows the change in ‘Jobs Density’ (the number of jobs as a % of working age population) across Headington Quarry over time. The bar chart on the bottom right shows the share of jobs broken down by public and private sector.
Largest industry sector Second largest industry sector
Third largest industry sector
HealthProfessional,scientific &
technical services
Businessadministration &support services
57.2% of all people inemployment
13.0% of all people inemployment
5.9% of all people inemployment
Source: Business Register and Employment Survey (BRES) (2016)Figure: Change in Jobs Density (jobs as a % of working age population)Source: Business Register and Employment Survey (BRES)
Figure: Jobs by public sector/private sectorSource: Business Register and Employment Survey (BRES)
Local Insight profile for Headington Quarry© OCSI 2016.
77.9
85.9
74.8
Headington Quarry Oxfordshire England6870727476788082848688
Jobs
den
sity
- Jo
bs a
s a
% o
f wor
king
age
pop
ulat
ion
58.140.3
14.1
83.2
16.1
81.3
Public sector Private sector0
204060
80100
% o
f all
busi
ness
es
Headington Quarry Oxfordshire England
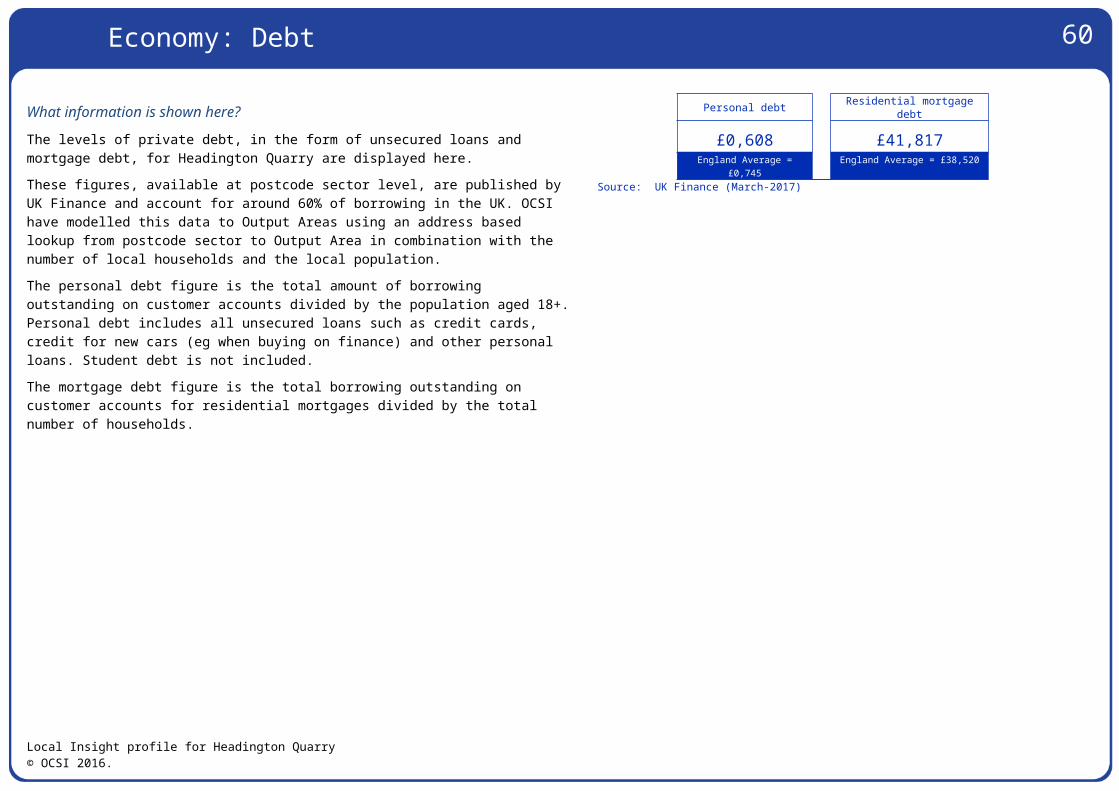
Economy: Local businesses 60
What information is shown here?
The information in this section shows the concentration of ‘local business units’ in Headington Quarry. ‘Local business units’ are counts of businesses based on the location of an operational unit. Though larger businesses such as supermarket chains may have their head office in a large city, these figures measure all subsidiaries of that larger enterprise based on where subsidiaries are located. The figures cover all business eligible for VAT (1.7 million businesses in the UK are registered for VAT). These businesses are categorised into 16 broad industry groups derived from the Standard Industrial Classification (UKSIC (2003)).The information boxes show the three largest industry groups for businesses based in Headington Quarry. The line chart shows the change in the number of businesses per head of the population across Headington Quarry over time. The bar chart shows the count of local business broken down by size of business. Businesses are broken down into four employment size bands based on the number of paid employees (0-4, 5-9, 10-19 and 20+ paid employees).
Largest business sector Second largest business sector
Third largest business sector
Professional,scientific &
technical servicesHealth Retail industry
20.0% of all local businesses 14.3% of all local businesses 10.9% of all local businessesSource: Office for National Statistics (2016)
Figure: Percentage change in number of businesses (VAT based local units) per 10,000 working age populationSource: Office for National Statistics
Figure: Businesses (VAT based local units) by employment size bandSource: Office for National Statistics
Local Insight profile for Headington Quarry© OCSI 2016.
2005 2006 2007 2008 2009 2010 2011 2012 2013 2014 2015 20160
100200300400
500600700800900
VAT
regi
stre
d lo
cal u
nits
(pe
r 10
,000
)
Headington Quarry Oxfordshire England
75.1
13.64.9
10.9
70.9
13.08.1 8.1
71.4
12.97.6 7.8
Employing 0 to 4 peopleEmploying 5 to 9 peopleEmploying 10 to 19 peopleEmploying 20 or more people
0
10
2030
40
5060
70
80
% o
f all
busi
ness
es
Headington Quarry Oxfordshire England
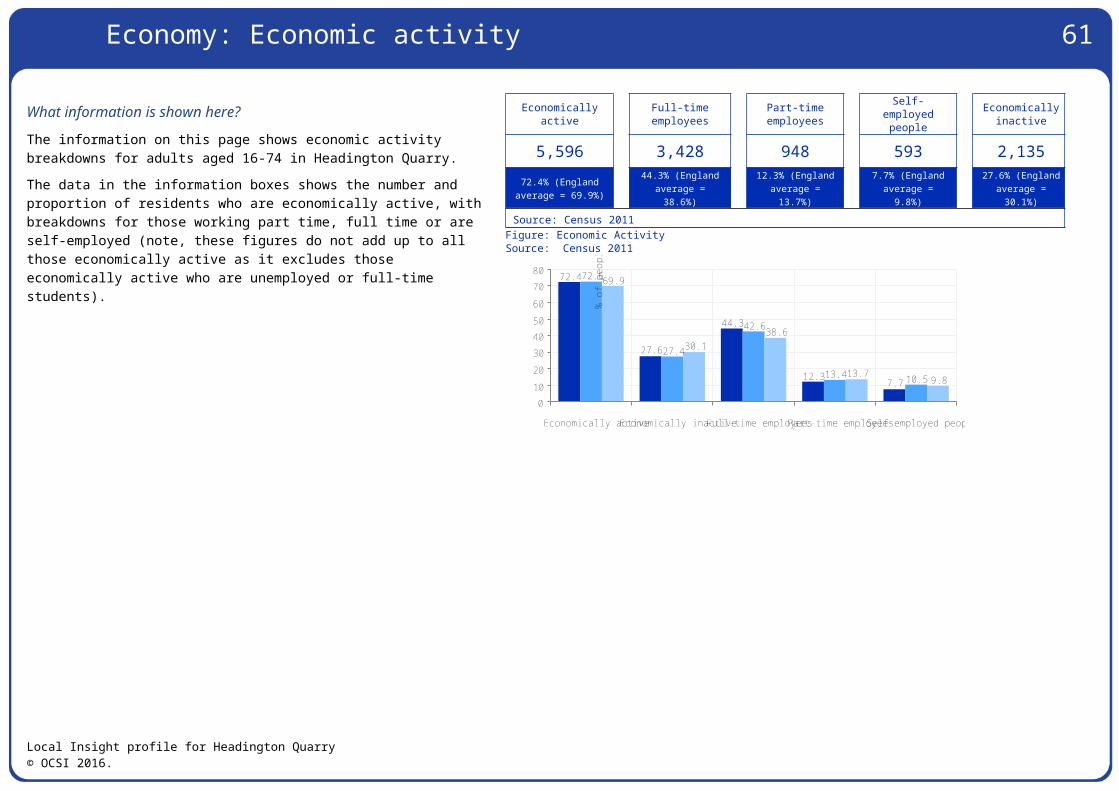
Access and transport: Car ownership 61
What information is shown here?
The information on the right shows details of the number of cars and vans in each household in Headington Quarry. The count of cars or vans in an area is based on details for private households only. Cars or vans used by residents of communal establishments are not counted.The information boxes show the number of households by number of cars owned across Headington Quarry, while the charts show the same information (expressed as a percentage) against comparator areas.
No cars One car Two cars Three cars Four + cars
1,295 1,940 870 180 5529.8% of
4,340households(England =
25.8%)
44.7% of 4,340households(England =
42.2%)
20.0% of 4,340households(England =
24.7%)
4.2% of 4,340households(England =
5.5%)
1.3% of 4,340households
(England = 1.9%)
Source: Census 2011
Figure: Car ownershipSource: Census 2011
Local Insight profile for Headington Quarry© OCSI 2016.
25.8
42.2
24.7
5.5
1.9
17.5
41.5
30.7
7.4
2.9
29.8
44.7
20.0
4.2
1.3
No cars
One car
Two cars
Three cars
Four+ cars
50454035302520151050% of households
Headington Quarry Oxfordshire England

62
What information is shown here?
The information on this page shows the accessibility of key services and amenities to people living in Headington Quarry. Accessibility is measured both in terms of distance and travel times to key services.The information boxes on the right show average distances (in kilometres) to five key services. The chart on the right shows average travel times in minutes to key services when walking or taking public transport.
Average road distance from
Job Centre
Average road distance from
Secondary School
Average road distance from
GP
Average road distance from
Pub
Average road distance from
Post Office
3.9km 2.0km 0.9km 0.6km 0.6kmEngland average
= 4.6kmEngland average =
2.1km
Englandaverage =
1.2km
Englandaverage =
0.7km
England average= 1.0km
Source: Road distances - Commission for Rural Communities: Distance to Service dataset (2010)
Figure: Average travel time (mins) by walking or public transport to the nearest key serviceSource: Department for Transport: Core Accessibility Indicators (2015)
Local Insight profile for Headington Quarry© OCSI 2016.
8
1811
21
8
1810
141422
14
54
10
22
1120
1220
11
39
918
9
20
Empl
oym
ent
cent
reFu
rthe
r Ed
ucat
ion
Inst
itutio
nG
PH
ospi
tal
Prim
ary
scho
olSeco
ndar
y sc
hool Su
perm
arke
tTo
wn
cent
re
0
102030
40
5060
min
s
Headington Quarry Oxfordshire England
Access and transport: Distance and travel times to key services
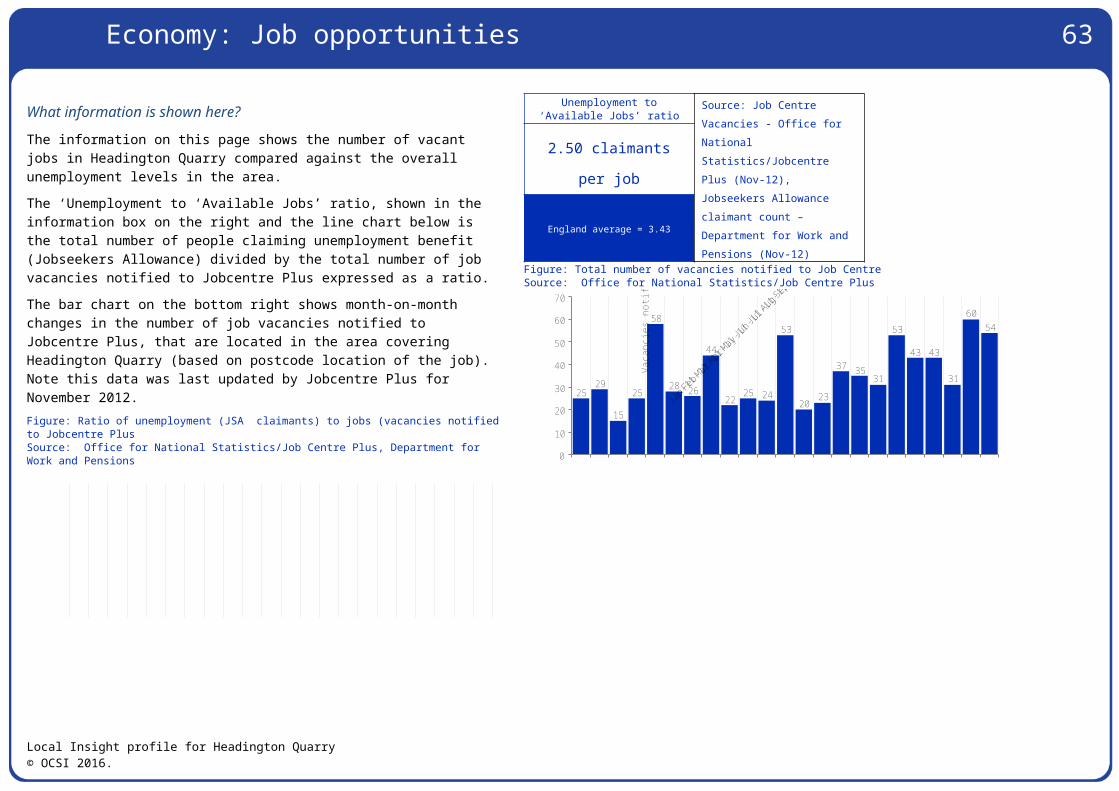
63
What information is shown here?
The information on this page shows two measures of access to the internet. The first measure shows information on broadband take-up, speeds and availability. It has been produced by Ofcom and contains data provided by communications providers. The data shows the average broadband line speed in Headington Quarry and the proportion of broadband connections in Headington Quarry which with low broadband speeds (less than 2 Mbit/s).The chart on the right shows the proportion of people who responded to the 2011 Census online, compared with the proportion that filled in the Census form on paper in Headington Quarry. This is a proxy measure of digital engagement as areas with a high proportion of online Census responses are more likely to be digitally engaged than those in areas with low levels of online responses.
Connections with low broadband
speeds (less than 2 Mbit/s)
Average broadband download speed
(Mbit/s)
Average broadband upload speed
(Mbit/s)
14 52.17 4.800.4% (England
average = 2.7%)England average =
37.81England average =
3.81Source: Ofcom 2016
Figure: Census online and paper responsesSource: Census 2011
Local Insight profile for Headington Quarry© OCSI 2016.
23.0
78.0
20.0
80.0
19.0
81.0
Online responses
Paper responses
9080706050403020100 %
England Oxfordshire Headington Quarry
Access and transport: Digital services
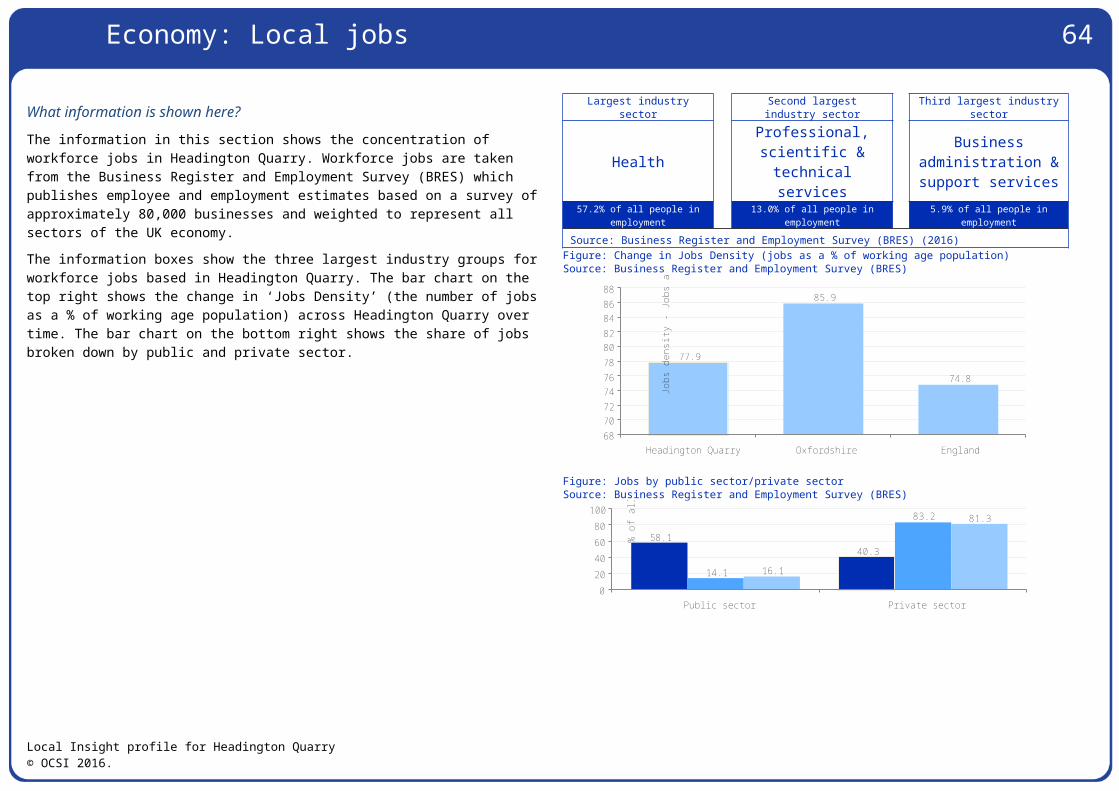
Communities and environment: Classification of neighbourhoods
64
What information is shown here?
The information on this page looks at the characteristics of neighbourhoods across Headington Quarry as defined using the Output Area Classification (OAC). OAC classifies every area in the country based on a set of socio-demographic characteristics, to provide a profile of areas to identify similarities between neighbourhoods. The information boxes on the right show the number and proportion of neighbourhoods in Headington Quarry that fall within the eight supergroup categories, detailed below. The chart on the right shows the proportion of areas falling within supergroup categories across Headington Quarry and comparators.
Rural residents Cosmopolitans Ethnicity central Multicultural metropolitans
0 671 2,286 4,2220.0% (England average
= 10.5%)6.4% (England
average = 4.9%)21.9% (Englandaverage = 6.6%)
40.4% (Englandaverage = 15.3%)
Urbanites Suburbanites Constrained city dwellers Hard-pressed living
3,261 0 0 031.2% (England
average = 18.6%)0.0% (England
average = 20.8%)0.0% (England
average = 6.2%)0.0% (England average
= 17.2%)Source: Office for National Statistics Output Area Classification 2011
Local Insight profile for Headington Quarry© OCSI 2016.
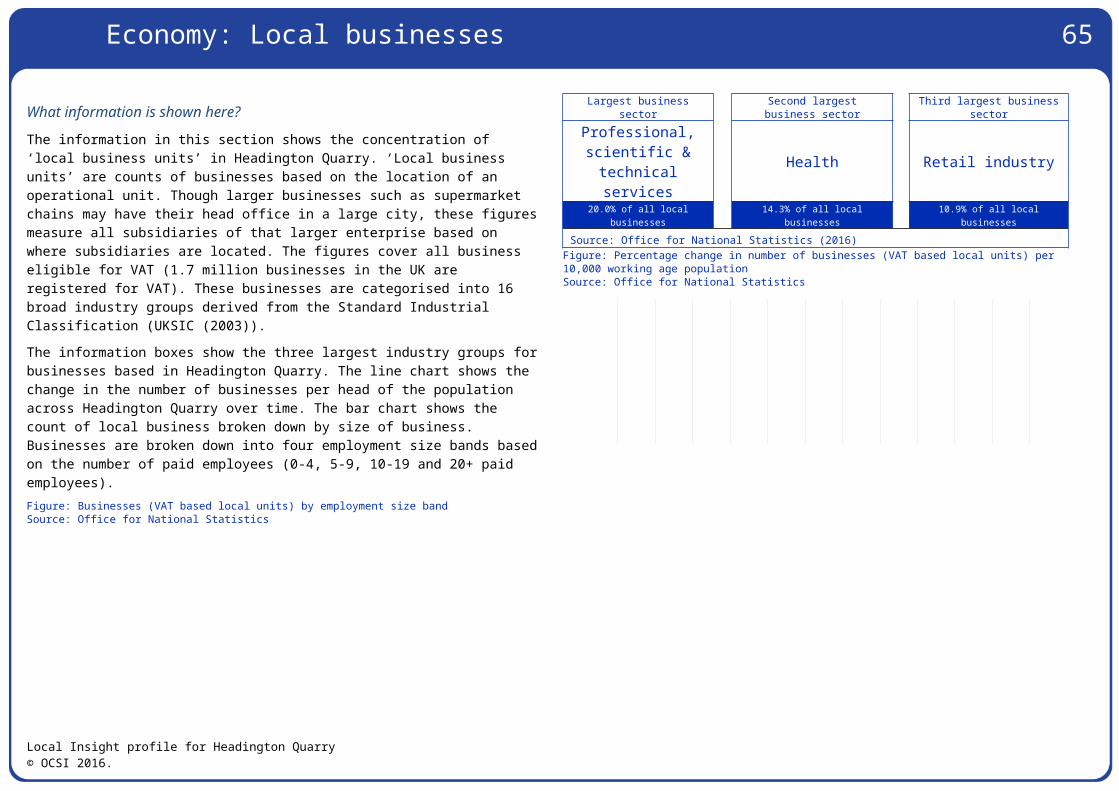
65
Rural residents
Rural areas, sparsely populated, above average employment in agriculture, higher number owning multiple cars, an older married population, a high provision of unpaid care and an above average number of people living in communal establishments.
Cosmopolitans Residing in densely populated urban areas, high ethnic integration, high numbers of single young adults without children including students, high public transport use, above average qualification levels
Ethnicity central
Concentrated in Inner London and other large cities, high ethnic diversity, high proportion of rented accommodation, high proportion of people living in flats, low car ownership.
Multicultural metropolitans
Concentrated in larger urban conurbations in the transitional areas between urban centres and suburbia, high proportion of BME groups, high proportion of families.
Urbanites Predominantly in urban areas with high concentrations in southern England. More likely to live in either flats or terraces that are privately rented.
Suburbanites Located on the outskirts, in areas with high owner occupation, high numbers of detached houses, low unemployment, high qualifications and high car ownership.
Constrained city dwellers
Higher proportion of older people, households are more likely to live in flats and to rent their accommodation, and there is a higher prevalence of overcrowding, higher proportion of people in poor health, lower qualification levels and high unemployment
Hard-pressed living
Mostly on the fringe of the UK's urban areas, particularly in Wales and the North of England. High levels of people in terraced accommodation, high unemployment, low ethnic diversity, high levels of people employed in manufacturing
Figure: Area Classification 2011: Number of people living in different types of neighbourhood (by classification type)Source: Output Area Classification (2011)
Local Insight profile for Headington Quarry© OCSI 2016.
0
6
22
40
31
0
0
0
17
8
1
13
30
17
2
11
10
5
7
15
19
21
6
17
Rural Residents
Cosmopolitans
Ethnicity Central
Multicultural Metropolitans
Urbanites
Suburbanites
Constrained City Dwellers
Hard-Pressed Living
454035302520151050% of people living in area
England Oxfordshire Headington Quarry
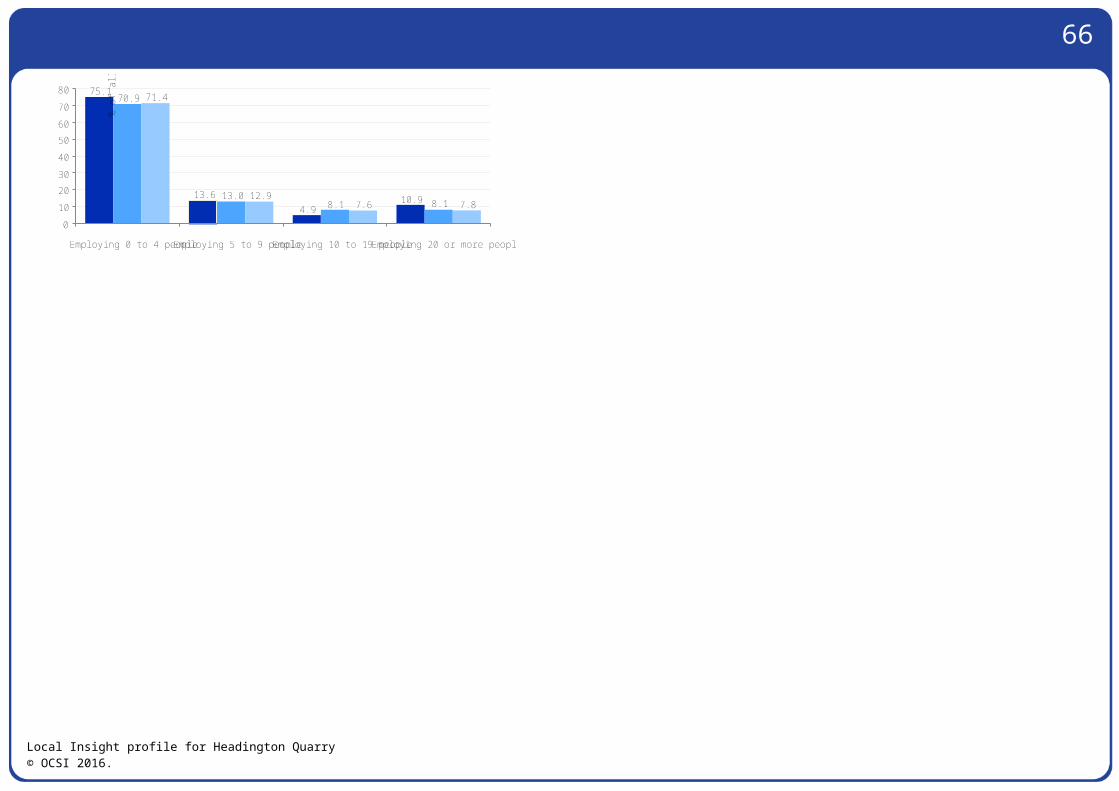
Communities and environment: Neighbourhood satisfaction & local participation (1)
66
What information is shown here?
The information on this page shows different measures of people’s satisfaction with their neighbourhood and their sense of community cohesion in the neighbourhood. It also shows different measures of people’s participation in volunteering and political decision making in the local area. In addition the information box on the far bottom right shows the number of active charities per 1,000 population.Figures are self-reported and taken from the Place Survey. The Place survey is collected at Local Authority level so does not include neighbourhood information, and ceased nationally in 2008 so is increasingly out of date.
“People from different backgrounds get on well together
in the local area”
People who feel that they belong
to their neighbourhood
People who are satisfied with local area as a place to
live
Aged 65+ "satisfied with both home and
neighbourhood"
82% 49% 83% 81% (England = 76%) (England = 58%) (England = 79%) (England = 83%)
People involved in decisions that affect the local area in the
past 12 months
People who believe they can
influence decisions in their
local area
People who have given unpaid help at
least once per month over the last
12 months
Active charities
15% 29% 27%4.1 per 1,000
population (England = 14%) (England = 29%) (England = 23%) (England = 2.6 per
1,000)Source: Place Survey (2008), Active Charities - National Council for Voluntary Organisations (NCVO) (2009). Note all information is collected at Local Authority level
Figure: Indicators of community strengthSource: Place Survey (2008)
Figure: Indicators of civic engagementSource: Place Survey (2008)
Local Insight profile for Headington Quarry© OCSI 2016.
83.0
76.0
58.2
79.3
87.7
81.0
58.9
86.5
81.1
82.1
49.3
83.1
Aged 65+ "satisfied with both home and neighbourhood"
“People from different backgrounds get on well together in the local area”
“I belong to the neighbourhood”
“Satisfied with the local area as a place to live”
100806040200%
Headington Quarry Oxfordshire England
14.0
28.9
23.0
15.3
30.0
28.7
15.3
29.4
26.7
Involved in decisions that affect the local area
“I can influence decisions in their local area”
Given unpaid help in the last year
35302520151050%
Headington Quarry Oxfordshire England
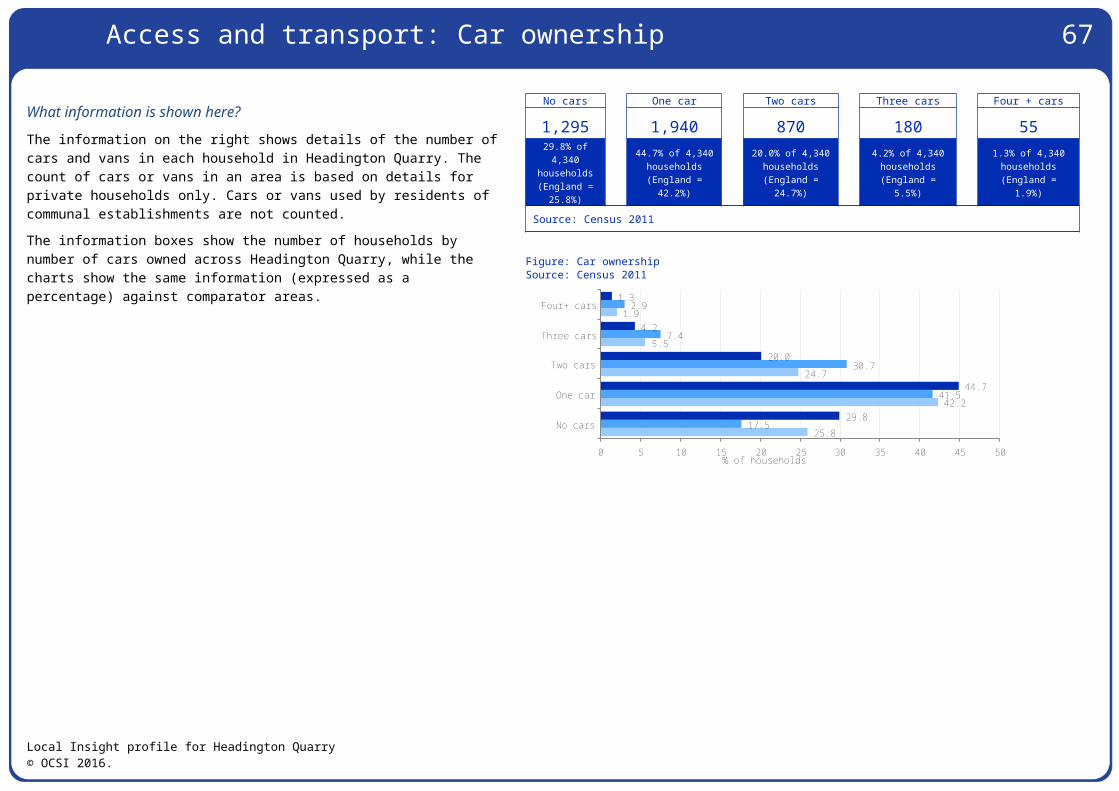
Communities and environment: Neighbourhood satisfaction & local participation (2)
67
What information is shown here?
The page shows the Community Dynamics indicators for Headington Quarry. The Community Dynamics dataset (http://communitydynamics.social-life.co/index.html) has been developed by Social Life with the aim of quantifying how people feel about the area they live in.By modelling responses from the annual Community Life Survey and Understanding Society Survey to Output Areas, Social Life have created small area measures of: strength of local social relationships, strength of belonging to a local area and satisfaction with a local area as a place to live.Positive values represent greater belonging/relationship strength/satisfaction than the national average. Negative figures represent less belonging/relationship strength/satisfaction than the national average.Please note that these indicators have been created by combining the survey responses of samples of the population and modelling these to Output Areas by linking survey sample demographics to the demographics of Output Areas. As a result, many implicit assumptions are built into the data which will not hold for all areas.The values presented here offer an indication of community belonging, strength and satisfaction rather than an absolute measure.
Local social relationships Belonging
Satisfaction with local area as a place
to live
-0.044 -0.072 0.018 (England = -0.006) (England = -0.011) (England = 0.001)
Figure: Community Dynamic scores for belonging, relationships and satisfactionSource: Social Life (modelled from the annual Community Life Survey), 2015/2016
Local Insight profile for Headington Quarry© OCSI 2016.
-0.011
-0.006
0.001
-0.002
-0.003
-0.006
-0.072
-0.044
0.018
Belonging
Relationshiips
Satisfaction
0000000%
Headington Quarry Oxfordshire England
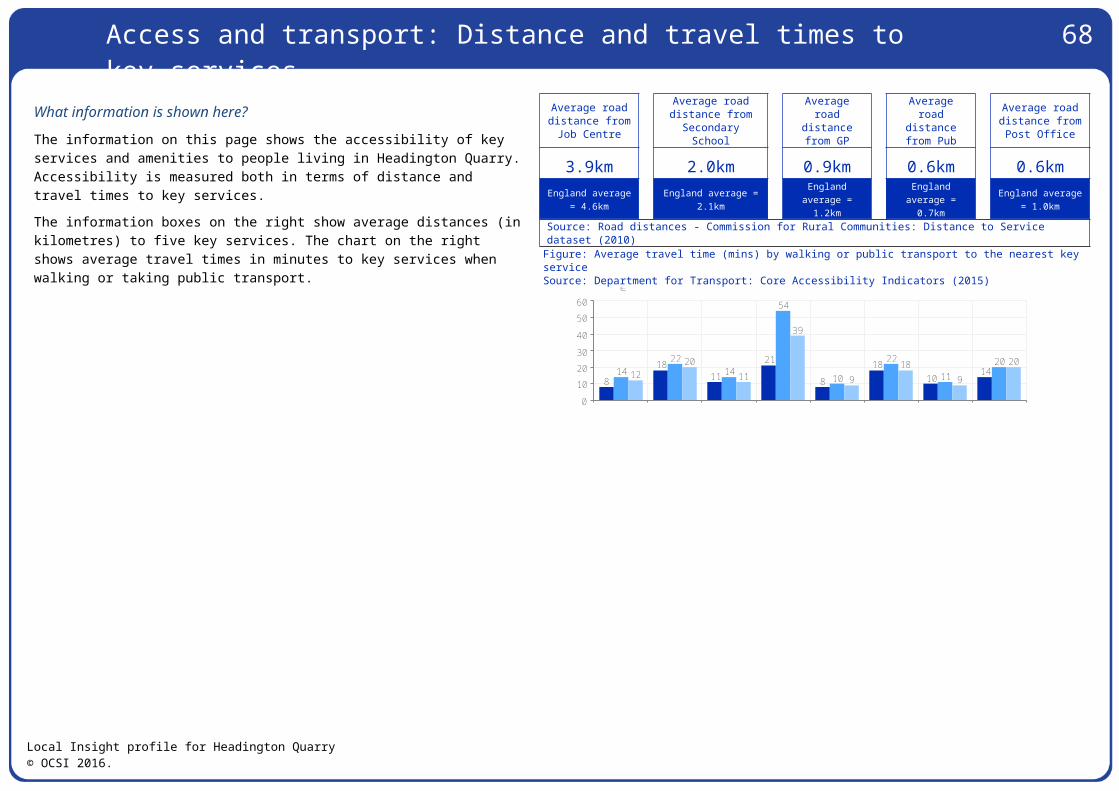
Communities and environment: Air pollution 68
What information is shown here?
The information on this page shows background concentrations from four air pollutants: nitrogen dioxide, benzene, sulphur dioxide and particulates. The air quality data was collected for 2012 on a 1km grid and obtained from the UK National Air Quality Archive for use in the Indices of Deprivation 2015. A higher score indicates a higher concentration of the pollution with a score of greater than 1 indicating that the levels of pollution exceed national standards of clean air.
Benzene concentrations
Nitrogen Dioxide concentrations
Particulates (PM10) concentrations
Sulphur Dioxide concentrations
0.08 0.4 0.5 0.04(England average = 0.09) (England average = 0.5) (England average = 0.4) (England average = 0.05)Source: Communities and Local Government (Indices of Deprivation 2015 - from National Air Quality Archive 2012)
Figure: Air pollution concentrations for four pollutantsSource: Communities and Local Government (Indices of Deprivation 2015 – from National Air Quality Archive 2012)
Local Insight profile for Headington Quarry© OCSI 2016.
0.1 0.1 0.1
0.4
0.3
0.50.5 0.4 0.4
0.0 0.0 0.0
Headington Quarry Oxfordshire England0.00.10.10.20.20.30.30.40.40.50.5
Air
pol
lutio
n co
ncen
trat
ions
Benzene concentrations Nitrogen Dioxide concentrations Particulates (PM10) concentrations Sulphur Dioxide concentrations
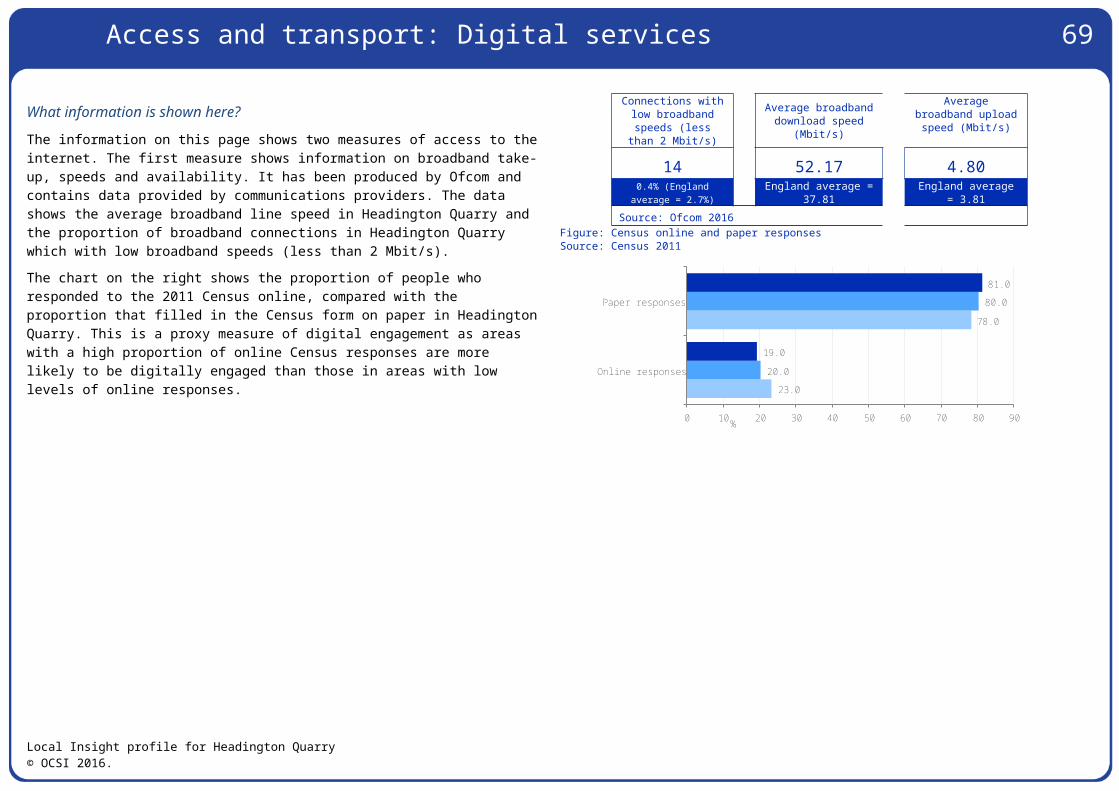
Communities and environment: Green space coverage 69
What information is shown here?
Ordnance Survey (OS) publish the locations and extent of green spaces that are likely to be accessible to the public. The data include the following types of green spaces: allotments or community growing spaces, bowling greens, cemeteries, religious grounds, golf courses, other sports facilities, play spaces, playing fields, public parks or gardens and tennis courts.OCSI have intersected OS Open Greenspaces data with Output Area boundaries to produce data for the greenspace per standard geographical area (eg OA, LSOA, LA).Two green space measures are shown here. The total green space (which includes all types of green space) and the public parks and gardens green space (only public parks and gardens).Large rural areas such as National Parks are not included in the OS Greenspace dataset. Religious grounds are included where there is seen to be a significant amount (>500m2) of accessible greenspace. Sports stadiums and grounds which are primarily for spectating rather than participating in sports are not included. Playing fields should only be included in OS Greenspace dataset where they are used by the public at least some of the time. Playing fields such as school fields which are entirely enclosed and only for use of the school, would not be expected to be included.Wooded areas that function as public parks (i.e. are freely accessible to the public in their entirety and are managed for recreation) should be included, however, the constraints of the capture method employed to create the data mean that in many cases these may not yet be included.
Total green space Public parks and gardens greenspace
13.20% 11.16%55.76 hectares (England
average = 2.22%)47.13 hectares (England
average = 0.79%)Source: OS data © Crown copyright and database right 2017
Figure: Percentage of green space coverageSource: OS data © Crown copyright and database right 2017
Local Insight profile for Headington Quarry© OCSI 2016.
13.2
11.2
1.70.3
2.20.8
Total green space Parks and gardens0.0
2.0
4.0
6.0
8.0
10.0
12.0
14.0
% g
reen
spa
ce c
over
age
Headington Quarry Oxfordshire England
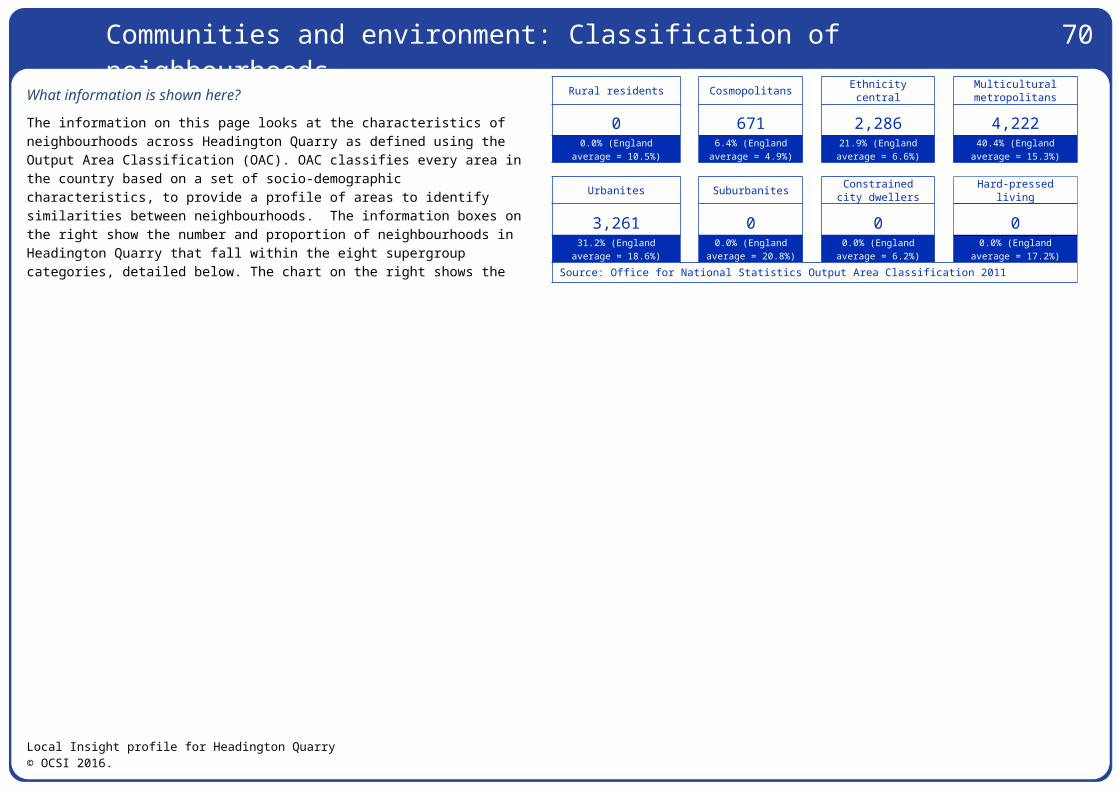
Appendix A: About the data and geographies used in this report
70
OS data © Crown copyright and database right 2017
How we have identified the “Headington Quarry” area
This report is based on the definition of the “Headington Quarry” area (this area can be viewed on the Local Insight map, through finding the area on the ‘show services’ dropdown in the top left hand corner of the map. We have aggregated data for all the neighbourhoods in “Headington Quarry” to create the data used in this report.Alongside data for the “Headington Quarry” neighbourhood we also show data for selected comparator areas.Data in this report is based on regularly updated open data published by government sources
All the data in this report is based on open data published by more than 50 government agencies, collected and updated by OCSI on weekly basis. Data is updated on regular basis, with the reports and mapped data on the website reflecting the latest available data.Details of the individual datasets are provided on the pages where the data is presented, with information on dates and sources presented alongside the charts and tables. On the website, information about each source is available on the popup “About the indicator” link at the top-right of the map.
Standard geographies used in this report
Super Output Areas (SOAs): SOAs are a statistical geography created for the purpose of presenting data such as the Census, Indices of Deprivation, and other neighbourhood statistics. There are two layers to the SOA geography: ‘lower layer’ (LSOA) and ‘middle layer’ (MSOA). SOAs are designed to produce areas of roughly equal population size - 1,500 people for LSOAs and 7,200 for MSOAs. The majority of data used in this report is based on LSOA boundaries; of which there are 32,844 in England (there were changes to around 4% of LSOA definitions in Census 2011).Output Areas (OAs): OAs are a more detailed statistical geography than SOAs, with each covering around 300 people, or 120 households. There are 171,372 OAs in England (there were changes to around 5% of OA definitions in Census 2011).Wards: A small number of datasets are published at ward level. These are on average four times larger than LSOAs. Data is less detailed than LSOA level datasets and wards vary greatly in size, from less than 200 residents (Isles of Scilly), to more than 36,000 residents (in Sheffield).
Local Insight profile for Headington Quarry© OCSI 2016.
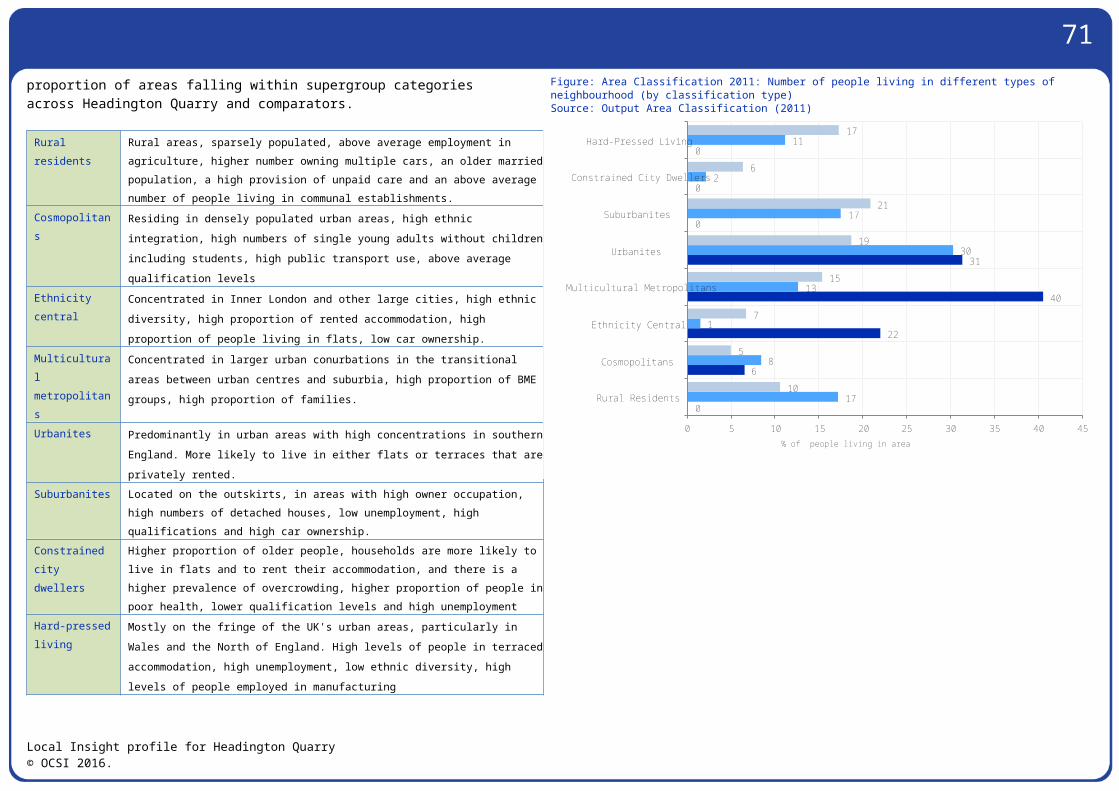
71
Local Insight gives you the data and analysis you need to ensure your services are underpinned by the best possible knowledge of local communities, levering the power of information right across your organisation, from high-level visualisations for Board level to detailed reports on local neighbourhoods. Saving you time and money, Local Insight gives you the most relevant and up-to-date data on the communities where you work, with no need to invest in specialist mapping and data staff, consultancy or software. See http://local.communityinsight.org/ for more information.Local Insight is developed by OCSI, based on a project that was jointly developed by HACT and OCSI.OCSI work with public and community sector organisations to improve services. We turn complex datasets into engaging stories; making data, information and analysis accessible for communities and decision-makers. See www.ocsi.co.uk for more information.
Local Insight profile for Headington Quarry© OCSI 2016.