community of speyside marine environment … · o ask a user fee for recreation within the marine...
TRANSCRIPT
Community of Speyside Marine Environment Improvement Collaboration
(COSMEIC)
Results of Community and Scientific Work December 2008 – August 2009
Preliminary report
Image by Jim Catlin
Coral Cay Conservation Elizabeth House 39 York Road
SE1 7NQ London, United Kingdom
www.coralcay.org [email protected]
Community of Speyside Marine Environment Improvement Collaboration
Preliminary report ii
Project partners:
Report by
Jan-Willem van Bochove, Senior Field Scientist Etienne Low-Décarie, Project Scientist
Peter Raines, Founder and CEO
Coral Cay Conservation, September 2009
Community of Speyside Marine Environment Improvement Collaboration
Preliminary report iii
Speyside Management Recommendations • Implement a management plan for a Speyside Marine Park
o Regular scientific monitoring along permanent transects within the park o Several reef sites where fishing is restricted in order to encourage a recovery of
fish stocks and conserve important coral reef health and biodiversity o Install a mooring buoy system for the marine park o Ask a user fee for recreation within the marine park o Ban destructive fishing methods and extraction of endangered species from the
park and develop fishing and harvesting guidelines
• Develop and implement a Speyside Marine Park Authority who is responsible for the management of the park.
o Upkeep and maintenance of mooring buoys o Allows use of the park through non-destructive activities o Organise meetings between stakeholders (dive shops, fishermen, tour boats,
THA) o Updates and reports to the THA and public o Ensures user derived income is used for the management of the park
• Train and hire several Marine Park Rangers, empowered with special policing
authority to: o Patrol on a daily basis to ensure rules and regulations are upheld o Issue fines if needed o Educate the public and inform users about responsible recreation within the
park o Conduct fish catch monitoring
• Establish as Speyside Marine Park Visitors Centre o Inform tourists o Receive diver and user fees o Educate children about their marine environment o Run research and monitoring programmes o Organise community outreach and education events
• Implement several replanting schemes in order to encourage reef rehabilitation and boost local fish and invertebrates stocks
o Elkhorn coral (Acropora Palmata) replanting o Mangrove replanting o Seagrass planting

Community of Speyside Marine Environment Improvement Collaboration
Preliminary report iv
A well-managed and protected marine park will have the following benefits:
v Protects the precious marine environment on which we all rely v Increased tourism to the area v Provides income through recreational user fees and boat mooring fees v Provides more employment to Speyside residents through park rangers, tour
guides and boat drivers v Improved fishing, with bigger and better fish and lobster catches through a
well managed (zonal) fishing plan v Provide additional funding and external support to the project, enabling it to
continually expand and develop v Secures a vital source of fish and coral larvae to the rest of Tobago and the
Lesser Antilles, acting as a future lifeline in the face of climate change.

Community of Speyside Marine Environment Improvement Collaboration
Preliminary report v
Acknowledgements The establishment and success of the COSMEIC project would not have been possible without: the vision and leadership provided by the Speyside Community, and the Speyside Village Council in particular; the generous hospitality of Pat Turpin and Man O War Bay Cottages; and the guidance, encouragement and generous support provided by the following project partners and supporters (listed in alphabetical order): ANSA Automotive Blue Waters Inn BHP Billiton The Buccoo Reef Trust, in particular Hyacinth Armstrong Department of Natural Resources and the Environment, Tobago House of Assembly Department of Marine Resources and Fisheries, Tobago House of Assembly Environment Tobago Global Environment Facility/Small Grants Programme Manta Lodge Miles Almandoz and Company Limited Mystic Hemp Phoenix Marine Limited Solid Waste Management Company Limited The United Nations Development Program All the dedicated staff and volunteers that joined the COSMEIC and made this possible

Community of Speyside Marine Environment Improvement Collaboration
Preliminary report vi
Table of Contents Speyside Management Recommendations ................................................................................ iii Acknowledgements .....................................................................................................................v Table of Figures ........................................................................................................................ vii 1 Introduction.........................................................................................................................8
1.1 Threats to Tobago’s coral reefs...................................................................................8 Global and Regional-Scale Threats and Impacts ................................................................8 Coral Bleaching...................................................................................................................9 Ocean Acidification ............................................................................................................9 Coral Diseases.....................................................................................................................9 Precipitation and Storm Damage ......................................................................................10 Intermediate and Local-Scale Threats and Impacts ..........................................................10 Nutrification......................................................................................................................10 Sedimentation....................................................................................................................11 Overfishing........................................................................................................................11
1.2. Project Background and Need...................................................................................11 1.3. Coral Cay Conservation............................................................................................14 1.4 Aim of report.............................................................................................................14
2. Progress of Community Work and Capacity Building Programmes ................................15 2.1 School visits ..............................................................................................................15 2.2 CCC Scholarship Programme ...................................................................................18
CCC Scholarship Programme ...................................................................................................18 3.1 COSMEIC Baseline Surveys ....................................................................................20
History and rationale .........................................................................................................20 Survey Technique .............................................................................................................21
3.3 Data Analysis ............................................................................................................23 3.4 Geographical Information System............................................................................24 3.5 Survey Progress.........................................................................................................25 4.1 Benthic Composition ................................................................................................28 4.2 Coral Cover...............................................................................................................30 4.3 Reef Fish...................................................................................................................35
Predatory Reef Fish...........................................................................................................35 Herbivorous Fish...............................................................................................................35
4.4 Invertebrates..............................................................................................................37 4.5 Coral Disease ............................................................................................................39
5. GIS Contour Mapping.......................................................................................................41 5.1 Benthic Cover ...........................................................................................................42 5.2 Invertebrates..............................................................................................................44 5.3 Reef Fish...................................................................................................................47 5.4 Coral Disease ............................................................................................................51 5.5 Conservation management values.............................................................................53
6. Discussion.........................................................................................................................56 Benthic composition .........................................................................................................56 Reef Fish...........................................................................................................................56 Invertebrates......................................................................................................................57 Coral Disease and Bleaching ............................................................................................57 General Conclusions and Management Recommendations..............................................58
References .................................................................................................................................61 Appendix: COSMEIC target species ........................................................................................64

Community of Speyside Marine Environment Improvement Collaboration
Preliminary report vii
Table of Figures Figure 1 Map of Speyside. ........................................................................................................13 Figure 2 CCC Science Officer teaching children about coral reef ecology..............................15 Figure 3 CCC volunteers learning how to identify corals. .......................................................20 Figure 4 Schematic representation of COSMEIC baseline surveys. ........................................23 Figure 5 Number of CCC baseline surveys conducted.. ...........................................................25 Figure 6 CCC baseline survey locations conducted around Speyside ......................................26 Figure 7 Benthic composition several key reef sites around Speyside. ....................................29 Figure 9 Hard coral diversity. ...................................................................................................33 Figure 10 Hard coral cover for the same survey sites in 2005 and 2007 at 7 and 12 meters. ..33 Figure 11 Hard coral composition of 14 of the most dominant groups of corals. ....................34 Figure 12 Density of 3 selected predatory fish families. ..........................................................35 Figure 13 Density of Surgeonfish and Parrotfish for the Caribbean side and Speyside reefs. .36 Figure 14 Commercial fish biomass for 4 selected families .....................................................36 Figure 15 Abundance of adult and juvenile of Long-spine Sea Urchins ..................................37 Figure 16 Abundance of key invertebrate indicator species.....................................................38 Figure 17 Disease prevalence of 3 common coral diseases......................................................39 Figure 18 Disease prevalence on 2 main coral family types. ...................................................40 Figure 19 contour map of the diversity of benthic species .......................................................42 Figure 20 Colour contour map of the percentage live hard coral cover ...................................43 Figure 21 Colour contour map of the percentage macro-algae cover.......................................43 Figure 22 Colour contour map of the abundance of diadema sea urchins................................44 Figure 23 Colour contour map of the abundance Spiny Lobsters ............................................45 Figure 24 contour map of the diversity of fish species .............................................................47 Figure 25 Colour contour map of the biomass of parrotfish.....................................................48 Figure 26 Colour contour map of the biomass of groupers ......................................................48 Figure 27 Colour contour map of the biomass of snappers ......................................................49 Figure 28 Colour contour map of the biomass of grunts ..........................................................49 Figure 29 Colour contour map of the total biomass of commercial fish ..................................50 Figure 30 Colour contour map of the prevalence of yellow band disease ................................51 Figure 31 Colour contour map of the prevalence of dark spot syndrome ................................52 Figure 32 Colour contour map of the prevalence of aspergillosis............................................52 Figure 33 Conservation Management Values for the fringing reefs around Speyside. ............54 Figure 34 Conservation Management Values for the fringing reefs surveyed around Tobago 55 Figure 35 Proposed Speyside Marine Park outline ...................................................................60
Community of Speyside Marine Environment Improvement Collaboration
Preliminary report 8
1 Introduction The World Resources Institute in Reefs at Risk in the Caribbean (Burke et al., 2008) identified that two thirds of the Caribbean’s coral reefs are at high risk from anthropogenic threats such as sedimentation from deforestation, coastal development, dredging, pollution from agricultural and industrial development, untreated wastewater discharge, fishing related activities and climate change. Caribbean coral reefs face a stark reality: ecological collapse within a human generation unless humanity reacts swiftly and decisively to act both locally and globally to mitigate against these threats. The coastal marine ecosystems of Speyside on the northeast end of the island of Tobago (Trinidad & Tobago) remain robust and healthy, and offer hope that through continued community-led ‘reef guardianship’, these reefs will not only serve the socio-economic needs of the Speyside community, but also act as an important trans-boundary corridor for reef connectivity and rejuvenation in the eastern Caribbean. The Community of Speyside Marine Environment Improvement Collaboration (COSMEIC) is a locally managed, locally owned and locally led project that aims to enhance the current protection of these regionally and globally important reefs. This will be achieved through the establishment of a community-managed, integrated ’ridge to reef’ approach to marine protected areas, along with the development of a master plan for the development of environmentally sustainable and economically viable, community-owned and operated recreational scuba diving opportunities.
1.1 Threats to Tobago’s coral reefs Threats to reef health in Tobago caused by both natural and anthropogenic factors include overfishing, habitat degradation, land-based pollution stresses and climate change induced events. The impact of natural threats has been illustrated recently with the destructive force of Hurricane Ivan, which caused considerable damage to coastal areas and the shallow marine environment in 2004. The large-scale bleaching event of 2005 is also an example of a major climate change induced event that has significantly affected the coral reefs around Tobago. The range of threats applicable to coral reefs in Tobago are described in some detail below.
Global and Regional-Scale Threats and Impacts Carbon Dioxide (CO2) levels in the earth’s atmosphere have been rising steeply since the industrial revolution, mainly due to the burning of fossil fuels. Based on realistic scenarios of future emissions this trend will continue and atmospheric CO2 concentrations are expected to reach double pre-industrial levels by 2065 (Houghton et al., 2001). Global temperatures are expected to rise anywhere between 1.8 – 4.0ºC by the year 2100 (IPCC, 2007). Climate change is regarded as one of the major threats to the future of coral reefs (Hughes et al., 2003). Coral reefs have evolved in relatively stable climatic conditions for the last tens of thousands of years. It is this relative climatic stability that has allowed them to develop into a complex ecosystem comprised of thousands of species and many intricate inter-specific relationships. Coral reefs can recover from acute stress (e.g. bleaching events) and also tolerate chronic (e.g. sedimentation) ones to a certain degree. However, chronically stressed

Community of Speyside Marine Environment Improvement Collaboration
Preliminary report 9
reefs are far less likely to recover from an acute stress (Kinsey, 1988). A series of acute stresses against a backdrop of continued chronic ones can result in a phase shift and the replacement of the coral dominated community by one dominated by macroalgae or some other non-reef system. Such ecosystem shifts are well advanced in the Caribbean (Buddemeier et al., 2004) and in some cases; the combination of stresses has brought coral reefs to the point of local extinction. Coral reefs have accordingly been dubbed the ‘‘canaries in the coalmine of climate change’’. What follows is a summary of some of the most concerning climate change induced phenomena that are predicted to have an impact on the coral reefs around Tobago.
Coral Bleaching Coral species and their associated microscopic algae are highly sensitive creatures with a limited ‘tolerance zone’ within which they can thrive. Stressors such as increased UV light and thermal stress can threaten their survival. Coral bleaching refers to the loss of the symbiotic algae (zooxanthellae) from the coral tissue as a result of stress. Without these algae, the coral colony appears white. The zooxanthellae provide the bulk of the coral’s nutrition via photosynthesis. If a coral colony is not able to regain its population of symbiotic algae, it will starve. Although there have been records of coral bleaching since 1870 (Glynn, 1993), extensive or regional bleaching appears to be a relatively new phenomenon, with a significant increase in the levels and extent of bleaching recorded in the past 20 years or so (Winter et al, 1998). Recent examples of corals reefs’ responses to elevated sea surface temperatures in the Caribbean were demonstrated by two large-scale regional bleaching episodes. In 1998 (El Niño Southern Oscillation, ENSO) bleaching effectively killed 16% of the worlds coral reefs and the mass bleaching event of 2005 resulted in on average 66% coral bleaching in the Caribbean (see Wilkinson and Souter, 2008). Such events are expected to become bi-annual within the next 20-50 years if drastic measures are not taken to reduce carbon emissions (IPCC, 2007).
Ocean Acidification In addition to rising sea surface temperatures, another phenomenon is expected to affect the very structure and growth capabilities of hard corals through a process known as oceanic acidification. As the oceans soak up more carbon dioxide, the marine chemistry of the ocean changes. Dissolved in water, CO2 becomes carbonic acid, reducing the amount of carbonate available to calcifying organisms such as reef building (Scleractinian) corals that need carbonate to create a calcium carbonate (limestone) skeleton. In the last 200 years the surface ocean has absorbed about half of the CO2 produced by industry, causing a fall in pH of 0.1, which equates to a 30% increase in H+ ion concentration (Royal Society, 2005). The predicted changes in seawater chemistry could have severe consequences for calcifying organisms, making it increasingly difficult for hard corals to maintain their limestone skeletons (Orr et al. 2005).
Coral Diseases Disease outbreaks and subsequent mortality among corals and other reef organisms have been a major cause of the recent increase in coral reef degradation (Buddemeier et al., 2004). Coral disease frequency has been linked to thermal stress (Bruno et al., 2007) and there have been

Community of Speyside Marine Environment Improvement Collaboration
Preliminary report 10
local reports of disease outbreaks following on from bleaching events, as is the case in Tobago (see van Bochove et al., 2008). There is a lack of knowledge about the causative agents of many diseases affecting corals but studies have shown that microbial pathogens are a source of coral diseases such as Yellow Band Disease, Black Band Disease, Aspergillosis and White-Band disease (Cervino et al., 2004, ). The latter disease is responsible for more than a 90% reduction in populations of Elkhorn (Acropora palmata) corals, which was once the dominant shallow-reef building coral in the Caribbean but is now listed on CITES as an endangered species. Some of these pathogens have been linked to sewage and agricultural outputs (Voss et al., 2006, Smith et al., 1996) providing strong evidence for the effectiveness of proper waste management schemes in order to minimise disease impacts on coral reefs.
Precipitation and Storm Damage Another concerning effect of global climate change is the expected dramatic changes in weather systems. Tropical precipitation has increased over the past century by 0.2–0.3 % per decade in the 10ºS-10ºN region (Houghton et al., 2001). The frequency of heavy precipitation events is expected to increase (IPCC, 2007). Increases in precipitation can lower salinity and increase sediment discharge and deposition near river mouths, sometimes leading to mass mortalities on nearby coral reefs (Wolanski et al., 2003). Proper management and restoration of natural watersheds can greatly minimise direct runoff from rainwater. Hurricanes are also becoming both stronger and more unpredictable (Webster 2005). Healthy reefs can recover from infrequent damage caused by tropical storms but already weakened and stressed reefs may be further degraded with little opportunity for recovery. The impact of natural threats have been illustrated recently with the destructive force of Hurricane Ivan, which caused considerable damage to coastal areas and the shallow marine environment.
Intermediate and Local-Scale Threats and Impacts Although climate change is now considered to be the overarching threat to tropical marine ecosystems, impacts to coral reefs are exacerbated by local, anthropogenic events. To maintain hard coral populations on reef systems around the world it will be necessary to carefully manage direct pressures such as pollution, sedimentation, overfishing and coastal development, and hope that some coral species are able to adapt to the warmer environment (Wilkinson and Souter, 2008). Studies conducted on relatively undisturbed coral reefs in the absence of direct human pressures have indicated that these reefs have a greater ability to recover from bleaching events. This was demonstrated in the remote archipelago of Chagos following the 1998 ENSO event (Sheppard et al., 2008). Threats to reef health, caused by local anthropogenic factors include:
• Changes in water quality due to input of nutrients • Siltation from construction, dredging and runoff from upland deforestation and
agriculture • Overfishing to the extent where key groups of species are removed and it is no longer
sustainable. These are briefly discussed below.
Nutrification Coral reefs thrive in regions where the waters are clear and devoid of nutrients and are sometimes referred to as the marine deserts of the tropical oceans. The addition of nutrients

Community of Speyside Marine Environment Improvement Collaboration
Preliminary report 11
from land-based agricultural runoff and/or untreated sewage discharge can create a situation which promotes the growth of phytoplankton and seaweeds (macroalgae), the latter of which can out-compete corals for space and light. This effect is further exacerbated if overfishing removes key herbivores that normally help to keep algae in check. Knock-on effects have been known to weaken the physiological resistance of corals and make them more susceptible to disease. Recent studies have shown a link between increased nutrient levels and the rate of disease spread (Voss et al., 2006)
Sedimentation High levels of sediment from land-based sources such as vegetation removal mining and coastal construction as well as resuspension of marine sediment by dredging or trawling can interfere with the coral polyps’ ability to feed. Corals under stress from sedimentation have to divert much of their energy actively removing sediment particles (Riegl and Branch, 1995). Stressed corals are also more susceptible to disease. When suspended in water, sediment can limit the amount of light available to corals and this can seriously hamper coral growth and ultimately their survival. Coral reefs in naturally turbid waters, such as many of those in Tobago, are generally more resilient to sediment loading (Larcombe and Woolfe, 1999). However, increased sediment run-off from various small-scale construction projects, upland deforestation and increased sediment loading from the Orinoco river system are driving Tobago’s corals beyond their normal threshold levels.
Overfishing Overfishing, the unsustainable fishing or collection of marine resources, like conch shells and lobsters, and with them, the ecosystem functions they perform, is a global problem with a long history of impacts across the entire marine ecosystem (Jackson et al., 2001). In parts of the Caribbean, widespread overfishing of reefs has removed many of the herbivorous fish that keep algae in check, upsetting the competitive balance between corals and seaweeds, often leading to a fundamental change in the community. Consequently, management of fish stocks is a key component in preventing phase shifts and managing reef resilience (Hughes et al., 2007). There is now evidence that chronic overfishing of top predators such as sharks can have top-down effects on reef productivity (Myers et al., 2007). Local stewardship of fisheries, under guidance of management experts, can be an effective means for conservation of reefs and improved local fish stocks. Recommendations, including implementing and enforcing permanent closures, seasonal protection of spawning sites, fishing gear restrictions and catch limits can all guide effective conservation and management of nearshore fisheries.
1.2. Project Background and Need
Following the Caribbean-wide coral bleaching event in late 2005, the Buccoo Reef Trust (BRT), Tobago House of Assembly (THA) and Coral Cay Conservation (CCC) undertook a rapid assessment of the extent of this bleaching event on the coral reefs of Tobago. As a result of this highly successful collaboration, in April 2007 BRT, THA and CCC with assistance from UNDP GEF/SGP, began implementation of the Tobago Coastal Ecosystem Mapping Project (TCEMP). This two-year project is gathering baseline and monitoring data

Community of Speyside Marine Environment Improvement Collaboration
Preliminary report 12
on the current status of the coral reef, mangrove and seagrass ecosystems of Tobago. This information feeds into the Integrated Watershed and Coastal Area Management (GEF-IWCAM) project, which is providing the THA with the appropriate monitoring, management and decision-making tools to deliver an enhanced management regime for the marine ecosystem and in particular to support a more integrated approach to coastal zone management. The TCEMP also has strong community participation, education and capacity building components, which include a highly successful schools outreach programme and Training Scholarship Programme for T&T nationals. After the mass-bleaching event in 2005, there is now strong evidence that coral diseases are becoming increasingly prevalent on Tobago’s reefs (van Bochove et al., 2008). The TCEMP is currently monitoring the extent and spread of these diseases as well as investigating possible links between anthropogenic stressors (e.g. nutrient pollution, siltation, agricultural run-off, etc) and the prevalence of coral disease in Tobago. In 2005, the reefs around Speyside were not as severely affected by coral bleaching, suggesting that they are more robust and resilient (O’Farrell et al., 2006). Within the next 20 years, it is predicted that the majority of the Caribbean will experience conditions that currently lead to coral bleaching every two years or more (Wilkinson and Souter, 2008). In preparation for these predicted climate change induced events, Speyside’s reefs with their associated strong currents and limited coastal zone development, may well prove to be the last remaining and thus most important location in Tobago where coral reefs are most robust and thus most tolerant to climate change-induced coral bleaching. Through effective management, the value of Speyside’s reefs in terms of an important trans-boundary corridor for reef larval connectivity for the eastern Caribbean island chain is likely to increase exponentially over the coming years as adverse climate change impacts to Caribbean reefs become ever more severe. The Speyside reefs offer some of the best recreational scuba diving opportunities in Tobago and the wider Caribbean, and thus there exists a strong community-managed tourism-related economic opportunity and incentive for sustainable development of this area. Despite the obvious ecological and economic value of the Speyside reefs, there has been little effort to involve the community in effective management of the resources. Increasing pressures from tourism, fishing and coastal developments are rapidly undermining the integrity of the ecosystems. The rising value of fish and shellfish has led to an increase in fishing effort on the Speyside reefs. The lack of adequate infrastructure to treat increasing volumes of waste water, from both residential and commercial buildings, is also a major cause for concern. Recent proposals for large villa developments above Bateaux Bay and Starwood Bay, accentuate the need for greater management and conservation. In addition to these growing threats, there has been little effort to follow-through on many of the studies and consultations that have taken place in the Speyside area and which have acknowledged many of these concerns. There is a need to facilitate and promote greater community-led management of the resource, and to educate stakeholders about the economic and social benefits that could be derived from effective marine area management. In 1985, recommendations were made by the THA to have the Speyside Marine Area designated a restricted area and subsequently a marine park. The Institute of Marine Affairs (IMA) then formulated a Management Plan for the Speyside Reefs Marine Park in 2002 (See IMA, 2002), but this plan has not been implemented to date. The North East Tobago Management Plan (NETMP) produced for the THA in 2003, also acknowledged conservation

Community of Speyside Marine Environment Improvement Collaboration
Preliminary report 13
of the marine ecosystems of North East Tobago as an essential part of the long-term economic development strategy for the area, and necessary for ensuring the sustainability of the diverse marine communities of living organisms, that together protect the shore, provide livelihoods for fishermen and create spectacles for divers and other tourists (Kaira Consultants, 2003). The Plan also identified the absence of baseline data as a key environmental management issue that needed to be addressed if management was to be effective and sustainable. The overall objectives of the COSMEIC address key environmental management issues identified in the NETMP. They also complement the overall aims of the NETMP’s development strategy, which are to enable the communities to achieve a better quality of life through expansion of economic opportunity while ensuring that environmental health and sustainability are not compromised and the natural and cultural resources are not endangered. Additionally, the COSMEIC aims to promote the adoption and implementation of some of the recommendations presented in the Management Plan developed by the IMA. The COSMEIC project objectives are:
1. To facilitate and promote community participation in the review and execution of the Management Plan for Speyside Reefs Marine Park, which will offer an integrated approach to coastal zone management and long-term viable and sustainable community livelihoods for the Speyside community.
2. Build local capacity to support livelihood needs, aspirations and opportunities, through relevant community training scholarship programmes.
3. Enhance community awareness of marine ecology and coastal zone management through a broad range of educational activities, public events and participatory GIS.
4. Develop a database of the natural resources of the Speyside Marine Area to facilitate local and national management needs.
Figure 1 Map of Speyside (taken from North East Tobago Management Plan).
Community of Speyside Marine Environment Improvement Collaboration
Preliminary report 14
1.3. Coral Cay Conservation Effective coastal zone management, including conservation of coral reefs, requires a holistic and multi-sectoral approach, which is often a highly technical and costly process and one that many developing countries cannot adequately afford. With appropriate training, non-specialist volunteer divers are able to provide useful data for coastal zone management at little or no cost to the host country (Hunter and Maragos, 1992; Mumby et al., 1995; Wells, 1995; Darwall and Dulvy, 1996). This technique has been pioneered and successfully applied by Coral Cay Conservation (CCC), a British not-for-profit organisation. Founded in 1986, CCC is dedicated to ‘providing resources to protect livelihoods and alleviate poverty through the protection, restoration and sustainable use of coral reefs and tropical forests’. CCC works in collaboration with government and non-governmental organisations within a host country and does not charge that country for the services provided. CCC is primarily self-financed through a pioneering volunteer participatory scheme whereby international volunteers are given the opportunity to join a phase of each project in return for a financial contribution towards the project costs. Upon arrival at a project site, volunteers undergo a training programme in marine life identification and underwater survey techniques, under the guidance of qualified marine scientists, prior to assisting in the acquisition of data. Finances generated from the volunteer programme allow CCC to provide a range of services, including data acquisition, assimilation and synthesis, conservation education, technical skills training and other capacity building programmes. CCC is associated with the Coral Cay Conservation Trust (the only British-based charity dedicated to protecting coral reefs). CCC has been successfully running volunteer based conservation programmes in developing countries over the past 22 years with notable conservation successes in Belize (formation of the Belize Reef Marine Park and World Heritage Site) and the Philippines (creation of the Danjugan Island Marine Reserve in Negros Occidental. CCC began its involvement in Tobago during the bleaching event that beset the Island’s coral reefs in late 2005. CCC was requested by the BRT to send a team of four coral reef biologists out to Tobago in order to assess the situation, to make management recommendations and to install an appropriate monitoring protocol to provide progress information for the in-country managers. The BRT provided all in-country logistics for the survey effort with funding being supplied by the Tobago House of Assembly and the Travel Foundation whilst CCC provided the time of the scientists free of charge. For further information regarding CCC’s aims and achievements, please visit our website at: www.coralcay.org
1.4 Aim of report The primary aim of this report is to provide a preliminary summary of the community and analysis of the scientific surveys conducted under the COSMEIC project over the first 9 months. Scientific analysis of baseline is provided. An initial analysis of survey data collected is given in both chart format and through Geographical Information Systems (G.I.S.), plotted on satellite imagery. Local community work has been summarised on a thematic basis including notable achievements.
Community of Speyside Marine Environment Improvement Collaboration
Preliminary report 15
2. Progress of Community Work and Capacity Building Programmes
This section provides a summary of the community educational work and capacity building programmes that CCC has developed alongside the biophysical survey programme. These project components are designed to raise environmental awareness of the local community, provide marine science training to local scholars and strengthen ties with local counterparts and government bodies. CCC’s community and capacity building programmes are key aspects of the COSMEIC project and have been adapted from successful and proven initiatives, tried and tested in other host countries where CCC operates. These programmes continue to be improved and expanded upon. New initiatives are discussed in the future activities sub-section.
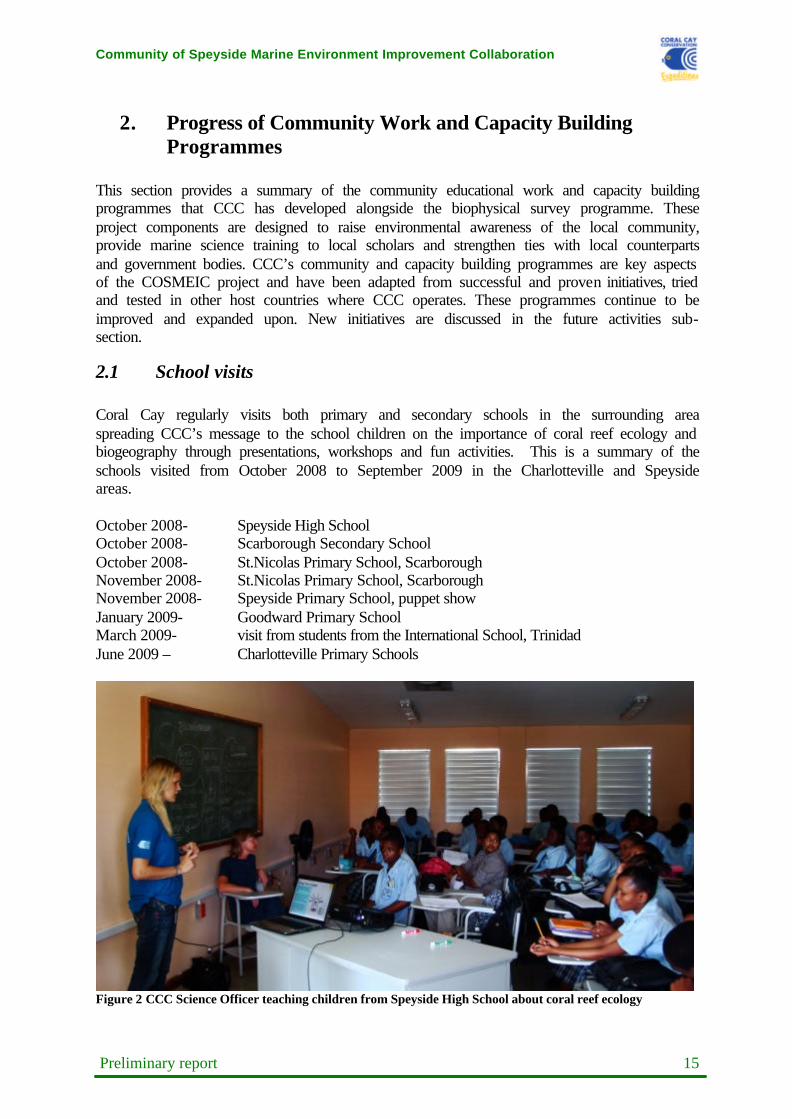
2.1 School visits Coral Cay regularly visits both primary and secondary schools in the surrounding area spreading CCC’s message to the school children on the importance of coral reef ecology and biogeography through presentations, workshops and fun activities. This is a summary of the schools visited from October 2008 to September 2009 in the Charlotteville and Speyside areas. October 2008- Speyside High School October 2008- Scarborough Secondary School October 2008- St.Nicolas Primary School, Scarborough November 2008- St.Nicolas Primary School, Scarborough November 2008- Speyside Primary School, puppet show January 2009- Goodward Primary School March 2009- visit from students from the International School, Trinidad June 2009 – Charlotteville Primary Schools
Figure 2 CCC Science Officer teaching children from Speyside High School about coral reef ecology

Community of Speyside Marine Environment Improvement Collaboration
Preliminary report 16
In the last few months Coral Cay have attended several local events such as open days and festivals to advertise the work done by CCC through lectures and often our own stalls, to show how the local communities can help to perverse their coral reefs.
• October 6th 2008 - Open Day at Esplanade in Scarborough • December 2nd- The Official COSMEIC Launch, Speyside Community Centre • December 8th 2008 – Science lecture at Bluewaters Inn, Speyside for both hotel guests
and locals (monthly lecture) • June 2009 - ‘Charlotteville Fisherman’s Festival’, CCC stall advertising summer
scholarship programmes, workshops and summer activities • June 24th & 26th 2009 - ‘Tobago Science Expo 2009’, Lowlands Mall • July 27th 2009 - ‘Tobago Heritage Festival’ • August 10th, 2009 - Charlotteville Public Library, fish mobile workshop with
schoolchildren • August 25th-26th, 2009 - Children’s science workshop at the community centre in
Speyside • August – September, 2009 – Bi-weekly coral reef movie nights in Speyside and
Charlotteville • September 19th, 2009 – International Coastal Cleanup
December 6th- ‘Family Fun Day’ Speyside Beach Facility Following on from the official launch of COSMEIC, this fun-filled day attracted a lot of community members from Speyside. The day started off with a glass bottomed boat trip out to the Coral Gardens, near Little Tobago, which was then followed by marine orientated games, such as ‘Fish Bingo’. A friendly football match followed between CCC staff and volunteers and some of the local residents with the day ending with a beach clean up involving everyone. January- ‘Environment Tobago’s Clean School Competition’ CCC was invited as honorary guests to help judge the awards. Education Officer Caroline Orr attended and said she was impressed with all the schools efforts. March 10th to 14th- COSMEIC Awareness Week As part of the COSMEIC Awareness Week, CCC gave several talks to forty children from the ‘International School’ in Trinidad, covering topics including coral disease in Tobago and the impact that humans can have on coral reefs. During the week, Coral Cay also participated in the ‘Roxborough Composite School Green Day’ along with BRT, resulting in lots of the children signing up for BRT’s ‘Sun, Sea and Science’ project for April. Following the success of the first COSMEIC ‘Family Fun Day’ in December, another one was held on the 14th. Among the activities was a highly successful beach and underwater cleanup project with four bin bags of rubbish collected from the beach as well as a substantial number of boat parts recovered from the dive volunteers. March 31st- Prize giving at Ebenezer Methodist Primary School, Roxborough CCC attended the COSMEIC Art Competition prize giving ceremony and assisted with the prize giving. CCC along with BRT awarded all of Standards 1-4 with prizes and the Ebenezer Methodist Primary School was awarded the overall prize for the 5-11 category between all the schools entered.

Community of Speyside Marine Environment Improvement Collaboration
Preliminary report 17
April - BRT’s ‘Sun, Sea & Science’ week Following the COSMEIC Awareness Week in March, 17 students from Speyside High School participated in BRT’s 4 day ‘Sun, Sea & Science’ programme in the first week of April. Some of the activities, which CCC were involved in were a fish Id lecture and a snorkeling trip to Pirates Bay, Charlotteville. May- Reef Check IYOR 2008 Song Competition The prize giving ceremony was held at St. Nicholas Primary School who were awarded US$1000 for the 1st place song and video that they filmed with the help of Samuel Archer, CCC’s Education Officer, Caroline Orr and BRT’s Barry Lovelace and Dave Elliott. Representatives from both CCC and BRT attended, as did Dr Greg Hodgson (Executive Director of Reef Check) who presented the cheque to the children. Channel 5 News filmed the ceremony and several local radio stations also attended. May- Turtle tagging & monitoring CCC organised a workshop for CCC volunteers and local residents to provide training on turtle tagging and monitoring. The workshop included lectures as well as a practical beach session where they learned how to dig turtle nests, tag and monitor the turtle eggs. June 19th- ‘Speyside Labour Day Marine Awareness March’ CCC joined locals and schoolchildren from Charlotteville and Speyside, Environment Tobago and BRT in ‘Speyside Labour Day Marine Awareness March’ as part of the COSMEIC project. They marched approximately 3km within the Speyside community with colorful banners and posters, ending at the recreational grounds where the festivities continued to help support and raise marine awareness, and in aid of World Ocean Day that was celebrated earlier in June. July 14th- COSMEIC Summer Science Seminar (SSS) COSMEIC’s SSS programme for Charlotteville and Speyside commenced raising awareness for reef protection and education. CCC helped out with the free seminars, snorkelling trips at Pirates Bay and cake baking with the school children. The weekly session allows the children to keep involved and interested over the summer holidays. August- COSMEIC Summer Science Seminar (SSS) SSS in August attracted 20 children from both Charlotteville and Speyside who participated in lectures, puppet show and cake baking. CCC volunteers also assisted with a snorkelling trip to Bluewater Bay and a glass bottomed boat trip around Charlotteville’s reefs, where the children had to try and identify as many organisms as possible following the fish ID lecture. August- ‘Speyside Shoreline Fishing Tournament’, Speyside CCC assisted in the setting up of the event, judging the tournament and a general beach cleanup. The tournament, organised by Rupert ‘Smokey’ McKenna (Community Activist), was for 5-18 year olds and was a chance for them to learn about sustainable fishing practices and to try and catch some fish. Among the prizes awarded were youngest angler and first catch of the day. The beach cleanup was highly successful with over 12 bin bags filled with rubbish.
Community of Speyside Marine Environment Improvement Collaboration
Preliminary report 18
September 15th - International Coastal Cleanup Day CCC successfully lobbied the ICC Tobago committee for Speyside to be one of the sites for the 2009 Beach Cleanup. The event was great success, with participation from Speyside cadets, football teams and community members.
2.2 CCC Scholarship Programme
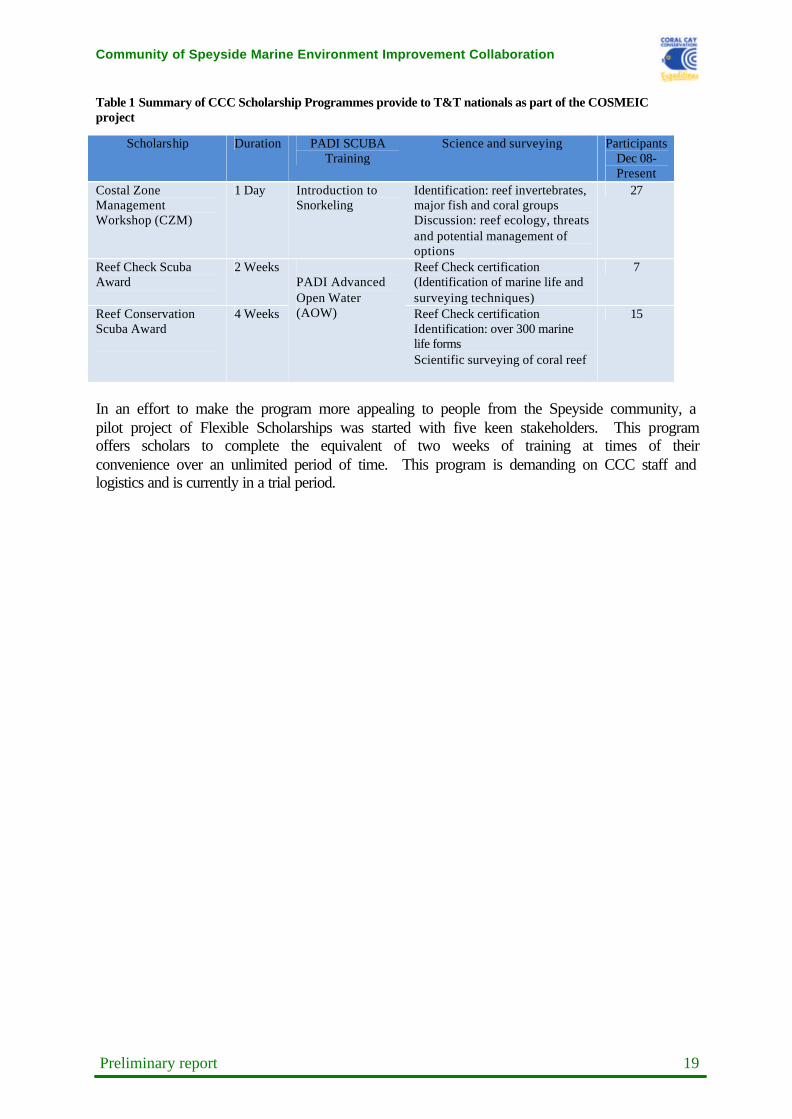
CCC Scholarship Programme CCC is currently running three scholarship programmes in Tobago. The scholarships are open to residents of Trinidad and Tobago wishing to make an active contribution towards the protection and sustainable use of Tobago’s coral reefs. This includes tourism professionals, local fishers, government employees, university students, graduates and educators. These programs were advertised on local radio, in posters, through direct solicitation and at many local events. Each programme runs once every four weeks. CCC can also run additional one-day ‘Coastal Zone Management (CZM)’ workshops for particular groups if required. The structure of these workshops is flexible and can be adapted to suit a particular audience. As of December, 2008, 15 Reef Conservation Scholars, 7 Reef Check Scholars and 27 Coastal Zone Management Scholars have been trained (Table 1). Of the Reef Conservation and Reef Check scholars, two were from Speyside, two from Charlotteville and two from elsewhere in Tobago. Names and contact details of the scholars can be obtained upon request.
The three main types of scholarships offered are:
• Coastal Zone Management Workshop (CZM)
This one-day course includes training in snorkelling, identification of reef invertebrates, major fish and coral groups plus discussions of coral reef ecology, threats to the marine environment and potential management options through a series of lectures and case studies.
• Reef Check Scuba Award This two-week award includes certification to PADI Advanced Open Water Diver, identification of target marine life forms and training in Reef Check survey techniques.
• Reef Conservation Scuba Award
This intensive four-week programme involves scholars staying at the expedition site seven days a week. Training includes PADI Advanced Open Water Diver certification, identification of over 300 marine life forms and rigorous scientific surveying of coral reef ecosystems.
Community of Speyside Marine Environment Improvement Collaboration
Preliminary report 19
Table 1 Summary of CCC Scholarship Programmes provide to T&T nationals as part of the COSMEIC project
In an effort to make the program more appealing to people from the Speyside community, a pilot project of Flexible Scholarships was started with five keen stakeholders. This program offers scholars to complete the equivalent of two weeks of training at times of their convenience over an unlimited period of time. This program is demanding on CCC staff and logistics and is currently in a trial period.
Scholarship Duration PADI SCUBA Training
Science and surveying Participants Dec 08-Present
Costal Zone Management Workshop (CZM)
1 Day Introduction to Snorkeling
Identification: reef invertebrates, major fish and coral groups Discussion: reef ecology, threats and potential management of options
27
Reef Check Scuba Award
2 Weeks Reef Check certification (Identification of marine life and surveying techniques)
7
Reef Conservation Scuba Award
4 Weeks
PADI Advanced Open Water (AOW) Reef Check certification
Identification: over 300 marine life forms Scientific surveying of coral reef
15

Community of Speyside Marine Environment Improvement Collaboration
Preliminary report 20
3. Scientific Methods
3.1 COSMEIC Baseline Surveys
History and rationale CCC’s quantitative baseline survey technique was designed to provide a comprehensive assessment of shallow coastal ecosystems quickly and effectively. Originally used on CCC projects in Fiji, it has been adapted for use on the COSMEIC. CCC survey data are used primarily to describe and classify the nature of coastal habitats. Surveys are performed mainly on the fore reef but it is sometimes necessary to conduct back reef and lagoon surveys as well. Regardless of the location on the reef, the technique used does not vary. Aerial or satellite imagery is used extensively to guide the survey work in the field, since this allows ground surveys to be positioned for efficient classification of the habitats visible on the image. Survey sites are located at set ‘stations’, every 250 meters (m) along the coastline. Surveys are conducted parallel to the reef crest, which is usually parallel to the coast. Surveys are run contiguously, and in the direction of the next survey location. For example, a survey starting at site SC01 would be conducted towards SC02. Some areas of known sandy bottoms (such as Stonehaven beach) have been omitted but otherwise, surveys are conducted every 250m between Buccoo Reef and Castara.
The survey technique has been developed in order to make it compatible with existing, regional survey methods conducted in the wider Caribbean such as AGRRA (Steneck et al. 2003) and Reef Check (www.reefcheck.org) reef monitoring protocols. This will allow us to compare and contrast results from Tobago with other island stated around the region as well as ensuring that the data collected here contributes to reef status reports around the Caribbean. Survey depths have been chosen at intervals where coral cover and diversity is generally highest. In addition to this, the 7 and 12 meter depth bands are the same as for the bleaching surveys carried out by CCC in 2005 (see O’Farrell et al., 2005). This makes it ideal for long-term monitoring of coral reef recovery around Tobago.
Figure 3 CCC volunteers learning how to identify corals as part of their Science Development Programme.
Community of Speyside Marine Environment Improvement Collaboration
Preliminary report 21
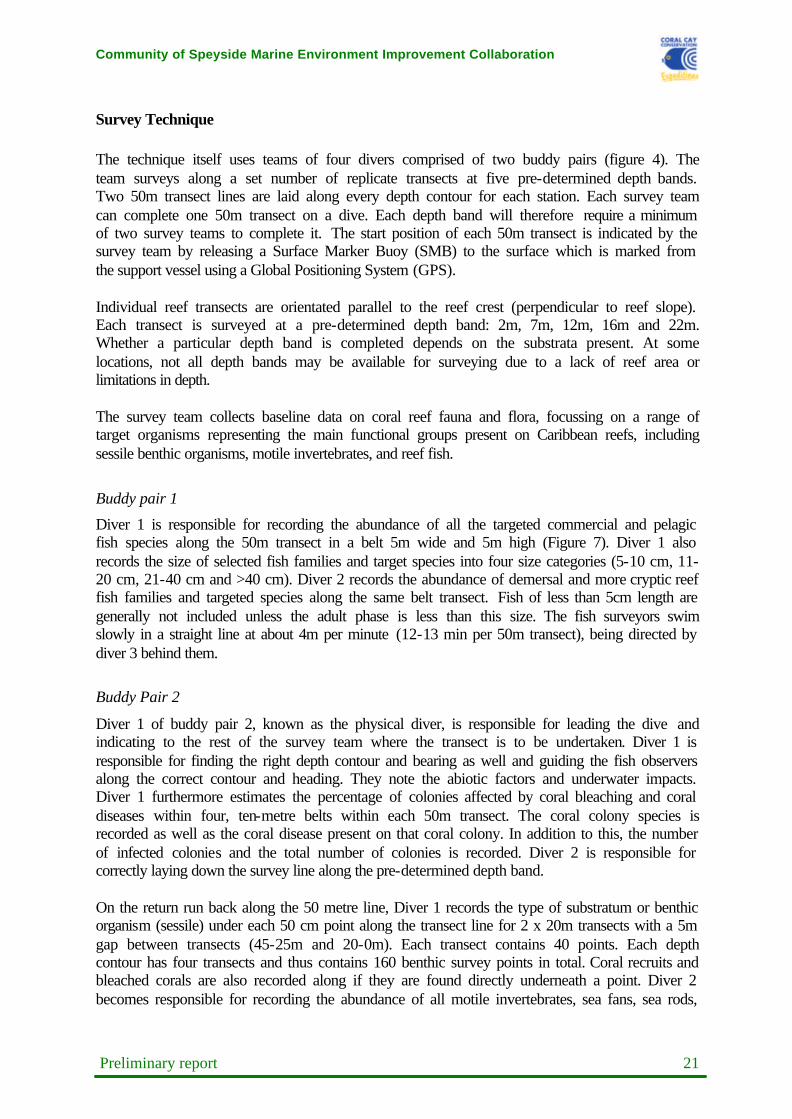
Survey Technique The technique itself uses teams of four divers comprised of two buddy pairs (figure 4). The team surveys along a set number of replicate transects at five pre-determined depth bands. Two 50m transect lines are laid along every depth contour for each station. Each survey team can complete one 50m transect on a dive. Each depth band will therefore require a minimum of two survey teams to complete it. The start position of each 50m transect is indicated by the survey team by releasing a Surface Marker Buoy (SMB) to the surface which is marked from the support vessel using a Global Positioning System (GPS). Individual reef transects are orientated parallel to the reef crest (perpendicular to reef slope). Each transect is surveyed at a pre-determined depth band: 2m, 7m, 12m, 16m and 22m. Whether a particular depth band is completed depends on the substrata present. At some locations, not all depth bands may be available for surveying due to a lack of reef area or limitations in depth. The survey team collects baseline data on coral reef fauna and flora, focussing on a range of target organisms representing the main functional groups present on Caribbean reefs, including sessile benthic organisms, motile invertebrates, and reef fish.
Buddy pair 1
Diver 1 is responsible for recording the abundance of all the targeted commercial and pelagic fish species along the 50m transect in a belt 5m wide and 5m high (Figure 7). Diver 1 also records the size of selected fish families and target species into four size categories (5-10 cm, 11-20 cm, 21-40 cm and >40 cm). Diver 2 records the abundance of demersal and more cryptic reef fish families and targeted species along the same belt transect. Fish of less than 5cm length are generally not included unless the adult phase is less than this size. The fish surveyors swim slowly in a straight line at about 4m per minute (12-13 min per 50m transect), being directed by diver 3 behind them.
Buddy Pair 2
Diver 1 of buddy pair 2, known as the physical diver, is responsible for leading the dive and indicating to the rest of the survey team where the transect is to be undertaken. Diver 1 is responsible for finding the right depth contour and bearing as well and guiding the fish observers along the correct contour and heading. They note the abiotic factors and underwater impacts. Diver 1 furthermore estimates the percentage of colonies affected by coral bleaching and coral diseases within four, ten-metre belts within each 50m transect. The coral colony species is recorded as well as the coral disease present on that coral colony. In addition to this, the number of infected colonies and the total number of colonies is recorded. Diver 2 is responsible for correctly laying down the survey line along the pre-determined depth band. On the return run back along the 50 metre line, Diver 1 records the type of substratum or benthic organism (sessile) under each 50 cm point along the transect line for 2 x 20m transects with a 5m gap between transects (45-25m and 20-0m). Each transect contains 40 points. Each depth contour has four transects and thus contains 160 benthic survey points in total. Coral recruits and bleached corals are also recorded along if they are found directly underneath a point. Diver 2 becomes responsible for recording the abundance of all motile invertebrates, sea fans, sea rods,

Community of Speyside Marine Environment Improvement Collaboration
Preliminary report 22
black corals, sea plumes and anemones on the return run. This is done along two 20 m belts, which are 2m wide (45-25m and 20-0m). During the course of each survey, certain oceanographic data and observations of obvious anthropogenic impacts and activities are recorded at depth by the divers and from the surface support vessel. Sea surface temperature, tide level and a salinity sample are taken from the survey boat. The survey team below records the depth of the transect, the temperature at the maximum survey depth (i.e. at the start of the survey), reef rugosity and the reef zone. Visibility, a surrogate for turbidity (sediment load) is recorded both vertically and horizontally. A Secchi disc is used to measure the vertical visibility. Horizontal visibility through the water column is measured by divers’ estimates while underwater. A water sample is taken at the survey depth to measure salinity after the survey. Survey divers qualitatively assess the strength and direction of water currents at each survey site. Similarly, the boat marshal on the support vessel qualitatively estimates the strength and direction of the wind at each survey site. Cloud cover is measured by the boat marshal on a scale of 1 to 8 Octas. Natural and anthropogenic impacts are assessed both from the surface from the survey boat and at depth by the divers during each survey. Surface impacts are categorised as ‘driftwood’, ‘algae’, ‘litter’, ‘sewage’, ‘nets’ and ‘other’. Sub-surface impacts are categorised as ‘coral fragmentation’, ‘major overgrowth’, ‘fish bite damage’, ‘litter’, ‘human’ and ‘other’. All data is collected as ‘present/absent’ and then converted to binary data for analysis. Any boats seen during a survey are recorded along with information on the number of occupants and its activity. Data from each survey are recorded onto data forms and checked prior to being entered into the database, which is compatible with a range of Geographical Information Systems (GIS) software used for data analysis.

Community of Speyside Marine Environment Improvement Collaboration
Preliminary report 23
Figure 4 Schematic representation of COSMEIC baseline surveys conducted at each depth band.
3.3 Data Analysis In order to analyse outputs from reef surveys and make comparisons between sites, some of the sand surveys were omitted from the analysis. As a rule, only those surveys where there was >5% hard coral cover were included in the reef survey analysis. In total, 99 reef surveys were included (see results). Comparisons between benthic composition, coral cover and coral diversity were made using data from 2005 bleaching assessments conducted by CCC and BRT with recent data from the TCEMP. Only those surveys which were conducted on the same depth bands and locations were used for these comparisons. Where relevant, comparisons of fish and benthic abundance and diversity were made with similar data collected from Bonaire National Park, Dutch Antilles, in 2007 using AGGRA methodologies (Steneck et al., 2007). This allowed us to compare and contrast reef health indicators from Tobago’s Caribbean coast and Speyside to a well-managed island of similar size in the Caribbean.
Community of Speyside Marine Environment Improvement Collaboration
Preliminary report 24
All data analysis was carried out using Microsoft Excel and Minitab. Fish abundances were converted to biomass (kg/ha) using published length weight relationships from FishBase (www.fishbase.org). One-way ANOVA was used to test for differences between samples after testing for a normal distribution. Samples were converted to a normal distribution through an angular or Log10 transformation. Fisher’s Least Significant Difference Test was used to see which samples were significantly different from which. If data could not be transformed to a normal distribution, a non-parametric Kruskal-Wallis test was used to test for significant differences. If these were found, further investigations were done with a pairwise Mann-Whitney U test. A Pearsons Correlation Analysis was used to test for relationships between two variables.
3.4 Geographical Information System Survey data is entered into a database, which is connected to GIS software where it can then be manipulated geographically. Once appropriate analysis techniques have been applied to the data, managers and decision makers can use the final product to make informed decisions concerning coastal zone management. The visual nature of GIS outputs facilitates the interpretation of such data by non-technical persons who may nonetheless be key decision-makers. CCC divers record the start position of each survey with a handheld GPS unit, which allows the surveys to be positioned relative to each other on a satellite image. Relationships between the data from various survey sites can then be explored to highlight geographical regions of key interest. Information can be represented in many ways in a GIS, from simple placement techniques (“this was found here”) to more intricate mapping techniques such as data contour mapping (“this area is ‘better’ than that area”). It is important to bear in mind that the outputs are produced from the data themselves; the maps are not merely ‘coloured in’ at particular places. This is because the GIS links the map and the database intrinsically, and any data that are required for visual examination can be ‘called up’ on the screen. GIS is therefore not just a mapmaker; it is a tool that allows ongoing interaction between the decision maker and the data. When further geographic/ ecological data are gathered in the future, they can be added to the GIS, making a custom built instrument for visual interpretation of any data that can be represented at any point on Earth, above or below the sea. When sufficient data has been collected for a sector of coastline, extensive habitat maps can be created. The GIS contour maps contained in this report were created using the Inverse Distance Weighted function in the Spatial Analyst of ArcView 9.2 (ESRI software).

Community of Speyside Marine Environment Improvement Collaboration
Preliminary report 25
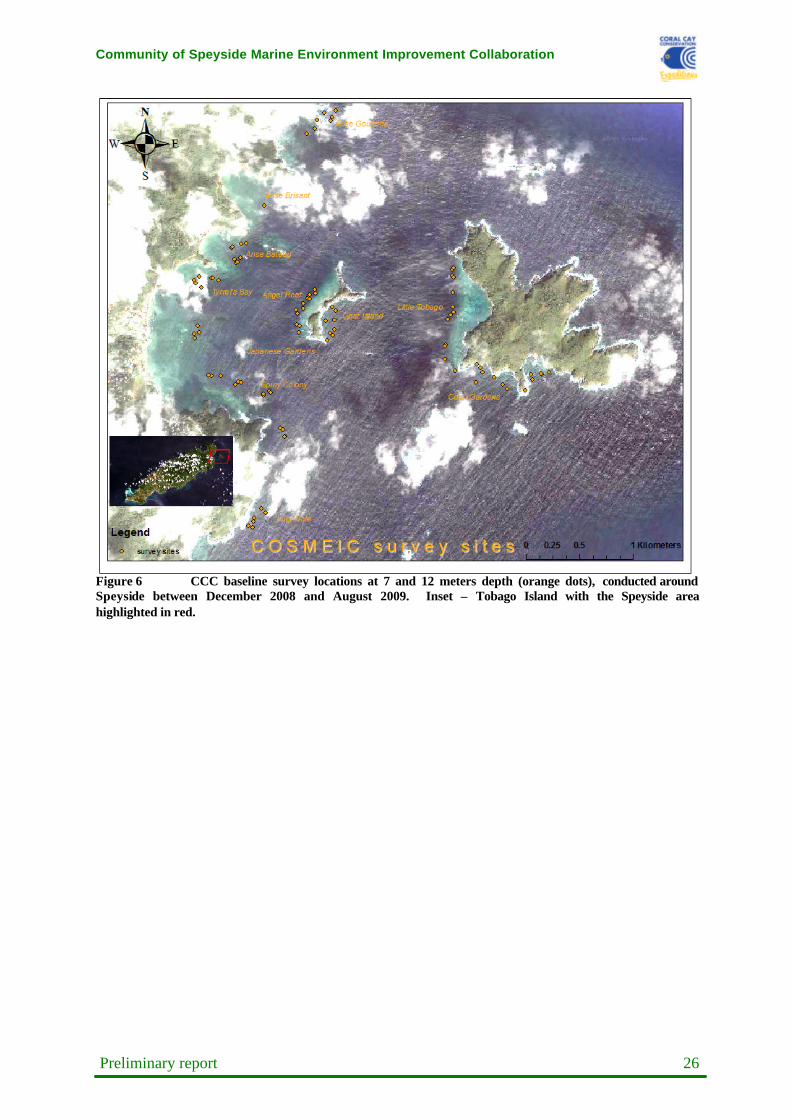
3.5 Survey Progress Between December of 2008 and August of 2009, CCC survey teams conducted 99, 50-metre transects at 7 and 12 meters depth on the fringing coral reefs around Speyside. Figure 5 illustrates the total number of surveys completed each month over the 9-month survey period of the COSMEIC. Figure 6 displays the locations of those surveys around Speyside.
Surveys completed in Speyside
0102030405060708090
100
Dec-08
Jan-09
Feb-09
Mar-09
Apr-09
May-09
Jun-09
Jul-09
Aug-09
month
# o
f su
rvey
s
monthly surveys
total
Figure 5 Number of CCC baseline surveys conducted between December of 2008 and August of 2009. The blue line is the cumulative number of surveys completed. The bars are the number of surveys completed each month.
Community of Speyside Marine Environment Improvement Collaboration
Preliminary report 26
Figure 6 CCC baseline survey locations at 7 and 12 meters depth (orange dots), conducted around Speyside between December 2008 and August 2009. Inset – Tobago Island with the Speyside area highlighted in red.

Community of Speyside Marine Environment Improvement Collaboration
Preliminary report 27
4. Results Certain target taxa or abiotic categories have been shown to be effective indicators of overall reef health (Hodgson, 1999) and a number of these have been selected here to outline initial findings. Depending on the particular target, these variables can indicate a history of overfishing, nutrient pollution, sedimentation and the removal of organisms for the curio or aquarium trade. In this analysis, the indicator organisms have been adapted from those defined by the Reef Check Foundation (Hodgson, 1999) as well as those used in a report by Steneck et al., 2007. These indicators are recognised as robust gauges of general reef health. In addition to these indicators, some focus has also been given to coral disease prevalence in the area, as this is currently a subject of great concern for the reefs of Tobago. The outputs from these surveys are in graphical and GIS format and aim to provide a general picture of the status of coral reefs around Speyside and draw management recommendations from this. Where useful, comparisons have been made with surveys done previously at selected sites around Tobago after the bleaching event of 2005 and around the Caribbean side as part of TCEMP in 2007/2008. In some cases, comparisons have been made with the Bonaire National Park in the Dutch Antilles. This is a well managed marine park, established in 1979 making it a good case study for comparisons with Speyside. The depth contours analysed were at 7 and 12 meters as these provided the most consistent datasets. Some surveys were completed at 16 meters and these will be included in the analysis allowing for a more complete assessment of Speyside’s reefs to take place.

Community of Speyside Marine Environment Improvement Collaboration
Preliminary report 28
4.1 Benthic Composition The most common benthic substratum found at both depths and surveys were coral, macroalgae and sand although there was a high variation between sites and depths. Figure 7 shows the composition of benthic substrata at both bands for selected reef sites. Hard coral cover is investigated further in the next section. Algae species have been pooled into 2 functionally important groups – (macro) algae and micro-algae (also known as turf algae). Reef sites at 12 meters depth had higher algal coverage than sites at 7 meters. Many Caribbean coral reefs have become macroalgae dominated reefs since the 1980s, undergoing ‘phase shifts’ from a coral dominated to an algae dominated state (see Gardner et al., 2003, Bak et al., 2005). Macroalage cover for selected sites consisted mostly of Dictyota species and was high for many of the sites surveyed (16%), particularly around Lucy Vale. Macroalgae coverage was also higher on average than the Caribbean side reefs (~5% vs. 16% resp.). These results indicate that Speyside’s reefs still have less macroalgal coverage than most other Caribbean reefs where many reefs have become algae dominated and mean macroalgae cover lies around 23%. Bonaire’s reefs average about 5% macroalgae cover but have higher coral cover (see next section). Bare substrate (rock) coverage was low (~8%) when compared to Caribbean side reefs (~44%). These are potentially suitable habitats for settlement of coral recruits and therefore important substrates for any reef recovery. The ‘Other animals’ category includes Octocoral species and Seafans. These were further assessed by means of a belt transect.
a. Benthic composition at 7m
0%
20%
40%
60%
80%
100%
Ange
l Ree
f
Anse
Batea
u
Coral G
arden
s
Goat Is
land
Anse
Goulem
e
Japa
nese
Gard
ens
Little T
obag
o
Lucy
Vale
Spiny
Colony
Tyrre
l's Ba
y
per
cen
t co
ver
Tunicate
Sponge
Silt
Sea Grass
Rubble
Recently Killed Coral
Micro-Algae
Other animal
Rock
Sand
Algae
Hard Coral

Community of Speyside Marine Environment Improvement Collaboration
Preliminary report 29
b. Benthic composition at 12m
0%
20%
40%
60%
80%
100%
Ange
l Ree
f
Anse
Batea
u
Coral G
arden
s
Goat Is
land
Anse
Goulem
e
Japa
nese
Gard
ens
Little T
obag
o
Lucy
Vale
Spiny
Colony
Tyrre
l's Bay
per
cen
t co
ver
Tunicate
Sponge
Silt
Sea Grass
Rubble
Recently Killed Coral
Micro-Algae
Other animal
Rock
Sand
Algae
Hard Coral
Figure 7 Benthic composition several key reef sites around Speyside at 7m (a.) and 12m (b.) survey depths.

Community of Speyside Marine Environment Improvement Collaboration
Preliminary report 30
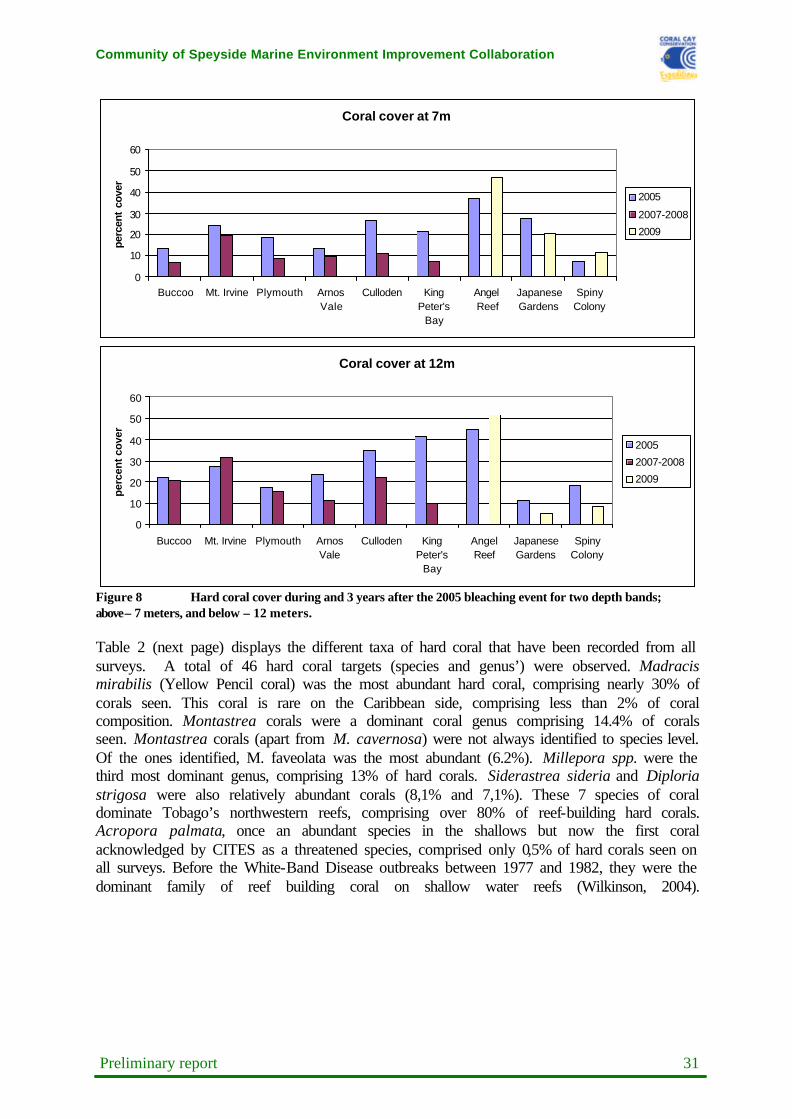
4.2 Coral Cover Hard (scleractinian) coral cover on the Caribbean side has shown to be declining since CCC conducted reef surveys to assess the bleaching impact on Tobago’s reefs in 2005 (see van Bochove et al., 2008). Figure 8 shows mean coral coverage at 7 and 12 meters over 3 survey periods for sites on both the Caribbean side and Speyside. No surveys were conducted in Speyside during the second survey period (2007-2008) but comparisons can be made with 2005 surveys. Comparisons between surveys conducted during the 2005 bleaching event and baseline surveys over 2008-2009 at the same sites and depth indicate that mean coral cover has remained the same at both 7 meters (24% in 2005 and 26% in 2009) and 12 meters (25% and 22% resp.). There is some variation between sites but these can easily be attributed to a slight variation in the exact survey locations. As coral cover is considered to be a good indicator for reef health, this underlines the resilience of Speyside’s reefs compared to those on the Caribbean side. The Caribbean average for coral cover was around 10% in 2003 (Gardner et al., 2003) and is probably lower now. Speyside’s reefs are therefore quite unique although comparisons with the well-managed reefs of Bonaire reveal that Tobago’s coral cover is below the 7-year mean coral cover of 47%.
Community of Speyside Marine Environment Improvement Collaboration
Preliminary report 31
Coral cover at 7m
0
10
20
30
40
50
60
Buccoo Mt. Irvine Plymouth ArnosVale
Culloden KingPeter's
Bay
AngelReef
JapaneseGardens
SpinyColony
perc
ent
cove
r
2005
2007-2008
2009
Coral cover at 12m
0
10
20
30
40
50
60
Buccoo Mt. Irvine Plymouth ArnosVale
Culloden KingPeter's
Bay
AngelReef
JapaneseGardens
SpinyColony
perc
ent c
over
2005
2007-2008
2009
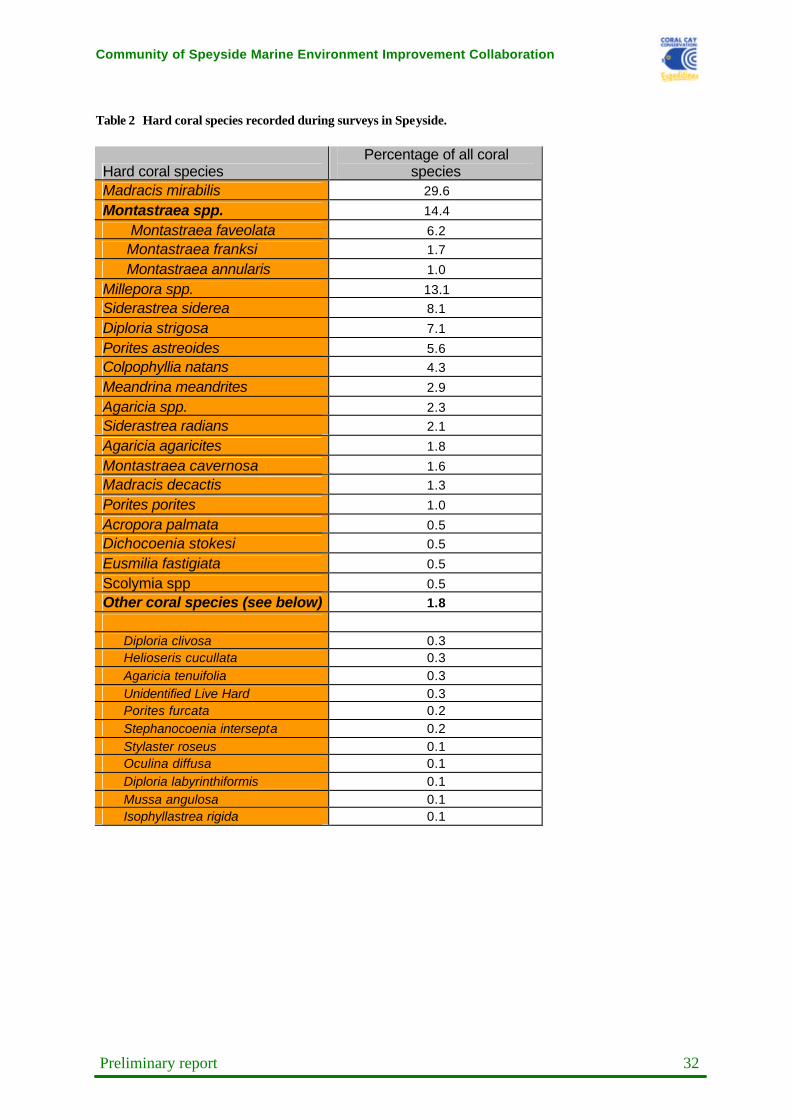
Figure 8 Hard coral cover during and 3 years after the 2005 bleaching event for two depth bands; above– 7 meters, and below – 12 meters. Table 2 (next page) displays the different taxa of hard coral that have been recorded from all surveys. A total of 46 hard coral targets (species and genus’) were observed. Madracis mirabilis (Yellow Pencil coral) was the most abundant hard coral, comprising nearly 30% of corals seen. This coral is rare on the Caribbean side, comprising less than 2% of coral composition. Montastrea corals were a dominant coral genus comprising 14.4% of corals seen. Montastrea corals (apart from M. cavernosa) were not always identified to species level. Of the ones identified, M. faveolata was the most abundant (6.2%). Millepora spp. were the third most dominant genus, comprising 13% of hard corals. Siderastrea sideria and Diploria strigosa were also relatively abundant corals (8,1% and 7,1%). These 7 species of coral dominate Tobago’s northwestern reefs, comprising over 80% of reef-building hard corals. Acropora palmata, once an abundant species in the shallows but now the first coral acknowledged by CITES as a threatened species, comprised only 0,5% of hard corals seen on all surveys. Before the White-Band Disease outbreaks between 1977 and 1982, they were the dominant family of reef building coral on shallow water reefs (Wilkinson, 2004).
Community of Speyside Marine Environment Improvement Collaboration
Preliminary report 32
Table 2 Hard coral species recorded during surveys in Speyside.
Hard coral species Percentage of all coral
species Madracis mirabilis 29.6
Montastraea spp. 14.4
Montastraea faveolata 6.2 Montastraea franksi 1.7
Montastraea annularis 1.0
Millepora spp. 13.1 Siderastrea siderea 8.1
Diploria strigosa 7.1
Porites astreoides 5.6 Colpophyllia natans 4.3
Meandrina meandrites 2.9
Agaricia spp. 2.3 Siderastrea radians 2.1
Agaricia agaricites 1.8
Montastraea cavernosa 1.6 Madracis decactis 1.3
Porites porites 1.0
Acropora palmata 0.5 Dichocoenia stokesi 0.5
Eusmilia fastigiata 0.5
Scolymia spp 0.5 Other coral species (see below) 1.8
Diploria clivosa 0.3 Helioseris cucullata 0.3 Agaricia tenuifolia 0.3 Unidentified Live Hard 0.3 Porites furcata 0.2 Stephanocoenia intersepta 0.2 Stylaster roseus 0.1 Oculina diffusa 0.1 Diploria labyrinthiformis 0.1 Mussa angulosa 0.1 Isophyllastrea rigida 0.1

Community of Speyside Marine Environment Improvement Collaboration
Preliminary report 33
Figures 9 and 10 show the coral diversity and coral cover of the same reefs sites surveyed in 2005 and 2009. No significant changes were found in either coral diversity or coral cover. This is in contrast to the Caribbean side where coral cover dropped significantly over the same period.
Hard Coral Species
0
12
34
56
78
7m 12m
Depth
# of
Spe
cies
2005
2009
Figure 9 Hard coral diversity for the same survey sites in 2005 and 2007 at 7 and 12 meters. Error bars indicate standard deviation.
Live Hard Coral Cover
0
10
20
30
40
50
60
70
7m 12m
Depth
% o
f C
ove
r
2005
2009
Figure 10 Hard coral cover for the same survey sites in 2005 and 2007 at 7 and 12 meters. Error bars indicate standard deviation.
Community of Speyside Marine Environment Improvement Collaboration
Preliminary report 34
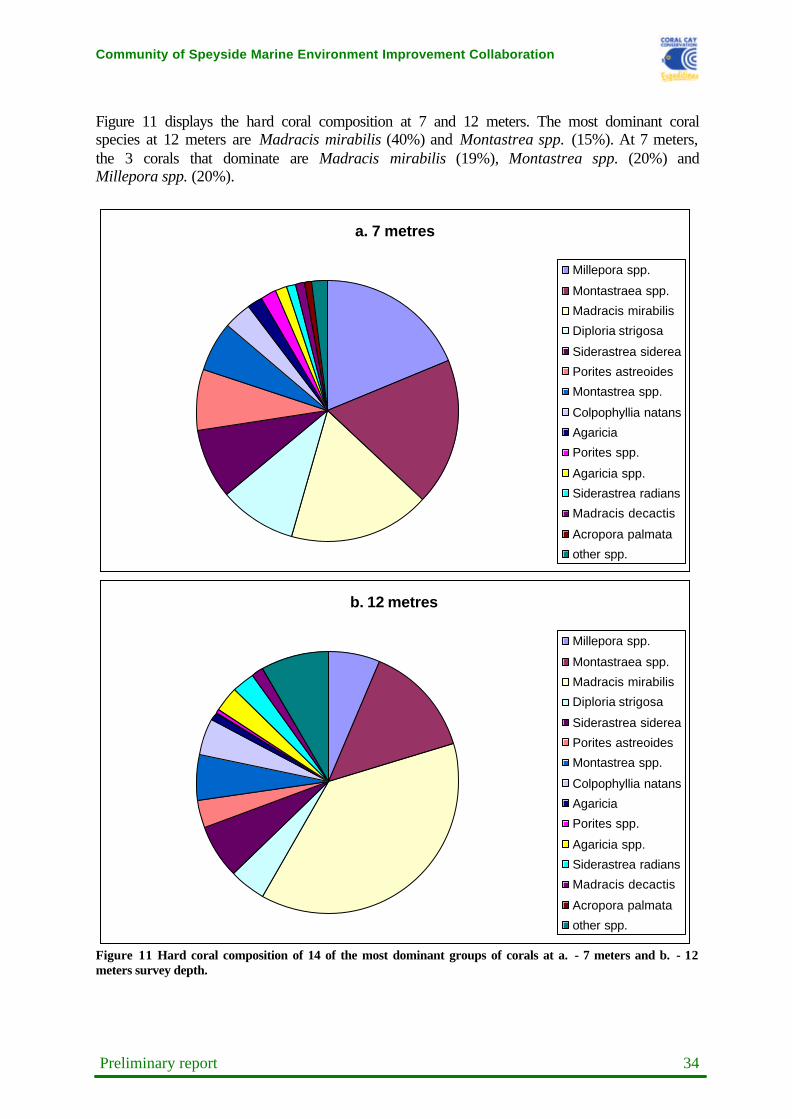
Figure 11 displays the hard coral composition at 7 and 12 meters. The most dominant coral species at 12 meters are Madracis mirabilis (40%) and Montastrea spp. (15%). At 7 meters, the 3 corals that dominate are Madracis mirabilis (19%), Montastrea spp. (20%) and Millepora spp. (20%).
a. 7 metres
Millepora spp.
Montastraea spp.
Madracis mirabilis
Diploria strigosa
Siderastrea siderea
Porites astreoides
Montastrea spp.
Colpophyllia natans
Agaricia
Porites spp.
Agaricia spp.
Siderastrea radians
Madracis decactis
Acropora palmata
other spp.
b. 12 metres
Millepora spp.
Montastraea spp.
Madracis mirabilis
Diploria strigosa
Siderastrea siderea
Porites astreoides
Montastrea spp.
Colpophyllia natans
Agaricia
Porites spp.
Agaricia spp.
Siderastrea radians
Madracis decactis
Acropora palmata
other spp.
Figure 11 Hard coral composition of 14 of the most dominant groups of corals at a. - 7 meters and b. - 12 meters survey depth.
Community of Speyside Marine Environment Improvement Collaboration
Preliminary report 35
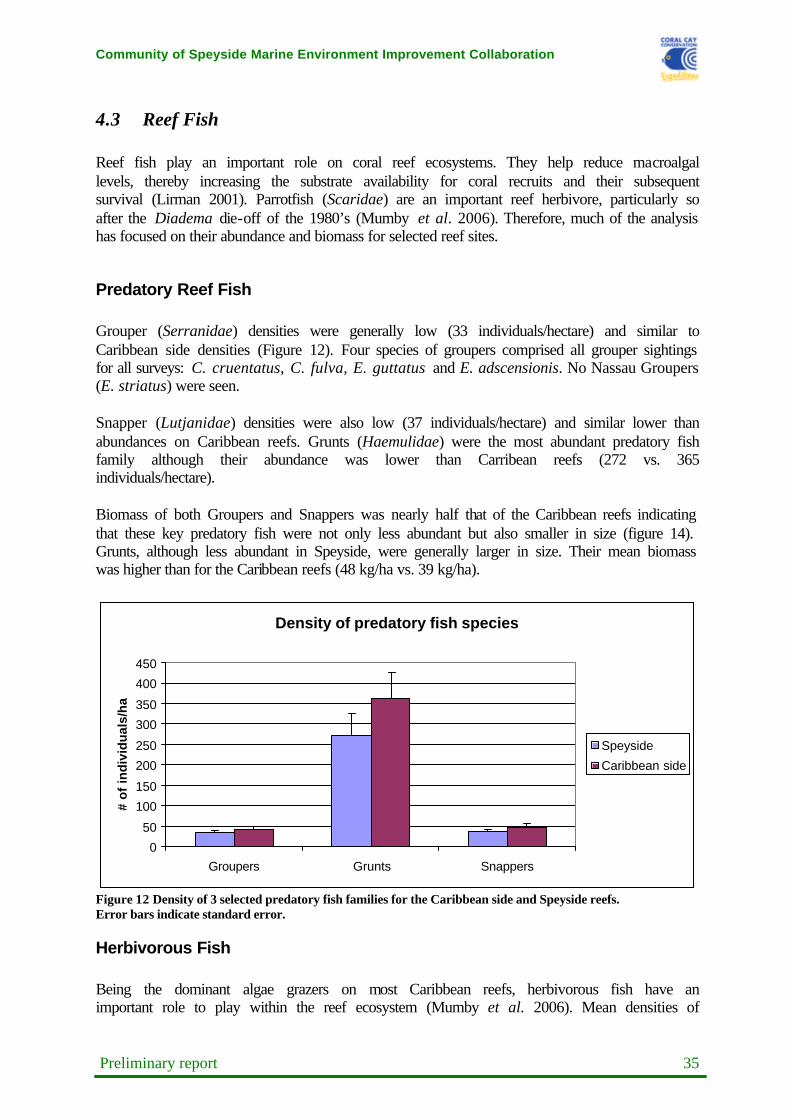
4.3 Reef Fish Reef fish play an important role on coral reef ecosystems. They help reduce macroalgal levels, thereby increasing the substrate availability for coral recruits and their subsequent survival (Lirman 2001). Parrotfish (Scaridae) are an important reef herbivore, particularly so after the Diadema die-off of the 1980’s (Mumby et al. 2006). Therefore, much of the analysis has focused on their abundance and biomass for selected reef sites.
Predatory Reef Fish Grouper (Serranidae) densities were generally low (33 individuals/hectare) and similar to Caribbean side densities (Figure 12). Four species of groupers comprised all grouper sightings for all surveys: C. cruentatus, C. fulva, E. guttatus and E. adscensionis. No Nassau Groupers (E. striatus) were seen. Snapper (Lutjanidae) densities were also low (37 individuals/hectare) and similar lower than abundances on Caribbean reefs. Grunts (Haemulidae) were the most abundant predatory fish family although their abundance was lower than Carribean reefs (272 vs. 365 individuals/hectare). Biomass of both Groupers and Snappers was nearly half that of the Caribbean reefs indicating that these key predatory fish were not only less abundant but also smaller in size (figure 14). Grunts, although less abundant in Speyside, were generally larger in size. Their mean biomass was higher than for the Caribbean reefs (48 kg/ha vs. 39 kg/ha).
Density of predatory fish species
0
50
100
150
200
250
300
350
400
450
Groupers Grunts Snappers
# o
f in
div
idu
als/
ha
Speyside
Caribbean side
Figure 12 Density of 3 selected predatory fish families for the Caribbean side and Speyside reefs. Error bars indicate standard error.
Herbivorous Fish Being the dominant algae grazers on most Caribbean reefs, herbivorous fish have an important role to play within the reef ecosystem (Mumby et al. 2006). Mean densities of

Community of Speyside Marine Environment Improvement Collaboration
Preliminary report 36
Parrotfish (Scaridae) were around 420 individuals per hectare (Figure 13). This is half of the parrotfish abundance of Caribbean side reefs (893 individuals per hectare). For Surgeonfish (Acanthuridae), another important reef grazer, this was about 560 individuals per hectare, which is similar to Caribbean side reefs (523 individuals per hectare).
Density of herbivorous fish species
0
200
400
600
800
1000
1200
Surgeonfish Parrotfish
# o
f in
div
idu
als/
ha
Speyside
Caribbean side
Figure 13 Density of Surgeonfish and Parrotfish for the Caribbean side and Speyside reefs. Error bars indicate standard error. Average Parrotfish biomass for the selected sites was lower in Speyside (87 kg/ha) than for the Caribbean side reefs (156 kg/ha). Overall, the biomass of commercially targeted fish in Speyside was 255 kg/ha. This is very similar to the Caribbean side reefs where biomass was (263 kg/ha).
Commercial fish biomass
0
50
100
150
200
250
300
350
Parro
tfish
Groupe
rs
Snap
pers
Grunts
Total_
commerc
ial_fish
Bio
mas
s (k
g/h
a)
Speyside
Caribbean Side
Figure 14 Commercial fish biomass for 4 selected families for the Caribbean side and Speyside reefs. Error bars indicate standard error.

Community of Speyside Marine Environment Improvement Collaboration
Preliminary report 37
4.4 Invertebrates A number of important invertebrate indicator species have been selected which are either commercially harvested or ecologically important. Comparisons between local abundances and those of well-managed reefs of other Caribbean island states give an indication of the current status of these important reef inhabitants. Long-spine sea urchins (Diadema antillarum) were recorded in two categories, namely “Adult” and “Juvenile” in order to monitor the recovery of these sea urchins after the disease outbreak in the 1980’s, which killed over 90% of them. A high proportion of juveniles to adults is generally a good indication of population recovery. Major population changes can possibly highlight shifts in the ecological balance of the ecosystem. A sudden decrease in Diadema populations may result in overgrowth by macroalgae, outcompeting corals for light and space on the reef. Diadema antillarum densities between and within sites were highly variable but overall combined abundance was about 38 individuals/ha for surveys conducted around Speyside (Juveniles and Adults combined, Figure 15). Ratios of juveniles to adults were similar for both regions. Abundances were less than for the Caribbean reefs (73 individuals/ha) but higher than Diadema numbers found around Bonaire National Park in the Dutch Antilles where mean abundances of 15 individuals/ha were found at similar survey depth (10 meters) in 2007 (Steneck et al. 2008). In 2005, no Diadema’s were seen on 84 reef surveys in Tobago.
Long-spine sea urchin abundance
0
5
10
15
20
25
30
35
40
45
Long Spined Juvenile Long Spined Adult
# pe
r he
ctar
e
Speyside
Caribbean side
Figure 15 Abundance of adult and juvenile of Long-spine Sea Urchins for the Caribbean side and Speyside reefs. Key indicator species of invertebrates were pooled for all survey sites and depths, as abundances of most of these were very low (Figure 16). Pencil Urchins (Eucidaris tribuloides), Banded Coral Shrimps (Eucidaris tribuloides) and Queen Conch (Strombus gigas) species are often harvested for the curio trade and are becoming increasingly rare. Pencil Urchins were rare (>1 per hectare), particularly compared to Caribbean side reefs. Banded Coral Shrimps (13 per hectare), were more abundant. Queen Conch’s were recorded on one of the 99 surveys indicating severe over-harvesting of these gastropods.
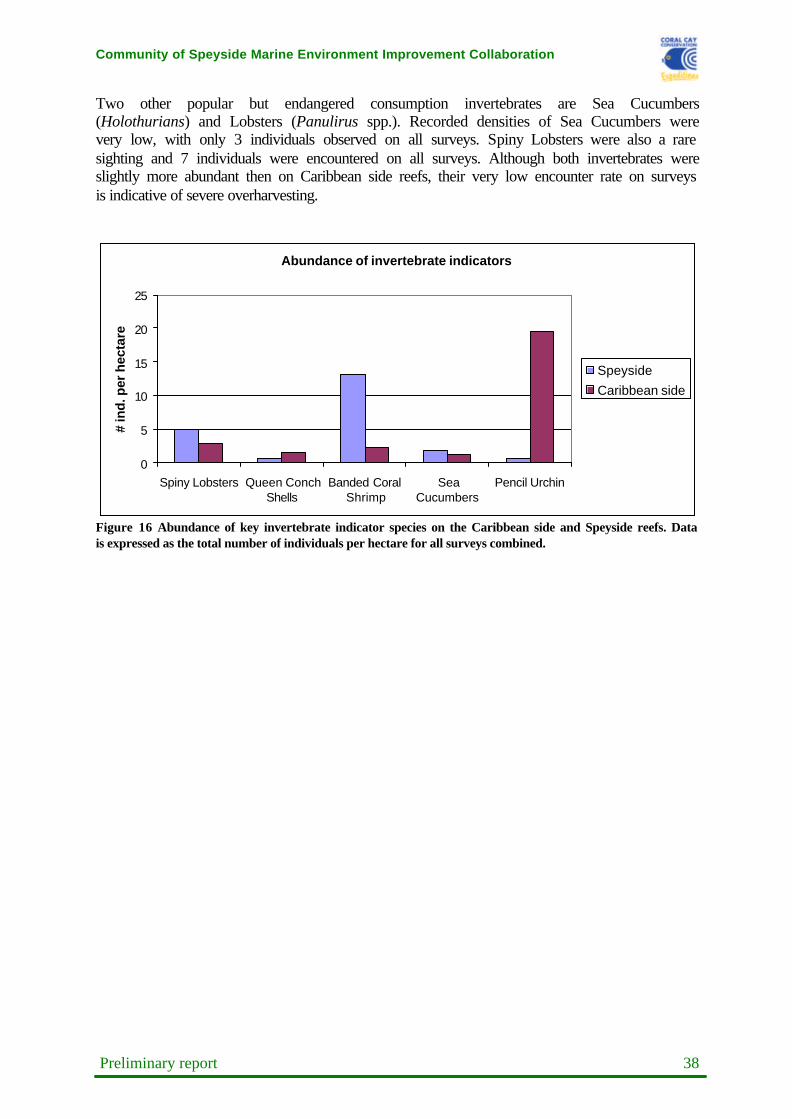
Community of Speyside Marine Environment Improvement Collaboration
Preliminary report 38
Two other popular but endangered consumption invertebrates are Sea Cucumbers (Holothurians) and Lobsters (Panulirus spp.). Recorded densities of Sea Cucumbers were very low, with only 3 individuals observed on all surveys. Spiny Lobsters were also a rare sighting and 7 individuals were encountered on all surveys. Although both invertebrates were slightly more abundant then on Caribbean side reefs, their very low encounter rate on surveys is indicative of severe overharvesting.
Abundance of invertebrate indicators
0
5
10
15
20
25
Spiny Lobsters Queen ConchShells
Banded CoralShrimp
SeaCucumbers
Pencil Urchin
# in
d. p
er h
ecta
re
Speyside
Caribbean side
Figure 16 Abundance of key invertebrate indicator species on the Caribbean side and Speyside reefs. Data is expressed as the total number of individuals per hectare for all surveys combined.
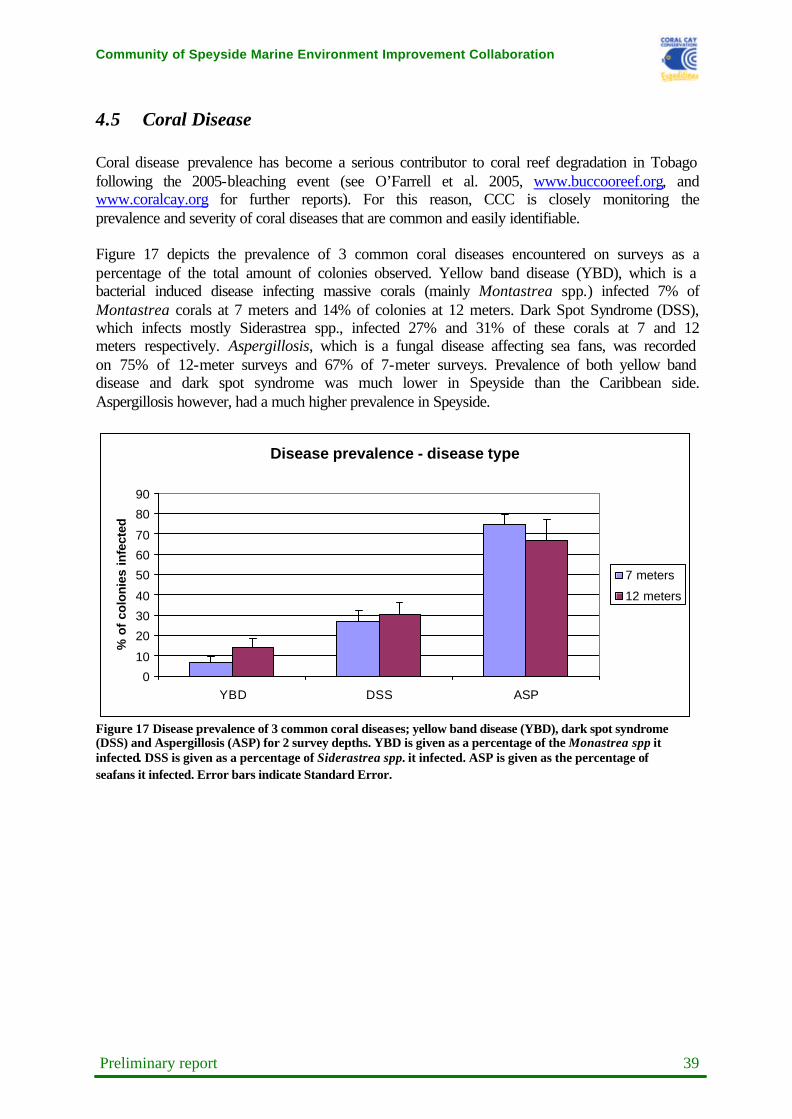
Community of Speyside Marine Environment Improvement Collaboration
Preliminary report 39
4.5 Coral Disease Coral disease prevalence has become a serious contributor to coral reef degradation in Tobago following the 2005-bleaching event (see O’Farrell et al. 2005, www.buccooreef.org, and www.coralcay.org for further reports). For this reason, CCC is closely monitoring the prevalence and severity of coral diseases that are common and easily identifiable. Figure 17 depicts the prevalence of 3 common coral diseases encountered on surveys as a percentage of the total amount of colonies observed. Yellow band disease (YBD), which is a bacterial induced disease infecting massive corals (mainly Montastrea spp.) infected 7% of Montastrea corals at 7 meters and 14% of colonies at 12 meters. Dark Spot Syndrome (DSS), which infects mostly Siderastrea spp., infected 27% and 31% of these corals at 7 and 12 meters respectively. Aspergillosis, which is a fungal disease affecting sea fans, was recorded on 75% of 12-meter surveys and 67% of 7-meter surveys. Prevalence of both yellow band disease and dark spot syndrome was much lower in Speyside than the Caribbean side. Aspergillosis however, had a much higher prevalence in Speyside.
Disease prevalence - disease type
0
10
20
30
40
50
60
70
80
90
YBD DSS ASP
% o
f co
loni
es in
fect
ed
7 meters
12 meters
Figure 17 Disease prevalence of 3 common coral diseases; yellow band disease (YBD), dark spot syndrome (DSS) and Aspergillosis (ASP) for 2 survey depths. YBD is given as a percentage of the Monastrea spp it infected. DSS is given as a percentage of Siderastrea spp. it infected. ASP is given as the percentage of seafans it infected. Error bars indicate Standard Error.

Community of Speyside Marine Environment Improvement Collaboration
Preliminary report 40
Figure 18 shows the prevalence of all diseases combined on two major reef building families – Brain corals and Montastrea spp. Less than 10% of brain corals were infected by coral disease. The disease prevalence for Montastrea spp. was slightly higher with 11% of colonies being infected. Overall disease prevalence on all hard coral species combined was 9% at 7 meters and 13% at 12 meters. This is much lower than disease prevalence on the Caribbean side where overall disease prevalence was estimated to be 60% at 7 meters and 38% at 12 meters.
Disease prevalence - coral family
0
2
4
6
8
10
12
14
16
18
Brain corals Montastrea spp. All corals
% o
f co
loni
er in
fect
ed
7 meters
12 meters
Figure 18 Disease prevalence on 2 main coral family types; brain corals and montastrea corals. The third columns represent the total number of hard coral colonies infected by a coral disease. Results given for two survey depths. Error bars indicate Standard Error. Although NOAA has given several bleaching warnings for Tobago’s waters, no major bleaching episodes have taken place since the mass-bleaching event affected the islands reefs in 2005 (http://coralreefwatch.noaa.gov/satellite/bleachingoutlook/index.html). Coral bleaching was more often a result of high sedimentation levels smothering corals then major oscillations in temperature or UV stress.

Community of Speyside Marine Environment Improvement Collaboration
Preliminary report 41
5. GIS Contour Mapping The previous sections provided information on average values for selected ecological criteria around Speyside, Tobago. However, the data in this format does not pinpoint exactly where in the survey area there are high densities of reef fish or invertebrates or the parts of the reef systems with high coral cover. Because the location of each survey has been recorded with a GPS unit, ecological values can be imported into a Geographic Information System (GIS) to enable spatial analysis. The density function in the Spatial Analyst of ArcView (ESRI software) can then be used to highlight areas displaying a particularly high or low density of the various criteria. These values can be represented on a colour ramp to facilitate visual interpretation. In the GIS outputs of this section, shades of green represent areas where lower values are dominant; the shades of orange to white represent areas where higher values are dominant. For the coral disease mapping, the darkest shades of red represent the highest disease prevalence. Presentation of data as a series of contour maps enables spatial comparison of ecological criteria across the study area. In this section we present contour maps for a range of coral reef criteria for a total of 16 biotic coral reef variables from all surveys conducted at two of the depth bands surveyed - 7 and 12 meters.

Community of Speyside Marine Environment Improvement Collaboration
Preliminary report 42
5.1 Benthic Cover Percentage cover distributions of selected benthic categories are presented in figures 19-21 below. Benthic species diversity was calculated using a Shannon diversity index (figure 19). Species considered not to be good indicators of reef health such as macro-algae were excluded from this analysis and are displayed separately in figure 21. Live hard coral cover is a significant indicator of overall reef health. Figure 20 displays the coral cover around Speyside.
Figure 19 contour map of the diversity of benthic species (Shannon diversity index (H)) for the fringing reefs surveyed around Speyside. Excludes macro-algae species.

Community of Speyside Marine Environment Improvement Collaboration
Preliminary report 43
Figure 20 Colour contour map of the percentage live hard coral cover for the fringing reefs surveyed around Speyside
Figure 21 Colour contour map of the percentage macro-algae cover for the fringing reefs surveyed around Speyside.

Community of Speyside Marine Environment Improvement Collaboration
Preliminary report 44
5.2 Invertebrates Here, we can present data for the distribution of the common Diadema antillarum sea urchins and Spiny Lobsters. Diadema antillarum sea urchins are important reef herbivores that come out at night to feed on algae, potentially helping to prevent algal dominated phase shifts (see Introduction). The density of Diadema antillarum sea urchins is presented in figure 22. Densities were generally less than 100 individuals per hectare. Lobsters are a popular food source and were once a common sighting on reefs but have now been overharvested on most reef areas. Lobsters were seen on only a few surveys around Speyside (figure 23).
Figure 22 Colour contour map of the abundance of diadema sea urchins (individuals/ha) for the fringing reefs surveyed around Speyside.
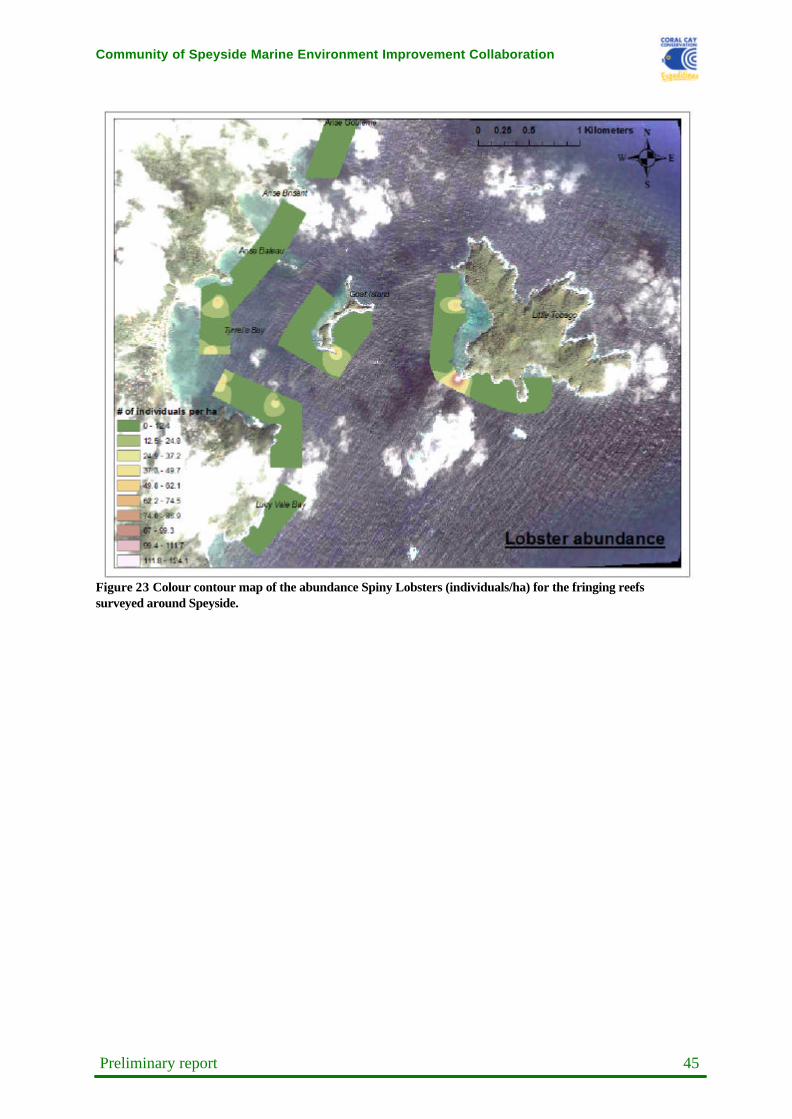
Community of Speyside Marine Environment Improvement Collaboration
Preliminary report 45
Figure 23 Colour contour map of the abundance Spiny Lobsters (individuals/ha) for the fringing reefs surveyed around Speyside.


Community of Speyside Marine Environment Improvement Collaboration
Preliminary report 47
5.3 Reef Fish Fish diversity was calculated using a Shannon diversity index and is presented in figure 24. The biomass of four commercially targeted reef fish families are presented in figures 25-28. Fish biomass is presented as the number of kilograms per hectare of reef area (kg/ha). The total biomass for all commercial and pelagic target species is given in figure 29. Most of this biomass can be attributed to Parrotfish and Grunts encountered on surveys.
Figure 24 contour map of the diversity of fish species (Shannon diversity index (H)) for the fringing reefs surveyed around Speyside.

Community of Speyside Marine Environment Improvement Collaboration
Preliminary report 48
Figure 25 Colour contour map of the biomass of parrotfish (kg/ha) for the fringing reefs surveyed around Speyside.
Figure 26 Colour contour map of the biomass of groupers (kg/ha) for the fringing reefs surveyed around Speyside.

Community of Speyside Marine Environment Improvement Collaboration
Preliminary report 49
Figure 27 Colour contour map of the biomass of snappers (kg/ha) for the fringing reefs surveyed around Speyside.
Figure 28 Colour contour map of the biomass of grunts (kg/ha) for the fringing reefs surveyed around Speyside.
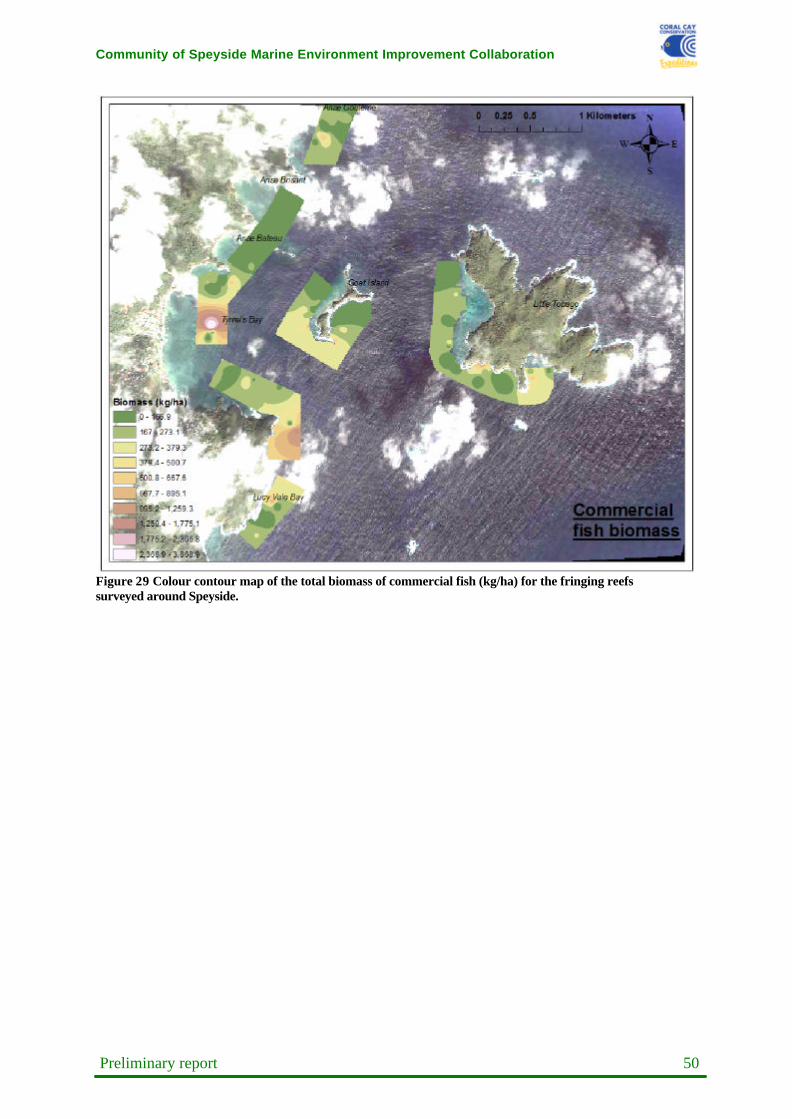
Community of Speyside Marine Environment Improvement Collaboration
Preliminary report 50
Figure 29 Colour contour map of the total biomass of commercial fish (kg/ha) for the fringing reefs surveyed around Speyside.
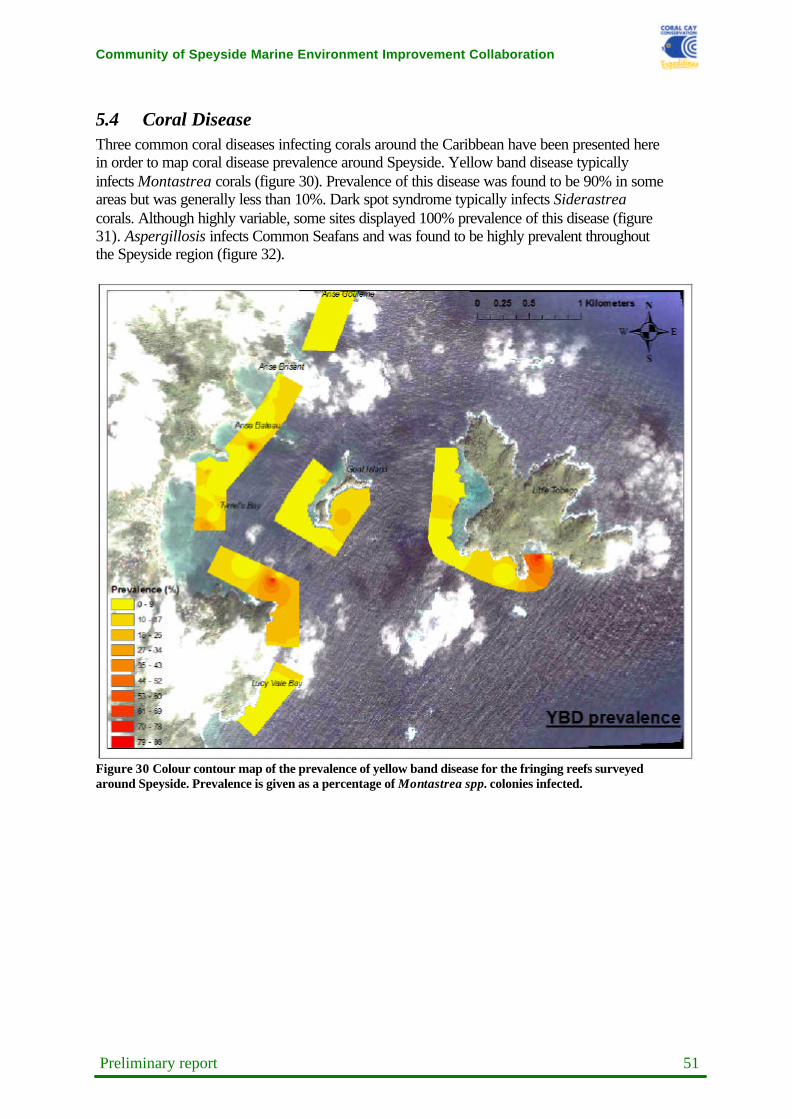
Community of Speyside Marine Environment Improvement Collaboration
Preliminary report 51
5.4 Coral Disease Three common coral diseases infecting corals around the Caribbean have been presented here in order to map coral disease prevalence around Speyside. Yellow band disease typically infects Montastrea corals (figure 30). Prevalence of this disease was found to be 90% in some areas but was generally less than 10%. Dark spot syndrome typically infects Siderastrea corals. Although highly variable, some sites displayed 100% prevalence of this disease (figure 31). Aspergillosis infects Common Seafans and was found to be highly prevalent throughout the Speyside region (figure 32).
Figure 30 Colour contour map of the prevalence of yellow band disease for the fringing reefs surveyed around Speyside. Prevalence is given as a percentage of Montastrea spp. colonies infected.

Community of Speyside Marine Environment Improvement Collaboration
Preliminary report 52
Figure 31 Colour contour map of the prevalence of dark spot syndrome for the fringing reefs surveyed around Speyside. Prevalence is given as a percentage of Siderastrea spp. colonies infected.
Figure 32 Colour contour map of the prevalence of aspergillosis for the fringing reefs surveyed around Speyside. Prevalence is given as a percentage of seafan colonies infected.

Community of Speyside Marine Environment Improvement Collaboration
Preliminary report 53
5.5 Conservation management values Using five ecological indices, comparisons between site records can now be made in order to highlight key areas of ecological importance. The indices used are the site record values for live hard coral cover, the total number of benthic targets (not including nutrient indicator algae), total number of reef fish targets and the Shannon diversity indices (H) for both benthic and reef fish targets. To calculate the Conservation Management Value (CMV) of each survey site, an inter-survey analysis is made to determine the ecological ‘value’ of each survey site relative to the others. To do this, the average value for each of the 5 indices is calculated for each site, and these values are then used to determine the overall averages for each index across all sites. The sites are then compared against these overall averages to determine the number of indices in which each site is above or below the overall average. If, for example, a site is below average in all 5 indices, it would score a CMV value of 0; if it was above average in only 1 index, it would score a CMV value of 1, and so on up to a maximum CMV value of 5 (above average in all 5 indices). Note that this technique compares each site against the other sites within a region, and thus it is a relative value for that region only. The fact that a site is displayed as a low CMV does not necessarily mean it is biologically ‘poor’, but simply that there are biologically ‘richer’ areas in the same region. High Conservation Management Values were found throughout the Speyside region (figure 33). Consistently high values were along the fringing reef along the western side of Little Tobago, north and south of Tyrrel’s Bay and Anse Bateau. Comparisons have also been made between Speyside and the Caribbean side (figure 34). Unlike the previous map, which compares CMV values within Speyside, this map compares CMV values of all surveys conducted thus far on the Caribbean side of Tobago (including Speyside). High CMV values can be found all along the northern coast. Particularly good sites were found around Buccoo Reef, Plymouth, Brother’s and Sister’s rocks and Speyside.

Community of Speyside Marine Environment Improvement Collaboration
Preliminary report 54
Figure 33 Conservation Management Values for coral reef habitats for the fringing reefs surveyed around Speyside.
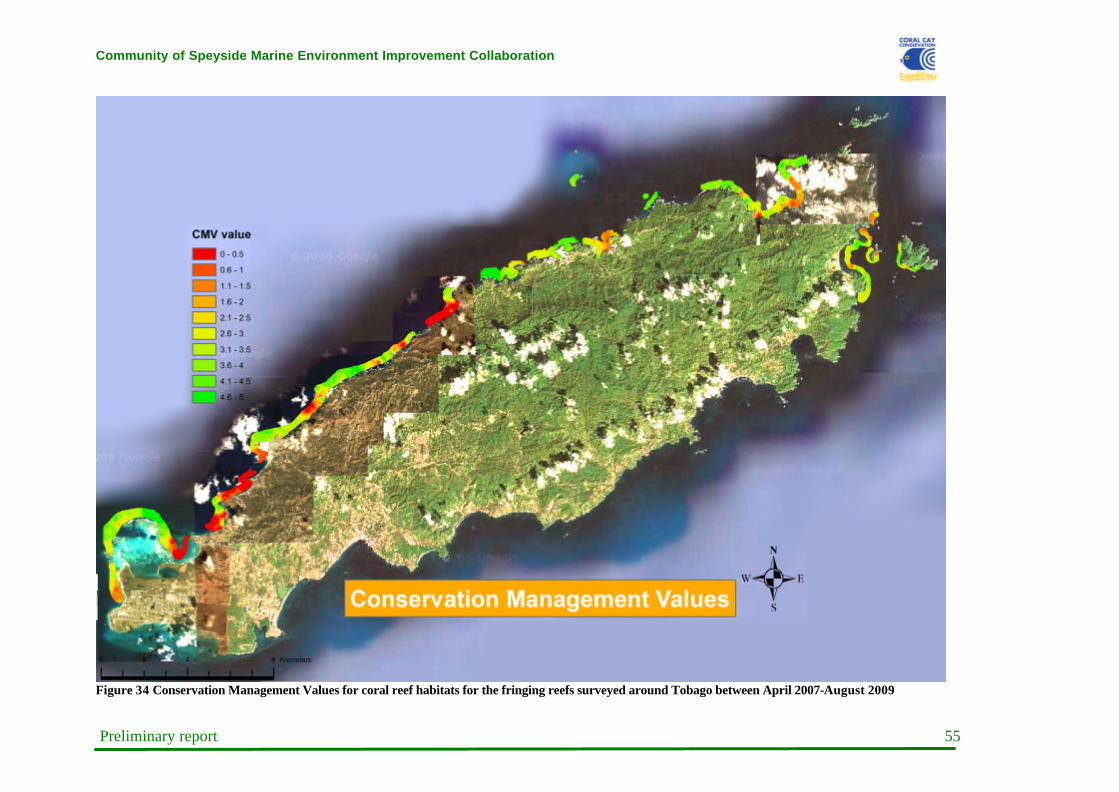
Community of Speyside Marine Environment Improvement Collaboration
Preliminary report 55
Figure 34 Conservation Management Values for coral reef habitats for the fringing reefs surveyed around Tobago between April 2007-August 2009

Community of Speyside Marine Environment Improvement Collaboration
Preliminary report 56
6. Discussion
Benthic composition The reefs around Speyside consist mainly of algae covered rock and hard corals. In contrast, the Caribbean side reefs consist of rubble, bare rock and sparse patches of coral with little to no macroalgae cover. Some sites such around Spiny Colony and Angel Reef had exceptional coral cover with values over 50%, well above most reef sites surveyed in the rest of the Caribbean. Monitoring observations done at the same sites and survey depths around Speyside indicate that coral cover and diversity have remained relatively stable in contrast to many reef sites on the Caribbean side which saw a significant decline in coral cover between 2005 and 2007/2008. Although the coral cover has remained relatively high since the reefs were surveyed in 2005, the high level of macroalgae, especially at 7 meters, is concerning. Currently, no major phase shifts have taken place although an exception may be in Lucy Vale where macroalgae cover was as high as 70% on shallow, 7-meter reefs. Influx of nutrients from agricultural and sewage sources as well as prolonged periods of high sedimentation loading of coastal waters from land runoff are thought to be major contributors to the overall degradation and algal prevalence of the reefs surveyed. These local stressors can weaken the corals’ natural defence mechanisms and make them susceptible to future, regional impacts such as coral bleaching and hurricane damage. This has already become apparent by the 2005 bleaching event that killed many of the affected corals and led to the disease outbreaks currently prevalent on the Caribbean side.
Reef Fish Reef fish data presented indicates that a number of commercially fished families were rarely recorded on reef surveys. Although total biomass of commercially fished species was similar to the Caribbean side of Tobago, the lack of Grouper, Snapper and Parrotfish abundance and biomass at all reef sites is of great concern. Their low abundance is most likely the result of overfishing in combination with habitat loss. Parrotfish biomass for example, was less than half that of the Caribbean reefs. The high cover of macroalgae on many of Speyside’s reefs is likely to be attributed to low numbers of parrotfish in conjunction with high nutrient levels. Comparisons with well-managed reefs of Bonaire in the Dutch Antilles indicate that biomass of these key species in Speyside is only a fraction of that of Bonaire. The importance of herbivorous Parrotfish in keeping algae cover low in order to promote coral recruitment has been well documented (Mumby et al., 2006, Mumby et al., 2007, Bellwood et al., 2004, Bellwood et al., 2006, Williams and Polunin, 2007). Any management initiatives will need to address this issue if harvesting of these reef fish is to continue. Although the distribution of Grunts was very patchy, there were some indications that those sites that still have relatively good reef health contained the highest biomass of grunts. Grunts use coral overhangs for shelter and protection during the daytime and disperse at dusk when they become active foragers for invertebrate prey. As with most reef-associated fish, a decrease on the availability of suitable habitat for shelter will directly correlate with a decrease in their population numbers.

Community of Speyside Marine Environment Improvement Collaboration
Preliminary report 57
Invertebrates Low abundances of key invertebrate species, particularly Queen Conch, Spiny Lobsters and Sea Cucumbers were found throughout the Speyside survey area, indicating serious over-harvesting. With no management practices in place to protect the remaining populations and under sustained fishing intensity, most reefs have already been depleted. It is recommended that no-take zones are established at key reef sites in addition to imposing restrictions on the minimum size of queen conch and lobsters as well as no-catch policies for egg-bearing female lobsters. Next to the herbivorous Surgeonfish and Parrotfish families, an echinoid species, Diadema antillarum (long-spined sea urchin), plays a key role as a reef grazer potentially preventing phase shifts (Hughes, 1994). Abundances were lower than most Caribbean side reefs and the high macroalgal cover is likely to be due to low grazing pressure from both sea urchins and Parrotfish. Continued monitoring over the next years will establish whether there is a recovery of Diadema abundances.
Coral Disease and Bleaching Yellow band disease and dark spot syndrome were the most common coral diseases around Speyside, infecting around 10% of hard corals. Both of these diseases attack massive, slow-growing coral colonies and can significantly lower the structural complexity of Speyside’s reefs if these levels of prevalence continue. Levels of other diseases such as Black Band Disease and Red Band Disease were generally low to non-existent on most reefs. The few Acropora palmata stands that remain in shallow waters are susceptible to white pox and patchy necrosis. The high levels of Aspergillosis infecting seafans is concerning. At some sites, all seafans were infected. As Aspergillosis is a land-derived fungus, it may be the case that sewage and agricultural effluent are amplifying its prevalence around Speyside. Low levels of coral bleaching were observed but not to the extent of the mass-bleaching event of 2005. Coral disease levels were not as high around Speyside as they are for the Caribbean side where disease prevalence has led to a significant reduction in hard coral cover. It is worth noting that significant levels of coral disease were not observed on surveys conducted in 2005 during the mass coral bleaching outbreak (O’Farrell et al., 2005). This strongly indicates that the disease outbreaks currently affecting Tobago are directly linked to post-stress symptoms from the mass bleaching event of 2005. The fact that disease prevalence has remained relatively low around Speyside is an important indicator of the area’s resilience towards climate-change related impacts such as coral bleaching.

Community of Speyside Marine Environment Improvement Collaboration
Preliminary report 58
General Conclusions and Management Recommendations Healthy coral reefs are an essential part of Speyside’s economy and efforts must be made to ensure that reef health is improved. Disturbingly, all of the reefs visited for surveys are showing some signs of stress. Although the signs vary, they generally include: high marcoalgae cover, coral diseases, high sedimentation, low fish density and direct physical damage such as anchor and trampling damage. Whilst current reef health is a cause for genuine concern, it is likely that the reefs observed still retain the capacity to recover. Speyside’s reefs have shown to be highly resilient to regional, climatic influences such as increased sea surface temperatures. This was observed in 2005 when bleaching levels around Speyside remained relatively low compared to the rest of Tobago (see O’Farrell et al., 2006). Findings from this report provide further evidence for the ecological importance of Speyside’s reefs. Coral cover has remained stable and disease levels are not as high as those reefs severely impacted by the 2005 event. As it has already been hypothesised, Speyside’s reefs are not as susceptible to coral bleaching events thanks to the strong currents pushing through the area, thereby preventing an accumulation of increased sea surface temperatures over a long period. In order to deal with the high and increasing levels of sedimentation and nitrification, management strategies will need to address proper treatment of sewage and agricultural runoff through waste treatment facilities and routing runoff through wetlands and artificially created sediment ponds before it enters the sea. Furthermore, upland and coastal construction projects need to undergo rigorous environmental impact assessments and effective mitigation measures must be implemented before construction is allowed to commence. Strategies may include minimizing construction during the rainy season and replanting schemes to hold soil in place on exposed slopes. Mangrove and seagrass replanting schemes can be effective in acting as nutrient ‘sinks’ before they wash onto the reefs. Their important role as nursery grounds for many species of fish and invertebrates help to promote an increase in fish abundance and diversity on adjacent reefs Action to reduce local impacts such as overfishing, sedimentation and nutrification on the coral reefs and their associated habitats are of primary importance in order to maintain coral reef resilience and minimise the chances of phase shifts to algal dominated communities over the next years. A series of small-scale, well-managed no-take zones should be implemented for those areas which have extensive and relatively healthy reef systems such as Little Tobago, Goat Island and Anse Bateau. These no-take zones will promote the recovery of threatened reef fish families such as Groupers and Parrotfish and aid in the recovery of other endangered reef creatures such as conch shells and lobsters. This in turn would lead to a sustainable fishing industry and increased income to the Speyside community from dive and snorkel related tourism. In order to assess the cultural, social and wider ecological implications of management measures proposed, fisheries surveys would need to be conducted within the Speyside community in order to provide valuable data on catch composition, weight and effort. This kind of data is currently absent. These outputs would provide information on what trophic levels are currently being fished and to what extent the fishing is disrupting the structure and function of coastal marine food webs. Furthermore, the information would enable the community to make informed decisions about the continued management of their coastal resources.

Community of Speyside Marine Environment Improvement Collaboration
Preliminary report 59
Continued capacity building programmes should be conducted for reef tour operators, marine park wardens and SCUBA instructors, allowing the Speyside community to benefit from livelihoods created through tourism. This can be achieved through programmes initiated through collaborative efforts between the THA and environmental NGOs such as CCC and the BRT as well as exchange programmes with other Caribbean island states. Training programmes must also strive to ‘arm’ stakeholders with the knowledge, technical capacity and will to manage Speyside’s coastal resources in a sustainable manner. Finally, an extensive public education and awareness campaign is needed to build on existing efforts and ensure that all users appreciate and understand the value of these precious coastal resources. Based on the scientific findings outlined above, some initial management recommendations have been put together which will help to protect the area from many of the local threats in addition to providing significant benefits to the Speyside community. These recommendations are based loosely on successful implementation of similar initiatives in Bonaire National Park, Dutch Antilles. These recommendations are:
• Implement a management plan for a Speyside Marine Park
o Regular scientific monitoring along permanent transects within the park o Several reef sites where fishing is restricted in order to encourage a recovery of
fish stocks and conserve important coral reef health and biodiversity o Install a mooring buoy system for the marine park o Ask a user fee for recreation within the marine park o Ban destructive fishing methods and extraction of endangered species from the
park and develop fishing and harvesting guidelines
• Develop and implement a Speyside Marine Park Authority who is responsible for the management of the park.
o Upkeep and maintenance of mooring buoys o Allows use of the park through non-destructive activities o Organise meetings between stakeholders (dive shops, fishermen, tour boats,
THA) o Updates and reports to the THA and public o Ensures user derived income is used for the management of the park
• Train and hire several Marine Park Rangers, empowered with special policing
authority to: o Patrol on a daily basis to ensure rules and regulations are upheld o Issue fines if needed o Educate the public and inform visitors about responsible recreation within the
park o Conduct fish catch monitoring
• Establish as Speyside Marine Park Visitors Centre o Inform tourists o Receive diver and user fees o Educate children about their marine environment o Run research and monitoring programmes o Organise community outreach and education events
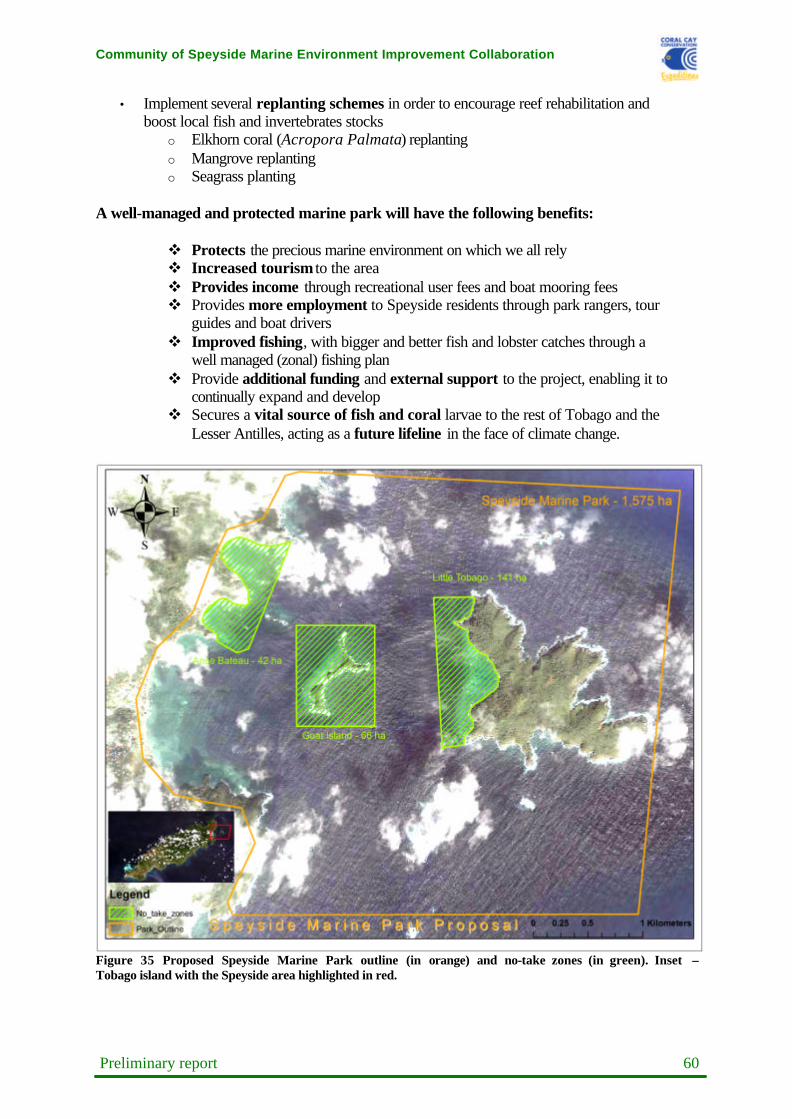
Community of Speyside Marine Environment Improvement Collaboration
Preliminary report 60
• Implement several replanting schemes in order to encourage reef rehabilitation and boost local fish and invertebrates stocks
o Elkhorn coral (Acropora Palmata) replanting o Mangrove replanting o Seagrass planting
A well-managed and protected marine park will have the following benefits:
v Protects the precious marine environment on which we all rely v Increased tourism to the area v Provides income through recreational user fees and boat mooring fees v Provides more employment to Speyside residents through park rangers, tour
guides and boat drivers v Improved fishing, with bigger and better fish and lobster catches through a
well managed (zonal) fishing plan v Provide additional funding and external support to the project, enabling it to
continually expand and develop v Secures a vital source of fish and coral larvae to the rest of Tobago and the
Lesser Antilles, acting as a future lifeline in the face of climate change.
Figure 35 Proposed Speyside Marine Park outline (in orange) and no-take zones (in green). Inset – Tobago island with the Speyside area highlighted in red.

Community of Speyside Marine Environment Improvement Collaboration
Preliminary report 61
References Bak, R. P. M., Nieuwland, G., and Meesters, E. H. 2005. Coral reef crisis in deep and shallow reefs: 30 years of constancy and change in reefs of Curacao and Bonaire. Coral Reefs 24: 475 – 479. Bellwood, D.R., T.P. Hughes, C. Folke, and M. Nystrom. 2004. Confronting the coral reef crisis. Nature 429: 827-833. Bellwood, D.R., T.P. Hughes, and A.S. Hoey. 2006. Sleeping functional group drives coral-reef recovery. Current Biology 16: 2434-2439. van Bochove, J-W, Harding, S, Head, K, Gibson, K and Raines, P 2008. Tobago Coastal Ecosystems Mapping Project. Results of Community and Scientific Work, March – December 2007. CCC report for IWCAM. Coral Cay Conservation, London, UK 52 pp. van Bochove, J-W, Harding, S, Raines, P 2008. Tobago Coastal Ecosystems Mapping Project: Annual Report 2008. Results of Community and Scientific Work, March 2007 – July 2008. Coral Cay Conservation, London, UK 52 pp. Bruno, J. et al. 2007. Thermal Stress and Coral Cover as Drivers of Coral Disease Outbreaks. PLoS Biology 6: 1220-1227 Buddemeier, R., Kleypas, J., Aronson, R. 2004. Coral Reefs and Global Climate Change – Potential Contributions of Climate Change to Stresses on Coral Reef Ecosystems. Pew Center on Global Climate Change, Arlington USA. Burke, L. and Maidens, J. 2004. Reefs at risk in the Caribbean. World Resources Institute, Washington D.C. USA. Burke, L., Greenhalgh, S., Prager, D. and Cooper, E. 2008. Coastal Capital – Economic Valuation of Coral Reefs in Tobago and St. Lucia. World Resources Institute, Washington D.C. USA. Cervino, J.M., Hayes, R.L., Polson, S.W., Polson, S.C., Goreau, T.J.,Martinez R.J. and Smith. G.W. Relationship of Vibrio Species Infection and Elevated Temperatures to Yellow Blotch/Band Disease in Caribbean Corals. Applied and Environmental Microbiology, Nov. 2004, p. 6855–6864 Gardner, T., Côté, I., Gill, J., Grant, A. and Watkinson, A. 2003. Long-term region wide declines in Caribbean Coral Reefs. Science 301: 958-960. Glynn, P. 1993. Coral reef bleaching ecological perspectives. Coral Reefs 12: 1-17. Harding S., van Bochove, J., Gibson, K.. and Raines, P. 2008. Continued degradation of Tobago’s coral reefs linked to the prevalence of coral disease following the 2005 mass coral bleaching event. Proc. 11th International Coral Reef Symposium. Houghton, J.T., Y. Ding, D.J. Griggs, M. Noguer, P.J. van der Linden, and D. Xiaosu (eds.) 2001. IPCC Third Assessment Report: Climate Change 2001: The Scientific Basis. Cambridge University Press, Cambridge, UK, 944 pp. Hughes, T.P. 1994. Catastrophes, phase shifts, and large-scale degradation of a Caribbean coral reef. Science 265: 1547-1551.

Community of Speyside Marine Environment Improvement Collaboration
Preliminary report 62
Hughes, T. et al. 2003. Climate change, human impacts, and the resilience of coral reefs. Science 301: 929–933. Hughes, T. et al. 2007. Phase Shifts, Herbivory, and the Resilience of Coral Reefs to Climate Change Current Biology 17: 360–365 Institute of Marine Affairs, 2002. Final Report: The Formulation of a Management Plan for the Speyside Reefs Marine Park, Tobago. Institute of Marine Affairs, Chaguaramas, 2-12pp IPCC 2007. The Physical Science Basis. Summary for Policymakers. Contribution of Working Group I to the Fourth Assessment Report of the Intergovernmental Panel on Climate Change. 18 pp. Jackson, J.B.C., M.X. Kirby, W.H. Berger, K.A. Bjorndal, L.W. Botsford, B.J. Bourque, C.B. Lange, H.S. Lenihan, J.S. Pandolfi, C.H. Peterson, R.S. Steneck, M.J. Tegner, and R.R. Warner. 2001. Historical overfishing and the recent collapse of coastal ecosystems. Science 293: 629-638. KAIRI Consultants Ltd, 2003. North East Tobago Management Plan: Final Report, July 2003. Tobago House of Assembly, Tobago 69pp Kinsey, D.W. 1988. Coral reef system response to some natural and anthropogenic stresses. Galaxea 7: 113-128. Kramer, P. 2003. Synthesis of coral reef health indicators for the western Atlantic: Results of the AGRRA program (1997 – 2000). in J.C. Lang (ed.), Status of Coral Reefs in the western Atlantic: Results of initial Surveys, Atlantic and Gulf Rapid Assessment (AGRRA) Program. Atoll Research Bull. 496. Larcombe. P., and Woolfe, K. 1999. Increased sediment supply to the Great Barrier Reef will not increase sediment accumulation at most coral reefs. Coral Reefs 18: 163-169. Mora, C. 2008. A clear human footprint in the coral reefs of the Caribbean. Proceedings of the Royal Society B. doi:10.1098/rspb.2007.1472 (published online). Mumby, P.J., C.P. Dahlgren, A.R. Harborne, C.V. Kappel, F. Micheli, D.R. Brumbaugh, K.E. Holmes, J.M. Mendes, K. Broad, J.N. Sanchirico, K. Buch, S. Box, R.W. Stoffle, and A.B. Gill. 2006. Fishing, trophic cascades, and the process of grazing on coral reefs. Science 311: 98-101. Mumby P. J., Harborne A. R., Williams J, Kappel C. V., Brumbaugh D. R., Micheli F, Holmes K. E., Dahlgren C. P., Paris C. B., Blackwell P. G. (2007) Trophic cascade facilitates coral recruitment in a marine reserve. Proc Natl Acad Sci USA 104: 8362-8367 Myers, R., Baum, J., Shepherd, T., Powers, S. and Peterson, C. 2007. Cascading Effects of the Loss of Apex Predatory Sharks from a Coastal Ocean. Science 315: 1846-1850. Orr, J. et al. 2005. Anthropogenic ocean acidification over the twenty-first century and its impact on calcifying organisms. Nature 437 (29): 681-686. O’Farrell, S., Day, O., 2006. Report on the 2005 mass coral bleaching event in Tobago, Part 1: Results from Phase 1 Survey. Coral Cay Conservation and the Buccoo Reef Trust. 41 pp. Riegl, B. and Branch, G. 1995. Effects of sediment on the energy budgets of four scleractinian (Bourne 1900) and five alcyonacean (Lamouroux 1816) corals. Journal of Experimental Marine Biology and Ecology 186: 259-275.

Community of Speyside Marine Environment Improvement Collaboration
Preliminary report 63
Royal Society. 2005. Ocean Acidification Due to Increasing Atmospheric Carbon Dioxide. The Royal Society, London, UK [http://www.royalsoc.ac.uk/displaypagedoc.asp?id513539 accessed 19 July, 2008]. Sheppard, C.R.C., Harris, A. and Sheppard, A.L.S. 2008. Archipelago-wide coral recovery patterns since 1998 in the Chagos Archipelago, central Indian Ocean. Marine Ecology Progress Series 362: 109-117. Smith, G., Ives, L., Nagelkerken, I and Ritchie, k. 1996. Aspergilliosis associated with Caribbean sea fan mortalities. Nature 382:487 Steneck, RS, Mumby P, and Arnold S. 2008. A Report on the Status of the Coral Reefs of Bonaire in 2007 with Results from Monitoring 2003 – 2007. Unpublished report to the Bonaire National Marine Park (STINAPA Bonaire). 94 pp. http://www.stinapa.org/pdfs/Bonaire-Report-2007-Bob-Steneck-etc.pdf Webster, P., Holland G., Curry, A., Chang, H. 2005. Changes in tropical cyclone number, duration, and intensity in a warming environment. Science 309: 1844-1846. Wilkinson, C., Souter, D. 2008. Status of Caribbean coral reefs after bleaching and hurricanes in 2005. Global Coral Reef Monitoring Network, and Reef and Rainforest Research Centre, Townsville, 152 p. Williams, I. D., and Polunin, N. V. C. 2001. Large-scale associations between macroalgal cover and grazer biomass on mid-depth reefs in the Caribbean. Coral Reefs 19: 358 – 366. Willis, B., 2006. Surveying Coral Disease. School of Marine Biology and Aquaculture, James Cook University Winter, A., Appeldoorn, R., Bruckner, A., Williams, E. and Goenaga, C. 1998. Sea surface temperatures and coral reef bleaching off La Parguera, Puerto Rico. Coral Reefs 17: 377-382 Wolanski, E., Richmond, R., McCook, L. and Sweatman, H. 2003. Mud, marine snow, and coral reefs. American Scientist 91: 44-51. Voss, J., Richardson, L. 2006. Nutrient enrichment enhances black band disease progression in corals. Coral Reefs 25: 569–576

Community of Speyside Marine Environment Improvement Collaboration
Preliminary report 64
Appendix: COSMEIC target species
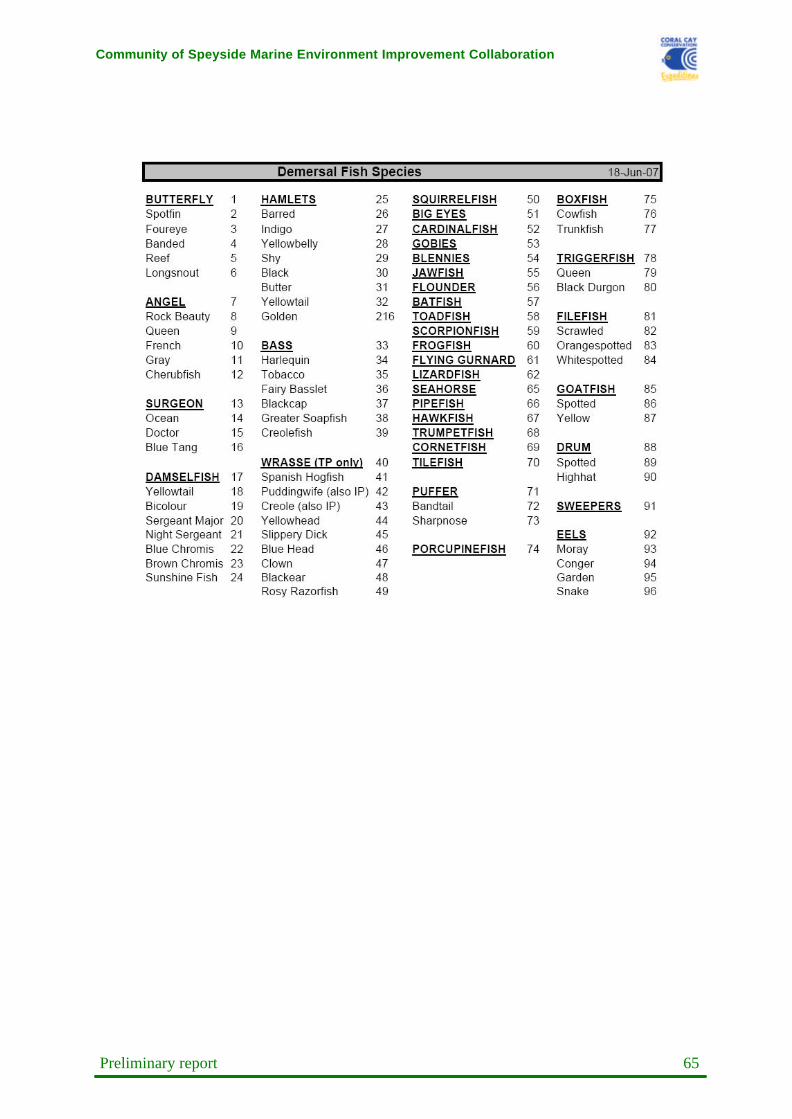
Community of Speyside Marine Environment Improvement Collaboration
Preliminary report 65
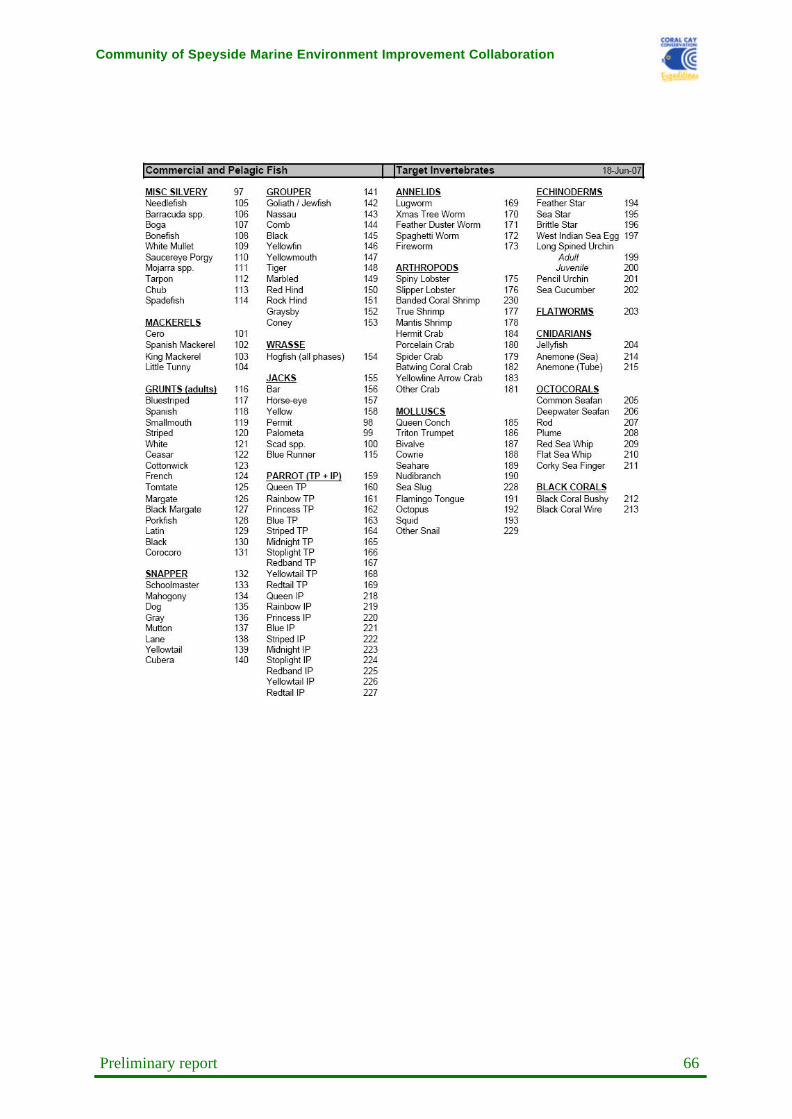
Community of Speyside Marine Environment Improvement Collaboration
Preliminary report 66