community social planning council of toronto
TRANSCRIPT
COMMUNITY SOCIALPLANNING COUNCILOF TORONTO

Sick and Tired: The Compromised Health of Social Assistance Recipients and the Working Poor in Ontario
February 2009
ISBN: 978-1-894199-18-6
Produced by the Community Social Planning Council of Toronto (CSPC-T), University of Toronto’s Social Assistance in
the New Economy Project (SANE) and the Wellesley Institute.
RESEARCH PARTNERS
Wellesley Institute, University of Toronto’s Social Assistance in the New Economy Project and the Community Social
Planning Council of Toronto
RESEARCH TEAM
Ernie Lightman, Principal Investigator, University of Toronto’s Social Assistance in the New Economy Project
Andrew Mitchell, Coordinator, University of Toronto’s Social Assistance in the New Economy Project
Beth Wilson, Senior Researcher, Community Social Planning Council of Toronto
REPORT AUTHOR
Beth Wilson, CSPC-T
RESEARCH SUPPORT
Jim Dunn, Centre for Research on Inner City Health
Raluca Fletcher, CSPC-T
Bob Gardner, Wellesley Institute
Esther Guttman, CSPC-T
Dean Herd, SANE
Dianne Patychuk
Michael Shapcott, Wellesley Institute
Zachary Tucker-Abramson, CSPC-T
CSPC-T RESEARCH ADVISORY COMMITTEE
Tam Goossen, Chair
Mario Calla
Celia Denov, ex-officio
Rick Eagan, project advisory committee liaison
Luin Goldring
Mazher Jaffery
John Myles
Rhonda Roffey
Cheryl Teelucksingh
Armine Yalnizyan
REPORT DESIGN
Christopher Wulff, CSPC-T
FUNDING SUPPORT
This project was made possible through the financial support of:
Sick and Tired: The Compromised Health of Social Assistance Recipients and the Working Poor in Ontario | 1
Table of ContentsAcknowledgements...............................................................................................................2
About the Partners...................................................................................................................2
Executive Summary..................................................................................................................3
Introduction........................................................................................................................7
Method....................................................................................................................................8
Context...................................................................................................................................8
Results.................................................................................................................................9
Health and Health-Related Measures.....................................................................................11
Health Care Service Use ......................................................................................................13
Preventative Health Care Service Use..................................................................................14
Unmet Health Care Needs.....................................................................................................15
Access to Health Insurance...................................................................................................15
Food Insecurity.........................................................................................................................15
Chronic Conditions: Examining Multiple Factors..................................................................15
Implications............................................................................................................15
Social Assistance and Sickness..............................................................................................15
An Illness Producing System.................................................................................................16
Poor Health and the Working Poor.......................................................................................17
The Working Poor and the Healthy Immigrant Effect.......................................................17
Low Wages, Precarious Work and Compromised Health....................................................18
Health Care Inequities.............................................................................................................19
Human Costs, Health Care Costs..........................................................................................20
Recommendations..................................................................................................21
References and Related Literature........................................................................24
Endnotes................................................................................................................27
Appendix................................................................................................................28
2 | Sick and Tired: The Compromised Health of Social Assistance Recipients and the Working Poor in Ontario
I would like to extend my heartfelt thanks to Ernie Light-man and Andy Mitchell for the wonderful support and thoughtful direction that they provided throughout this project. It has been a priviledge and my pleasure to work with Ernie and Andy – both outstanding researchers, dedicated advocates and keen observers of the political landscape.
Special thanks to Michael Shapcott for his careful review and thoughtful comments on draft reports, continued support and enthusiasm for this project, and his and the Wellesley Institute’s ongoing commitment to put research into action for social change.
I would like to extend my appreciation to Bob Gard-ner, Dianne Patychuk, Dean Herd and Jim Dunn for their helpful advice and assistance with this project. Many thanks to Rick Eagan, CSPC-T research advisory committee member and project advisory liaison for his active engagement and grounded perspective. I would also like to thank CSPC-T research advisory committee members Luin Goldring, Tam Goossen, Rhonda Roffey
and Cheryl Teelucksingh who provided important feed-back contributing to the development of this report.
Many thanks go to Raluca Fletcher, Esther Guttman and Zak Tucker-Abrahmson for their thorough research assistance.
I would like to acknowledge the vital financial contribu-tions of our project funders, the Wellesley Institute and Social Sciences and Humanities Research Council of Canada, and CSPC-T’s core funders, City of Toronto and United Way Toronto.
Many of the 1.3 million Ontarians living in poverty are sick and tired of being sick and tired. This project builds on a strong base of compelling research demonstrating the critical need to invest in the social determinants of health. It’s in the interest of individual health, and the fiscal health of our health care system and the economy. It is my hope that this work will help propel our govern-ments forward to take real action on poverty, bad jobs and poor health.
Beth Wilson, Report Author
Community Social Planning Council of Toronto (CSPC-T) is a non-profit community organization com-mitted to building a civic society in which diversity, equity, social and economic justice, interdependence and active civic participation are central. CSPC-T works with diverse communities, engages in community-based research and conducts policy analysis with an aim of improving the quality of life of all Toronto residents. www.socialplanningtoronto.org
The Social Assistance in the New Economy (SANE) research initiative is a multi-year, multi-disciplinary inquiry into the changing nature of social assistance in Ontario and its relation to precarious employment in a globalizing economy. Funded primarily by the Social Sci-ences and Humanities Research Council (SSHRC) through four major grants, the research program comprises a number of complementary research projects which are investigating: the welfare and post-welfare experiences of social assistance recipients as well as the labour market experiences of those precariously employed. Our method-ologies include primary data collection through qualita-tive in-depth interviews through to secondary analysis of large data sets such as the SLID and CCHS. Aside from
publishing extensively in the academic literature, SANE
has advised various non-profit community-based agencies
and governments on policies towards income support for
those with low incomes.
www.oise.utoronto.ca/fsw/exponent/fsw/fswsupport/
sane/
The Wellesley Institute is a Toronto-based non-profit
and non-partisan research and policy institute. Our focus
is on developing research and community-based policy
solutions to the problems of urban health and health
disparities. We identify and advance practical and achiev-
able policy alternatives and solutions to pressing issues of
urban health; fund research on the social determinants
of health and health disparities, focusing on the relation-
ships between health and housing, poverty and income
distribution, social exclusion and other social and eco-
nomic inequalities; support community engagement and
capacity building; work in numerous collaborations and
partnerships locally, nationally and internationally, to
support social and policy change to address the impact of
the social determinants of health.
www.wellesleyinstitute.com
About the partners
Acknowledgements

Sick and Tired: The Compromised Health of Social Assistance Recipients and the Working Poor in Ontario | 3
Falling on the heels of the release of Ontario’s land-mark poverty reduction strategy, Sick and Tired paints
a grim picture of the health of the province’s poorest resi-dents. This new report from the Community Social Plan-ning Council of Toronto, University of Toronto’s Social Assistance in the New Economy Project and the Wellesley Institute documents the compromised health of social assistance recipients and the working poor in Ontario. Following a discussion of Ontario’s health-compromis-ing social assistance system and troubling labour market realities, we offer recommendations to strengthen the Province’s poverty reduction plan, address the increased burden of ill health among poor people in Ontario, and promote equitable access to health services in Ontario. In addition to addressing poverty and health equity issues, many of our recommended actions, if enacted, will pro-mote much-needed economic stimulus as an antidote to Ontario’s struggling economy and promote cost savings in the health care system.
ContextThis report is based on an analysis of Statistic Canada’s 2005 Canadian Community Health Survey, the most recent and comprehensive survey of health and health care use of Canadians. Analyses are based on data from over 24,000 working-age Ontarians.
Some important changes have occurred since 2005 when the survey was conducted. Rising unemployment and full-time job losses have hit Ontario workers hard (Statistics Canada, 2009, January 9). Ontario manufacturers have shed a staggering one in ten jobs between 2003 and 2007, with increased lay-offs into 2008 (Ontario Federation of Labour, 2007; Statistics Canada, 2009, January 9). Early effects of this historical economic crisis are likely to have pushed more people into poverty, further compromising individual health – and it’s far from over.
On a positive note, Ontario’s minimum wage rate was increased by $1.30 per hour between 2005 and 2008 (Ontario Ministry of Labour, n.d.). While welcome, these recent increases have only helped to make up for lost ground from a rate freeze that extended from 1995 to 2003 under the previous provincial government. At $8.75 per hour, the current rate offers minimum wage earners
just about the same purchasing power as their counter-parts had in 1995. Today’s minimum wage remains a pov-erty wage, and as such, a health hazard to these low wage workers.
Beginning in 2003 and continuing since 2005, the pro-vincial government introduced periodic 2-3% increases to social assistance rates (National Council of Welfare, 2006; National Council of Welfare, 2008). Prior to these rate increases, social assistance recipients endured a 21.6% cut in 1995 followed by an 8-year rate freeze under the previ-ous government. While a step in the right direction, the current government’s inflation-matching increases have done little to fundamentally change the position of social assistance recipients. In 2007, their incomes remained at 33% to 61% of Statistics Canada’s Low Income Cut-Off. Research suggests that these modest increases have con-tributed little to improving the quality of life or health outcomes for social assistance recipients in Ontario (Lightman et al., 2008a, 2008b, 2005a, 2005b).
Today’s global economic crisis, coupled with the con-tinued disadvantage of low income Ontarians, offers no reason to imagine that the health prospects of low income working-age Ontarians have improved since our survey data was collected in 2005. In fact, forecasts for a contin-ued steep downturn through 2009 suggest even tougher economic times ahead for growing numbers of Ontarians, and greater risks to individual health.
ResultsOur analysis revealed that social assistance recipients carry an overwhelmingly high burden of ill health. Com-pared to the non-poor, they had significantly higher rates of poor health and chronic conditions on 38 of 39 health measures – rates as much as 7.2 times higher than those of the non-poor group. Social assistance recipients had higher rates of diabetes, heart disease, chronic bronchitis, arthritis and rheumatism, mood disorders, anxiety disor-ders and many other conditions.
Perhaps most distressing, one in ten social assistance recipients considered suicide in the 12-month period preceding the study and suicide attempts were 10 times higher for social assistance recipients compared to the non-poor.
Executive Summary

4 | Sick and Tired: The Compromised Health of Social Assistance Recipients and the Working Poor in Ontario
The median household income for this highly stressed,
health compromised and vulnerable group was a mere
$13,000 a year.
The health of Ontario’s working poor was a more com-
plicated story. Compared to the non-poor, the working
poor had higher rates on a range of chronic conditions
including diabetes, heart disease, chronic bronchitis, and
migraines, among others. They had worse self-reported
health and mental health and higher rates of considering
and attempting suicide compared to the non-poor group.
Analyses also revealed unexpected findings where the non-
poor group had significantly higher rates on some health
measures compared to the working poor group. These
differences were due, in large part, to a phenomenon called
the “healthy immigrant effect” whereby immigrants, and
particularly newcomers, enjoy better health compared to
their Canadian-born peers. This health benefit dimin-
ishes over time. The longer immigrants live in Canada,
the more their health levels begin to approximate that
of the Canadian-born population. The overall health of
the working poor group was better than expected, and on
some measures better than the non-poor group, because
of the large proportion of the working poor that are
immigrants (53%) and their relatively shorter periods of
time spent living in Canada.
While faring better than the social assistance group, the
working poor had a median household income of just
$21,000 a year. This compares to a median household
income of $80,000 a year for the non-poor group.
Even after taking into account multiple factors associ-
ated with ill health, including educational attainment,
disability status, smoking and physical activity among
others, household income and/or social assistance receipt
continued to be strongly associated with most chronic
conditions.
Consistent with their higher rates of ill health, social assis-
tance recipients reported significantly more consultations
with medical professionals of all kinds compared to the
non-poor group. In contrast, the working poor group had
more consultations with general practitioners but fewer
consultations with specialists and other medical practi-
tioners compared to the non-poor group. Despite higher
rates of unmet health care needs, both poor groups were
less likely to have a regular medical practitioner compared
to the non-poor group.
The working poor group had much lower rates of insur-ance coverage for vision, dental, prescription medication and hospital care services compared to the non-poor group, and in most cases, the social assistance group. Among individuals with unmet health care needs, one in five respondents from the working poor and social assis-tance groups cited cost as a factor.
The poor groups were also less likely to access preventa-tive health care services. Rates were especially troubling regarding women’s preventative health care where sub-stantial numbers of poor women had never had a pap smear test, breast exam or mammogram for those over 40 years of age.
Lack of access to and use of primary and preventative health care contributes to more serious and costly health problems down the road. Barriers to health care access hurt individuals and families and cost the health care system.
ImplicationsStudy findings raise important questions about Ontario’s social assistance system and changing labour market reali-ties. Ontario’s social assistance system is the main source of income for the most health compromised group of working-age people in the province. Inadequate Ontario Works (OW) and Ontario Disability Support Program (ODSP) rates leave recipients living in deep poverty. Despite recent increases that keep pace with inflation, rates are so low that half of all respondents from the social assistance group live in food insecure households. Related research reveals considerable barriers to ODSP for Ontarians with disabilities in financial need (Centre for Addiction and Mental Health, 2003; Income Security Advocacy Centre, 2003; Lightman et al., in press; ODSP Action Coalition, 2008; Social Planning Council of Ottawa, 2001; Street Health, 2006). Coupled with inadequate rates, recipient health is further compromised by their exposure to puni-tive bureaucracies and social stigma associated with social assistance.
Major labour market restructuring in industrialized countries like Canada has contributed to an expansion of precarious employment characterized by short-term, temporary and contract positions with low wages and few, if any, benefits (Community-University Research Alliance on Precarious Employment, 2005). The working poor in Ontario occupy low wage and precarious positions in a
Sick and Tired: The Compromised Health of Social Assistance Recipients and the Working Poor in Ontario | 5
province with out-dated employment standards’ protec-tions and a lack of enforcement. While recent provincial government action offers new hope for exploited workers, this represents only one small step on the path toward ensuring basic rights for all Ontario workers.
Lack of an adequate minimum wage remains an issue for Ontario workers. While the current provincial gov-ernment has made modest annual increases, today’s rate at $8.75 per hour still leaves full-year, full-time workers living in poverty. Lack of access to federal Employment Insurance (EI) benefits further compromises the health of the working poor by leaving them to the inadequacies of social assistance during periods of unemployment – an especially worrisome prospect as the economy continues to plummet.
RecommendationsWe offer the following recommendations to support the reduction of poverty in Ontario, to address the increased burden of ill health faced by poor people in Ontario, and to promote equitable access to health services in Ontario. These recommendations are based on the results of this study and supported by related research.
Improving the Provincial Poverty Reduction StrategyRecommendation 1: The provincial government estab- lish an independent panel to set Ontario Works and Ontario Disability Support Program rates, through an evidence-based process, to reflect the actual cost of living in Ontario communities. The basic needs and shelter portions of social assistance should reflect the actual costs of meeting basic needs, including health-related needs, and maintaining decent housing. Rates should take into account regional differences in the cost of living. The Canada Mortgage and Housing Corporation rental housing survey and local nutritious food basket measures can assist in this regard. Once established, rates should be fully indexed to inflation.
Recommendation 2: The federal and provincial govern-ment take immediate action to bring Canada into com-pliance with its commitment to the human right to food under various international treaties. Local nutritious food basket measures assess the cost of a nutritious diet in specific communities. These are useful tools to guide government action on the right to food.
Recommendation 3: The provincial government under-take a review of ODSP, including a broad-based com-munity consultation, to identify barriers to access and implement changes to ensure that people with disabili-ties in financial need have timely access to this essential program.
Recommendation 4: The provincial government report transparently on its efforts to protect temp agency work-ers and enforce employment standards. We also recom-mend that the provincial government update labour standards’ legislation to protect the rights of workers engaged in other forms of precarious employment. These workers include those deemed self-employed by employ-ers seeking to offload employee-related responsibilities and expenses. Finally, we recommend that the provincial government set minimum wage rates to ensure that no full-time, full-year worker in Ontario lives in poverty.
Recommendation 5: The provincial government expand its existing target to reduce poverty by 25% in 5 years for all Ontarians. In addition to recognizing the full face of poverty in Ontario, an inclusive goal will also reflect the fact that poor children live in poor families and that child poverty cannot be addressed without a simultaneous focus on family and adult poverty.
Taking Action on the Federal LevelRecommendation 6: The federal government introduce a national poverty reduction strategy with concrete targets and timelines, and that it monitor and provide regular public updates on the progress of this plan.
Recommendation 7: The federal government restore Employment Insurance as a universal social program by expanding the eligibility criteria to address the needs of workers in the precarious labour force, ensuring equal access to benefits regardless of residence, improving benefit levels and increasing coverage periods. Rather than divert EI contributions to cover federal deficits and pay down debt, as has been government practice for the last decade, these funds should be used for their intended purpose, to support unemployed workers.
Improving Health Care Access, Promoting Health EquityRecommendation 8: The provincial government take action to ensure equitable access to health care services irrespective of income and poverty status, and reduce
6 | Sick and Tired: The Compromised Health of Social Assistance Recipients and the Working Poor in Ontario
the ability to pay as a factor in accessing health care in Ontario. Expansion of and increased funding to commu-nity health centres (which focus on the health needs of marginalized communities), expansion of dental, vision, prescription drug and hospital care coverage, and expan-sion of the Ontario Trillium Drug Plan are key areas for action. Language interpreter services and health ambas-sadors (non-professionals within communities that can provide information and referrals) are critical supports to promote preventative health care and deliver culturally-appropriate health services.
Improving Research Tools, Focusing on Equity-Seeking GroupsRecommendation 9: Statistics Canada revise future ver-sions of the Canadian Community Health Survey to allow for the collection of income data that distinguishes between general social assistance (short-term assistance)
programs and disability support programs (long-term) in each province.
Recommendation 10: Additional research be conducted to better understand the effects of income inequality, poverty, social assistance and labour market conditions on the health and health care use of women, racialized groups, Aboriginal people, immigrants and people with disabilities. We also recommend that analyses be con-ducted to better understand how place of residence, such as neighbourhood or region, may relate to poor health.
Sick and Tired is the companion report to Poverty is Making Us Sick: A Comprehensive Survey of Income and Health in Canada. Our first report documented the dramatic health inequities among income groups in Canada across a broad range of chronic conditions and health measures, as well as, different patterns of health care use accord-ing to income. Both reports are available online at www.socialplanningtoronto.org.

Sick and Tired: The Compromised Health of Social Assistance Recipients and the Working Poor in Ontario | 7
In August 2008, the World Health Organization released a groundbreaking study on the social determinants of health – the political, social and economic forces that shape people’s health and people’s lives. Closing the Gap in a Generation documents health inequities between and within countries revealing the central role of public policy on individual health. Drawing from a broad base of research, this renowned team of scholars, policy makers and former heads of state and health ministries calls all governments to action on the social determinants of health.
They offer concrete proposals and real world examples that can close the health gap within a generation – from action to ensure fair and decent employment, access to safe and affordable housing, and the provision of qual-ity education and child care to the promotion of gender and racial equity, inclusive social and political decision-making and adequate social protections to ensure healthy living.
As one of the signatory countries to the World Health Organization’s Commission on Social Determinants of Health, Canada has made a commitment to advance the social determinants of health domestically and interna-tionally. In December 2008, the Ontario provincial gov-ernment introduced a poverty reduction strategy to reduce child poverty by 25% in 5 years – a landmark commitment in the history of Ontario (Government of Ontario, 2008). The provincial plan is an important vehicle for reducing poverty, stimulating the economy, and taking action on the social determinants of health.
Many individuals and groups have offered moral and ethi-cal arguments for the need to act on poverty as it relates to ill health. Research also supports the economic benefit
of reducing poverty. In a recent study on the economic costs of poverty in Ontario, researchers pegged poverty-induced costs related to provincial health care at $2.9 billion (Laurie, 2008). Real investments to address poverty in Ontario are critical to supporting individual health and safeguarding the fiscal well-being of our health care system and our economy.
In this report, we focus on the health of social assistance recipients and the working poor in Ontario – two groups that should be at the centre of Ontario’s poverty reduc-tion plan. We first present results on the health and health care use of these low income Ontarians, and we then offer a series of recommendations to strengthen the provin-cial government’s poverty reduction strategy, to address the disproportionate burden of poor health experienced by low income Ontarians, and to promote health equity within Ontario.
Sick and Tired is the companion piece to Poverty is Making Us Sick: A Comprehensive Survey of Income and Health in Canada. In our first report, we examined the health and health care use of the Canadian population by household income quintile. Income quintiles divide the popula-tion into five equal groups starting with the bottom 20% of the population with the lowest household incomes, followed by the next 20% and so on, up to the top 20% with the highest household incomes. This report documented dramatic health inequities among income groups across a broad range of chronic conditions and health measures, as well as different patterns of health care use according to income. Not only did the rich have better health outcomes than the poor, health status improved at each successive step up the income ladder. Using multivariate analyses, we found that an increase of $1,000 in household income
Sick and Tired: The Compromised Health of Social Assistance Recipients and the Working Poor in Ontario“Inequity in the conditions of daily lives is shaped by deeper social structures and processes; the inequity is systematic, produced by policies that tolerate or actually enforce unfair distribution of and access to power, wealth, and other necessary social resources.”
- World Health Organization, 2008
Introduction

8 | Sick and Tired: The Compromised Health of Social Assistance Recipients and the Working Poor in Ontario
for the lowest income Canadians was associated with sub-stantial decreases in rates of many chronic conditions.
Building on our first report, Sick and Tired focuses on health equity issues in Ontario. In this document, we focus in particular on recipients of social assistance and on the working poor. Our findings are broadly in line with those of the earlier study, though the differences among groups are often more pronounced in the present report.
MethodThis analysis is based on Ontario data from the most recent Canadian Community Health Survey (CCHS) conducted in 2005. Statistics Canada’s CCHS is the most comprehen-sive survey of the health and health care use of Canadi-ans. Health outcome and health care use information for the Ontario population aged 18-64 years was utilized in this analysis. A total of 24,464 Ontario respondents were included. Standard methods were used to weight the data in order to represent the overall population.
We compared the incidence of specific chronic conditions, health-related measures and health care use, adjusted for age, for three groups:
Working Poor:• respondents whose main source of household income is from wages, salaries or self-em-ployment and whose household income is at or below the Low Income Measure (LIM)
Social Assistance Recipients: • respondents whose main source of household income is from provincial or municipal social assistance or welfare and whose household income is at or below the LIM; this group includes both Ontario Works (OW) and Ontario Disability Support Program (ODSP) recipients
Non-Poor: • respondents whose household income is above the LIM
Statistics Canada’s LIM was used to categorize respon-dents as low income or not. The LIM is a widely used measure of low income. LIMs are set at 50% of the median household income for Canada and take into account family size.
The CCHS does not distinguish between OW and ODSP income sources. For this reason, the social assistance group includes both OW and ODSP recipients.
Multivariate analyses were conducted to better under-stand the multiple factors associated with ill health. These analyses included the following variables: age,
gender, racialized status (referred to by Statistics Canada as visible minority), Aboriginal status, educational attain-ment, participation and activity limitation (used as a proxy for disability), physical activity level, daily smoker status, employment status, adjusted household income, and social assistance receipt (as main source of household income). These analyses allowed us to consider the ques-tion: when multiple factors associated with ill health are taken into account, are household income and/or social assistance receipt still significant predictors of ill health? As well, multivariate analyses allowed us to look at the association between social assistance receipt and ill health when disability status (among other factors) is taken into account (i.e. held constant).
A detailed description of the methodology is available online at www.socialplanningtoronto.org.
ContextSome important changes have occurred since 2005 when the survey was conducted. Rising unemployment and full-time job losses have hit Ontario workers hard (Sta-tistics Canada, 2009, January 9). Ontario manufacturers have shed a staggering one in ten jobs between 2003 and 2007, with further declines into 2008 (Ontario Federation of Labour, 2007; Statistics Canada, 2009, January 9). Early effects of this historical economic crisis are likely to have pushed more people into poverty, further compromising individual health – and it’s far from over.
On a positive note, Ontario’s minimum wage rate was increased by $1.30 per hour between 2005 and 2008 (Ontario Ministry of Labour, n.d.). While welcome, these recent increases have only helped to make up for lost ground from a rate freeze that extended from 1995 and 2003 under the previous provincial government. At $8.75 per hour, the current rate offers minimum wage earners just about the same purchasing power as their counter-parts had in 1995. Today’s minimum wage remains a pov-erty wage, and as such, a health hazard to these low wage workers.
Beginning in 2003 and continuing since 2005, the pro-vincial government introduced periodic 2-3% increases to social assistance rates (National Council of Welfare, 2006; National Council of Welfare, 2008). Prior to these rate increases, social assistance recipients endured a 21.6% cut in 1995 followed by an 8-year rate freeze under the previ-ous government. While a step in the right direction, the

Sick and Tired: The Compromised Health of Social Assistance Recipients and the Working Poor in Ontario | 9
current government’s inflation-matching increases have done little to fundamentally change the position of social assistance recipients. In 2007, their incomes remained at 33% to 61% of Statistics Canada’s Low Income Cut-Off. Research suggests that these modest increases have con-tributed little to improving the quality of life or health outcomes for social assistance recipients in Ontario (Lightman et al., 2008a, 2008b, 2005a, 2005b).
Today’s global economic crisis, coupled with the con-tinued disadvantage of low income Ontarians, offers no reason to imagine that the health prospects of low income working-age Ontarians have improved since our survey data was collected in 2005. In fact, forecasts for a contin-ued steep downturn through 2009 suggest even tougher economic times ahead for growing numbers of Ontarians, and greater risks to individual health.
ResultsTable 1 shows the characteristics of the poverty status groups included in this analysis. Poverty status groups vary substantially on many characteristics. The poor groups have disproportionately larger numbers of women, Aboriginal people, members of racialized groups, and immigrants.
Women comprise nearly two-thirds of the social assis-tance group compared to 55% of the working poor and just about half of the non-poor group. Nine percent of the social assistance group is Aboriginal compared to just 3% of the working poor and 2% of the non-poor group. Almost half of the working poor are members of racial-ized groups compared to 40% of the social assistance group and just 20% of the non-poor group. Over one-half of the working poor group are immigrants compared to just over one-third of the social assistance group and 28% of the non-poor group.
The social assistance recipient (40 years) and non-poor (41 years) groups have higher mean ages than the working poor group (37 years).
The social assistance group includes disproportionate numbers of single people (32%) and lone parent families (31%). In contrast, single people make up 17% of the work-ing poor and 13% of the non-poor, and lone parent fami-lies comprise 13% of the working poor and just 6% of the non-poor. Households with children make up a full 60% of the working poor compared to 45% of social assistance recipients and 43% of the non-poor.
At 84%, the non-poor rate for post-secondary graduate attainment is twice that of the social assistance group (42%). Almost 7 in 10 of the working poor completed post-secondary studies. In contrast, the social assistance group (29%) has 10 times the rate of not completing high school compared to the non-poor group (2.7%). At 6.1%, the working poor group had more than two times the rate of not completing high school compared to the non-poor.
More than four out of five of the non-poor have current jobs compared to nearly three-quarters of the working poor and just 14% of the social assistance group. All of the working poor and almost all of the non-poor reported household income from wages, salaries or self-employ-ment. Although considerably lower than the working poor and non-poor, still more than one-quarter of the social assistance group reported some household income from wages, salaries or self-employment.
Median household incomes varied considerably with the non-poor reporting $80,000, compared to just $21,000 for the working poor and a meagre $13,000 for social assis-tance recipient households.

10 | Sick and Tired: The Compromised Health of Social Assistance Recipients and the Working Poor in Ontario
Table 1. Characteristics of poverty status groups (percent unless otherwise noted)
Non-poor (unweighted n=22,127)
Working poor(unweighted n=1,612)
Social assistance (unweighted n=725)
GenderMale 51.5 44.6 38.5Female 48.5 55.4 61.5
AgeMean age 40.6 36.6 40.118-24 12.6 22.5 15.525-34 20.9 21.3 17.335-44 27.0 27.9 28.845-54 23.4 18.8 21.455-64 16.1 9.4 16.9
Ethnoracial/cultural groupAboriginal person 1.5 2.6 8.9Member of racialized group 20.4 47.8 39.5
Immigrant statusImmigrant (born outside of Canada) 28.1 53.3 36.6
Household compositionSingle person 12.6 16.5 31.6Couple with child/children 51.9 52.0 21.0Lone parent with child/children 5.7 12.8 31.2Couple without children 21.8 8.6 10.7Other family composition 8.1 10.1 5.6Households with children 43.2 60.0 45.1
Educational attainmentLess than secondary school 2.7 6.1 29.0Secondary school graduate 8.9 15.4 17.7Some post-secondary 4.7 9.4 11.6Post-secondary graduate 83.8 69.1 41.8
Employment status, income and income sourceHas current job 83.3 74.41 13.8
Has household income for 12-month period preceding interview from wages, salaries or self employment 96.7 100.0 27.6
Median household income for 12-month period preceding interview $80,000 $21,000 $13,000

Sick and Tired: The Compromised Health of Social Assistance Recipients and the Working Poor in Ontario | 11
Health and Health-Related MeasuresIn almost every instance, the social assistance group had dramatically higher rates of health problems and chronic conditions across a broad range of measures compared to the working poor and the non-poor groups. Strong sta-tistically significant differences were found between the social assistance group and the other two groups.
The working poor had significantly worse health than the non-poor on several measures. Unexpectedly, the non-poor were found to have higher rates on some health outcomes compared to the working poor. This latter finding was largely a product of the ‘healthy immigrant effect’, a phe-nomenon discussed below in the Implications section.
This section focuses on selected major findings from the analyses. Full results are provided in the Appendix.
Self-rated health - Respondents were asked to rate their health as excellent, very good, good, fair or poor. Self-rated health is a valid and reliable measure, strongly correlated with objective measures of health including physicians’ ratings (see Shields & Shooshtari, 2001 for review).
On average, Ontarians rate their health highly. However these ratings differ significantly between poverty status groups. As shown in figure 1 (shown below), the social assistance group had significantly higher rates of poor or fair health compared to the working poor and non-poor groups – more than 3 to 5 times higher. The working poor had significantly higher rates than the non-poor group as well.
Disability - Respondents were asked about participation and activity limitations that affected their daily lives at work, school, home and in other settings. The social assis-tance group had significantly higher rates of participation and activity limitations – 3.5 to 4 times higher than that of the other two groups.
Respondents reported the number of days during the two-week period preceding their interview that they spent all or most of the day in bed because of illness or injury. Again the social assistance group had significantly higher rates at 2.8 days compared to .8 days for the other two groups.
Stress - The social assistance group had significantly higher rates of high stress compared to the other two groups. Over one-third of the social assistance group reported feeling quite a bit or extremely stressful most days compared to around one-quarter of respondents from the other two groups.
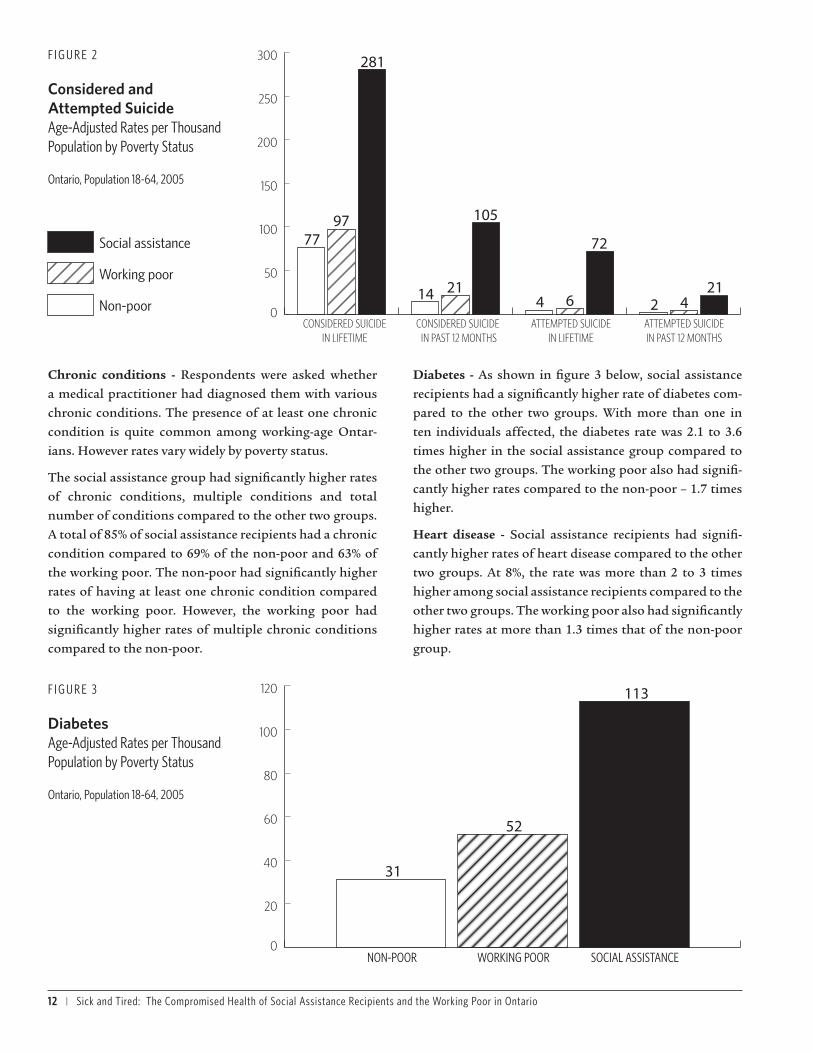
Suicide2 - Particularly disturbing results emerged in analyses pertaining to suicide. As shown in figure 2 (on the following page), the social assistance group had sig-nificantly higher rates of considering suicide and attempt-ing suicide than the other two groups. In the 12-month period preceding their interview, one in ten respondents from the social assistance group considered suicide and 2% attempted suicide – rates that are 10 times higher than the non-poor group.
The working poor also had significantly higher rates of considering and attempting suicide than the non-poor group. The working poor group was twice as likely to attempt suicide in the 12-month period preceding their interview compared to the non-poor group.
F I G U R E 1
'Poor' or 'Fair' Self-Reported HealthAge-Adjusted Rates per Thousand Population by Poverty Status
Ontario, Population 18-64, 2005
0
50
100
150
200
250
300
350
400
SOCIAL ASSISTANCEWORKING POORNON-POOR
117
383
75
12 | Sick and Tired: The Compromised Health of Social Assistance Recipients and the Working Poor in Ontario
Chronic conditions - Respondents were asked whether a medical practitioner had diagnosed them with various chronic conditions. The presence of at least one chronic condition is quite common among working-age Ontar-ians. However rates vary widely by poverty status.
The social assistance group had significantly higher rates of chronic conditions, multiple conditions and total number of conditions compared to the other two groups. A total of 85% of social assistance recipients had a chronic condition compared to 69% of the non-poor and 63% of the working poor. The non-poor had significantly higher rates of having at least one chronic condition compared to the working poor. However, the working poor had significantly higher rates of multiple chronic conditions compared to the non-poor.
Diabetes - As shown in figure 3 below, social assistance recipients had a significantly higher rate of diabetes com-pared to the other two groups. With more than one in ten individuals affected, the diabetes rate was 2.1 to 3.6 times higher in the social assistance group compared to the other two groups. The working poor also had signifi-cantly higher rates compared to the non-poor – 1.7 times higher.
Heart disease - Social assistance recipients had signifi-cantly higher rates of heart disease compared to the other two groups. At 8%, the rate was more than 2 to 3 times higher among social assistance recipients compared to the other two groups. The working poor also had significantly higher rates at more than 1.3 times that of the non-poor group.
F I G U R E 2
Considered and Attempted SuicideAge-Adjusted Rates per Thousand Population by Poverty Status
Ontario, Population 18-64, 2005
0
50
100
150
200
250
300
CONSIDERED SUICIDEIN LIFETIME
CONSIDERED SUICIDE IN PAST 12 MONTHS
ATTEMPTED SUICIDEIN LIFETIME
ATTEMPTED SUICIDEIN PAST 12 MONTHS
Social assistance
Working poor
Non-poor
7797
281
14 21
105
4 6
72
2 421
F I G U R E 3
Diabetes Age-Adjusted Rates per Thousand Population by Poverty Status
Ontario, Population 18-64, 2005
0
20
40
60
80
100
120
SOCIAL ASSISTANCEWORKING POORNON-POOR
31
52
113
Sick and Tired: The Compromised Health of Social Assistance Recipients and the Working Poor in Ontario | 13
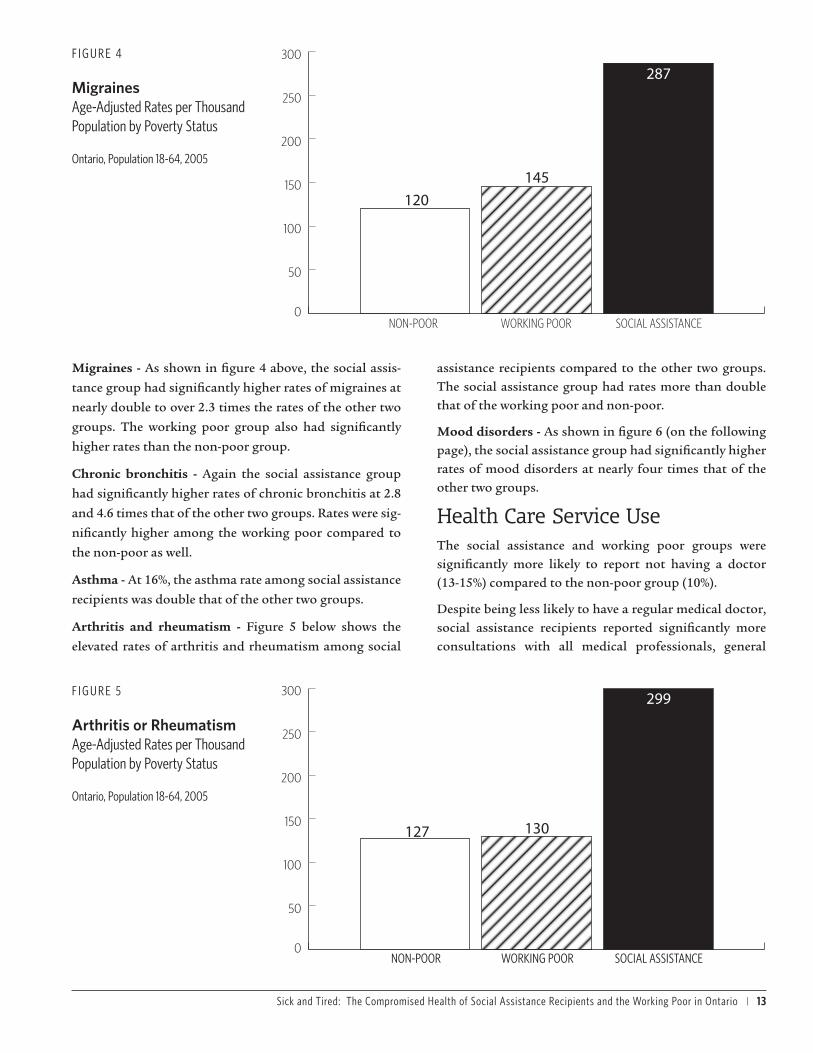
Migraines - As shown in figure 4 above, the social assis-
tance group had significantly higher rates of migraines at
nearly double to over 2.3 times the rates of the other two
groups. The working poor group also had significantly
higher rates than the non-poor group.
Chronic bronchitis - Again the social assistance group
had significantly higher rates of chronic bronchitis at 2.8
and 4.6 times that of the other two groups. Rates were sig-
nificantly higher among the working poor compared to
the non-poor as well.
Asthma - At 16%, the asthma rate among social assistance
recipients was double that of the other two groups.
Arthritis and rheumatism - Figure 5 below shows the
elevated rates of arthritis and rheumatism among social
assistance recipients compared to the other two groups. The social assistance group had rates more than double that of the working poor and non-poor.
Mood disorders - As shown in figure 6 (on the following page), the social assistance group had significantly higher rates of mood disorders at nearly four times that of the other two groups.
Health Care Service UseThe social assistance and working poor groups were significantly more likely to report not having a doctor (13-15%) compared to the non-poor group (10%).
Despite being less likely to have a regular medical doctor, social assistance recipients reported significantly more consultations with all medical professionals, general
F I G U R E 4
Migraines Age-Adjusted Rates per Thousand Population by Poverty Status
Ontario, Population 18-64, 2005
0
50
100
150
200
250
300
SOCIAL ASSISTANCEWORKING POORNON-POOR
120145
287
F I G U R E 5
Arthritis or Rheumatism Age-Adjusted Rates per Thousand Population by Poverty Status
Ontario, Population 18-64, 2005
0
50
100
150
200
250
300
SOCIAL ASSISTANCEWORKING POORNON-POOR
127
299
130

14 | Sick and Tired: The Compromised Health of Social Assistance Recipients and the Working Poor in Ontario
practitioners, specialists, and other medical practitioners compared to the non-poor and working poor groups.
The non-poor group had significantly more consultations with all medical practitioners, specialists, and other medi-cal practitioners compared to the working poor group. In contrast, the working poor group had significantly more consultations with general practitioners than the non-poor group.
Figure 7 below shows the differences in consultations with medical practitioners among poverty status groups.The social assistance group had a significantly higher number of nights spent in a hospital, nursing home or convalescent home compared to the other two groups.
Preventative Health Care Service UseIn general, the working poor and social assistance groups were less likely to have accessed various preventative health measures than the non-poor group. In some cases, the working poor group had lower rates than the social assistance group.
Most working-age Ontarians have had an eye exam and visited a dentist in the past. However important differ-ences emerged for poverty status groups.
The working poor were significantly more likely to report never having an eye exam compared to the non-poor
F I G U R E 6
Mood Disorder Age-Adjusted Rates per Thousand Population by Poverty Status
Ontario, Population 18-64, 2005
0
50
100
150
200
250
300
SOCIAL ASSISTANCEWORKING POORNON-POOR
253
6261
F I G U R E 7
Consultations with Medical Practitioners Age-Adjusted Totals per Thousand Population by Poverty Status
Ontario, Population 18-64, 2005
0
5000
10000
15000
20000
Social assistance
Working poor
Non-poorALL MEDICAL
PRACTITIONERSGENERAL
PRACTITIONERSSPECIALISTS OTHER MEDICAL
PRACTITIONERS
1936
0
1489
1236 2525
5549
4218
9935
7374
3344
2960
87989988

Sick and Tired: The Compromised Health of Social Assistance Recipients and the Working Poor in Ontario | 15
group. The non-poor group was significantly more likely to report having a recent eye exam compared to the poor groups.
The working poor group was significantly more likely to report never having visited a dentist compared to the other two groups. Again, the non-poor group was signifi-cantly more likely to report having a recent visit to a dentist compared to the poor groups.
With regard to women’s health, the working poor and social assistance groups were significantly more likely to report never having had a breast exam, a mammogram among women 40-64 years of age, or a pap smear test com-pared to the non-poor group.
Among 40-64 year olds, the working poor group was significantly more likely to report never having had a colorectal cancer screening test compared to the non-poor and social assistance groups.
Unmet Health Care NeedsSocial assistance recipients reported significantly higher rates of unmet health care needs compared to the other two groups. Over one-quarter reported unmet health care needs compared to 13-15% of the working poor and non-poor groups.
Respondents from the poor groups were significantly more likely to report cost (20-22%) as a reason for not receiving care compared to the non-poor group (9%). Poor respondents (4-7%) were also significantly more likely to report transportation problems compared to non-poor respondents (1%).
Access to Health InsuranceStrong significant differences were found among poverty status groups on access to health insurance. About four out of five respondents from the non-poor and social assistance groups had health insurance for prescription medications compared to just over two out of five respon-dents from the working poor group. Similarly, about 70% of respondents from the non-poor and social assistance groups had insurance for eyeglasses and contact lenses compared to 29% of the working poor group.
A different pattern emerged for dental care coverage and hospital charges. Non-poor respondents (78%) had the highest rate of dental care coverage, followed by the social assistance group (66%) and then the working poor
group (39%)3. Significant differences were found between all three groups. Almost three out of four non-poor respondents have insurance to cover hospital charges compared to 24-28% of the social assistance and working poor groups.
Food InsecurityThe rate of household food insecurity among social assistance recipients was 15 times higher than that of the non-poor group, and almost 3 times higher than the work-ing poor group. Almost half of all respondents from the social assistance group were in food insecure households compared to 17% of the working poor and 3% of the non-poor. These differences were highly significant.
Chronic Conditions: Examining Multiple FactorsWe conducted a series of multivariate analyses to test for associations between household income and ill health, and social assistance receipt and ill health, when other fac-tors related to ill health are taken into account (see Table F in the Appendix). These control variables included: age, gender, racialized status, Aboriginal status, educational attainment, participation and activity limitation (a proxy for disability status), physical activity level, daily smoker status and employment status.
After taking into account all of these factors, household income and/or social assistance receipt continued to be significantly associated with 6 out of 8 chronic condition categories, and 15 out of 21 specific chronic conditions.
It is important to stress that these associations are statisti-cally significant after taking into account (i.e. holding con-stant) the effects of demographic, educational, employ-ment, health behaviour factors and disability status.
ImplicationsSocial Assistance and SicknessResults of this study paint a grim picture of the health of social assistance recipients in Ontario. Social assistance recipients have significantly higher rates of poor health and chronic conditions on 38 of 39 health measures com-pared to the non-poor, and 37 of 39 health measures com-pared to the working poor. Their rates on conditions such as diabetes, heart disease, chronic bronchitis, arthritis

16 | Sick and Tired: The Compromised Health of Social Assistance Recipients and the Working Poor in Ontario
and rheumatism, mood disorders and anxiety disorders are 2.4 to 4.6 times higher than that of the non-poor. Not surprisingly, over one-third report high stress levels. Forty percent of the social assistance group often experience participation and activity limitations that interfere with their everyday lives.
Perhaps most distressing, over one-quarter of social assistance recipients considered suicide in their lifetime and one in ten in the 12-month period preceding their interview. The social assistance group reported attempt-ing suicide at rates that were 5 to 18 times higher than the non-poor and working poor groups.
Multivariate analyses resulted in powerful findings link-ing household income and social assistance receipt to a broad range of chronic conditions, even when other fac-tors, including disability status and health behaviour factors such as smoking and physical activity, were taken into account.
The median annual household income for this highly stressed, health compromised and vulnerable group was a mere $13,000.
While data from this study cannot directly address the causal relationship between income and health, research-ers that have explored this question have found that while poor health affects income by diminishing a person’s ability to engage in paid employment, the strongest causal influence shows low income leading to poor health (Phipps, 2003). Regardless of whether individuals ini-tially experience falling incomes as a result of ill health or declining health as a result of low income, the fact remains that poverty further compromises health and undermines a person’s ability to cope with chronic health problems and to get well.
An Illness Producing SystemOur analysis raises important questions about Ontario’s social assistance system – a system that leaves the most health compromised group of working-age people in the province to subsist on meagre income assistance. In fact, rates are so low that almost half of all recipients live in food insecure households.
Ontario’s social assistance system includes two main pro-grams: Ontario Works (OW) and the Ontario Disability Support Program (ODSP). OW is intended as the short-term income assistance program of last resort, providing financial and employment assistance to recipients. ODSP
provides longer-term income and employment assistance
to Ontarians with disabilities.
OW and ODSP rates are abysmally low. In 2005 when our
data was collected, estimated annual incomes4 for OW
recipients were $7,007 for a single person, $14,451 for a
lone parent with one child and $19,302 for a couple with
two children (National Council of Welfare, 2006). A person
with a disability receiving ODSP had an estimated annual
income of $12,057. These incomes were between 34% and
58% of the poverty line5, with single OW recipients at the
lowest level.
Comparing Ontario inflation-adjusted social assistance
incomes between 1986 and 2005, the National Council of
Welfare (2006) found the lowest incomes for three out of
four family types occurred in 2005. The lowest social assis-
tance income for a couple with two children occurred in
2003. By 2005, the annual income for this family type had
increased by $75, about $6 more per month.
While the provincial government has made modest 2-3%
periodic increases to social assistance rates in recent
years, these rates remain troublingly low (National Coun-
cil of Welfare, 2006; National Council of Welfare, 2008).
Social assistance income statistics for 2007 reveal further
declines for a single employable person and a person
with a disability, when inflation is taken into account
(National Council of Welfare, 2008). Since 2005, families
with children fared better with an increase in social assis-
tance incomes of 9.1% for a lone parent with one child and
4.7% for a couple with two children. However, estimated
annual social assistance incomes remained at 33% to 61%
of the poverty line in 2007, with single individuals receiv-
ing OW continuing to be the worst off. Inflation-matching
increases alone have not changed the woeful inadequacy
of Ontario’s social assistance rates.
While disability assistance rates are well below the poverty
line, ODSP provides higher levels of income assistance to
recipients compared to OW. With their increased burden
of compromised health and corresponding health care
expenses, access to ODSP is vital to people with disabili-
ties in financial need. We found very high rates of chronic
conditions and ill health among social assistance recipi-
ents in general. While it was not possible to distinguish
between OW and ODSP recipients in the dataset, these
alarming rates, coupled with very low incomes, raise ques-
tions about the extent to which people with disabilities
are gaining access to ODSP.
Sick and Tired: The Compromised Health of Social Assistance Recipients and the Working Poor in Ontario | 17
Several studies have documented the considerable barriers that Ontarians with disabilities face in accessing ODSP (Centre for Addiction and Mental Health, 2003; Income Security Advocacy Centre, 2003; ODSP Action Coalition, 2008; Social Planning Council of Ottawa, 2001; Street Health, 2006). While some improvements have been made since the program’s inception in 1998 (Ombudsman Ontario, 2006), advocates continue to raise serious con-cerns about access to ODSP. Lack of access leaves people with disabilities either with no income or struggling to survive on OW (Ombudsman Ontario, 2006).
Social assistance recipients in Ontario live in grinding poverty. For the large numbers struggling with ill health, poverty further undermines their ability to cope with health problems and to improve their health. In addition, social assistance recipients have the extra burden of deal-ing with Ontario’s social assistance system – a complex and punitive bureaucracy that promotes stress, anxiety, depression and self-blame (Community Social Planning Council of Toronto & Family Service Association of Toronto, 2004; Herd et al., 2005; Herd & Mitchell, 2002; Lightman et al., 2003a; Lightman et al., 2003b). As well, social assistance recipients are confronted with societal judgment and social exclusion associated with being ‘on welfare’ (Power, 2005; Reid & Tom, 2006; Swanson, 2001). Rather than a source of support in hard times, the system and the societal baggage associated with it further under-mine the health of social assistance recipients.
Poor Health and The Working PoorThe health of the working poor is a more complicated story. The working poor have higher rates of diabetes, heart disease, chronic bronchitis, migraines, multiple chemical sensitivities and learning disabilities compared to the non-poor group. They have lower self-reported health and mental health, a higher rate of household food insecurity and are more likely to report multiple chronic conditions compared to the non-poor group.
Compared to the non-poor, the working poor were more likely to consider suicide in their lifetime and in the 12-month period preceding their interview. They were twice as likely as the non-poor group to attempt suicide in the year prior to their interview.
While the working poor group had higher rates on a number of health problems, they did not differ from the non-poor group in the average number of days spent in bed due to illness or injury. This is likely related to working
conditions in the precarious labour market that generally provide low wages with no benefits. While the working poor may need time to recover, and their health may be further compromised by continuing to work through ill-ness and injury, taking time off may be a luxury that they simply cannot afford. In contrast, the non-poor group was more likely to enjoy both higher wages that would allow them to take time off, and benefits such as sick days and long-term disability plans that prevent or reduce losses of wages related to illness and injury.
The Working Poor and the Healthy Immigrant EffectWhile the working poor have compromised health out-comes on a number of measures, the whole story of their health is more complex. The non-poor, compared to the working poor, were more likely to report having at least one chronic condition, and had higher rates of endocrine and metabolic conditions, circulatory system conditions, musculoskeletal conditions, miscellaneous conditions, allergies other than food allergies, high blood pressure, urinary incontinence, bowel disorder and other chronic conditions.
These differences can be explained, in large part, by a phenomenon called the “healthy immigrant effect”. National data strongly support the existence of the healthy immigrant effect, whereby immigrants and particularly newcomers to Canada enjoy better health, including lower rates of chronic conditions, than their Canadian-born counterparts overall (Newbold, 2006; Ng et al., 2005). Researchers have found that this health benefit diminishes over time until immigrant health levels begin to approxi-mate that of their Canadian-born counterparts, and is particularly evident among non-European immigrants.
Researchers have explored this issue in some depth. They point to the impact of immigration policies that exclude immigrants with ‘medically inadmissible’ conditions as a reason for newcomers’ superior health relative to their Canadian-born peers and barriers to health care services that result in lower rates of medical diagnoses (Newbold, 2006). The declining health of immigrant groups over time has been attributed to the impact of disproportion-ate rates of poverty, poor working conditions and the lack of recognition of internationally-acquired credentials.
In our sample, over half of the working poor are immi-grants compared to 28% of the non-poor group. Despite their income levels, it is not surprising to find better than

18 | Sick and Tired: The Compromised Health of Social Assistance Recipients and the Working Poor in Ontario
expected health outcomes for the working poor as a result of the healthy immigrant effect. We conducted additional analyses showing that immigrants in the working poor group had been living in Canada an average of 12 years compared to 22 years in the non-poor group. This data further suggested that the healthy immigrant effect was at work.
Additional analyses revealed that the healthy immigrant effect was a significant factor in explaining the contrary results between the working poor and non-poor groups. We conducted separate analyses for the Canadian-born and immigrant populations in Ontario for the ten health outcomes where the non-poor group had higher rates than the working poor group.6
In analyses of the Canadian-born population controlling for age, the results either reversed themselves, where the working poor had higher rates of ill health than the non-poor or no differences were found between groups.
In analyses of the immigrant population controlling for age and length of residency in Canada, we found either no significant differences between the working poor and non-poor groups, or a significant but diminished differ-ence between groups where the non-poor continued to have higher rates for some health problems compared to the working poor group. After taking into account age and length of residency in Canada, the non-poor immi-grant group had significantly higher rates of the following chronic conditions/categories compared to the working poor immigrant group: having at least one chronic con-dition, musculoskeletal conditions, miscellaneous con-ditions, allergies other than food allergies, high blood pressure and bowel disorder. Differences in experiences with the health care system may also explain some of these findings. Additional research is needed to further unpack these results.
Low Wages, Precarious Work and Compromised HealthLabour markets in industrialized countries like Canada have undergone major restructuring over the past 30 years, resulting in an expansion of precarious employ-ment. In Canada, 37% of jobs are part-time, temporary or self-employed positions (Community-University Research Alliance on Precarious Employment, 2005). In 2005, 22.5% of Canadians, aged 25-64 years, working full-year full-week had an annual income of less than $30,000, up from 21.1% in 2000 (Statistics Canada, 2008). Among women,
aged 25-64 years, working full-year full-week, 23.5% had
an annual income below $30,000 compared to 21.7% of
men. Almost one-quarter of all jobs in Ontario pay less
than $10 an hour (Workers’ Action Centre, 2007a). Stud-
ies show that women, immigrants, and workers of colour
are over-represented in the ranks of Ontario’s working
poor (Campaign 2000, Citizens for Public Justice & Work-
ers’ Action Centre, 2006).
The working poor in our study had a median annual
income of $21,000 and low rates of insurance coverage for
dental, vision, prescription drug and hospital expenses.
Nearly half were members of racialized groups. More than
half were immigrants, and more than half were women.
The working poor group is likely employed in low wage
and precarious positions. These jobs typically include
short-term, temporary and contract work with low pay and
few, if any, benefits. Part-time employment is also a fea-
ture of precarious work. While some workers may desire
part-time employment, many part-time workers seek and
require full-time jobs to make ends meet. Workers in the
precarious labour market may also juggle multiple jobs,
are vulnerable to exploitive employers and generally lack
access to collective representation.
In Toronto, the Workers’ Action Centre (2007b) has docu-
mented widespread employment standards’ violations,
the complete exclusion of many workers from employ-
ment standards’ protections, and a lack of enforcement of
standards for workers who are covered by the provincial
Employment Standards Act (an issue that the Province is
beginning to address through its poverty reduction strat-
egy). This research links poor working conditions from
precarious employment to increased stress resulting in
poor physical and mental health.
Due to restructuring of the Employment Insurance (EI)
system (formerly Unemployment Insurance) in the mid-
1990s, many workers with precarious employment are now
ineligible for federal Employment Insurance (EI) benefits
when laid off. This is particularly pronounced in Ontario,
compared to the rest of Canada, and in the big urban
centres such as Toronto. Drastic changes to the program
rendered many workers with short-term and/or part-time
positions – particularly women – ineligible due to inade-
quate insurable hours (Canadian Labour Congress, 1999).
When short-term jobs end, these workers must scramble
for other employment or turn to the social assistance
system with its considerably lower benefit levels.

Sick and Tired: The Compromised Health of Social Assistance Recipients and the Working Poor in Ontario | 19
Lack of an adequate minimum wage has long been an issue for low wage workers in Ontario. The former Con-servative provincial government froze the minimum wage at $6.85 per hour during both of its terms in office from 1995 to 2003 (Ontario Ministry of Labour, 2003). While the Liberal provincial government elected in 2003 began making modest annual increases to the minimum wage, these increases have not been sufficient to pull minimum wage earners out of poverty.
In recent years, workers, community groups and labour organizations mounted a vigorous campaign calling on the provincial government to raise the minimum wage to $10 per hour immediately. The provincial government responded by slating annual increases to bring the mini-mum wage up to $10.25 per hour in 2010 (Ontario Ministry of Labour, n.d.). Despite these advances, the current rate at $8.75 per hour still leaves minimum wage workers in poverty. Economists from the Canadian Centre for Policy Alternatives peg a living wage for Toronto at $16.60, nearly double the current rate (Mackenzie & Stanford, 2008).
Low wage and precarious employment contributes to the compromised health of the working poor. Lack of access to EI benefits puts short-term contract workers further at risk by leaving them to the inadequacies of the social assistance system when their employment ends. On a bright note, recent provincial actions promise to improve the position of some vulnerable workers in Ontario. In response to workers’ advocacy efforts, the Ontario pro-vincial government recently adopted legislation to extend protections for temp agency workers, arguably some of the most vulnerable workers in the province (Ontario Minis-try of Labour, 2008). This legislation represents a first step toward improving protections for temporary workers in Ontario.
Health Care InequitiesNot surprisingly, the social assistance group with its much higher rates of chronic conditions and poor health reported significantly more consultations with medical practitioners of all kinds. These results are also expected given the requirements of ODSP applicants and recipients to provide detailed documentation from medical doctors to access and maintain benefits. Despite their frequent consultations with various medical professionals, the social assistance group was less likely to have a regular medical doctor compared to the non-poor group. While the working poor group reported more visits to general
practitioners compared to the non-poor group, they were also less likely to have a regular medical doctor compared to the non-poor group.
In a 25-year review of health care utilization in Canada, Curtis and MacMinn (2008) report some parallel find-ings. This study showed that people in Canada with lower socioeconomic status (SES) were less likely to visit a physi-cian compared to other residents. This inequity appears to be growing more prevalent over time. However, these researchers also found that once initial contact was made with a physician, residents with lower SES consulted with physicians more frequently than others. Similarly, we found both poor groups had more consultations with general practitioners compared to the non-poor group but were less likely to have a regular medical doctor.
Similar to our results with the working poor, these researchers found people in Canada with lower SES were less likely to see a specialist. Once initial contact was made with a specialist, these researchers found that income was no longer a factor in the number of specialist consulta-tions between groups. While the working poor in our study had fewer consultations with specialists than the non-poor group, social assistance recipients had more consultations with specialists compared to the non-poor and working poor groups. This latter finding demon-strates that important differences exist within the lower SES group.
In addition, our data showed lower rates of preventative health care utilization among poor groups compared to the non-poor group. Rates were especially troubling regarding women’s preventative health care where sub-stantial numbers of women in the poor groups had never had a pap smear test, breast exam or mammogram for those over 40 years of age.
As well, the working poor were much less likely to have insurance to cover additional health services compared to the non-poor group. Social assistance recipients reported lower rates for dental care and hospital expense coverage compared to the non-poor. Although social assistance recipients had higher rates for dental coverage than the working poor, their government-provided coverage is lim-ited to emergency services only.
In Ontario, delisting of some health care services has forced Ontarians without insurance to pay for additional services out of pocket (Browne, n.d.). Data from our study suggest that poor Ontarians are forgoing some health ser-vices due to cost. We found higher rates of unmet health

20 | Sick and Tired: The Compromised Health of Social Assistance Recipients and the Working Poor in Ontario
care need among the poor groups compared to the non-poor group, and cost cited as a factor for one in five poor respondents with unmet health care needs.
Our data and related studies reveal troubling inequities regarding health care service utilization (Curtis & Mac-Minn, 2008; Steele et al., 2002; Street Health, 2007). With regard to physicians and specialists, Curtis and MacMinn (2008) found that the largest inequities exist at the point of first contact. Their work documents a growing gap in the amount of health care received between the rich and the poor, Canadian-born and immigrant populations, and residents with lower levels of education compared to more highly educated residents. These trends have impor-tant implications for Ontario’s working poor and social assistance recipients.
Curtis and MacMinn offer some recommendations to address Canada’s growing health care inequities. They suggest an increased focus on language and cultural issues with regard to health care service provision, improved access to pharmaceuticals for residents who are unable to pay, increased access to physicians in poor areas, training of more physicians from diverse communities, public edu-cation, including development of multilingual materials, to promote use of preventative health care services, and development of clinical guidelines for physicians regard-ing appropriate referrals to specialists. These authors point out that improved access to primary care including medications may lessen the burden on emergency services and hospitals.
Human Costs, Health Care CostsThe increased burden of compromised health among social assistance recipients and the working poor under-mines the quality of life of poor Ontarians and results in increased costs to the health care system. In a study of the impact of chronic conditions, Schultz and Kopec (2003) found moderate to severe quality of life impacts for people with Alzheimer’s disease, urinary incontinence, effects of a stroke, arthritis and rheumatism, bowel disorders, chronic bronchitis and emphysema, back problems, epi-lepsy, heart disease and cataracts. Several of these condi-tions were more common among the poor groups in our study, particularly for social assistance recipients.
Individuals living with health problems and in poverty face difficult challenges. As supported by our research and others, they may lack the funds to pay for a nutritious diet which is critical to good health (Sieppert et al., 2004). The
stress of living in poverty, unable to pay the bills and cover basic needs, including health-related needs, further exac-erbates ill health. People living with ill health and in pov-erty are also disadvantaged by the lack of affordable hous-ing and problems of substandard housing in Ontario. For social assistance recipients, the ongoing surveillance, and arbitrary and punitive nature of the system contributes to poor health (Community Social Planning Council of Toronto & Family Service Association of Toronto, 2004; Herd et al., 2005; Lightman et al., 2003a; 2003b; Baker Col-lins, 2005).
Both social assistance recipients and the working poor are engaged in systems that reduce their sense of control over their lives – whether as a result of interactions with the social assistance system or within precarious labour markets where workers have little control over their work environments. The loss of personal control, characteristic of social assistance systems and precarious work environ-ments, has important implications for individual health.
Poverty also affects people’s relationships and connections to community. It can limit a person’s ability to participate in the broader community which may already be hindered by illness, contributing to social isolation which further undermines health. Material deprivation can erode rela-tionships among family members (Hamelin et al., 2002). Worried parents sacrifice their own material needs to pro-vide for their children in an attempt to spare them from the impact of poverty. For families living in poverty, a parent or family member’s illness adds additional strain to an already difficult situation.
In addition to the human costs, poverty also contributes to added financial costs to the health care system. Our study found longer in-patient stays for social assistance recipients compared to the working poor and non-poor groups. In Canada, total acute care inpatient costs were $17,046.6 million for 2004-05, representing over 37% of overall public health expenditures (Canadian Institute for Health Information, 2008a). Diseases of the respiratory and circulatory systems – conditions disproportionately present among the social assistance group and in some cases, the working poor group – account for 28.8% of all acute care inpatient costs. In a recent study on the eco-nomic costs of poverty in Ontario, researchers pegged poverty-induced costs related to provincial health care at $2.9 billion (Laurie, 2008).
The human and financial costs associated with poverty and ill health are considerable. Whether on moral or eco-nomic grounds, the need for bold action is clear.
Sick and Tired: The Compromised Health of Social Assistance Recipients and the Working Poor in Ontario | 21
We offer the following recommendations to support the reduction of poverty in Ontario, to address the increased burden of ill health faced by poor people in Ontario, and to promote equitable access to health services in Ontario. These recommendations are based on the results of this study and supported by related research.
Improving the Provincial Poverty Reduction Strategy
Recommendation 1The Province’s poverty reduction strategy includes a plan to review social assistance with an aim of “remov-ing barriers and increasing opportunities”. The proposed review is focused on improving rules to better facilitate movement of people from social assistance to work. Re-evaluating complex and contradictory social assistance rules is an important undertaking, however the strategy does not acknowledge one of the fundamental problems with social assistance – inadequate benefit levels that leave people living in deep poverty that compromises individual health and undermines the ability of people to move from social assistance to work. In addition to reviewing social assistance rules, we recommend that:
The provincial government establish an independent panel to set Ontario Works and Ontario Disability Sup-port Program rates, through an evidence-based process, to reflect the actual cost of living in Ontario communi-ties. The basic needs and shelter portions of social assis-tance should reflect the actual costs of meeting basic needs, including health-related needs, and maintaining decent housing. Rates should take into account regional differences in the cost of living. The Canada Mortgage and Housing Corporation rental housing survey and local nutritious food basket measures can assist in this regard. Once established, rates should be fully indexed to inflation.
Recommendation 2As a signatory country on the United Nations International Covenant on Economic, Social and Cultural Rights and the Rome Declaration on World Food Security, Canada has recognized the human right to food and has commit-ted to take action domestically and abroad. However our data show that half of all social assistance recipients and
17% of the working poor live in food insecure households.
In March 2008, a total of 314,258 Ontarians received food
from a food bank (Ontario Association of Food Banks,
2008). Between September 2007 and September 2008,
food banks in Ontario reported an average increase of 13%
in the number of people receiving food. Social assistance
recipients, the working poor and people with disabilities
rank high among food bank recipients. Access to a nutri-
tious diet is vital to individual health. It is unacceptable
that there are Ontarians going hungry because of poverty,
that mothers are sacrificing meals to feed their children,
and that residents are filling up on water and rationing
bread slices to make it through the month (Community
Social Planning Council of Toronto & Family Service
Association of Toronto, 2004; Daily Bread Food Bank,
2008; Human Resources and Social Development Canada,
1999; Smilek et al., 2000). Therefore, we recommend that:
The federal and provincial government take immediate action to bring Canada into compliance with its com-mitment to the human right to food under various inter-national treaties. Local nutritious food basket measures assess the cost of a nutritious diet in specific communi-ties. These are useful tools to guide government action on the right to food.
Recommendation 3Social assistance recipients in our study had much higher
rates of ill health, chronic conditions and activity limita-
tions compared to others, and reported very low household
incomes. These findings raise questions about Ontarians
with disabilities and their access to ODSP. Related litera-
ture and advocate accounts reveal considerable barriers
to ODSP for people with disabilities (Centre for Addic-
tion and Mental Health, 2003; Income Security Advocacy
Centre, 2003; Lightman et al., in press; ODSP Action
Coalition, 2008; Social Planning Council of Ottawa, 2001;
Street Health, 2006). Access to ODSP is vital to the health
of Ontarians with disabilities in financial need. Therefore,
we recommend that:
The provincial government undertake a review of ODSP, including a broad-based community consultation, to identify barriers to access and implement changes to ensure that people with disabilities in financial need have timely access to this essential program.
Recommendations

22 | Sick and Tired: The Compromised Health of Social Assistance Recipients and the Working Poor in Ontario
Recommendation 4Low wage work and poor working conditions in the pre-carious labour market impact on the health of the work-ing poor. Recent provincial action to introduce protec-tions for temp agency workers is an important first step in improving the working conditions and by extension, health and well-being of Ontario workers. The provin-cial government’s commitment to increase funding for employment standards’ enforcement is also a promising move. Following from these steps, we recommend that:
The provincial government report transparently on its efforts to protect temp agency workers and enforce employment standards. We also recommend that the provincial government update labour standards’ legis-lation to protect the rights of workers engaged in other forms of precarious employment. These workers include those deemed self-employed by employers seeking to offload employee-related responsibilities and expenses. Finally, we recommend that the provincial government set minimum wage rates to ensure that no full-time, full-year worker in Ontario lives in poverty.
Recommendation 5The Province’s poverty reduction strategy sets a goal of reducing child poverty by 25% in 5 years. While an important and laudable goal, the strategy sets no target for reducing adult poverty. In particular, adults without children are not a focus of the plan. According to data from our study, over half of social assistance recipient households and 40% of working poor households do not include children. Therefore, we recommend that:
The provincial government expand its existing target to reduce poverty by 25% in 5 years for all Ontarians. In addition to recognizing the full face of poverty in Ontario, an inclusive goal will also reflect the fact that poor children live in poor families and that child pov-erty cannot be addressed without a simultaneous focus on family and adult poverty.
Taking Action on the Federal Level
Recommendation 6Countries such as the United Kingdom and Ireland have adopted national poverty reduction strategies. In Canada, provincial governments in Ontario, Quebec and New-foundland and Labrador have taken the lead in develop-ing their own plans. Ontario’s poverty reduction strategy recognizes the role of the federal government in reducing poverty. In the last federal election, all major political par-ties with the notable exception of the Conservative Party made a commitment to introduce a federal poverty reduc-tion strategy. Poverty reduction is critical to promoting the health of Ontarians and Canadians alike. Therefore, we recommend that:
The federal government introduce a national poverty reduction strategy with concrete targets and timelines, and that it monitor and provide regular public updates on the progress of this plan.
Recommendation 7Dramatic reforms to the Unemployment Insurance system (now named Employment Insurance) have left the majority of unemployed workers in Ontario and across Canada without access to the benefits that they pay for. Women, youth, immigrants and big city dwellers were most affected by program reforms, showing the lowest rates of access to EI (Black & Shillington, 2005; Canadian Labour Congress, 1999; Townson & Hayes, 2007). Lack of access to EI benefits leaves unemployed workers to the health-compromising inadequacies of provincial social assistance. Rather than the income assistance program of last resort, Ontario Works has become the only option for tens of thousands of unemployed workers in Ontario. It is simply a matter of fairness that workers during periods of job loss, and particularly during these tough economic times, should have access to the benefits that they pay for. Therefore, we recommend that:
The federal government restore Employment Insurance as a universal social program by expanding the eligibil-ity criteria to address the needs of workers in the pre-carious labour force, ensuring equal access to benefits regardless of residence, improving benefit levels and increasing coverage periods. Rather than divert EI con-tributions to cover federal deficits and pay down debt, as has been government practice for the last decade, these funds should be used for their intended purpose, to support unemployed workers.
Sick and Tired: The Compromised Health of Social Assistance Recipients and the Working Poor in Ontario | 23
Improving Health Care Access, Promoting Health Equity
Recommendation 8Our data and related studies reveal troubling inequities regarding health care service access and utilization. Social assistance recipients and the working poor in our study had higher rates of unmet health care needs compared to the non-poor group. One in five people from the poor groups with unmet health care needs cited cost as a factor in his/her inability to get needed care. Individuals from poor groups were less likely to have a regular medical doctor and had lower rates of various preventative health care services. The working poor also had lower rates of insurance coverage for vision, dental, prescription medi-cation and hospital care compared to the non-poor group, and in most cases, social assistance recipients. In related studies, researchers have documented a growing gap in the amount of health care received between the rich and the poor, Canadian-born and immigrant populations, and residents with lower levels of education compared to more highly educated residents, and more out of pocket health care expenses related to the delisting of health services in Ontario (Browne, n.d.; Curtis & MacMinn, 2008).
These inequities were present and growing during pros-perous economic times. In light of the current economic crisis, they are likely to widen and affect increasing num-bers of people caught in the downturn. Therefore, we rec-ommend that:
The provincial government take action to ensure equita-ble access to health care services irrespective of income and poverty status, and reduce the ability to pay as a factor in accessing health care in Ontario. Expansion of and increased funding to community health centres (which focus on the health needs of marginalized com-munities), expansion of dental, vision, prescription drug and hospital care coverage, and expansion of the Ontario Trillium Drug Plan are key areas for action. Language interpreter services and health ambassadors (non-professionals within communities that can pro-vide information and referrals) are critical supports to promote preventative health care and deliver culturally-appropriate health services.
Improving Research Tools, Focusing on Equity-Seeking Groups
Recommendation 9To better understand the health and health care use of Canadians receiving income from different types of social assistance programs, we recommend that:
Statistics Canada revise future versions of the Canadian Community Health Survey to allow for the collection of income data that distinguishes between general social assistance (short-term assistance) programs and dis-ability support programs (long-term) in each province.
Recommendation 10The focus of this research has been primarily on the con-nections between ill health and different forms of poverty status. We have included analyses examining factors such as gender, ethnoracial status, Aboriginal identity, immi-gration status and disability status. However additional work is needed to examine the specific health outcomes of particular groups. As well, this study is limited to a province-wide analysis for Ontario and does not incor-porate other geographic levels including urban, rural and neighbourhood-level analysis. Therefore, we recommend that:
Additional research be conducted to better understand the effects of income inequality, poverty, social assis-tance and labour market conditions on the health and health care use of women, racialized groups, Aboriginal people, immigrants and people with disabilities. We also recommend that analyses be conducted to better understand how place of residence, such as neighbour-hood or region, may relate to poor health.
24 | Sick and Tired: The Compromised Health of Social Assistance Recipients and the Working Poor in Ontario
Baker Collins, S. (2005). An understanding of poverty from those who are poor. Action Research, 3(1): 9-31.
Black, J. & Shillington, R. (2005). Ontarians can no longer count on Employment Insurance to provide temporary income between jobs. Toronto, Ontario: MISWAA.
Browne, P.L. (n.d.). Public pain, private gain: The privatization of health care in Ontario. Ottawa, Ontario: Canadian Centre for Policy Alternatives.
Campaign 2000, Citizens for Public Justice & Workers’ Action Centre (2006). Working, yet poor in Ontario. Toronto, Ontario.
Canadian Institute for Health Information (2008a). The cost of acute care hospital stays by medical condition in Canada, 2004-2005. Ottawa, Ontario.
Canadian Institute for Health Information (2008b). Reducing gaps in health: A focus on socio-economic status in urban Canada. Ottawa, Ontario.
Canadian Labour Congress (1999). Left out in the cold: The end of UI for Canadian workers. Ottawa, Ontario.
Centre for Addiction and Mental Health (2003). Barriers to ODSP: Experiences of people with mental health and addic-tions. Toronto, Ontario.
Community Social Planning Council of Toronto & Family Service Association of Toronto (2004). Community voices: Young parents in Toronto speak out about work, community services and family life. Toronto, Ontario.
Community-University Research Alliance on Precarious Employment (2005). Ten ways of seeing precarious employment. Toronto, Ontario: Toronto Training Board.
Curtis, L.J. & MacMinn, W.J. (2008). Health care utilization in Canada: Twenty-five years of evidence. Canadian Public Policy, 34(1): 65-87.
Daily Bread Food Bank (2008). Who’s hungry: 2008 profile of hunger in the GTA. Toronto, Ontario.
Galabuzi, G.E. (2001). Canada’s creeping economic apartheid: The economic segregation and economic marginalisation of racialised groups. Toronto, Ontario: CSJ Foundation for Research and Education.
Government of Ontario (2008). Breaking the cycle: Ontario’s poverty reduction strategy. Toronto, Ontario.
Hamelin, A.M., Beaudry, M. & Habicht, J.P. (2002). Characterization of household food insecurity in Quebec: Food and feelings. Social Science & Medicine, 54(1): 119-132.
Herd, D. & Mitchell, A. (2002). Discouraged, diverted and disentitled: Ontario Works new service delivery model. Toronto, Ontario: Community Social Planning Council of Toronto.
Herd, D., Mitchell, A. & Lightman, E. (2005). Rituals of degredation: Administration as policy in the Ontario Works program. Journal of Social Policy and Administration, 39(1): 65-79.
Human Resources and Social Development Canada (1999). Coping with child hunger: Mothers do without. Ottawa, Ontario.
Income Security Advocacy Centre (2003). Denial by design … The Ontario Disability Support Program. Toronto, Ontario.
Laurie, N. (2008). The cost of poverty: An analysis of the economic cost of poverty in Ontario. Toronto, Ontario: Ontario Association of Food Banks.
Lightman, E., Herd, D. & Mitchell, A. (2008a). Percarious lives: Health, hunger and welfare in Toronto. Journal of Policy Practice, 7(4): 242-259.
Lightman, E., Mitchell, A. & Herd, D. (2008b). Globalization, precarious work and the food bank. Journal of Sociology and Social Welfare, XXXV(2): 9-28.
References and Related Literature

Sick and Tired: The Compromised Health of Social Assistance Recipients and the Working Poor in Ontario | 25
Lightman, Mitchell, A. & Herd, D. (2005a). One year on: Tracking the experiences of current and former welfare recipi-ents in Toronto. Journal of Poverty: Innovations on Social, Political and Economic Inequalities, 9(4): 5-26.
Lightman, E., Mitchell, A. & Herd, D. (2005b). Welfare to what? After Ontario Works in Toronto. International Social Security Review, 58(4): 95-106.
Lightman, E., Mitchell, A. & Herd, D. (2003a). Struggling to survive: Ontario Works recipients talk about life on welfare. Toronto, Ontario: Social Assistance in the New Economy Project.
Lightman, E., Mitchell, A. & Herd, D. (2003b). Suspicion and surveillance: Navigating welfare’s bureaucratic maze. Toronto, Ontario: Social Assistance in the New Economy Project.
Lightman, E., Mitchell, A. & Wilson, B. (2008). Poverty is making us sick: A comprehensive survey of income and health in Canada. Toronto, Ontario.
Lightman, E., Vick, A., Herd, D. & Mitchell, A. (in press). Not disabled enough: Episodic disabilities and the Ontario Disability Support Program. Disability Studies Quarterly.
Mackenzie, H. & Stanford, J. (2008). A living wage for Toronto. Ottawa, Ontario: Canadian Centre for Policy Alternatives.
METRAC & WACT (2008). No cherries grow on our trees. Toronto, Ontario.
National Council of Welfare (2006). Welfare incomes 2005. Ottawa, Ontario.
National Council of Welfare (2008). Welfare incomes, 2006 and 2007. Ottawa, Ontario.
Newbold, K.B. (2006). Chronic conditions and the healthy immigrant effect: Evidence from Canadian immigrants. Journal of Ethnic and Migration Studies, 32(5): 765-784.
Ng, E., Wilkins, R., Gendron, F. & Berthelot, J.M. (2005). The changing health of immigrants. Canadian Social Trends. Statistics Canada Catalogue No. 11-008.
ODSP Action Coaliton (2008). Accessibility survey – Canvassing the views of ODSP recipients. Toronto, Ontario.
Ombudsman Ontario (2006). Losing the waiting game. Ombudsman report. Toronto, Ontario.
Ontario Association of Food Banks (2008). Ontario hunger report 2008: The leading edge of the storm. Toronto, Ontario.
Ontario Federation of Labour (2007). Provincial election 2007: Manufacturing job loss. Toronto, Ontario.
Ontario Ministry of Labour (n.d.). Minimum wage. www.labour.gov.on.ca/english/es/guide/guide_4.html
Ontario Ministry of Labour (2003). Ontario’s minimum wage increase. www.labour.gov.on.ca/english/news/2003/03-65f.html
Ontario Ministry of Labour (2008). Fairness for temporary help agency employees. Backgrounder. www.labour.gov.on.ca/english/news/2008/08-119b.html
Ornstein, M. (2006). Ethno-racial groups in Toronto, 1971-2001: A demographic and socio-economic profile. Toronto, Ontario: York University, Institute for Social Research.
Phipps, S. (2003). The impact of poverty on health: A scan of research literature. Ottawa, Ontario: Canadian Population Health Initiative and Canadian Institute for Health Information.
Power, E. (2005). The unfreedom of being other: Canadian lone mothers’ experiences of poverty and ‘life on the cheque’. Sociology, 39(4): 643-660.
Reid, C. & Tom, A. (2006). Poor women’s discourses of legitimacy, poverty, and health. Gender & Society, 20(3): 402-421.
Schultz, S.E. & Kopec, J.A. (2003). Impact of chronic conditions. Health Reports, 14(4): 41-53.
Shields, M. and Shooshtari,S. (2001). Determinants of self-perceived health. Health Reports, 13(1): 35-52.
Sieppert, J., Linde, J.T. & Rutherford, G. (2004). Poverty as a determinant of health: Capturing the voices of low-income Calgarians. Canadian Review of Social Policy, 53: 122-139.
Smilek, S.M., Bidgood, B.A., Parent, M. & Thompson, J. (2000). When the fridge is bare: Challenges to food security in Waterloo Region. Waterloo, Ontario: The Food Bank of Waterloo Region.
26 | Sick and Tired: The Compromised Health of Social Assistance Recipients and the Working Poor in Ontario
Social Planning Council of Ottawa (2001). The experience of people with disabilities in Ottawa and the Ontario Disabil-ity Support Program. Ottawa, Ontario.
Statistics Canada (2009, January 9). Labour force information. Ottawa, Ontario.
Statistics Canada (2008). Income table. Catalogue no. 97-563-XCB2006026. Ottawa.
Steele, L.S., Lemieux-Charles, L., Clark, J.P. & Glazier, R.H. (2002). The impact of policy changes on the health of recent immigrants and refugees in the inner city: A qualitative study of service providers’ perspectives. Canadian Journal of Public Health, 93(2): 118-122.
Street Health (2006). Failing the homeless: Barriers in the Ontario Disability Support Program for homeless people with disabilities. Toronto, Ontario.
Street Health (2007). The street health report 2007. Toronto, Ontario.
Swanson, J. (2001). Poor-bashing: The politics of exclusion. Toronto, Ontario: Between the Lines.
Toronto Public Health (2008). The unequal city: Income and health inequalities in Toronto. Toronto, Ontario
Townson, M. & Hayes, K. (2007). Women and the Employment Insurance program. Toronto, Ontario: Canadian Council for Policy Alternatives.
Workers’ Action Centre (2007a). Poverty is on the rise in Ontario and low wages are a big reason why. Toronto, Ontario.
Workers’ Action Centre (2007b). Working on the edge. Toronto, Ontario.
World Health Organization (2008). Closing the gap in a generation: Health equity through action on the social determi-nants of health. Geneva, Switzerland.

Sick and Tired: The Compromised Health of Social Assistance Recipients and the Working Poor in Ontario | 27
Endnotes74.4% of the working poor respondents reported having a job at the time of their interview. Why don’t all 1.
of the working poor have current jobs if they are the ‘working poor’? The working poor group is comprised of respondents who reported that the main source of their household income over the 12-month period preceding the interview came from salaries, wages or self-employment, and reported household incomes below the Low Income Measure. Respondents may have gotten most of their income from work in the past 12 months but were not working at the time of their interview. It is also possible that other members of the household were working, contributing to the main source of household income, but the respondent did not have a current job.
Due to a flaw in the CCHS questionnaire, lifetime attempted suicide rates included in this report are likely 2. lower than in actual fact. Respondents who had considered suicide in their lifetime but not in the 12-month period preceding the interview were not asked about lifetime suicide attempts.
Social assistance recipients have limited dental coverage for emergency services only.3.
National Council of Welfare provides estimated annual welfare incomes for four family types. These 4. incomes include basic social assistance, additional benefits, federal child benefits, provincial/territorial child benefits, federal GST credit and provincial/territorial tax credits, where applicable.
While Canada has no official poverty line, Statistics Canada’s Low Income Cut-Off is commonly used to 5. assess low income in Canada. Note that the working poor and social assistance groups utilized in our study are constructed using Statistics Canada’s Low Income Measure (LIM) which is another widely used instrument. For further details, please see the extended method section available at www.socialplanningtoronto.org
We used the GEN MOD procedure in SAS to conduct these analyses. The sample was split into two groups: 6. Canadian-born and immigrant. In the analyses with the Canadian-born group, age and poverty status were included in the model predicting various chronic conditions. In the analyses with the immigrant group, age, poverty status and length of time residing in Canada were included in the model. Results are described in the text (p<.05 was used to assess statistical significance).
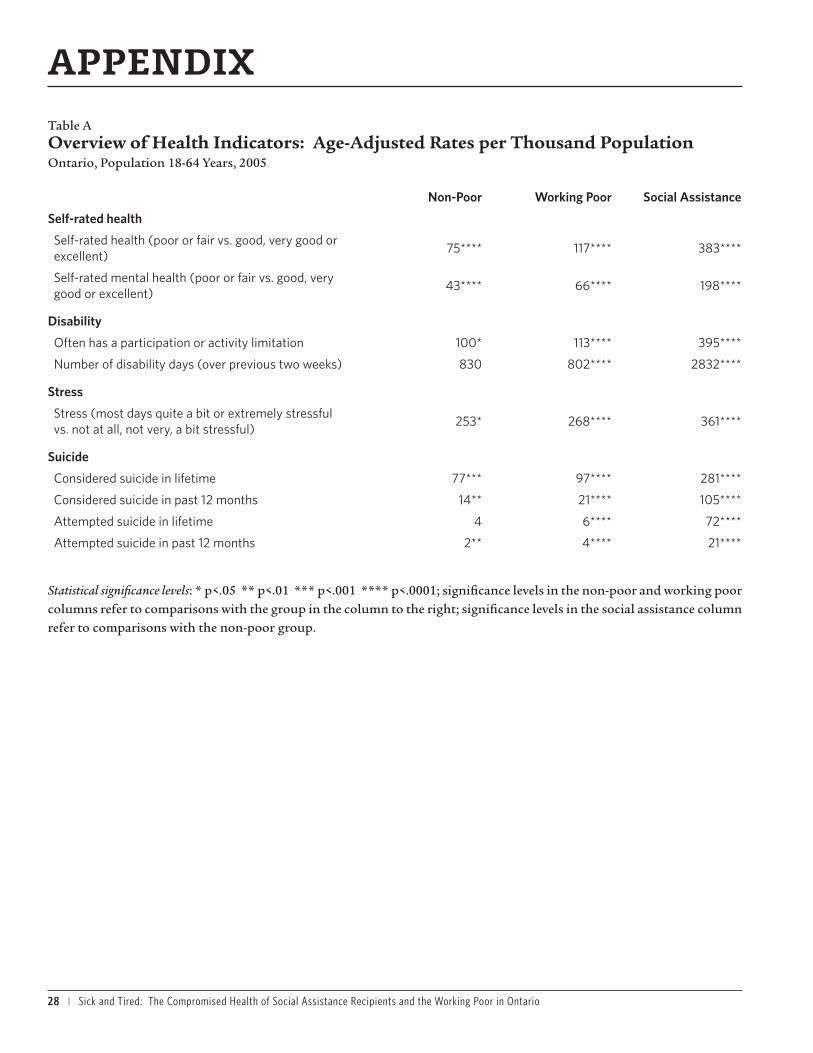
28 | Sick and Tired: The Compromised Health of Social Assistance Recipients and the Working Poor in Ontario
APPENDIXTable A Overview of Health Indicators: Age-Adjusted Rates per Thousand Population Ontario, Population 18-64 Years, 2005
Non-Poor Working Poor Social Assistance
Self-rated health
Self-rated health (poor or fair vs. good, very good or excellent)
75**** 117**** 383****
Self-rated mental health (poor or fair vs. good, very good or excellent)
43**** 66**** 198****
Disability
Often has a participation or activity limitation 100* 113**** 395****
Number of disability days (over previous two weeks) 830 802**** 2832****
Stress
Stress (most days quite a bit or extremely stressful vs. not at all, not very, a bit stressful)
253* 268**** 361****
Suicide
Considered suicide in lifetime 77*** 97**** 281****
Considered suicide in past 12 months 14** 21**** 105****
Attempted suicide in lifetime 4 6**** 72****
Attempted suicide in past 12 months 2** 4**** 21****
Statistical significance levels: * p<.05 ** p<.01 *** p<.001 **** p<.0001; significance levels in the non-poor and working poor columns refer to comparisons with the group in the column to the right; significance levels in the social assistance column refer to comparisons with the non-poor group.

Sick and Tired: The Compromised Health of Social Assistance Recipients and the Working Poor in Ontario | 29
Table B Chronic Conditions: Age-Adjusted Rates per Thousand Population Ontario, Population 18-64 Years, 2005
Non-Poor Working Poor Social AssistanceChronic conditionsHas a chronic condition 689**** 626**** 847****Has more than 2 chronic conditions 215** 239**** 540****Total number of chronic conditions 1,549 1,529**** 3,460****
Endocrine or metabolic condition 387**** 363**** 482****Thyroid condition 48 50** 72**Diabetes 31*** 52**** 113****Food allergies 75 81 104*Multiple chemical sensitivities 19*** 30** 54****Other allergies 303**** 252**** 350****
Circulatory system condition 131**** 102**** 249****Effects of a stroke n/a n/a n/aHeart disease 25** 34**** 75****High blood pressure 114**** 83**** 200****
Eye disease 20 17* 31*Cataracts n/a n/a n/aGlaucoma n/a n/a n/a
Disease of the nervous system or developmental disorder 142**** 175**** 371****Learning disability 23*** 34**** 123****Epilepsy 4 7**** 29****Migraines 120**** 145**** 287****
Disease of the respiratory tract 91 91**** 203****Chronic bronchitis 20**** 33**** 92****Asthma 78 68**** 159****
Musculoskeletal disease 278* 260**** 501****Back problems (excluding arthritis and fibromyalgia) 195 193**** 396****Arthritis or rheumatism 127 130**** 299****Fibromyalgia 13 13**** 60****Chronic fatigue syndrome 11 7**** 64****
Mental and behavioural disorder 87 90**** 327****Anxiety disorder 43 46**** 181****Mood disorder 61 62**** 253****Alzheimer’s disease or dementia n/a n/a n/aSchizophrenia n/a n/a n/a
Miscellaneous condition 87* 70**** 202****Cancer 9 11 15Stomach or intestinal ulcer 30 26**** 99****Urinary incontinence 17** 9**** 63****Bowel disorder 42** 27**** 65**
Other chronic condition 125* 111**** 216****
Statistical significance levels: * p<.05** p<.01*** p<.001**** p<.0001; significance levels in the non-poor and working poor columns refer to comparisons with the group in the column to the right; significance levels in the social assistance column refer to comparisons with the non-poor group.

30 | Sick and Tired: The Compromised Health of Social Assistance Recipients and the Working Poor in Ontario
Table C
Access to, and Utilization of Health Care Services: Age-Adjusted Rates per Thousand Population Ontario, Population 18-64 Years, 2005
Non-Poor Working Poor Social Assistance
Consultations with medical professionals
Has no regular medical doctor 95**** 127 148****
Total number of consultations with all medical practitioners 9,988*** 8,798**** 19,360****
Total number of consultations with general practitioners 2,960** 3,344**** 7,374****
Total number of consultations with specialists 1,489* 1,236**** 2,525****
Total number of consultations with medical practitioners other than general practitioners and specialists
5,549**** 4,218**** 9,935****
Number of nights in a hospital, nursing home or convalescent home
381 374**** 1,433****
Has self-perceived unmet health care needs 125*** 150**** 263****
Statistical significance levels: * p<.05 ** p<.01 *** p<.001 **** p<.0001; significance levels in the non-poor and working poor columns refer to comparisons with the group in the column to the right; significance levels in the social assistance column refer to comparisons with the non-poor group.
Table D
Health-Related Measures: Percentages (not adjusted for age) Ontario, Population 18-64 Years, 2005
Non-Poor Working Poor Social Assistance
Reasons care was not received
Care not available at time required 14.1 11.8 9.8
Felt care would be inadequate 3.3 3.5 6.1
Cost 8.8**** 20.3 21.6****
Didn’t get around to it 7.6* 4.6 5.3
Personal or family responsibilities 1.1 1.9 1.7
Transportation problems 1.1**** 4.0 6.6****
Access to health insurance
Prescription medications 80.6**** 43.2**** 82.7
Dental care 78.1**** 38.7**** 65.8****
Eyeglasses or contact lenses 71.1**** 28.9**** 70.3
Hospital charges 72.6**** 27.5 24.3****
Household food insecurity 3.2**** 16.5**** 49.3****
Statistical significance levels: * p<.05 ** p<.01 *** p<.001 **** p<.0001; significance levels in the non-poor and working poor columns refer to comparisons with the group in the column to the right; significance levels in the social assistance column refer to comparisons with the non-poor group.

Sick and Tired: The Compromised Health of Social Assistance Recipients and the Working Poor in Ontario | 31
Table E
Preventative Health Care Service Use: Age-Adjusted Rates per Thousand Population Ontario, Population 18-64 Years, 2005
Non-Poor Working Poor Social Assistance
Eye Care
Never had eye exam before 36**** 74 54*
Had eye exam less than 2 years ago 648**** 574 599*
Dental Care
Never visited dentist before 7**** 51**** 10
Visited dentist in past 12 months 750**** 495 474****
Women’s Health
Never had breast exam 209**** 351 399****
Had breast exam less than 2 years ago 872 856 828
Never had mammogram (40-64 years) 281**** 370 415****
Had mammogram less than 2 years ago (40-64 years) 765 710 686
Never had pap smear test before 96**** 223* 163****
Had pap smear test less than 1 year ago 553**** 461 462***
Colon Care (40-64 years only)
Never had colorectal cancer screening 747**** 814** 731
Had colorectal cancer screening less than 3 years ago 585 531 582
Statistical significance levels: * p<.05 ** p<.01 *** p<.001 **** p<.0001; significance levels in the non-poor and working poor columns refer to comparisons with the group in the column to the right; significance levels in the social assistance column refer to comparisons with the non-poor group.
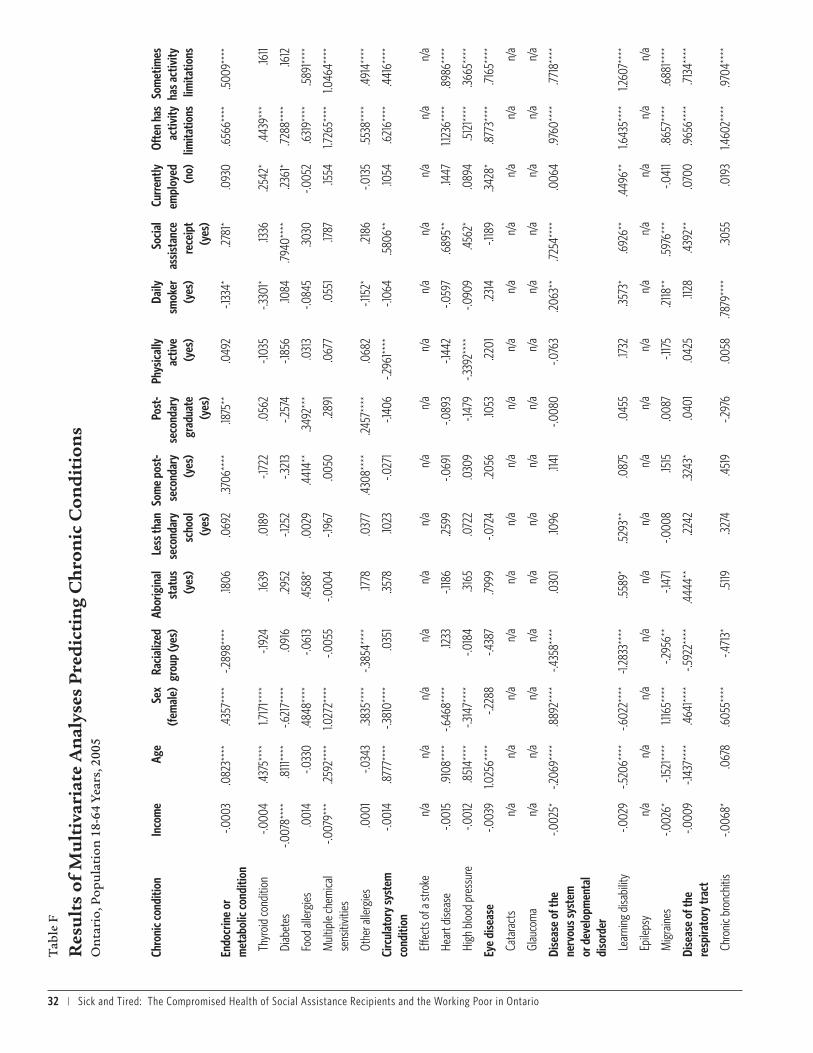
32 | Sick and Tired: The Compromised Health of Social Assistance Recipients and the Working Poor in Ontario
Tab
le F
Res
ult
s of
Mu
ltiv
aria
te A
nal
yses
Pre
dic
tin
g C
hro
nic
Con
dit
ion
s O
nta
rio,
Pop
ula
tion
18-
64 Y
ears
, 200
5
Chro
nic c
ondi
tion
Inco
me
Age
Sex
(fem
ale)
Raci
alize
d gr
oup
(yes
)Ab
orig
inal
st
atus
(y
es)
Less
than
se
cond
ary
scho
ol
(yes
)
Som
e po
st-
seco
ndar
y (y
es)
Post
-se
cond
ary
grad
uate
(y
es)
Phys
ical
ly
activ
e (y
es)
Daily
sm
oker
(y
es)
Soci
al
assis
tanc
e re
ceip
t (y
es)
Curr
ently
em
ploy
ed
(no)
Ofte
n ha
s ac
tivity
lim
itatio
ns
Som
etim
es
has a
ctiv
ity
limita
tions
Endo
crin
e or
m
etab
olic
cond
ition
-.000
3.0
823*
***
.435
7***
*-.2
898*
***
.1806
.069
2.37
06**
**.18
75**
.049
2-.1
334*
.2781
*.0
930
.656
6***
*.5
009*
***
Thyr
oid
cond
ition
-.000
4.4
375*
***
1.717
1****
-.192
4.16
39.0
189
-.172
2.0
562
-.103
5-.3
301*
.1336
.2542
*.4
439*
**.16
11
Diab
etes
-.007
8***
*.8
111**
**-.6
217*
***
.091
6.29
52-.1
252
-.321
3-.2
574
-.185
6.10
84.79
40**
**.23
61*
.7288
****
.1612
Food
alle
rgie
s.0
014
-.033
0.4
848*
***
-.061
3.4
588*
.002
9.4
414*
*.34
92**
*.0
313
-.084
5.30
30-.0
052
.631
9***
*.5
891**
**
Mul
tiple
chem
ical
sens
itivit
ies
-.007
9***
.2592
****
1.027
2***
*-.0
055
-.000
4-.1
967
.005
0.28
91.0
677
.055
1.17
87.15
541.7
265*
***
1.046
4***
*
Othe
r alle
rgie
s.0
001
-.034
3.38
35**
**-.3
854*
***
.1778
.037
7.4
308*
***
.2457
****
.068
2-.1
152*
.2186
-.013
5.55
38**
**.4
914*
***
Circ
ulat
ory
syst
em
cond
ition
-.001
4.8
777*
***
-.381
0***
*.0
351
.3578
.1023
-.027
1-.1
406
-.296
1****
-.106
4.5
806*
*.10
54.6
216*
***
.441
6***
*
Effe
cts o
f a st
roke
n/a
n/a
n/a
n/a
n/a
n/a
n/a
n/a
n/a
n/a
n/a
n/a
n/a
n/a
Hear
t dise
ase
-.001
5.9
108*
***
-.646
8***
*.12
33-.1
186
.2599
-.069
1-.0
893
-.144
2-.0
597
.689
5**
.1447
1.123
6***
*.8
986*
***
High
blo
od p
ress
ure
-.001
2.8
514*
***
-.314
7***
*-.0
184
.3165
.072
2.0
309
-.147
9-.3
392*
***
-.090
9.4
562*
.089
4.5
121**
**.36
65**
**
Eye
dise
ase
-.003
91.0
256*
***
-.228
8-.4
387
.7999
-.072
4.20
56.10
53.22
01.23
14-.1
189
.3428
*.8
773*
***
.7165
****
Cata
ract
sn/
an/
an/
an/
an/
an/
an/
an/
an/
an/
an/
an/
an/
an/
a
Glau
com
an/
an/
an/
an/
an/
an/
an/
an/
an/
an/
an/
an/
an/
an/
a
Dise
ase
of th
e ne
rvou
s sys
tem
or
dev
elop
men
tal
diso
rder
-.002
5*-.2
069*
***
.889
2***
*-.4
358*
***
.030
1.10
96.11
41-.0
080
-.076
3.20
63**
.7254
****
.006
4.97
60**
**.77
18**
**
Lear
ning
disa
bilit
y-.0
029
-.520
6***
*-.6
022*
***
-1.28
33**
**.55
89*
.529
3**
.087
5.0
455
.1732
.3573
*.6
926*
*.4
496*
*1.6
435*
***
1.260
7***
*
Epile
psy
n/a
n/a
n/a
n/a
n/a
n/a
n/a
n/a
n/a
n/a
n/a
n/a
n/a
n/a
Mig
rain
es-.0
026*
-.152
1****
1.116
5***
*-.2
956*
*-.1
471
-.000
8.15
15.0
087
-.117
5.21
18**
.597
6***
-.041
1.8
657*
***
.688
1****
Dise
ase
of th
e re
spira
tory
trac
t-.0
009
-.143
7***
*.4
641**
**-.5
922*
***
.444
4**
.2242
.3243
*.0
401
.042
5.11
28.4
392*
*.0
700
.965
6***
*.71
34**
**
Chro
nic b
ronc
hitis
-.006
8*.0
678
.605
5***
*-.4
713*
.5119
.3274
.451
9-.2
976
.005
8.78
79**
**.30
55.0
193
1.460
2***
*.97
04**
**

Sick and Tired: The Compromised Health of Social Assistance Recipients and the Working Poor in Ontario | 33
Chro
nic c
ondi
tion
Inco
me
Age
Sex
(fem
ale)
Raci
alize
d gr
oup
(yes
)Ab
orig
inal
st
atus
(y
es)
Less
than
se
cond
ary
scho
ol
(yes
)
Som
e po
st-
seco
ndar
y (y
es)
Post
-se
cond
ary
grad
uate
(y
es)
Phys
ical
ly
activ
e (y
es)
Daily
sm
oker
(y
es)
Soci
al
assis
tanc
e re
ceip
t (y
es)
Curr
ently
em
ploy
ed
(no)
Ofte
n ha
s ac
tivity
lim
itatio
ns
Som
etim
es
has a
ctiv
ity
limita
tions
Asth
ma
-.000
3-.1
735*
***
.456
6***
*-.6
125*
***
.3787
*.26
61.26
96.13
07.0
569
-.102
2.4
208*
.1020
.884
3***
*.6
899*
***
Mus
culo
skel
etal
di
seas
e-.0
025*
**.4
209*
***
.1682
***
-.312
1****
.2700
*.18
97*
-.056
6-.1
138
-.061
9.24
03**
**.23
77.12
961.7
727*
***
1.525
5***
*
Back
pro
blem
s (e
xclu
ding
arth
ritis
and
fibro
mya
lgia)
-.002
0*.16
53**
**-.0
378
-.230
2**
.1393
.2106
*-.1
203
-.040
6-.0
522
.2116
***
.3387
*.0
450
1.544
9***
*1.3
664*
***
Arth
ritis
or
rheu
mat
ism-.0
041**
*.8
009*
***
.506
7***
*-.3
931**
*.22
56.19
29-.0
703
-.135
6.0
079
.2310
**.32
29.19
78*
1.689
5***
*1.2
473*
***
Fibro
mya
lgia
-.006
9**
.3676
****
1.497
9***
*.23
74.0
478
.1576
-.1114
.2757
-.250
1.35
12.13
84.55
82**
*2.3
027*
***
1.574
1****
Chro
nic f
atig
ue
synd
rom
e-.0
066
.1223
.666
5***
-.250
6.19
20.0
972
.409
0.20
17-.2
025
.1728
.3645
.7052
****
2.364
7***
*1.2
473*
***
Men
tal o
r be
havi
oura
l diso
rder
-.003
7**
-.058
3*.5
894*
***
-.836
2***
*-.0
962
.1057
.2136
.1051
-.109
7.6
305*
***
.591
7***
*.5
451**
**1.4
756*
***
1.012
9***
*
Anxie
ty d
isord
er-.0
026
-.126
4***
*.4
150*
***
-.933
3***
*-.0
685
.1580
.2382
.031
8-.0
518
.7148
****
.441
8*.6
464*
***
1.289
7***
*.9
979*
***
Moo
d di
sord
er-.0
038*
-.056
2.6
792*
***
-.624
1****
-.185
1.0
455
.1150
.1161
-.192
2*.53
76**
**.5
400*
*.6
082*
***
1.677
1****
1.137
6***
*
Alzh
eim
er’s
dise
ase
or d
emen
tian/
an/
an/
an/
an/
an/
an/
an/
an/
an/
an/
an/
an/
an/
a
Schi
zoph
reni
an/
an/
an/
an/
an/
an/
an/
an/
an/
an/
an/
an/
an/
an/
a
Misc
ella
neou
s co
nditi
on-.0
015
.2094
****
.579
8***
*-.5
398*
***
.454
0*-.0
699
-.056
6.0
653
-.081
0.17
01*
.2966
.2009
*1.2
765*
***
.845
4***
*
Canc
ern/
an/
an/
an/
an/
an/
an/
an/
an/
an/
an/
an/
an/
an/
a
Stom
ach
or in
test
inal
ulce
r-.0
045*
.077
8-.0
427
-.127
9.5
172
.591
2***
.1571
.3671
**-.0
017
.455
1****
.3202
.2532
1.121
2***
*.5
907*
***
Urin
ary i
ncon
tinen
ce-.0
010
.627
3***
*1.1
906*
***
-.254
8.22
93-.1
769
.089
1.0
832
-.039
3.19
88.5
777*
.004
91.4
326*
***
.806
6***
*
Bow
el d
isord
er.0
007
.080
2*.8
513*
***
-1.00
37**
**.13
86-.4
383*
-.054
4-.0
370
-.208
6*-.0
346
.087
7.18
501.2
633*
***
.955
1****
Othe
r chr
onic
co
nditi
on.0
009
.2039
****
.036
6-.4
266*
***
.023
1-.0
727
.2215
.2793
**.0
072
-.039
5.18
78.26
54**
*1.5
472*
***
1.021
4***
*
Stat
istic
al si
gnifi
canc
e le
vels:
* p
<.05
**
p<.0
1 *
** p
<.00
1 *
***
p<.0
001