comorbidity of mental disorders and physical conditions
TRANSCRIPT

Comorbidity of mental disorders and physical conditions
2007
Comorbidity of m
ental disorders and physical conditions 2007A
IHW
This report investigates the prevalence of mental illness in association with common chronic diseases and shows that in 2007: 12% of Australians aged 16-85 had a mental disorder and a physical condition at the same time; the most common comorbidity was anxiety disorder combined with a physical condition, affecting around 1.4 million (9%) Australian adults; people living in the most disadvantaged areas of Australia were 65% more likely to have comorbidity than those living in the least disadvantaged areas.
Australian Institute of Health and Welfare Canberra
Cat. no. PHE 155
Comorbidity of mental disorders and physical conditions, 2007

The Australian Institute of Health and Welfare is a major national agency which provides reliable, regular and relevant information and statistics
on Australia’s health and welfare. The Institute’s mission is authoritative information and statistics to promote better health and wellbeing.
© Australian Institute of Health and Welfare 2012
This product, excluding the AIHW logo, Commonwealth Coat of Arms and any material owned by a third party or protected by a trademark, has been released under a Creative Commons BY 3.0 (CC-BY 3.0) licence. Excluded material owned by third parties may include, for example, design and layout, images obtained under licence from third parties and signatures. We have made all reasonable efforts to identify and label material owned by third parties.
You may distribute, remix and build upon this work. However, you must attribute the AIHW as the copyright holder of the work in compliance with our attribution policy available at <www.aihw.gov.au/copyright/>. The full terms and conditions of this licence are available at <http://creativecommons.org/licenses/by/3.0/au/>.
Enquiries relating to copyright should be addressed to the Head of the Communications, Media and Marketing Unit, Australian Institute of Health and Welfare, GPO Box 570, Canberra ACT 2601.
A complete list of the Institute’s publications is available from the Institute’s website <www.aihw.gov.au>. ISBN 978-1-74249-264-3
Suggested citation Australian Institute of Health and Welfare 2012. Comorbidity of mental disorders and physical conditions 2007. Cat. no. PHE 155. Canberra: AIHW.
Australian Institute of Health and Welfare Board Chair Dr Andrew Refshauge
Director David Kalisch
Any enquiries about or comments on this publication should be directed to: Communications, Media and Marketing Unit Australian Institute of Health and Welfare GPO Box 570 Canberra ACT 2601 Tel: (02) 6244 1032 Email: [email protected]
Published by the Australian Institute of Health and Welfare
Please note that there is the potential for minor revisions of data in this report. Please check the online version at <www.aihw.gov.au> for any amendments.

iii
Contents Acknowledgments.............................................................................................................................. iv
Abbreviations ....................................................................................................................................... v
Summary .............................................................................................................................................. vi
1 Introduction .................................................................................................................................... 1
2 Overview of comorbidity ............................................................................................................. 4
3 Comorbidity and selected sociodemographic characteristics ............................................... 7
4 Comorbidity and selected risk factors .................................................................................... 12
5 Comorbidity and health service use ........................................................................................ 16
6 Comorbidity and quality of life ............................................................................................... 18
Appendix A Additional and supporting data .......................................................................... 21
Appendix B Data sources and methods .................................................................................... 31
Glossary ................................................................................................................................................ 33
References ............................................................................................................................................ 36

iv
Acknowledgments This report was written by Robert van der Hoek and Mark Cooper-Stanbury, with assistance from Ilona Brockway, Karen Bishop and Suraiya Nargis, all from the AIHW Population Health Unit.
The project was funded by the Australian Government Department of Health and Ageing.

v
Abbreviations ABS Australian Bureau of Statistics
AIHW Australian Institute of Health and Welfare
BMI body mass index
CI confidence interval
K10 Kessler Psychological Distress Scale—10
MESC main English speaking countries
SEIFA socioeconomic indexes for areas
SES socioeconomic status

vi
Summary Background Comorbidity is the occurrence of more than one condition/disorder at the same time, and is common among those with mental illness. It can involve more than one mental disorder, or one mental disorder and one or more physical conditions. People with multiple disorders are more disabled and consume more health resources than those with only one disorder.
This report provides a snapshot of the prevalence of mental illness in association with common chronic conditions in Australia in 2007. It compares the comorbidity group—comprising 12% of the population aged 16–85—with three other groupings:
• people with a mental disorder but no physical condition • people with a physical condition but no mental disorder • people with no mental disorder or physical condition. The results are all derived from the National Survey of Mental Health and Wellbeing 2007, conducted by the Australian Bureau of Statistics.
Main findings Around one in nine Australians aged 16–85 had a mental disorder and a physical condition at the same time. These people were more likely to be female, and aged in their early forties.
The most common comorbidity was anxiety disorder combined with a physical condition, affecting around 1.4 million Australian adults. This was consistent for most age and sex groups, with the exception of younger males (aged 16–24) for whom substance use disorder combined with a physical condition was most common comorbidity.
In general, the results show that comorbidity increased with decreasing socioeconomic status (SES). For example, people living in the most disadvantaged areas of Australia were 65% more likely to have comorbidity than those living in the least disadvantaged areas.
Some health risk factors were more prevalent among people who had a mental disorder. For example, groups with a mental disorder had higher proportions of smokers compared with the groups without a mental disorder, and the comorbidity group had the highest proportion of smokers of all the groups.
People with a comorbidity of any mental disorder and physical condition had higher rates of hospitalisation than the three comparison groups. Similarly, the proportion of people consulting a health professional for a mental health disorder was much higher in the comorbidity group and mental disorder only group than the other comparison groups.
The coexistence of mental and physical conditions has an effect on quality of life. For example, on the Kessler Psychological Distress Scale 10, people in the comorbidity group were more than 10 times as likely to report high levels of psychological distress compared with the groups with no mental disorder.
People with comorbidity were around twice as likely as people without comorbidity to have more than 7 out of the past 30 days out of role (derived as the number of days totally unable to function plus half the number of days of reduced functioning).

Comorbidity of mental disorders and physical conditions 1
1 Introduction
Why comorbidity matters Comorbidity (the occurrence of more than one condition/disorder at the same time) is common among those with mental illness. It can involve more than one mental disorder, or one mental disorder and one or more physical conditions. People with multiple disorders are more disabled, more distressed and have more consultations for mental health problems than those with only one disorder (Andrews et al. 2002).
Further, a recent report by the Australian Institute of Health and Welfare (AIHW 2011) showed that even after comorbidity of mental and physical conditions was taken into account, people with severe or profound disability were more likely than those without disability to use health services for mental disorders.
The relationship between mental and physical illness is not clearly understood, but having a physical illness is one of the strongest risk factors for depression (Wilhelm et al. 2003). Conversely, depression is also a risk factor for physical illness (Wulsin et al. 1999).
Similarly, the authors of an AIHW report looking at the relationship between mental disorders and musculoskeletal conditions (AIHW 2010a) concluded that there was evidence of an underlying relationship between the two conditions, with the observed comorbidity being higher than expected. While the causal directions were not fully understood, their high comorbidity indicates the need for health-care providers to be aware of the complex treatment and management requirements of people with long-term musculoskeletal conditions.
Understanding these complexities, and the best ways to treat each, requires consideration of both the mental and the physical illness (Clarke & Currie 2009).
What this report offers This report provides a snapshot of the prevalence of mental illness in association with common chronic physical conditions (comorbidity of any mental disorder and physical condition). The comorbidity group (12% of the population aged 16–85) is compared with three other groups:
• people with one or more mental disorders but no physical condition (any mental disorder only) (8%)
• people with one or more physical conditions but no mental disorder (any physical condition only) (38%)
• people with no mental disorder or a physical condition (no mental disorder or physical condition) (42%) (Figure 1.1).
A more detailed schematic of these groups are derived is at Appendix 1.
The analysis is based on the National Survey of Mental Health and Wellbeing 2007, conducted by the Australian Bureau of Statistics (ABS) from August–December 2007. The survey collected information from approximately 8,800 Australians aged 16–85.

2 Comorbidity of mental disorders and physical conditions
This report follows the methodology used in the ABS survey, where a person must have had a diagnosed mental disorder in the last 12 months (that is, not just in their lifetime) to be included in the mental disorder and comorbidity group.
Because of the size of the total comorbidity group (around 12% of the sample), there is limited scope to conduct detailed analysis of specific mental disorder–physical condition comorbidities.
Source: AIHW analysis of National Survey of Mental Health and Wellbeing 2007.
Figure 1.1: Relative size of the comorbidity group and the three comparison groups, persons aged 16–85, 2007
A note on terminology In this report, the term ‘mental disorder’ generally refers to a specific mental health condition, and is consistent with the term used by the ABS in reporting findings from the survey.
The term ‘mental illness’ generally refers to the overall concept of mental ill health, and/or the broad grouping of mental disorders.
The term ’12-month mental disorder’, mostly used in tables, refers to having had a diagnosed mental disorder in the last 12 months.
Structure of the report Following this introduction, major sections cover:
• an overview of the comorbidity of mental disorders and physical conditions (Section 2) • selected sociodemographic factors by comorbidity group (Section 3) • selected risk factors by comorbidity group (Section 4) • health service use by comorbidity group (Section 5) • selected measures of quality of life by comorbidity group (Section 6).
11.7%
8.3%
38.4%
41.6%
Comorbodity of any mentaldisorder and physical condition
Any mental disorder only
Any physical condition only
No mental disorder or physicalcondition

Comorbidity of mental disorders and physical conditions 3
As most of the analysis in the following sections is presented graphically, supporting tables are included in Appendix 1. A description of the data source and methods used in the analysis is at Appendix 2. A glossary of terms is also provided.

4 Comorbidity of mental disorders and physical conditions
2 Overview of comorbidity
Introduction The 16–85 age group accounts for about 78% of the Australian population, and most of the detectable mental health problems will be in this age group, especially when the information is collected by means of a survey (ABS 2008).
About 12% of this adult population had both a mental disorder and a chronic condition, with females 1.6 times as likely as males to have had comorbidity (Table 2.1). Males and females had similar age profiles within each subgroup; both had a higher median age (of around 5 years) when the mental disorder was accompanied by a physical disorder, compared with a mental disorder only.
Table 2.1: Summary of mental health and physical condition comorbidity
Males Females Persons
Group % Median
age % Median
age
% Median
age
No lifetime mental disorder 51.9 44 57.1 47 54.5 45
Any lifetime mental disorder 48.1 42 42.9 41 45.5 41
Any 12-month mental disorder 17.6 38 22.3 37 20.0 37
Comorbidity of 12-month mental disorder and physical condition 8.9 42
14.5 42
11.7 42
All persons aged 16–85 100 43 100 43 100 43
Source: AIHW analysis of National Survey of Mental Health and Wellbeing 2007.
Of the main groups of mental disorders (as classified by the ABS), the highest rate of comorbidity with a physical condition is seen for anxiety disorders, affecting an estimated 1.4 million Australians. This combination was more than twice as common among women as men (Table 2.2).
Of the more serious chronic conditions, the group most commonly appearing with any mental disorder was arthritis, rheumatism and gout, affecting around 455,000 Australians. This combination was almost twice as common among women as men (Table 2.2).

Comorbidity of mental disorders and physical conditions 5
Table 2.2: Prevalence of selected specific mental disorder–physical condition comorbidities, 2007
Comorbidity Males Females Persons Males Females Persons
(’000) Per cent
Affective disorder, any physical condition 249 395 644 3.1 4.9 4.0
Anxiety disorder, any physical condition 456 966 1,422 5.7 12.0 8.9
Substance use disorder, any physical condition 255 149 404 3.2 1.8 2.5
Arthritis, rheumatism or gout, any mental disorders 155 301 455 1.9 3.7 2.8
Asthma, any mental disorders 139 257 396 1.7 3.2 2.5
Cancer, any mental disorders 40 51 91 0.5 0.6 0.6
Diabetes, any mental disorders 58 82 140 0.7 1.0 0.9
Heart problem, any mental disorders 167 224 391 2.1 2.8 2.4
Stroke, any mental disorders 12 15 27 0.1 0.2 0.2
Note: A person may have more than one comorbidity.
Source: AIHW analysis of National Survey of Mental Health and Wellbeing 2007.
Comorbidity of mental disorders and any physical condition The main features observed across the age groups are (Figure 2.1):
• the prevalence of anxiety disorder comorbidity increased up to middle ages for both males and females, with around 1 in 6 females aged 45–54 affected
• compared with older males, substance abuse disorder comorbidity was relatively more prevalent for males aged under 45, affecting around 1 in 20 males
• in each age group, females had a higher prevalence than males of affective disorder comorbidity.
Males Females
Source: AIHW analysis of National Survey of Mental Health and Wellbeing 2007.
Figure 2.1: Prevalence of selected mental disorders and any physical conditions, by age group and sex, 2007
0
5
10
15
20
16–24 25–34 35–44 45–54 55–64 65–85
Per cent Anxiety disorder, anyphysical conditionsAffective disorder, anyphysical conditionsSubstance use disorder,any physical conditions
0
5
10
15
20
16–24 25–34 35–44 45–54 55–64 65–85
Per cent
6 Comorbidity of mental disorders and physical conditions
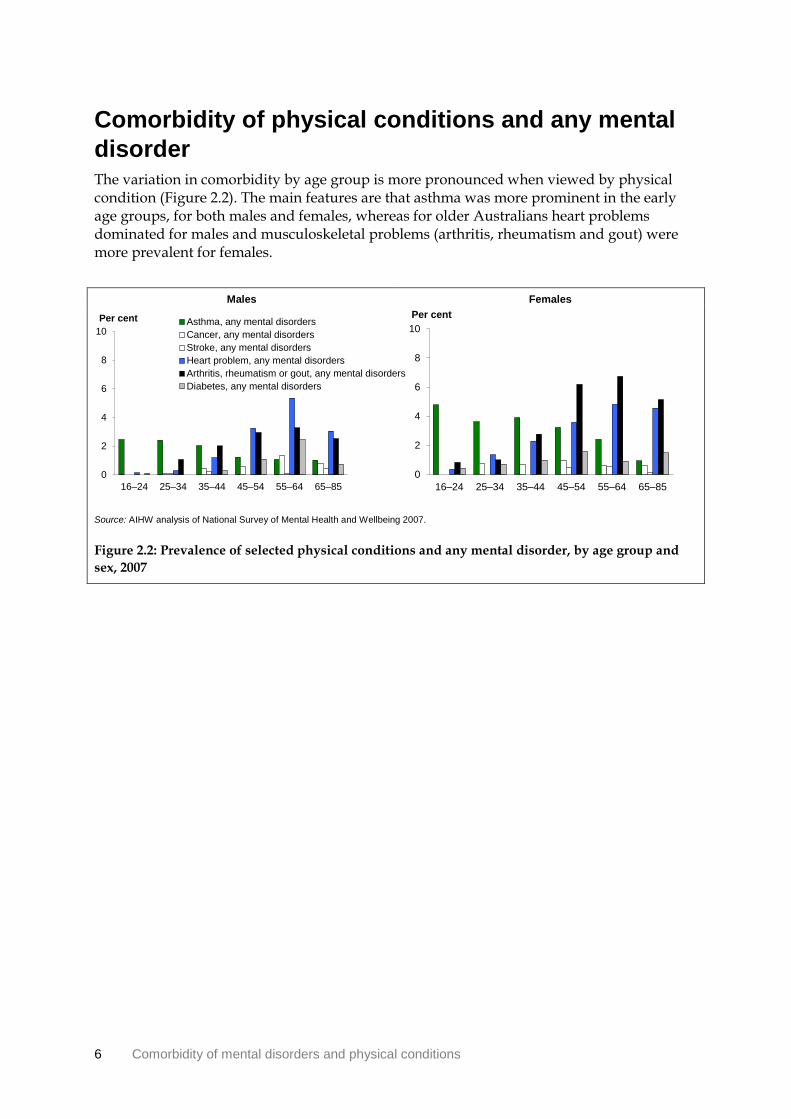
Comorbidity of physical conditions and any mental disorder The variation in comorbidity by age group is more pronounced when viewed by physical condition (Figure 2.2). The main features are that asthma was more prominent in the early age groups, for both males and females, whereas for older Australians heart problems dominated for males and musculoskeletal problems (arthritis, rheumatism and gout) were more prevalent for females.
Males Females
Source: AIHW analysis of National Survey of Mental Health and Wellbeing 2007.
Figure 2.2: Prevalence of selected physical conditions and any mental disorder, by age group and sex, 2007
0
2
4
6
8
10
16–24 25–34 35–44 45–54 55–64 65–85
Per cent Asthma, any mental disordersCancer, any mental disordersStroke, any mental disordersHeart problem, any mental disordersArthritis, rheumatism or gout, any mental disordersDiabetes, any mental disorders
0
2
4
6
8
10
16–24 25–34 35–44 45–54 55–64 65–85
Per cent

Comorbidity of mental disorders and physical conditions 7
3 Comorbidity and selected sociodemographic characteristics
The results presented in this section describe patterns of comorbidity disaggregated by four selected sociodemographic characteristics: socioeconomic status, geography, country of birth, and labour force status. Each of these are considered in turn in the following subsections. The analyses are expressed as prevalence ratios, which compare the prevalence in one group with the prevalence in a ‘reference’ group (which is given a value of 1.0)—the reference group is arbitrary, and stated for each characteristic. A ratio greater than 1.0 reflects a higher prevalence in that group compared with the reference group, whereas a ratio less than 1.0 reflects a lower prevalence.
Socioeconomic status People who have a lower socioeconomic status (SES) often have higher rates of illness and disability and shorter lives compared with those who have a higher SES (AIHW 2010b). The analysis shows this to also be true for the comorbidity group, where a definite gradient exists: people living in the areas of Australia with the lowest SES were 65% more likely to have comorbidity than those living in areas with the highest SES (Figure 3.1, tables A2–A6).
There are no clear gradients evident in the comparison groups. Although there is some variation in prevalence of mental disorder only across the socioeconomic range, it is the middle quintiles that had the higher rates.

8 Comorbidity of mental disorders and physical conditions
Comorbidity of any mental disorder and physical condition
Any mental disorder only
Any physical condition only No mental disorder or physical condition
Notes 1. SES based on SEIFA Index of Relative Socio-Economic Disadvantage at Census collection district level. 2. Q1 = most disadvantaged quintile; Q5 = least disadvantaged quintile. 3. Directly age-standardised to the 2001 Australian population, ratio standardised to the 5th quintile (least disadvantaged).
Source: AIHW analysis of National Survey of Mental Health and Wellbeing 2007.
Figure 3.1: Prevalence ratios by socioeconomic quintile, comorbidity group and the three comparison groups, 2007
0.0
0.5
1.0
1.5
2.0
Q1 Q2 Q3 Q4 Q5
Ratio
0.0
0.5
1.0
1.5
2.0
Q1 Q2 Q3 Q4 Q5
Ratio
0.0
0.5
1.0
1.5
2.0
Q1 Q2 Q3 Q4 Q5
Ratio
0.0
0.5
1.0
1.5
2.0
Q1 Q2 Q3 Q4 Q5
Ratio
Comorbidity of mental disorders and physical conditions 9
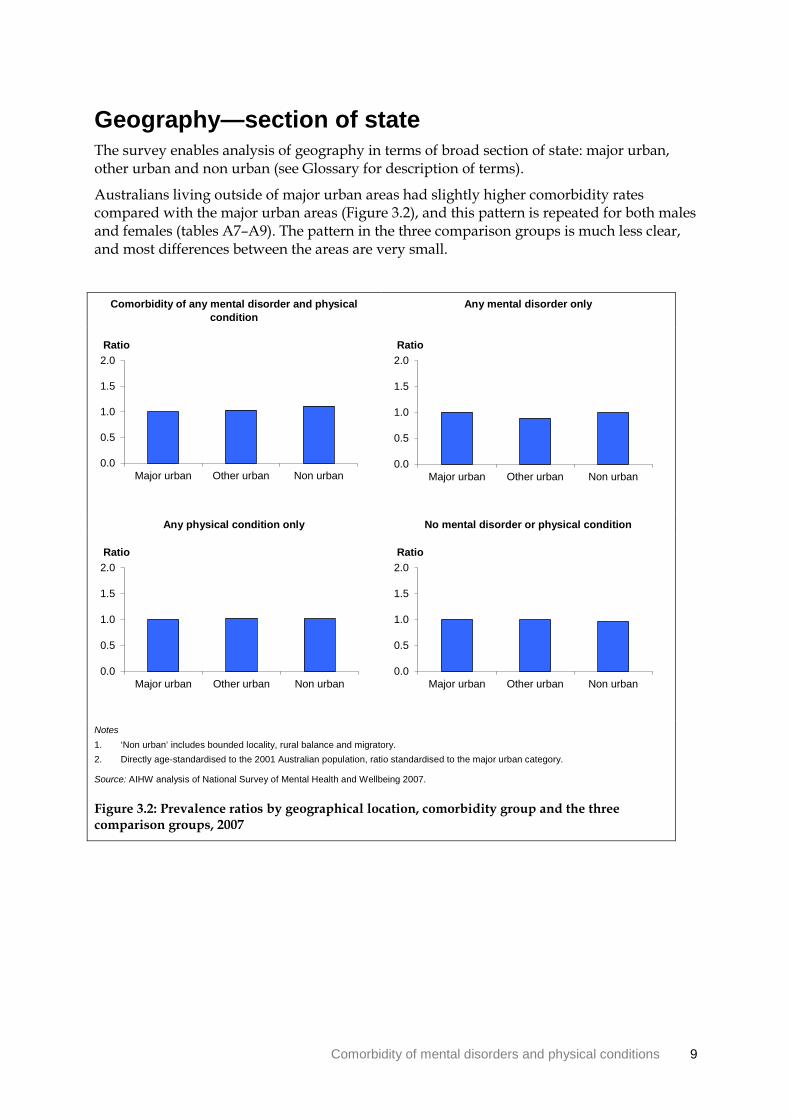
Geography—section of state The survey enables analysis of geography in terms of broad section of state: major urban, other urban and non urban (see Glossary for description of terms).
Australians living outside of major urban areas had slightly higher comorbidity rates compared with the major urban areas (Figure 3.2), and this pattern is repeated for both males and females (tables A7–A9). The pattern in the three comparison groups is much less clear, and most differences between the areas are very small.
Comorbidity of any mental disorder and physical condition
Any mental disorder only
Any physical condition only No mental disorder or physical condition
Notes 1. ‘Non urban’ includes bounded locality, rural balance and migratory. 2. Directly age-standardised to the 2001 Australian population, ratio standardised to the major urban category.
Source: AIHW analysis of National Survey of Mental Health and Wellbeing 2007.
Figure 3.2: Prevalence ratios by geographical location, comorbidity group and the three comparison groups, 2007
0.0
0.5
1.0
1.5
2.0
Major urban Other urban Non urban
Ratio
0.0
0.5
1.0
1.5
2.0
Major urban Other urban Non urban
Ratio
0.0
0.5
1.0
1.5
2.0
Major urban Other urban Non urban
Ratio
0.0
0.5
1.0
1.5
2.0
Major urban Other urban Non urban
Ratio

10 Comorbidity of mental disorders and physical conditions
Country of birth People born overseas had lower rates of comorbidity than those born in Australia, and those born in non-English speaking countries (shown in the figures below as ‘Other’) had the lowest rates of all (Figure 3.3). This pattern is evident in both sexes, but males born in non-English speaking countries had the greatest difference: their rate of comorbidity is significantly lower than the rate for Australian-born males (tables A10–A12).
The pattern of better health amongst people born in non-English speaking countries is quite pronounced in the ‘any mental disorder only’ comparison group, with these being only half as likely as Australian-born people to have had ‘any mental disorder only’. People born in non-English speaking countries were 35% more likely than Australian-born people to have ‘no mental disorder or physical condition’.
Comorbidity of any mental disorder and physical condition
Any mental disorder only
Any physical condition only No mental disorder or physical condition
Notes 1. MESC = Main English speaking countries, and comprise Canada, Ireland, New Zealand, South Africa, UK and USA. 2. Directly age-standardised to the 2001 Australian population, ratio standardised to Australian born.
Source: AIHW analysis of National Survey of Mental Health and Wellbeing 2007.
Figure 3.3: Prevalence ratios by country of birth, comorbidity group and the three comparison groups, 2007
0.0
0.5
1.0
1.5
2.0
Australia MESC Other
Ratio
0.0
0.5
1.0
1.5
2.0
Australia MESC Other
Ratio
0.0
0.5
1.0
1.5
2.0
Australia MESC Other
Ratio
0.0
0.5
1.0
1.5
2.0
Australia MESC Other
Ratio
Comorbidity of mental disorders and physical conditions 11
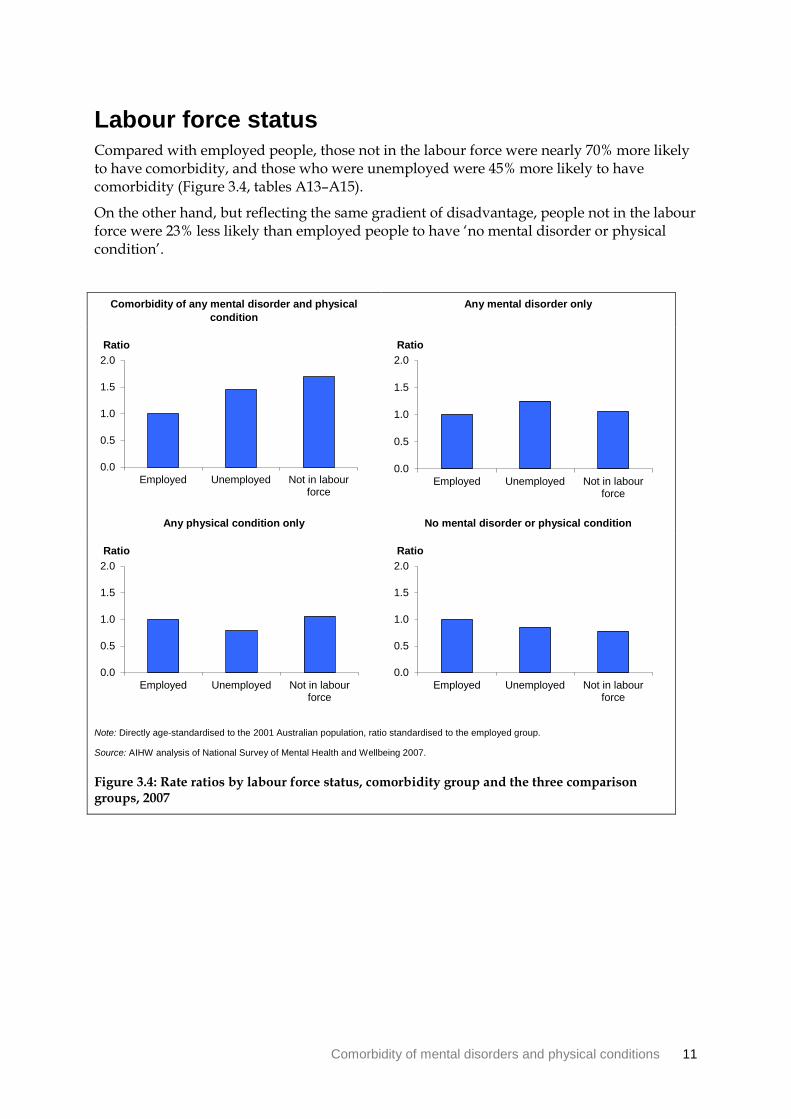
Labour force status Compared with employed people, those not in the labour force were nearly 70% more likely to have comorbidity, and those who were unemployed were 45% more likely to have comorbidity (Figure 3.4, tables A13–A15).
On the other hand, but reflecting the same gradient of disadvantage, people not in the labour force were 23% less likely than employed people to have ‘no mental disorder or physical condition’.
Comorbidity of any mental disorder and physical condition
Any mental disorder only
Any physical condition only No mental disorder or physical condition
Note: Directly age-standardised to the 2001 Australian population, ratio standardised to the employed group.
Source: AIHW analysis of National Survey of Mental Health and Wellbeing 2007.
Figure 3.4: Rate ratios by labour force status, comorbidity group and the three comparison groups, 2007
0.0
0.5
1.0
1.5
2.0
Employed Unemployed Not in labourforce
Ratio
0.0
0.5
1.0
1.5
2.0
Employed Unemployed Not in labourforce
Ratio
0.0
0.5
1.0
1.5
2.0
Employed Unemployed Not in labourforce
Ratio
0.0
0.5
1.0
1.5
2.0
Employed Unemployed Not in labourforce
Ratio

12 Comorbidity of mental disorders and physical conditions
4 Comorbidity and selected risk factors The analysis presented here shows that health risk factors are generally more prevalent among people who have a mental disorder; although it is important to note that this finding does not imply causal pathways. Risk factors are correlated with the development of or management of chronic disease, and poorer physical health can impact negatively on mental health.
Tobacco smoking The comorbidity group had the highest proportion of smokers of all the groups (Figure 4.1, Table A16). For both males and females, there were higher proportions of smokers in the groups with a mental disorder compared with the groups without a mental disorder.
Slightly higher proportions of males were smokers compared with females in the comorbidity group and the three comparison groups.
Note: Directly age-standardised to the 2001 Australian population.
Source: AIHW analysis of National Survey of Mental Health and Wellbeing 2007.
Figure 4.1: Smoking prevalence: comorbidity group and the three comparison groups, by sex, 2007
0
10
20
30
40
50
Comorbidity of anymental disorder andphysical condition
Any mentaldisorder only
Any physicalcondition only
No mental disorderor physical condition
Per cent Males
Females

Comorbidity of mental disorders and physical conditions 13
Alcohol In the survey, ‘risky alcohol behaviour’ was defined as drinking nearly every day and usually consuming at least 2 drinks (women) and at least 4 drinks (men) on the days that they drink.
There was a higher proportion of risky alcohol behaviour among males in the comorbidity group compared with the other three groups, with substantially higher prevalence in the comorbidity group (Figure 4.2, Table A17). For females, risky alcohol consumption was also more prevalent in the groups with a mental disorder compared with the two groups without a mental disorder.
Notes 1. ‘Risky alcohol behaviour’ defined as drinking nearly every day and women usually consuming at least 2 drinks
and men at least 4 drinks on the days that they drink. 2. Directly age-standardised to the 2001 Australian population.
Source: AIHW analysis of National Survey of Mental Health and Wellbeing 2007.
Figure 4.2: Prevalence of risky alcohol behaviour: comorbidity group and the three comparison groups, by sex, 2007
0
10
20
30
40
50
Comorbidity of anymental disorder andphysical condition
Any mentaldisorder only
Any physicalcondition only
No mental disorderor physical condition
Per cent Males
Females

14 Comorbidity of mental disorders and physical conditions
Overweight and obesity A higher proportion of males than females were overweight (but not obese) in all four population groups. Obesity was more prevalent among females in all the population groups except in the group with ‘no mental disorder or physical condition’ (Figure 4.3, tables A18 and A19).
There was little variation across the groups in the proportion of females that were overweight, with more variation seen among males. In the case of obesity, there was substantially more variation for both males and females, with higher prevalence seen amongst the comorbidity group and the ‘any physical condition only’ group.
Overweight
Obesity
Notes 1. ‘Overweight’ defined as having a body mass index (BMI) of 25 and over, but under 30; ‘obese’ is defined as
having a BMI of 30 or more. 2. Directly age-standardised to the 2001 Australian population.
Source: AIHW analysis of National Survey of Mental Health and Wellbeing 2007.
Figure 4.3: Prevalence of overweight and obesity: comorbidity group and the three comparison groups, by sex, 2007
0
10
20
30
40
50
Comorbidity of anymental disorder andphysical condition
Any mentaldisorder only
Any physicalcondition only
No mental disorderor physical condition
Per cent Males
Females
0
10
20
30
40
50
Comorbidity of anymental disorder andphysical condition
Any mentaldisorder only
Any physicalcondition only
No mental disorderor physical condition
Per cent Males
Females

Comorbidity of mental disorders and physical conditions 15
Physical inactivity Physical activity has been positively associated with psychological wellbeing, and studies have shown that higher levels of physical activity reduce the likelihood of depression. ‘Sedentary’ activity is used as an indicator for physical inactivity, and in this survey was defined as people who did very little exercise (less than 100 minutes) or no exercise in the week prior to interview.
Levels of sedentary activity vary little among females across all four groups. The male rate is more variable, with the prevalence highest in the ‘any mental disorder only’ group (Figure 4.4, Table A20).
Notes 1. ‘Sedentary’ defined as having no or a very low level of exercise (less than 100 minutes) in the week prior to
interview. 2. Directly age-standardised to the 2001 Australian population.
Source: AIHW analysis of National Survey of Mental Health and Wellbeing 2007.
Figure 4.4: Prevalence of physical inactivity: comorbidity group and the three comparison groups, by sex, 2007
0
10
20
30
40
50
Comorbidity of anymental disorder andphysical condition
Any mentaldisorder only
Any physicalcondition only
No mental disorderor physical condition
Per cent Males
Females

16 Comorbidity of mental disorders and physical conditions
5 Comorbidity and health service use
Hospitalisations People with a ‘comorbidity of any mental disorder and physical condition’ had higher rates of hospitalisation than the three comparison groups (note that hospitalisation is for either a mental disorder and/or physical condition) (Figure 5.1). This difference is significant for both sexes compared with the two groups without a mental disorder, and for males compared with the ‘any mental disorder only’ group (Table A21).
Notes 1. Admitted to hospital overnight or longer for mental or physical health condition in past 12 months. 2. Directly age-standardised to the 2001 Australian population. 3. Excludes admissions for routine childbirth.
Source: AIHW analysis of National Survey of Mental Health and Wellbeing 2007.
Figure 5.1: Hospitalisation for either mental disorder or physical condition, comorbidity group and the three comparison groups, by sex, 2007
0
10
20
30
Comorbidity of anymental disorder andphysical condition
Any mentaldisorder only
Any physicalcondition only
No mental disorderor physical condition
Per cent Males
Females
Comorbidity of mental disorders and physical conditions 17
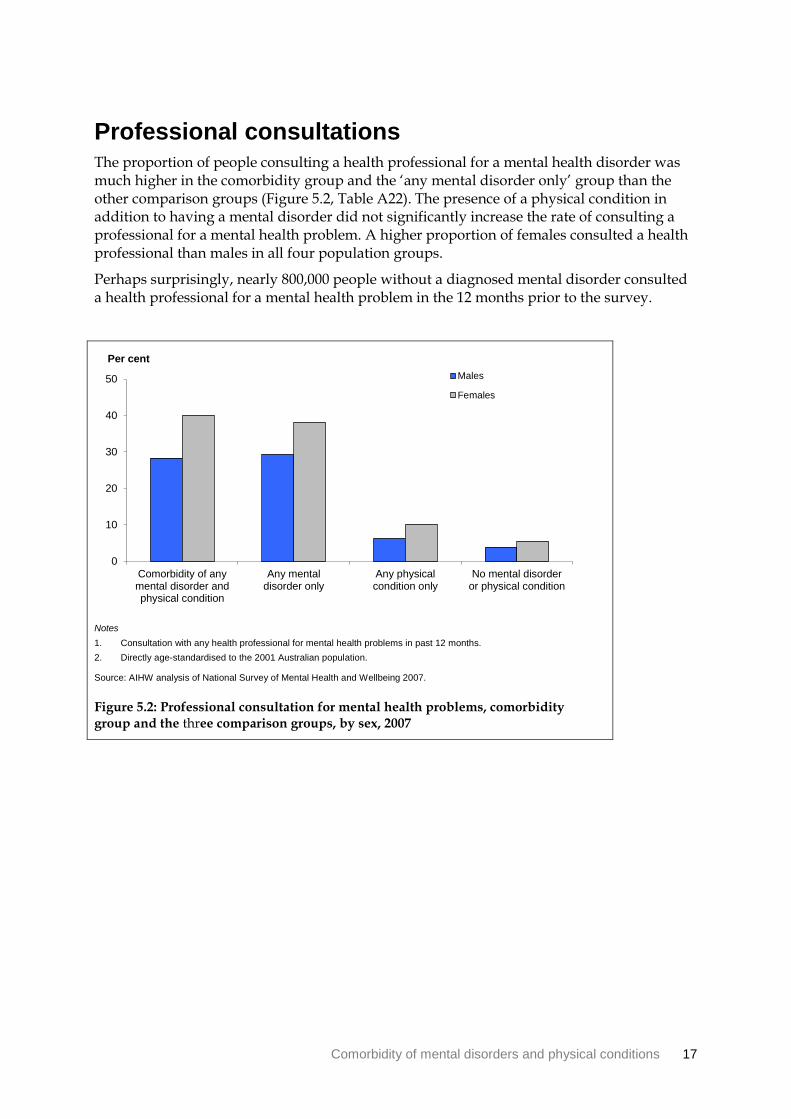
Professional consultations The proportion of people consulting a health professional for a mental health disorder was much higher in the comorbidity group and the ‘any mental disorder only’ group than the other comparison groups (Figure 5.2, Table A22). The presence of a physical condition in addition to having a mental disorder did not significantly increase the rate of consulting a professional for a mental health problem. A higher proportion of females consulted a health professional than males in all four population groups.
Perhaps surprisingly, nearly 800,000 people without a diagnosed mental disorder consulted a health professional for a mental health problem in the 12 months prior to the survey.
Notes 1. Consultation with any health professional for mental health problems in past 12 months. 2. Directly age-standardised to the 2001 Australian population.
Source: AIHW analysis of National Survey of Mental Health and Wellbeing 2007.
Figure 5.2: Professional consultation for mental health problems, comorbidity group and the three comparison groups, by sex, 2007
0
10
20
30
40
50
Comorbidity of anymental disorder andphysical condition
Any mentaldisorder only
Any physicalcondition only
No mental disorderor physical condition
Per cent Males
Females

18 Comorbidity of mental disorders and physical conditions
6 Comorbidity and quality of life
The results presented in this section use three measures of ‘quality of life’, and indicate that comorbidity of mental disorder and physical condition is associated with generally poorer quality of life.
The Kessler Psychological Distress Scale The Kessler Psychological Distress Scale (K10) is a 10-item questionnaire intended to yield a global measure of psychological distress, based on questions about anxiety and depressive symptoms that a person has experienced in the most recent 4 week period. A higher score represents more psychological distress. In this analysis, high psychological distress was taken as a score of 30 or higher (out of a maximum score of 50).
Not surprisingly, the comorbidity group and the ‘any mental disorder only’ group had the highest prevalence of high K10 scores (Figure 6.1, Table A23). Females had higher prevalence of high psychological distress than males across all four population groups, with more than twice the rate in the ‘any mental disorder only’ group.
Notes
1. Directly age-standardised to the 2001 Australian population.
2. Cut-off scores to assess levels of psychological stress are based on those developed by CRUfAD (see Glossary).
Source: AIHW analysis of National Survey of Mental Health and Wellbeing 2007.
Figure 6.1: High psychological distress on the K10 scale, comorbidity group and the three comparison groups, by sex, 2007
0
5
10
15
20
Comorbidity of anymental disorder andphysical condition
Any mentaldisorder only
Any physicalcondition only
No mental disorderor physical condition
Per cent Males
Females

Comorbidity of mental disorders and physical conditions 19
Delighted–terrible scale The delighted–terrible scale is a single-question indicator of quality of life, using the following categories: delighted, pleased, mostly satisfied, mixed, mostly dissatisfied, unhappy, terrible. In this analysis, the first two categories are grouped and reported as ‘prevalence of feeling delighted or pleased’.
People with a mental disorder were only about half as likely to be ‘delighted’ or ‘pleased’ as people without a mental disorder (Figure 6.2, Table A24). Having a physical condition, either in addition to the mental disorder or by itself, had a much smaller influence on their perception of quality of life. This finding is consistent for both males and females.
Note: Directly age-standardised to the 2001 Australian population.
Source: AIHW analysis of National Survey of Mental Health and Wellbeing 2007.
Figure 6.2: Feeling delighted or pleased with the quality of life, comorbidity group and the three comparison groups, by sex, 2007
Days out of role The ‘days out of role’ measure is a proxy for how well a person is functioning—that is the extent to which health problems interfered with their life and activities during the 30 days prior to the survey. People were asked to nominate how many days they were totally unable to work or carry out their normal activities because of their health, and the number of days they had to cut down on what was done or did not get as much done as usual because of their health. The number of ‘days out of role’ was derived as the number of days totally unable to function plus half the number of days of reduced functioning. This analysis presents the prevalence of more than 7 days ‘out of role’.
People with comorbidity were around twice as likely as people without comorbidity to have more than 7 out of the past 30 days ‘out of role’ (Figure 6.3, Table A25). Conversely, people with no mental or physical condition were less likely to have 7 or more days ‘out of role’.
0
10
20
30
40
50
60
70
Comorbidity of anymental disorder andphysical condition
Any mentaldisorder only
Any physicalcondition only
No mental disorderor physical condition
Per cent Males
Females

20 Comorbidity of mental disorders and physical conditions
Note: Directly age-standardised to the 2001 Australian population.
Source: AIHW analysis of National Survey of Mental Health and Wellbeing 2007.
Figure 6.3: More than 7 days in last month out of role, comorbidity group and the three comparison groups, by sex, 2007
0
10
20
30
Comorbidity of anymental disorder andphysical condition
Any mentaldisorder only
Any physicalcondition only
No mental disorderor physical condition
Per cent Males
Females

Comorbidity of mental disorders and physical conditions 21
Appendix A Additional and supporting data
Figure A1: Derivation of comparison groups, people aged 16–85, 2007
Any 12-month mental disorder 3,197,800 (20%)
Physical condition only 6,152,500 (38.4%)
No lifetime mental disorder 8,728,700 (55%)
Any lifetime mental disorder 7,286,600 (45%)
Total persons aged 16–85 16,015,300 (100%)
No 12-month mental disorder
4,088,800 (25%)
Any physical condition
8,029,100 (50%)
No physical condition
7,986,200 (50%)
Total persons aged 16–85 16,015,300 (100%)
12-month mental disorder only 1,321,200 (8.3%)
Comorbidity of 12-month mental disorders and physical conditions
1,876,600 (11.7%)
No 12-month mental disorder or physical condition 6,665,000 (41.6%)

22 Comorbidity of mental disorders and physical conditions
Table A1: Prevalence of selected comorbidities, by sex and age group, 2007 (per cent)
Comorbidity Sex 16–24 25–34 35–44 45–54 55–64 65–85
Anxiety disorder, any physical condition Males 2.4 5.0 7.6 7.4 7.6 3.9
Females 9.5 11.5 14.9 17.6 11.6 5.3
Persons 5.9 8.2 11.3 12.6 9.6 4.7
Affective disorder, any physical condition Males 1.8 4.5 4.8 3.5 2.0 1.3
Females 4.3 5.9 5.2 5.9 5.0 2.8
Persons 3.0 5.2 5.0 4.7 3.5 2.1
Substance use disorder, any physical condition Males 5.0 5.0 4.4 1.5 1.4 1.3
Females 4.4 2.1 1.3 2.8 0.4 0.0
Persons 4.7 3.6 2.8 2.1 0.9 0.6
Any mental disorder and asthma Males 2.5 2.4 2.0 1.2 1.1 1.0
Females 4.8 3.6 3.9 3.2 2.4 0.9
Persons 3.6 3.0 3.0 2.3 1.7 1.0
Any mental disorder and cancer Males 0.0 0.1 0.4 0.6 1.3 0.8
Females 0.0 0.8 0.7 1.0 0.6 0.6
Persons 0.0 0.4 0.6 0.8 1.0 0.7
Any mental disorder and stroke Males 0.0 0.1 0.3 0.0 0.1 0.5
Females 0.0 0.0 0.0 0.5 0.6 0.1
Persons 0.0 0.1 0.1 0.2 0.3 0.3
Any mental disorder and heart problem Males 0.1 0.3 1.2 3.3 5.4 3.1
Females 0.3 1.4 2.3 3.6 4.8 4.6
Persons 0.2 0.8 1.7 3.4 5.1 3.8
Any mental disorder and arthritis, rheumatism or gout Males 0.0 1.1 2.0 3.0 3.3 2.5
Females 0.8 1.0 2.8 6.2 6.7 5.1
Persons 0.4 1.0 2.4 4.6 5.0 3.9
Any mental disorder and diabetes Males 0.1 0.0 0.3 1.1 2.4 0.7
Females 0.4 0.7 1.0 1.6 0.9 1.5
Persons 0.3 0.3 0.6 1.3 1.7 1.1
Source: AIHW analysis of National Survey of Mental Health and Wellbeing, 2007.

Comorbidity of mental disorders and physical conditions 23
Table A2: Number and proportion in the most disadvantaged socioeconomic quintile, by population group, 2007
Males Females Persons
Population group ’000 % CI ’000 % CI ’000 % CI
Comorbidity of any mental and physical condition 128 9.7 6.4, 13.1 248 18.1 13.1, 23.1 376 13.9 10.9, 16.9
Any mental disorder only 102 8.4 5.6, 11.2 94 7.5 4.8, 10.1 197 7.9 6.0, 9.8
Any physical condition only 468 35.3 28.7, 41.9 537 37.8 31.7, 43.8 1,006 36.6 32.0, 41.2
No mental disorder or physical condition 607 46.6 38.6, 54.6 492 36.7 30.8, 42.6 1,099 41.6 36.6, 46.7
Notes 1. SES based on SEIFA Index of Relative Socio-Economic Disadvantage at Census collection district level, not population weighted. 2. Proportions (%) have been directly age-standardised to the 2001 Australian population.
Source: AIHW analysis of National Survey of Mental Health and Wellbeing, 2007.
Table A3: Number and proportion in the second most disadvantaged socioeconomic quintile, by population group, 2007
Males Females Persons
Population group ’000 % CI ’000 % CI ’000 % CI
Comorbidity of any mental and physical condition 156 11.2 7.5, 14.9 206 13.9 10.0, 17.8 362 12.5 9.9, 15.1
Any mental disorder only 138 9.6 6.3, 12.9 117 8.6 6.1, 11.2 255 9.1 7.0, 11.1
Any physical condition only 543 35.6 29.4, 41.8 646 40.7 35.1, 46.3 1,189 38.2 34.0, 42.5
No mental disorder or physical condition 614 43.6 37, 50.2 540 36.8 31.2, 42.4 1,154 40.2 35.7, 44.8
Notes 1. SES based on the SEIFA Index of Relative Socio-Economic Disadvantage at Census collection district level, not population weighted. 2. Directly age-standardised to the 2001 Australian population.
Source: AIHW analysis of National Survey of Mental Health and Wellbeing, 2007.
Table A4: Number and proportion in the third most disadvantaged socioeconomic quintile, by population group, 2007
Males Females Persons
Population group ’000 % CI ’000 % CI ’000 % CI
Comorbidity of any mental and physical condition 148 9.3 5.7, 12.9 257 16.1 12.4, 19.8 405 12.6 10.0, 15.1
Any mental disorder only 151 10.0 6.4, 13.6 128 8.3 6.2, 10.5 280 9.1 7.0, 11.2
Any physical condition only 644 38.8 31.3, 46.3 596 36.7 31.2, 42.1 1,240 37.8 33.1, 42.6
No mental disorder or physical condition 665 41.9 35.8, 48 618 38.9 33.4, 44.4 1,284 40.5 36.4, 44.5
Notes 1. SES based on the SEIFA Index of Relative Socio-Economic Disadvantage at Census collection district level, not population weighted. 2. Directly age-standardised to the 2001 Australian population.
Source: AIHW analysis of National Survey of Mental Health and Wellbeing, 2007.

24 Comorbidity of mental disorders and physical conditions
Table A5: Number and proportion in the second least disadvantaged socioeconomic quintile, by population group, 2007
Males Females Persons
Population group ’000 % CI ’000 % CI ’000 % CI
Comorbidity of any mental and physical condition 163 8.8 6.4, 11.1 267 16.0 12.7, 19.4 429 12.2 10.2, 14.3
Any mental disorder only 162 9.3 5.6, 12.9 147 8.7 6.5, 11.0 309 8.8 6.7, 10.9
Any physical condition only 612 34.1 28.7, 39.6 633 38.4 33.0, 43.8 1,245 36.2 32.2, 40.1
No mental disorder or physical condition 872 47.8 39.9, 55.7 632 36.8 31.2, 42.5 1,504 42.8 37.8, 47.8
Notes 1. SES based on the SEIFA Index of Relative Socio-Economic Disadvantage at Census collection district level, not population weighted. 2. Directly age-standardised to the 2001 Australian population.
Source: AIHW analysis of National Survey of Mental Health and Wellbeing, 2007.
Table A6: Number and proportion in the least disadvantaged socioeconomic quintile, by population group, 2007
Males Females Persons
Population group ’000 % CI ’000 % CI ’000 % CI
Comorbidity of any mental and physical condition 110 6.5 4.3, 8.8 193 10.7 8.1, 13.2 303 8.5 6.8, 10.1
Any mental disorder only 143 7.7 5.1, 10.3 138 8.0 5.1, 10.8 280 7.7 5.8, 9.6
Any physical condition only 608 35.0 29.7, 40.2 865 43.4 37.9, 48.9 1,473 39.7 35.8, 43.5
No mental disorder or physical condition 917 50.8 42.9, 58.8 707 38.0 32.8, 43.1 1,624 44.2 39.4, 49.1
Notes 1. SES based on the SEIFA Index of Relative Socio-Economic Disadvantage at Census collection district level, not population weighted. 2. Directly age-standardised to the 2001 Australian population.
Source: AIHW analysis of National Survey of Mental Health and Wellbeing, 2007.
Table A7: Number and proportion in major urban areas, by population group, 2007
Males Females Persons
Population group ’000 % CI ’000 % CI ’000 % CI
Comorbidity of any mental and physical condition 460 8.6 7.0, 10.2 761 14.5 12.6, 16.5 1,221 11.6 10.2, 12.9
Any mental disorder only 497 9.3 7.4, 11.2 442 8.2 6.9, 9.6 939 8.8 7.6, 9.9
Any physical condition only 1,810 34.7 31.7, 37.6 2,122 39.8 36.9, 42.8 3,932 37.3 35.2, 39.4
No mental disorder or physical condition 2,517 47.5 43.8, 51.1 2,004 37.4 34.7, 40.1 4,521 42.4 40.1, 44.7
Note: Rates have been age-standardised to the Australian population at 30 June 2001. Source: AIHW analysis of National Survey of Mental Health and Wellbeing, 2007.

Comorbidity of mental disorders and physical conditions 25
Table A8: Number and proportion in other urban areas, by population group, 2007
Males Females Persons
Population group ’000 % CI ’000 % CI ’000 % CI
Comorbidity of any mental and physical condition 161 9.3 6.6, 12.1 253 14.5 10.9, 18.0 415 12.0 9.6, 14.3
Any mental disorder only 122 7.6 5.4, 9.7 121 8.2 5.7, 10.6 243 7.8 6.2, 9.3
Any physical condition only 631 36.3 30.2, 42.3 738 40.0 34.8, 45.1 1,370 38.1 33.9, 42.4
No mental disorder or physical condition 775 46.9 40.5, 53.2 618 37.4 31.8, 42.9 1,393 42.2 37.9, 46.4
Note: Rates have been age-standardised to the Australian population at 30 June 2001. Source: AIHW analysis of National Survey of Mental Health and Wellbeing, 2007.
Table A9: Number and proportion in non-urban areas, by population group, 2007
Males Females Persons
Population group ’000 % CI ’000 % CI ’000 % CI
Comorbidity of any mental and physical condition 85 9.7 5.2, 14.3 156 15.7 10.7, 20.7 241 12.8 9.4, 16.3
Any mental disorder only 77 10.0 5.4, 14.6 61 8.0 4.9, 11.1 139 8.7 6.0, 11.4
Any physical condition only 434 37.7 28.8, 46.5 417 38.6 32.1, 45.1 851 37.9 32.5, 43.3
No mental disorder or physical condition 383 42.6 34.9, 50.3 368 37.7 29.9, 45.4 751 40.6 34.7, 46.4
Notes 1. Non urban includes bounded locality, rural balance and migratory. 2. Directly age-standardised to the 2001 Australian population.
Source: AIHW analysis of National Survey of Mental Health and Wellbeing, 2007.
Table A10: Number and proportion born in Australia, by population group, 2007
Males Females Persons
Population group ’000 % CI ’000 % CI ’000 % CI
Comorbidity of any mental and physical condition 566 9.8 8.2, 11.4 904 15.6 13.6, 17.6 1,470 12.7 11.4, 14.0
Any mental disorder only 561 9.4 7.8, 11.1 510 8.9 7.5, 10.2 1,071 9.1 8.1, 10.2
Any physical condition only 2,068 36.9 33.9, 39.9 2,366 39.6 37.1, 42.2 4,434 38.3 36.3, 40.2
No mental disorder or physical condition 2,587 43.9 40.6, 47.2 2,108 35.9 33.1, 38.7 4,695 39.9 37.7, 42.1
Note: Rates have been age-standardised to the Australian population at 30 June 2001. Source: AIHW analysis of National Survey of Mental Health and Wellbeing, 2007.

26 Comorbidity of mental disorders and physical conditions
Table A11: Number and proportion born in main English-speaking countries, by population group, 2007
Males Females Persons
Population group ’000 % CI ’000 % CI ’000 % CI
Comorbidity of any mental and physical condition 81 7.8 5.8, 13.7 109 14.0 9.6, 18.5 189 10.5 7.8, 13.2
Any mental disorder only 97 12.8 5.8, 19.7 53 7.9 4.9, 10.9 150 10.5 6.7, 14.3
Any physical condition only 425 36.3 28.5, 44.1 385 43.3 35, 51.7 810 40.0 34.3, 45.7
No mental disorder or physical condition 395 43.1 33.6, 52.6 268 34.7 27.5, 42.0 663 39.0 33.1, 44.9
Notes 1. Main English speaking countries are Canada, Ireland, New Zealand, South Africa, UK and USA. 2. Directly age-standardised to the 2001 Australian population.
Source: AIHW analysis of National Survey of Mental Health and Wellbeing, 2007.
Table A12: Number and proportion of overseas born people (excluding those from main English- speaking countries), by population group, 2007
Males Females Persons
Population group ’000 % CI ’000 % CI ’000 % CI
Comorbidity of any mental and physical condition 59 4.3 2.5, 6.1 159 11.1 7.7, 14.6 217 8.1 6.0, 10.2
Any mental disorder only 38 3.5 1.6, 5.4 62 5.0 2.7, 7.2 100 4.2 2.8, 5.7
Any physical condition only 382 29.5 23.2, 35.7 526 37.9 30.6, 45.2 909 33.9 29, 38.8
No mental disorder or physical condition 694 62.7 51.7, 73.7 614 46.0 39.8, 52.3 1,308 53.8 47.7, 59.9
Notes 1. Main English speaking countries are Canada, Ireland, New Zealand, South Africa, UK and USA. 2. Directly age-standardised to the 2001 Australian population.
Source: AIHW analysis of National Survey of Mental Health and Wellbeing, 2007.
Table A13: Number and proportion employed, by population group, 2007
Males Females Persons
Population group ’000 % CI ’000 % CI ’000 % CI
Comorbidity of any mental and physical condition 484 9.2 7.1, 11.3 648 12.1 10.4, 13.9 1,132 10.7 9.2, 12.1
Any mental disorder only 562 8.8 7.2, 10.4 423 7.8 6.6, 9.1 985 8.3 7.3, 9.3
Any physical condition only 1,756 35.1 30.8, 39.5 1,662 39.3 34.7, 43.9 3,418 36.8 33.7, 39.9
No mental disorder or physical condition 2,846 46.9 43.4, 50.3 2,067 40.7 37.1, 44.4 4,913 44.3 41.7, 46.8
Note: Rates have been age-standardised to the Australian population at 30 June 2001. Source: AIHW analysis of National Survey of Mental Health and Wellbeing, 2007.

Comorbidity of mental disorders and physical conditions 27
Table A14: Number and proportion unemployed, by population group, 2007
Males Females Persons
Population group ’000 % CI ’000 % CI ’000 % CI
Comorbidity of any mental and physical condition 21 11.0 2.5, 19.4 41 20.2 8.1, 32.3 61 15.4 7.6, 23.2
Any mental disorder only 40 12.7 5.5, 19.9 20 6.8 1.8, 11.7 60 10.4 5.6, 15.2
Any physical condition only 39 22.2 4.9, 39.5 42 31.3 13.5, 49.1 81 28.9 13.7, 44.1
No mental disorder or physical condition 137 43.9 25.0, 62.8 74 29.4 16.7, 42.1 211 37.5 24.3, 50.8
Note: Rates have been age-standardised to the Australian population at 30 June 2001. Source: AIHW analysis of National Survey of Mental Health and Wellbeing, 2007.
Table A15: Number and proportion not in the labour force, by population group, 2007
Males Females Persons
Population group ’000 % CI ’000 % CI ’000 % CI
Comorbidity of any mental and physical condition 201 14.6 8.7, 20.6 482 19.5 15.1, 23.8 683 18.0 14.5, 21.5
Any mental disorder only 94 9.1 5.3, 12.8 182 9.1 6.8, 11.4 276 8.8 6.9, 10.6
Any physical condition only 1,080 38.9 27.2, 50.6 1,573 39.2 34.4, 44.0 2,653 38.8 34.0, 43.6
No mental disorder or physical condition 693 37.4 27.6, 47.2 849 32.3 28.6, 35.9 1,541 34.4 30.6, 38.2
Note: Rates have been age-standardised to the Australian population at 30 June 2001. Source: AIHW analysis of National Survey of Mental Health and Wellbeing, 2007.
Table A16: Number and proportion of smokers, by population group, 2007
Males Females Persons
Population group ’000 % CI ’000 % CI ’000 % CI
Comorbidity of any mental and physical condition 292 39.5 30.6, 48.3 396 32.1 26.0, 38.2 688 34.9 29.8, 40.1
Any mental disorder only 262 34.5 25.9, 43.1 207 27.9 20.5, 35.2 469 30.6 25.3, 36.0
Any physical condition only 552 22.3 17.7, 26.9 460 16.6 13.7, 19.5 1,012 19.0 16.5, 21.5
No mental disorder or physical condition 886 23.3 20.0, 26.5 512 17.1 14.0, 20.2 1,398 20.6 18.2, 23.0
Note: Rates have been age-standardised to the Australian population at 30 June 2001. Source: AIHW analysis of National Survey of Mental Health and Wellbeing, 2007.

28 Comorbidity of mental disorders and physical conditions
Table A17: Number and proportion with risky alcohol behaviour, by population group, 2007
Males Females Persons
Population group ’000 % CI ’000 % CI ’000 % CI
Comorbidity of any mental and physical condition 124 16.4 10.1, 22.6 120 10.0 6.4, 13.6 245 13.0 9.4, 16.5
Any mental disorder only 67 10.7 5.7, 15.7 51 11.0 5.1, 16.9 117 10.9 7.1, 14.8
Any physical condition only 245 6.9 5.0, 8.8 238 5.7 4.3, 7.1 483 6.2 5.1, 7.4
No mental disorder or physical condition 199 5.9 4.1, 7.7 172 6.1 4.3, 7.9 371 6.1 4.7, 7.4
Notes 1. ‘Risky alcohol behaviour’ defined as drinking nearly every day and women usually consuming at least 2 drinks and men at least 4 drinks on
the days that they drink. 2. Directly age-standardised to the 2001 Australian population.
Source: AIHW analysis of National Survey of Mental Health and Wellbeing 2007.
Table A18: Number and proportion overweight, by population group, 2007
Males Females Persons
Population group ’000 % CI ’000 % CI ’000 % CI
Comorbidity of any mental and physical condition 268 39.1 29.7, 48.4 290 25.9 21.3, 30.6 558 30.9 26.3, 35.5
Any mental disorder only 242 33.7 23.6, 43.8 150 25.7 16.0, 35.3 392 30.8 23.4, 38.1
Any physical condition only 1,343 44.8 38.5, 51.2 942 26.2 23.1, 29.4 2,285 34.8 31.5, 38.1
No mental disorder or physical condition 1,573 44.1 39.4, 48.9 645 23.0 20.0, 26.0 2,218 34.8 31.9, 37.7
Notes 1. ‘Overweight’ defined as having a body mass index between 25 and 30. 2. Directly age-standardised to the 2001 Australian population.
Source: AIHW analysis of National Survey of Mental Health and Wellbeing 2007.
Table A19: Number and proportion obese, by population group, 2007
Males Females Persons
Population group ’000 % CI ’000 % CI ’000 % CI
Comorbidity of any mental and physical condition 180 23.7 16.2, 31.2 322 25.7 20.7, 30.6 502 24.8 20.7, 28.9
Any mental disorder only 98 13.8 8.4, 19.3 84 18.6 10.5, 26.8 182 17.3 11.8, 22.9
Any physical condition only 633 20.7 17.2, 24.1 877 25.1 21.5, 28.6 1,510 23.0 20.6, 25.5
No mental disorder or physical condition 594 16.8 14.1, 19.6 434 14.7 11.6, 17.8 1,028 15.8 13.8, 17.8
Notes 1. ‘Obese’ defined as having a body mass index greater than 30. 2. Directly age-standardised to the 2001 Australian population.
Source: AIHW analysis of National Survey of Mental Health and Wellbeing, 2007.

Comorbidity of mental disorders and physical conditions 29
Table A20: Number and proportion sedentary, by population group, 2007
Males Females Persons
Population group ’000 % CI ’000 % CI ’000 % CI
Comorbidity of any mental and physical condition 127 17.8 11.1, 24.6 233 20.4 15.8, 25.1 359 19.4 15.5, 23.4
Any mental disorder only 165 26.4 16.2, 36.6 100 18.7 9.9, 26.8 265 22.4 16.4, 28.4
Any physical condition only 612 19.7 16.2, 23.2 713 19.7 16.7, 22.7 1,326 19.7 17.4, 22.0
No mental disorder or physical condition 591 16.8 14.1, 19.6 438 15.3 12.9, 17.8 1,029 16.0 14.2, 17.8
Notes 1. ‘Sedentary’ defined as having no or a very low level of exercise. 2. Directly age-standardised to the 2001 Australian population.
Source: AIHW analysis of National Survey of Mental Health and Wellbeing, 2007.
Table A21: Number and proportion admitted to hospital overnight, by population group, 2007
Males Females Persons
Population group ’000 % CI ’000 % CI ’000 % CI
Comorbidity of any mental and physical condition 170 24.2 16.2, 32.3 169 16.2 12.4, 19.9 339 19.1 15.3, 22.8
Any mental disorder only 101 10.7 5.4, 16.0 43 10.2 3.0, 17.3 145 11.5 6.2, 16.8
Any physical condition only 446 13.3 10.7, 15.9 378 9.9 8.1, 11.7 824 11.5 9.9, 13.0
No mental disorder or physical condition 187 5.8 4.1, 7.4 168 6.1 4.4, 7.9 355 5.9 4.7, 7.1
Notes 1. Admitted to hospital overnight or longer for physical or mental health condition in past 12 months. 2. Directly age-standardised to the 2001 Australian population. 3. Excludes routing childbirth.
Source: AIHW analysis of National Survey of Mental Health and Wellbeing, 2007.
Table A22: Number and proportion consulting a health professional for mental health, by population group, 2007
Males Females Persons
Population group ’000 % CI ’000 % CI ’000 % CI
Comorbidity of any mental and physical condition 208 28.4 20.9, 35.8 486 40.0 34.0, 46.0 694 35.6 31.0, 40.3
Any mental disorder only 175 29.3 16.7, 41.9 237 38.0 28.8, 47.3 412 33.8 25.6, 41.9
Any physical condition only 171 6.3 3.1, 9.4 291 10.1 7.8, 12.5 462 8.2 6.4, 10.1
No mental disorder or physical condition 143 3.9 2.7, 5.1 175 5.5 4.2, 6.7 318 4.6 3.8, 5.5
Notes 1. Consultation with any professional for mental health in past 12 months. 2. Directly age-standardised to the 2001 Australian population.
Source: AIHW analysis of National Survey of Mental Health and Wellbeing, 2007.

30 Comorbidity of mental disorders and physical conditions
Table A23: Number and proportion with high psychological distress, by population group, 2007
Males Females Persons
Population group ’000 % CI ’000 % CI ’000 % CI
Comorbidity of any mental and physical condition 82 11.7 5.3, 18.0 149 13.2 8.2, 18.1 231 12.4 8.3, 16.5
Any mental disorder only 37 5.1 0.2, 9.9 58 12.3 4.3, 20.4 95 8.9 3.1, 14.7
Any physical condition only 31 1.0 0.0, 2.2 33 1.2 0.1, 2.2 64 1.1 0.3, 1.9
No mental disorder or physical condition 9 0.3 0.0, 0.7 10 0.4 0.0, 1.0 19 0.3 0.0, 0.7
Notes 1. Kessler 10 score of 30 or higher (see CRUfAD in Glossary). 2. Directly age-standardised to the 2001 Australian population.
Source: AIHW analysis of National Survey of Mental Health and Wellbeing, 2007.
Table A24: Number and proportion delighted or pleased, by population group, 2007
Males Females Persons
Population group ’000 % CI ’000 % CI ’000 % CI
Comorbidity of any mental and physical condition 221 31.4 23.4, 39.5 350 30.2 24.9, 35.6 570 30.8 26.1, 35.6
Any mental disorder only 254 29.8 20.1, 39.4 256 33.3 25.2, 41.3 510 32.5 25.6, 39.5
Any physical condition only 1,524 57.3 50.4, 64.2 1,533 52.0 47.0, 57.0 3,057 54.6 50.6, 58.7
No mental disorder or physical condition 2,215 59.3 54.5, 64.0 1,853 60.4 55.3, 65.6 4,068 59.9 56.4, 63.4
Notes 1. Quality of life measured on the delighted-terrible scale. 2. Directly age-standardised to the 2001 Australian population.
Source: AIHW analysis of National Survey of Mental Health and Wellbeing, 2007.
Table A25: Number and proportion with more than 7 days out of role, by population group, 2007
Males Females Persons
Population group ’000 % CI ’000 % CI ’000 % CI
Comorbidity of any mental and physical condition 173 24.1 16.0, 32.3 263 22.6 16.3, 28.8 436 23.2 18.0, 28.4
Any mental disorder only 56 6.7 1.5, 11.9 67 11.9 5.7, 18.1 123 9.2 4.8, 13.6
Any physical condition only 279 8.7 5.4, 12.0 341 9.3 6.7, 11.9 621 9.1 7.1, 11.1
No mental disorder or physical condition 87 2.4 1.2, 3.6 66 2.2 0.9, 3.6 153 2.3 1.4, 3.3
Notes 1. More than 7 days out of past 30 days. 2. Directly age-standardised to the 2001 Australian population.
Source: AIHW analysis of National Survey of Mental Health and Wellbeing, 2007.

Comorbidity of mental disorders and physical conditions 31
Appendix B Data sources and methods
National Survey of Mental Health and Wellbeing 2007
Scope The survey was conducted throughout Australia from August to December 2007. The scope of the survey was people aged 16–85, who were usual residents of private dwellings in Australia, excluding very remote areas.
Mental disorders The survey collected information on selected mental disorders, which were considered to have the highest rates of prevalence in the community and which were able to be identified in an interviewer-based household survey. These mental disorders were:
• anxiety disorders (for example obsessive-compulsive disorder) • affective (mood) disorders (for example depression) • substance use disorders (for example alcohol dependence).
Physical conditions The survey collected information on asthma, cancer, stroke (or the effects of stroke), gout, rheumatism or arthritis, diabetes or high blood sugar levels, and any other heart or circulatory condition. Information was also collected about the presence of the following physical conditions only if they had lasted for six months or more: hay fever, sinusitis or sinus allergy, emphysema, bronchitis, anaemia, epilepsy, fluid problems/fluid retention/oedema (excluding those due to heart or circulatory problems), hernias, kidney problems, migraine, psoriasis, stomach ulcer or other gastrointestinal ulcer, thyroid trouble/goitre, tuberculosis, back or neck pain or back or neck problems. The presence of any other physical conditions was not determined.
Limitations of survey People living in institutions, nursing homes, prisons and other specialist settings were not included in the survey. These populations may have different patterns of morbidity and comorbidity than those in scope for the survey, but as they make up only a relatively small proportion of the total population aged 16–85, their non-inclusion does not greatly affect the overall prevalence.
The survey did not include modules to determine the prevalence of schizophrenia and other psychotic disorders, somatoform disorders, eating disorders, impulse-control disorders and personality disorders. These disorders have a low prevalence and a likely overlap with other disorders covered in the survey and will not greatly affect overall prevalence.
The response rate of the survey was relatively low (60%) and it is possible that the people who did not participate may have had a higher likelihood of meeting diagnostic criteria for mental disorders. The ABS examined the impact of non-response and determined its impact was minimal at the aggregate level and that the results of the survey are considered representative of the Australian population in terms of standard demographic factors.
32 Comorbidity of mental disorders and physical conditions
Methods
Age standardisation Statistics are sometimes presented as crude rates; that is, the number of events in a year divided by the size of the corresponding population, indexed to 100 or 100,000. However, the risk of getting various diseases varies greatly with age. This may make comparisons across populations misleading if they have different age structures, and even small age differences may lead to false conclusions. Age-specific comparisons can be made—that is, comparing rates at specific ages—but this can be cumbersome because it requires numerous comparisons.
Variations in age structure, between populations or over time, can be adjusted for by a statistical procedure called age-standardisation. This procedure converts the age structure of the different populations to the same ‘standard’ structure. Using age-specific rates from the different populations, the overall rates that would then occur with the standard age structure can be calculated and compared. In other words, this allows the different populations to be compared on an equal age basis.
Rates in this report have been directly age-standardised to the Australian population as at 30 June 2001. Both the AIHW and the ABS have agreed to adopt 2001 as the national standard population.
Prevalence ratios A prevalence ratio is defined as ‘prevalence A’ divided by ‘prevalence B’, with the latter termed the ‘reference rate’.
For example, in calculating the ratio for reporting on the comorbidity group by socioeconomic status for ‘quintile 1’:
• ‘prevalence A’ was the direct age-standardised rate of the comorbidity group with a socioeconomic rating which puts them in quintile 1 (most disadvantaged), while
• ‘prevalence B’ was the direct age-standardised rate of the comorbidity group with a socioeconomic rating which puts them in quintile 5 (least disadvantaged).
The ratio for the reference group (in the above example quintile 5) is by definition 1.0.

Comorbidity of mental disorders and physical conditions 33
Glossary Affective (mood) disorders Disorders that involve mood disturbance. Examples include bipolar affective disorder, depressive episode and dysthymia.
Anxiety disorders Disorders that involve feelings of tension, distress or nervousness.
Body mass index (BMI) A measure of body mass, typically used to define overweight and obese. Calculated from reported height and weight information, using the formula weight (kg) divided by the square of height (m). BMI values are grouped according to the World Health Organization and the National Health and Medical Research Council guidelines. Underweight—less than 18.5; normal weight—18.5 to less than 25.0; overweight—25.0 to less than 30.0; obese—30.0 and greater.
Chronic condition A physical condition or disorder that has lasted, or is expected to last for six months or more. May also be referred to as a long-term health condition or chronic disease.
Comorbidity The occurrence of more than one condition/disorder at the same time. In this publication the comorbidity group refers to people with the co-occurrence of a mental disorder and a physical condition.
CRUfAD cut-offs A set of cut-off scores for the K10 developed by the Clinical Research Unit for Anxiety and Depression (CRUfAD), School of Psychiatry, University of New South Wales to determine the prevalence of anxiety or depressive disorders. CRUfAD has found that 78% of the population have a low level of psychological distress and are unlikely to need professional assistance. A further 20% have a medium level and are encouraged to use self-help information and techniques provided through CRUfAD. The 2% of the population with a high level are strongly encouraged to see a doctor. ‘Medium’ is defined as having a K10 score of 16–29; ‘high’ is 30–50.
Days out of role A proxy for how well a person is functioning, that is the extent to which health problems interfere with their life and activities during the 30 days prior to the survey. People were asked to nominate how many days they were totally unable to work or carry out their normal activities because of their health, and the number of days they had to cut down on what was done or did not get as much done as usual because of their health. The number of days out of role was derived as the number of days totally unable to function plus half the number of days of reduced functioning.
Delighted-terrible scale This scale is used in assessing quality of life and uses the following categories: delighted, pleased, mostly satisfied, mixed, mostly dissatisfied, unhappy, terrible.
Employed People aged 15 and over who had a job or business, or who undertook work without pay in a family business for a minimum of one hour per week. Includes persons who were absent from a job or business.
Kessler Psychological Distress Scale (K10) This is a 10-item questionnaire intended to yield a global measure of psychological distress based on questions about anxiety and depressive symptoms that a person has experienced in the most recent 4 week period. See also CRUfAD cut-offs. Labour force status People aged 15 and over who were ‘employed’, ‘unemployed’ or ‘not in the labour force’ as defined.

34 Comorbidity of mental disorders and physical conditions
Level of exercise Based on frequency, intensity (that is walking, moderate exercise or vigorous exercise) and duration of exercise (for recreation, sport or fitness) in the week prior to interview. From these components, an exercise category was determined using factors to represent the intensity of the exercise. Categories were grouped according to the following levels of exercise: ‘very low’—less than 100 minutes (including no exercise); ‘low’—100 minutes to less than 1,600 minutes; ‘moderate’—1,600–3,200 minutes, or more than 3,200 minutes but including less than 2 hours of vigorous exercise; ‘high’—more than 3,200 minutes including 2 hours or more of vigorous exercise.
Major urban See ‘Section of state’.
Mental disorder According to the ICD-10 Classification of Mental and Behavioural Disorders, a disorder implies ‘the existence of a clinically recognisable set of symptoms or behaviour associated in most cases with distress and with interference with personal functions’ (WHO 1992, p5). Most diagnoses require criteria relating to severity and duration to be met.
Non urban See ‘Section of state’.
Not in the labour force People who were not in the categories ‘employed’ or ‘unemployed’ as defined.
Other urban See ‘Section of state’.
Physical activity Any bodily movement produced by the muscles that results in energy expenditure. Often the health risk factor is expressed as physical inactivity, and a common proxy for this is the amount of sedentary time in a day (time spent sitting, etc.).
Physical condition A medical condition, illness, injury or disability including: asthma; cancer; stroke (or the effects of a stroke); gout, rheumatism or arthritis; diabetes or high blood sugar levels; and any other heart or circulatory condition. Information was also collected about the presence of the following physical conditions only if they had lasted for six months or more: hay fever; sinusitis or sinus allergy; emphysema; bronchitis; anaemia; epilepsy; fluid problems/fluid retention/oedema (excluding those due to heart or circulatory problems); hernias; thyroid trouble/goitre; tuberculosis; back or neck pain or back or neck problems. The presence of any other physical conditions was not determined.
Section of state This geographical classification uses population counts to define Census collection districts (CDs) as urban or rural. Major urban has a population of more than 100,000, other urban a population of 1,000–99,999, and bounded locality 200–999. Bounded locality, rural balance (remainder of the state/territory) and migratory areas have been combined and termed non urban in this report.
Smoker status The extent to which a person was smoking at the time of the interview, and refers to the regular smoking of tobacco, including manufacture (packet) cigarettes, roll-your-own cigarettes, cigars and pipes, but excludes chewing tobacco and smoking of non-tobacco products. In this report, current smokers, those who smoke daily or at least weekly, are defined as smokers.
Socioeconomic status The Index of Relative Socio-Economic Disadvantage (IRSD) is one of four Socio-Economic Indexes for Areas (SEIFAs) compiled by the ABS after each Census of Population and Housing, and the index used in this publication. The SEIFAs aim at representing the socioeconomic status of Australian communities and identifying areas of advantage and disadvantage. The IRSD scores each area by summarising attributes of the

Comorbidity of mental disorders and physical conditions 35
population such as low income, low educational attainment, high unemployment, and jobs in relatively unskilled occupations.
Unemployed People aged 15 and over who were not employed during the reference week, and had actively looked for full-time or part-time work at any time in the four weeks up to the end of the reference week and were available for work in the reference week; or were waiting to start a new job within four weeks from the end of the reference week and could have started in the reference week if the job had been available then.

36 Comorbidity of mental disorders and physical conditions
References ABS (Australian Bureau of Statistics) 2008. National Survey of Mental Health and Wellbeing: Summary of Results, Australia, 2007. ABS cat. no. 4326.0
AIHW (Australian Institute of Health and Welfare) 2010a. When musculoskeletal conditions and mental disorders occur together. Bulletin no. 80. Cat. no. AUS 129. Canberra: AIHW.
AIHW 2010b. Australia’s health 2010. Australia’s health series no. 12. Cat. no. AUS 122. Canberra: AIHW.
AIHW 2011. The use of health services among Australians with disability. Bulletin no. 91. Cat. no. AUS 140. Canberra: AIHW
Andrews G, Slade T & Issakidis C 2002. Deconstructing current comorbidity: data from the Australian National Survey of Mental Health and Well-Being. British Journal of Psychiatry 181:306–14.
Clarke MC & Currie KC 2009. Depression, anxiety and their relationship with chronic diseases: a review of the epidemiology, risk and treatment evidence. Medical Journal of Australia 190(7):S54–S60.
WHO (World Health Organization) 1992. The ICD-10 Classification of Mental and Behavioural Disorders. Clinical descriptions and diagnostic guidelines. Geneva: WHO.
Wilhelm K, Mitchell p, Slade T, et al. 2003. Prevalence and correlates of DSM-IV major depression in an Australian survey. Journal of Affective Disorders 75:155–62.
Wulsin LR, Vaillant GE & Wells VE 1999. A systemic review of the mortality of depression. Psychosomatic Medicine 61:6–17.

Comorbidity of mental disorders and physical conditions
2007
Comorbidity of m
ental disorders and physical conditions 2007A
IHW
This report investigates the prevalence of mental illness in association with common chronic diseases and shows that in 2007: 12% of Australians aged 16-85 had a mental disorder and a physical condition at the same time; the most common comorbidity was anxiety disorder combined with a physical condition, affecting around 1.4 million (9%) Australian adults; people living in the most disadvantaged areas of Australia were 65% more likely to have comorbidity than those living in the least disadvantaged areas.