company guide padini holdings 3 company guide padini holdings critical data points to watch earnings...
TRANSCRIPT

Refer to important disclosures at the end of this report ed: BC / sa: BC
HOLDHOLDHOLDHOLD (Downgrade from Buy)
Last Traded PriceLast Traded PriceLast Traded PriceLast Traded Price (((( 25 Nov 201625 Nov 201625 Nov 201625 Nov 2016)))): : : : RM2.82 (JCIJCIJCIJCI : : : : 5,122.10) Price Target Price Target Price Target Price Target 12121212----mthmthmthmth:::: RM2.95 (4% upside) (Prev RM2.95) Shariah Compliant:Shariah Compliant:Shariah Compliant:Shariah Compliant: Yes
Potential Catalyst: Potential Catalyst: Potential Catalyst: Potential Catalyst: Stronger than exepected SSSG
Where we differWhere we differWhere we differWhere we differ:::: In line with consensus Analyst King Yoong CHEAH +60 32604 3908 [email protected]
What’s New • 1QFY17 earnings below expectations, dragged by
sharp decline in margins
• Margins could continue to be under pressure due
to weak Ringgit
• Downgrade to HOLD with RM2.95 TP
Price Relative
Forecasts and Valuation FY FY FY FY JunJunJunJun ((((RMRMRMRM m) m) m) m) 2015201520152015AAAA 2016201620162016FFFF 2017201720172017FFFF 2018201820182018FFFF
Revenue 978 1,301 1,412 1,476 EBITDA 142 221 240 236 Pre-tax Profit 112 187 211 211 Net Profit 80.2 137 156 156 Net Pft (Pre Ex.) 80.2 137 156 156 Net Pft Gth (Pre-ex) (%) (11.8) 71.4 13.4 0.3 EPS (sen) 12.2 20.9 23.7 23.8 EPS Pre Ex. (sen) 12.2 20.9 23.7 23.8 EPS Gth Pre Ex (%) (12) 71 13 0 Diluted EPS (sen) 12.2 20.9 23.7 23.8 Net DPS (sen) 10.0 11.5 10.0 10.0 BV Per Share (sen) 61.6 68.4 82.1 95.8 PE (X) 23.1 13.5 11.9 11.9 PE Pre Ex. (X) 23.1 13.5 11.9 11.9 P/Cash Flow (X) 9.7 21.0 11.6 10.7 EV/EBITDA (X) 11.6 7.6 6.7 6.4 Net Div Yield (%) 3.5 4.1 3.5 3.5 P/Book Value (X) 4.6 4.1 3.4 2.9 Net Debt/Equity (X) CASH CASH CASH CASH ROAE (%) 20.2 32.1 31.5 26.7 Earnings Rev (%):Earnings Rev (%):Earnings Rev (%):Earnings Rev (%): 0 0 0 Consensus EPS Consensus EPS Consensus EPS Consensus EPS (sensensensen):::: N/A 23.3 25.5 Other Broker Recs:Other Broker Recs:Other Broker Recs:Other Broker Recs: B: 7 S: 0 H: 4
Source of all data on this page: Company, AllianceDBS, Bloomberg Finance L.P
Not everything fits wellNot everything fits wellNot everything fits wellNot everything fits well Getting pricey now. Getting pricey now. Getting pricey now. Getting pricey now. We downgrade our recommendation for Padini Holdings (Padini) to HOLD. We are taking a more cautious stance on the stock as we view that the group’s stellar share price performance and its current valuation have priced in its near term growth prospects. Furthermore, its profit margin may continue to be under pressure due to the weak Ringgit. As such, we view the stock to be fairly valued at this juncture. Not a fashionable quarterNot a fashionable quarterNot a fashionable quarterNot a fashionable quarter. Despite strong topline growth (+15% y-o-y), the group reported unexciting 1QFY17 earnings of RM28m (-10.1% y-o-y), only meeting 19% of our/consensus full year forecasts. The uninspiring results were mainly dragged by lower than expected gross profit margin due to (1) sales promotions, and, (2) more expensive merchandise brought in. We are maintaining our earnings forecasts for now, pending our upcoming meeting with management. GP margin could continue to come under pressure due to GP margin could continue to come under pressure due to GP margin could continue to come under pressure due to GP margin could continue to come under pressure due to weak weak weak weak RinggitRinggitRinggitRinggit.... The group sources about 70% of its products from China, denominated in RMB, and the remainder mainly in USD. As such, the ringgit’s persistent weakness against both currencies could continue to increase its inventory cost and put downward pressure on its margins in the coming quarters.
Valuation:
The stock has performed remarkably well, with its share price
rising >100% since our upgrade in August 2015. In view of its
strong share price performance and downside risk to its
margins, we believe the group’s current valuation has priced in
its near term growth prospects. We downgrade our
recommendation to HOLD with an unchanged RM2.95 TP
pegged to 12x forward PE.
Key Risks to Our View:
Weaker-than-expected consumer spending and increasingly
competitive industry landscape.
At A Glance Issued Capital (m shrs) 658
Mkt. Cap (RMm/US$m) 1,855 / 416
Major Shareholders (%)
Yong Pang Chaun Holdings Sdn Bhd 43.7
Skim Amanah Saham Bumiputera 5.0
iCapital.biz 3.5
Free Float (%) 50.1
3m Avg. Daily Val (US$m) 0.42
ICB IndustryICB IndustryICB IndustryICB Industry : Consumer Goods / Personal Goods
Malaysia Equity ResearchMalaysia Equity ResearchMalaysia Equity ResearchMalaysia Equity Research 28 Nov 2016
Company Guide
Padini Holdings Version 7 | Bloomberg: PAD MK | Reuters: PDNI.KL Refer to important disclosures at the end of this report
Page 2
Company Guide
Padini Holdings
WHAT’S NEW
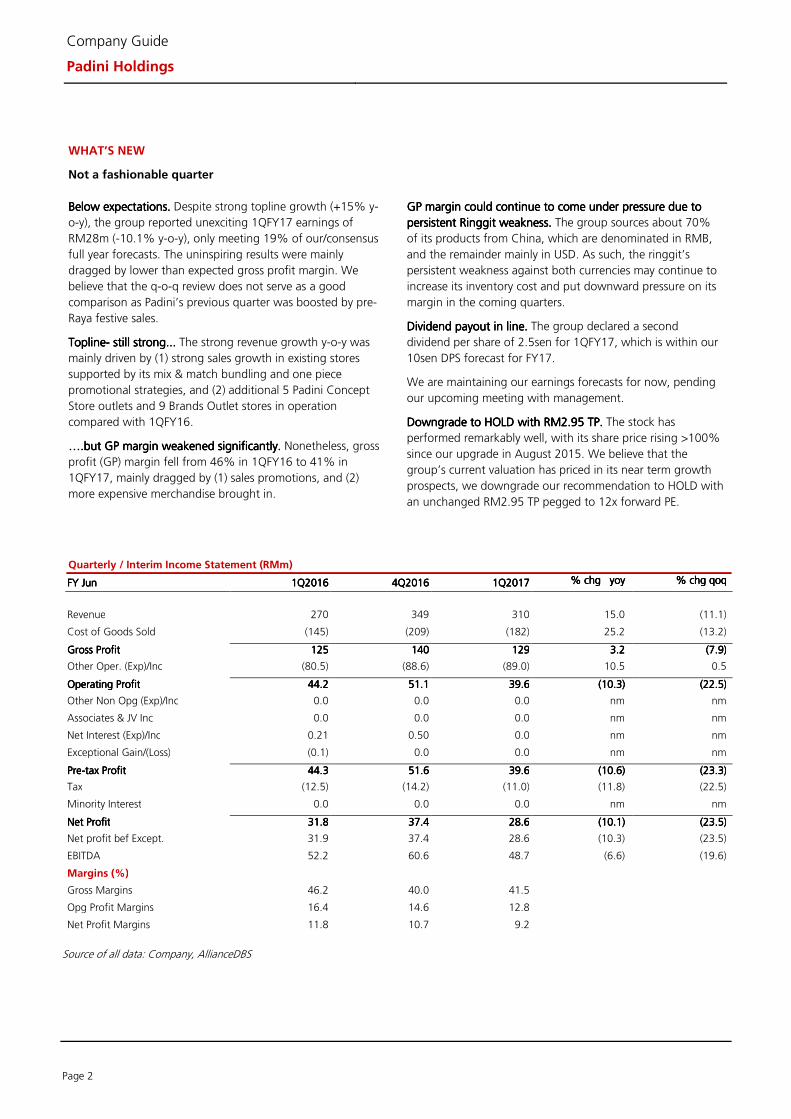
Not a fashionable quarter
Below expectationBelow expectationBelow expectationBelow expectationssss.... Despite strong topline growth (+15% y-
o-y), the group reported unexciting 1QFY17 earnings of
RM28m (-10.1% y-o-y), only meeting 19% of our/consensus
full year forecasts. The uninspiring results were mainly
dragged by lower than expected gross profit margin. We
believe that the q-o-q review does not serve as a good
comparison as Padini’s previous quarter was boosted by pre-
Raya festive sales.
ToplineToplineToplineTopline---- still still still still strong..strong..strong..strong...... The strong revenue growth y-o-y was
mainly driven by (1) strong sales growth in existing stores
supported by its mix & match bundling and one piece
promotional strategies, and (2) additional 5 Padini Concept
Store outlets and 9 Brands Outlet stores in operation
compared with 1QFY16.
….but G….but G….but G….but GP margin weakened significantly.P margin weakened significantly.P margin weakened significantly.P margin weakened significantly. Nonetheless, gross
profit (GP) margin fell from 46% in 1QFY16 to 41% in
1QFY17, mainly dragged by (1) sales promotions, and (2)
more expensive merchandise brought in.
GP margin could continue to come under pressure due to GP margin could continue to come under pressure due to GP margin could continue to come under pressure due to GP margin could continue to come under pressure due to
persistent Ringgit weakness. persistent Ringgit weakness. persistent Ringgit weakness. persistent Ringgit weakness. The group sources about 70%
of its products from China, which are denominated in RMB,
and the remainder mainly in USD. As such, the ringgit’s
persistent weakness against both currencies may continue to
increase its inventory cost and put downward pressure on its
margin in the coming quarters.
Dividend payout inDividend payout inDividend payout inDividend payout in lllline.ine.ine.ine. The group declared a second
dividend per share of 2.5sen for 1QFY17, which is within our
10sen DPS forecast for FY17.
We are maintaining our earnings forecasts for now, pending
our upcoming meeting with management.
Downgrade to HOLD with RM2.95 TP.Downgrade to HOLD with RM2.95 TP.Downgrade to HOLD with RM2.95 TP.Downgrade to HOLD with RM2.95 TP. The stock has
performed remarkably well, with its share price rising >100%
since our upgrade in August 2015. We believe that the
group’s current valuation has priced in its near term growth
prospects, we downgrade our recommendation to HOLD with
an unchanged RM2.95 TP pegged to 12x forward PE.
Quarterly / Interim Income Statement (RMm)
FY FY FY FY JunJunJunJun 1Q1Q1Q1Q2016201620162016 4Q4Q4Q4Q2016201620162016 1Q1Q1Q1Q2017201720172017 % chg yoy % chg yoy % chg yoy % chg yoy % chg qoq% chg qoq% chg qoq% chg qoq
Revenue 270 349 310 15.0 (11.1)
Cost of Goods Sold (145) (209) (182) 25.2 (13.2)
Gross ProfitGross ProfitGross ProfitGross Profit 125125125125 140140140140 129129129129 3.23.23.23.2 (7.9)(7.9)(7.9)(7.9)
Other Oper. (Exp)/Inc (80.5) (88.6) (89.0) 10.5 0.5
Operating ProfitOperating ProfitOperating ProfitOperating Profit 44.244.244.244.2 51.151.151.151.1 39.639.639.639.6 (10.3)(10.3)(10.3)(10.3) (22.5)(22.5)(22.5)(22.5)
Other Non Opg (Exp)/Inc 0.0 0.0 0.0 nm nm
Associates & JV Inc 0.0 0.0 0.0 nm nm
Net Interest (Exp)/Inc 0.21 0.50 0.0 nm nm
Exceptional Gain/(Loss) (0.1) 0.0 0.0 nm nm
PrePrePrePre----tax Profittax Profittax Profittax Profit 44.344.344.344.3 51.651.651.651.6 39.639.639.639.6 (10.6)(10.6)(10.6)(10.6) (23.3)(23.3)(23.3)(23.3)
Tax (12.5) (14.2) (11.0) (11.8) (22.5)
Minority Interest 0.0 0.0 0.0 nm nm
Net ProfitNet ProfitNet ProfitNet Profit 31.831.831.831.8 37.437.437.437.4 28.628.628.628.6 (10.1)(10.1)(10.1)(10.1) (23.5)(23.5)(23.5)(23.5)
Net profit bef Except. 31.9 37.4 28.6 (10.3) (23.5)
EBITDA 52.2 60.6 48.7 (6.6) (19.6)
Margins (%)
Gross Margins 46.2 40.0 41.5
Opg Profit Margins 16.4 14.6 12.8
Net Profit Margins 11.8 10.7 9.2
Source of all data: Company, AllianceDBS

Page 3
Company Guide
Padini Holdings
CRITICAL DATA POINTS TO WATCH
Earnings Drivers:
SSSG and number of new outlets are key revenue drivers. SSSG and number of new outlets are key revenue drivers. SSSG and number of new outlets are key revenue drivers. SSSG and number of new outlets are key revenue drivers. Like
other fashion retailers, same store sales growth (SSSG) and the
number of outlets opened by the group in the financial year is a
key revenue driver for the group. After a strong performance in
FY16, we estimate SSSG for FY17 to be about 1%, dragged by
waning popularity of its popular mix-and-match bundling
strategy for Padini Concept Stores (PCS). We believe that the
group’s topline will continue to be sustained by full
contributions from 13 stores opened in FY16 and the opening
of another 15 stores slated for FY17.
Brand Outlet could benefit from downtrading. Brand Outlet could benefit from downtrading. Brand Outlet could benefit from downtrading. Brand Outlet could benefit from downtrading. We observe that
consumers are increasingly looking for value in the competitive
apparel market. This bodes well for the group’s rising star,
Brands Outlet’s expansion over the next 2-3 years.
Huge untapped market in suburban cities.Huge untapped market in suburban cities.Huge untapped market in suburban cities.Huge untapped market in suburban cities. The group will focus
on the Brands Outlet (BO) chain over the next three years, to
improve business scale, distribution network, and operating
leverage, to strengthen its presence in the local apparel market.
Management sees business opportunities in the huge
underserved markets in Malaysia’s suburban cities, and tapping
these markets should keep it busy over the next few years. Once
BO hits saturation point, management will review its growth
strategy, including expanding its product lines and overseas
business.
Margin compression remains a key concern. Margin compression remains a key concern. Margin compression remains a key concern. Margin compression remains a key concern. We are concerned
that the popularity of its mix-and-match bundling strategy
implemented in PCS will eventually taper off, which could drag
down its SSSG, given the slower-than-expected recovery in
domestic consumer spending. Furthermore, the group sources
about 65-70% of its products from China, which are
denominated in RMB, and the remainder mainly in USD. Given
the ringgit's depreciation against both currencies, we expect the
group’s margins to continue to come under pressure.
Total retail floor space (k sq ft)
Revenue growth (%)
SSS growth (%)
Revenue growth from exports, consignment & others (%)
Revenue growth from new floor spaces (%)
Source: Company, AllianceDBS

Page 4
Company Guide
Padini Holdings
Balance Sheet:
Strong balance sheet Strong balance sheet Strong balance sheet Strong balance sheet –––– net cash position.net cash position.net cash position.net cash position. The group is in a net
cash position, which allows the group to (1) sustain its dividend
policy of at least 10 sen per share, and, (2) undertake outlet
expansion without stretching its balance sheet.
Share Price Drivers:
Stable margins Stable margins Stable margins Stable margins –––– key share prickey share prickey share prickey share price driver. e driver. e driver. e driver. Margins have been
dragged by (1) aggressive sales campaigns to drive sales and
maintain market leadership, (2) the group’s plans to absorb the
6% GST in the near term, and (3) more expensive imported
merchandise due to the weaker ringgit.
SustaSustaSustaSustaining high dividend payout.ining high dividend payout.ining high dividend payout.ining high dividend payout. Management is committed to
pay out a minimum DPS of 10 sen over the next few years, even
if earnings prospects remain sluggish, thanks to its (1) strong
cash-generating capability, and (2) net cash position.
Key Risks:
CompetCompetCompetCompetitive sectoritive sectoritive sectoritive sector. Padini continues to face strong
competition from a large pool of retail brands in Malaysia.
Prolonged slump in consumer sentiment.Prolonged slump in consumer sentiment.Prolonged slump in consumer sentiment.Prolonged slump in consumer sentiment. Although the group
has so far benefited from downtrading, a prolonged slump in
consumer sentiment could dampen discretionary spending.
Company Background
Padini is a 43-year-old Malaysia-based fashion retailer offering
clothing, accessories and shoes under the brands of Padini,
Vincci, Seed, Miki, Padini Authentic, P&Co, PDI etc.
Leverage & Asset Turnover (x)
Capital Expenditure
ROE (%)
Forward PE Band (x)
PB Band (x)
Source: Company, AllianceDBS

Page 5
Company Guide
Padini Holdings
Key Assumptions
FY FY FY FY JunJunJunJun 2014201420142014AAAA 2015201520152015AAAA 2016201620162016FFFF 2017201720172017FFFF 2018201820182018FFFF
Total retail floor space (k sq ft) 848 965 1,133 1,233 1,313
Revenue growth (%) 9.69 12.9 33.0 8.51 4.47
SSS growth (%) 4.85 2.21 9.60 0.89 0.50 Revenue growth from exports, consignment & others (%)
(2.2) 0.34 1.34 (1.1) 0.26 Revenue growth from new floor spaces (%)
7.06 10.3 13.9 9.34 6.95 Income Statement (RMm)
FY FY FY FY JunJunJunJun 2014201420142014AAAA 2015201520152015AAAA 2016201620162016FFFF 2017201720172017FFFF 2018201820182018FFFF Revenue 866 978 1,301 1,412 1,476
Cost of Goods Sold (466) (556) (759) (819) (857)
Gross ProfitGross ProfitGross ProfitGross Profit 400400400400 422422422422 543543543543 593593593593 620620620620 Other Opng (Exp)/Inc (276) (311) (356) (384) (413)
Operating ProfitOperating ProfitOperating ProfitOperating Profit 124124124124 111111111111 187187187187 208208208208 207207207207
Other Non Opg (Exp)/Inc 0.0 0.0 0.0 0.0 0.0
Associates & JV Inc 0.0 0.0 0.0 0.0 0.0
Net Interest (Exp)/Inc 1.78 0.40 0.21 2.48 4.66
Exceptional Gain/(Loss) 0.0 0.0 (0.1) 0.0 0.0
PrePrePrePre----tax Profittax Profittax Profittax Profit 126126126126 112112112112 187187187187 211211211211 211211211211 Tax (34.8) (31.6) (49.3) (54.8) (54.9)
Minority Interest 0.0 0.0 0.0 0.0 0.0
Preference Dividend 0.0 0.0 0.0 0.0 0.0
Net ProfitNet ProfitNet ProfitNet Profit 90.990.990.990.9 80.280.280.280.2 137137137137 156156156156 156156156156 Net Profit before Except. 90.9 80.2 137 156 156
EBITDA 148 142 221 240 236
Growth
Revenue Gth (%) 9.7 12.9 33.1 8.5 4.6
EBITDA Gth (%) 6.0 (3.7) 55.9 8.2 (1.4)
Opg Profit Gth (%) 5.8 (10.1) 67.4 11.6 (0.8)
Net Profit Gth (Pre-ex) (%) 6.1 (11.8) 71.4 13.4 0.3
Margins & Ratio
Gross Margins (%) 46.2 43.2 41.7 42.0 42.0
Opg Profit Margin (%) 14.3 11.4 14.3 14.7 14.0
Net Profit Margin (%) 10.5 8.2 10.6 11.0 10.6
ROAE (%) 23.5 20.2 32.1 31.5 26.7
ROA (%) 16.0 13.7 21.8 21.8 19.0
ROCE (%) 20.0 17.8 29.3 29.0 24.6
Div Payout Ratio (%) 83.2 82.0 55.1 42.2 42.1
Net Interest Cover (x) NM NM NM NM NM
Source: Company, AllianceDBS
Page 6
Company Guide
Padini Holdings
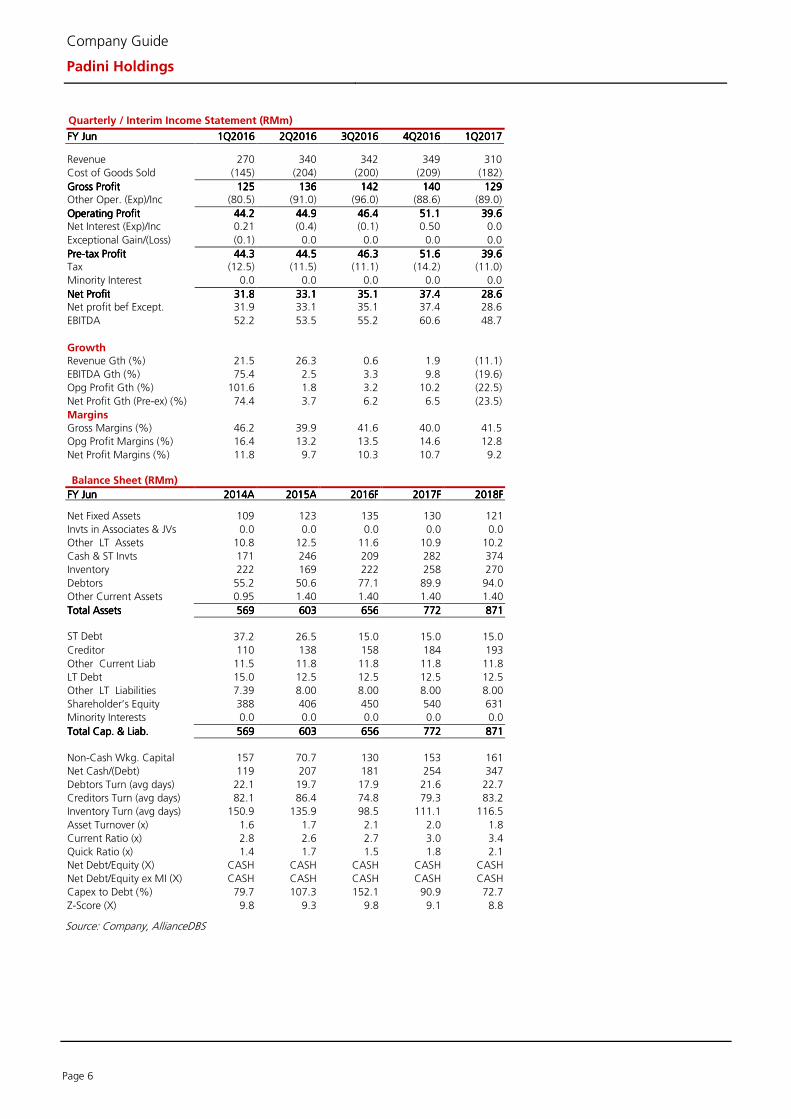
Quarterly / Interim Income Statement (RMm)
FY FY FY FY JunJunJunJun 1Q1Q1Q1Q2016201620162016 2Q2Q2Q2Q2016201620162016 3Q3Q3Q3Q2016201620162016 4Q4Q4Q4Q2016201620162016 1Q1Q1Q1Q2017201720172017 Revenue 270 340 342 349 310
Cost of Goods Sold (145) (204) (200) (209) (182)
Gross ProfitGross ProfitGross ProfitGross Profit 125125125125 136136136136 142142142142 140140140140 129129129129 Other Oper. (Exp)/Inc (80.5) (91.0) (96.0) (88.6) (89.0)
Operating ProfitOperating ProfitOperating ProfitOperating Profit 44.244.244.244.2 44.944.944.944.9 46.446.446.446.4 51.151.151.151.1 39.639.639.639.6 Net Interest (Exp)/Inc 0.21 (0.4) (0.1) 0.50 0.0
Exceptional Gain/(Loss) (0.1) 0.0 0.0 0.0 0.0
PrePrePrePre----tax Profittax Profittax Profittax Profit 44.344.344.344.3 44.544.544.544.5 46.346.346.346.3 51.651.651.651.6 39.639.639.639.6 Tax (12.5) (11.5) (11.1) (14.2) (11.0)
Minority Interest 0.0 0.0 0.0 0.0 0.0
Net ProfitNet ProfitNet ProfitNet Profit 31.831.831.831.8 33.133.133.133.1 35.135.135.135.1 37.437.437.437.4 28.628.628.628.6 Net profit bef Except. 31.9 33.1 35.1 37.4 28.6
EBITDA 52.2 53.5 55.2 60.6 48.7
Growth
Revenue Gth (%) 21.5 26.3 0.6 1.9 (11.1)
EBITDA Gth (%) 75.4 2.5 3.3 9.8 (19.6)
Opg Profit Gth (%) 101.6 1.8 3.2 10.2 (22.5)
Net Profit Gth (Pre-ex) (%) 74.4 3.7 6.2 6.5 (23.5)
Margins
Gross Margins (%) 46.2 39.9 41.6 40.0 41.5
Opg Profit Margins (%) 16.4 13.2 13.5 14.6 12.8
Net Profit Margins (%) 11.8 9.7 10.3 10.7 9.2
Balance Sheet (RMm)
FY FY FY FY JunJunJunJun 2014201420142014AAAA 2015201520152015AAAA 2016201620162016FFFF 2017201720172017FFFF 2018201820182018FFFF Net Fixed Assets 109 123 135 130 121
Invts in Associates & JVs 0.0 0.0 0.0 0.0 0.0
Other LT Assets 10.8 12.5 11.6 10.9 10.2
Cash & ST Invts 171 246 209 282 374
Inventory 222 169 222 258 270
Debtors 55.2 50.6 77.1 89.9 94.0
Other Current Assets 0.95 1.40 1.40 1.40 1.40
Total AssetsTotal AssetsTotal AssetsTotal Assets 569569569569 603603603603 656656656656 772772772772 871871871871
ST Debt
37.2 26.5 15.0 15.0 15.0
Creditor 110 138 158 184 193
Other Current Liab 11.5 11.8 11.8 11.8 11.8
LT Debt 15.0 12.5 12.5 12.5 12.5
Other LT Liabilities 7.39 8.00 8.00 8.00 8.00
Shareholder’s Equity 388 406 450 540 631
Minority Interests 0.0 0.0 0.0 0.0 0.0
Total Cap. & Liab.Total Cap. & Liab.Total Cap. & Liab.Total Cap. & Liab. 569569569569 603603603603 656656656656 772772772772 871871871871
Non-Cash Wkg. Capital 157 70.7 130 153 161
Net Cash/(Debt) 119 207 181 254 347
Debtors Turn (avg days) 22.1 19.7 17.9 21.6 22.7
Creditors Turn (avg days) 82.1 86.4 74.8 79.3 83.2
Inventory Turn (avg days) 150.9 135.9 98.5 111.1 116.5
Asset Turnover (x) 1.6 1.7 2.1 2.0 1.8
Current Ratio (x) 2.8 2.6 2.7 3.0 3.4
Quick Ratio (x) 1.4 1.7 1.5 1.8 2.1
Net Debt/Equity (X) CASH CASH CASH CASH CASH
Net Debt/Equity ex MI (X) CASH CASH CASH CASH CASH
Capex to Debt (%) 79.7 107.3 152.1 90.9 72.7
Z-Score (X) 9.8 9.3 9.8 9.1 8.8
Source: Company, AllianceDBS

Page 7
Company Guide
Padini Holdings
Cash Flow Statement (RMm)
FY FY FY FY JunJunJunJun 2014201420142014AAAA 2015201520152015AAAA 2016201620162016FFFF 2017201720172017FFFF 2018201820182018FFFF Pre-Tax Profit 126 112 162 211 211
Dep. & Amort. 23.6 30.6 30.7 31.3 29.5
Tax Paid (35.6) (33.4) (42.2) (54.8) (54.9)
Assoc. & JV Inc/(loss) 0.0 0.0 0.0 0.0 0.0
Chg in Wkg.Cap. (66.7) 75.1 (59.3) (23.3) (7.5)
Other Operating CF 4.96 7.71 (3.1) (3.6) (5.8)
Net Operating CFNet Operating CFNet Operating CFNet Operating CF 52.052.052.052.0 192192192192 88.388.388.388.3 160160160160 173173173173 Capital Exp.(net) (41.6) (41.8) (41.8) (25.0) (20.0)
Other Invts.(net) 0.0 0.0 0.0 0.0 0.0
Invts in Assoc. & JV 0.0 0.0 0.0 0.0 0.0
Div from Assoc & JV 0.0 0.0 0.0 0.0 0.0
Other Investing CF (57.3) (31.8) 3.11 3.58 5.76
Net Investing CFNet Investing CFNet Investing CFNet Investing CF (98.9)(98.9)(98.9)(98.9) (73.6)(73.6)(73.6)(73.6) (38.7)(38.7)(38.7)(38.7) (21.4)(21.4)(21.4)(21.4) (14.2)(14.2)(14.2)(14.2) Div Paid (75.7) (65.8) (75.7) (65.8) (65.8)
Chg in Gross Debt 13.7 (16.0) (11.5) 0.0 0.0
Capital Issues 0.0 0.0 0.0 0.0 0.0
Other Financing CF 0.0 0.0 0.0 0.0 0.0
Net Financing CFNet Financing CFNet Financing CFNet Financing CF (62.0)(62.0)(62.0)(62.0) (81.8)(81.8)(81.8)(81.8) (87.2)(87.2)(87.2)(87.2) (65.8)(65.8)(65.8)(65.8) (65.8)(65.8)(65.8)(65.8)
Currency Adjustments 0.0 0.0 0.0 0.0 0.0
Chg in Cash (109) 36.5 (37.6) 73.2 92.6
Opg CFPS (sen) 18.0 17.7 22.4 27.9 27.4
Free CFPS (sen) 1.57 22.8 7.07 20.6 23.2
Source: Company, AllianceDBS
Target Price & Ratings History
Source: AllianceDBS
Analyst: King Yoong CHEAH

Page 8
Company Guide
Padini Holdings
DISCLOSURE
Stock rating definitions STRONG BUY - > 20% total return over the next 3 months, with identifiable share price catalysts within this time frame BUY - > 15% total return over the next 12 months for small caps, >10% for large caps HOLD - -10% to +15% total return over the next 12 months for small caps, -10% to +10% for large caps FULLY VALUED - negative total return > -10% over the next 12 months SELL - negative total return of > -20% over the next 3 months, with identifiable catalysts within this time frame Commonly used abbreviations Adex = advertising expenditure EPS = earnings per share PBT = profit before tax bn = billion EV = enterprise value P/B = price / book ratio BV = book value FCF = free cash flow P/E = price / earnings ratio CF = cash flow FV = fair value PEG = P/E ratio to growth ratio CAGR = compounded annual growth rate FY = financial year q-o-q = quarter-on-quarter Capex = capital expenditure m = million RM = Ringgit CY = calendar year M-o-m = month-on-month ROA = return on assets Div yld = dividend yield NAV = net assets value ROE = return on equity DCF = discounted cash flow NM = not meaningful TP = target price DDM = dividend discount model NTA = net tangible assets trn = trillion DPS = dividend per share NR = not rated WACC = weighted average cost of capital EBIT = earnings before interest & tax p.a. = per annum y-o-y = year-on-year EBITDA = EBIT before depreciation and amortisation PAT = profit after tax YTD = year-to-date
Page 9
Company Guide
Padini Holdings
DISCLAIMER
This report has been prepared for information purposes only by AllianceDBS Research Sdn Bhd (“ADBSR”), a subsidiary of Alliance Investment Bank Berhad (“AIBB”) and an associate of DBS Vickers Securities Holdings Pte Ltd (“DBSVH”). DBSVH is a wholly-owned subsidiary of DBS Bank Ltd. This report is strictly confidential and is meant for circulation to clients of ADBSR, AIBB and DBSVH only or such persons as may be deemed eligible to receive such research report, information or opinion contained herein. Receipt and review of this report indicate your agreement not to distribute, reproduce or disclose in any other form or medium (whether electronic or otherwise) the contents, views, information or opinions contained herein without the prior written consent of ADBSR. This report is based on data and information obtained from various sources believed to be reliable at the time of issuance of this report and any opinion expressed herein is subject to change without prior notice and may differ or be contrary to opinions expressed by ADBSR’s affiliates and/or related parties. ADBSR does not make any guarantee, representation or warranty (whether express or implied) as to the accuracy, completeness, reliability or fairness of the data and information obtained from such sources as may be contained in this report. As such, neither ADBSR nor its affiliates and/or related parties shall be held liable or responsible in any manner whatsoever arising out of or in connection with the reliance and usage of such data and information or third party references as may be made in this report (including, but not limited to any direct, indirect or consequential losses, loss of profits and damages). The views expressed in this report reflect the personal views of the analyst(s) about the subject securities or issuers and no part of the compensation of the analyst(s) was, is, or will be directly or indirectly related to the inclusion of specific recommendation(s) or view(s) in this report. ADBSR prohibits the analyst(s) who prepared this report from receiving any compensation, incentive or bonus based on specific investment banking transactions or providing a specific recommendation for, or view of, a particular company. This research report provides general information only and is not to be construed as an offer to sell or a solicitation to buy or sell any securities or other investments or any options, futures, derivatives or other instruments related to such securities or investments. In particular, it is highlighted that this report is not intended for nor does it have regard to the specific investment objectives, financial situation and particular needs of any specific person who may receive this report. Investors are therefore advised to make their own independent evaluation of the information contained in this report, consider their own individual investment objectives, financial situations and particular needs and consult their own professional advisers (including but not limited to financial, legal and tax advisers) regarding the appropriateness of investing in any securities or investments that may be featured in this report. ADBSR, AIBB, DBSVH and DBS Bank Ltd, their directors, representatives and employees or any of their affiliates or their related parties may, from time to time, have an interest in the securities mentioned in this report. AIBB, DBSVH and DBS Bank Ltd, their affiliates and/or their related persons may do and/or seek to do business with the company(ies) covered in this report and may from time to time act as market maker or have assumed an underwriting commitment in securities of such company(ies), may sell or buy such securities from customers on a principal basis and may also perform or seek to perform significant investment banking, advisory or underwriting services for or relating to such company(ies) as well as solicit such investment, advisory or other services from any entity mentioned in this report. AIBB, DBSVH, DBS Bank Ltd (which carries on, inter alia, corporate finance activities) and their activities are separate from ADBSR. AIBB, DBSVH and DBS Bank Ltd may have no input into company-specific coverage decisions (i.e. whether or not to initiate or terminate coverage of a particular company or securities in reports produced by ADBSR) and ADBSR does not take into account investment banking revenues or potential revenues when making company-specific coverage decisions. ADBSR, AIBB, DBSVH, DBS Bank Ltd and/or other affiliates of DBS Vickers Securities (USA) Inc (“DBSVUSA”), a U.S.-registered broker-dealer, may beneficially own a total of 1% or more of any class of common equity securities of the subject company mentioned in this report. ADBSR, AIBB, DBSVH, DBS Bank Ltd and/or other affiliates of DBSVUSA may, within the past 12 months, have received compensation and/or within the next 3 months seek to obtain compensation for investment banking services from the subject company. DBSVUSA does not have its own investment banking or research department, nor has it participated in any investment banking transaction as a manager or co-manager in the past twelve months. Any US persons wishing to obtain further information, including any clarification on disclosures in this disclaimer, or to effect a transaction in any security discussed in this report should contact DBSVUSA exclusively. DBS Vickers Securities (UK) Ltd is an authorised person in the meaning of the Financial Services and Markets Act and is regulated by The Financial Services Authority. Research distributed in the UK is intended only for institutional clients. In reviewing this report, an investor should be aware that any or all of the foregoing, among other things, may give rise to real or potential conflicts of interest. Additional information is, subject to the overriding issue of confidentiality, available upon request to enable an investor to make their own independent evaluation of the information contained herein.
Wong Ming Tek, Executive Director
Published by
AllianceDBS Research Sdn Bhd AllianceDBS Research Sdn Bhd AllianceDBS Research Sdn Bhd AllianceDBS Research Sdn Bhd (128540 U)
19th Floor, Menara Multi-Purpose, Capital Square, 8 Jalan Munshi Abdullah, 50100 Kuala Lumpur, Malaysia.
Tel.: +603 2604 3333 Fax: +603 2604 3921 email : [email protected]