company insight al in equity september 01, 2014...
TRANSCRIPT

Ambit Capital and / or its affiliates do and seek to do business including investment banking with companies covered in its research reports. As a result, investors should be aware that Ambit Capital may have a conflict of interest that could affect the objectivity of this report. Investors should not consider this report as the only factor in making their investment decision.
Ready for the revival
With the Indian commercial vehicle (CV) market now showing clear signs of being in the early stages of a cyclical revival, Ashok Leyland (AL) is nicely positioned to benefit. Our dealer checks indicate that: (i) There are visible green shoots of recovery in CV sales; and (ii) AL is gaining market share in northern and eastern India. Having remained BUYers of AL over the last two years, we raise our FY16 EPS by 26%, increase our target price from `37 to ` 44 and reiterate BUY.
Competitive position: MODERATE Changes to this position: STABLE Visible green shoots in HCV sales
Our discussions across the CV supply chain indicate that large fleet operators have begun adding new trucks (in most cases through replacement of older trucks) in anticipation of an economic revival from 4QFY15. This is also corroborated by heavy trucks registering an 8% YoY growth in April-July 2014. We continue to expect a recovery in CV volumes and we factor in 18% volume CAGR in medium and heavy commercial vehicles (MHCV) over FY14-16. We expect AL to sustain its market share in MHCV
We expect new entrants to have a minimal impact on AL, due to: (i) AL’s opportunity to gain market share in the non-south markets (our dealer checks indicate that AL is indeed making inroads into northern and eastern India); and (ii) the significant time involved for newer entrants to set up a distribution and service network. We expect AL to register a net market share gain of 100bps over FY15 and FY16 in MHCV goods. Improving profitability and balance sheet health
With moderation in discounts, operating leverage benefits from higher volumes and the management’s cost reduction efforts, we expect margins of 7.1% in FY15 and 9.8% in FY16 (vs 1.7% in FY14). Similarly, we expect improving profitability, moderation in capex/investments, sale of non-core assets and the recent QIP issue of `6.67bn to result in net debt:equity declining to 0.9x as at end-FY15 and further to 0.7x as at end-FY16 (vs 1.4x as at end-FY14). Valuation – reiterate BUY with revised TP of `44
Our core CV business valuation of `37/share (DCF based) implies 9.3x FY16 EBITDA (15% premium to the historical average), and investments (Nissan, John Deere JVs, Hinduja Leyland Finance and IndusInd Bank) at `7/share translate into an SOTP-based TP of `44/share (from `37/share). The upgrade to our FY16 EBITDA estimate (up 13%), roll-forward of DCF, and 100bps increase in our long-term EBITDA margin estimates are the key drivers for the valuation upgrade. Key risks: Profitability of subsidiaries/JVs.
COMPANY INSIGHT AL IN EQUITY September 01, 2014
Ashok LeylandBUY
Auto & Auto Ancillaries
Recommendation Mcap (bn): `104/US$1.7 3M ADV (mn): `772/US$12.8 CMP: `36 TP (12 mths): `44 Upside (%): 21
Flags Accounting: AMBER Predictability: RED Earnings Momentum: AMBER
Catalyst Recovery in MHCV cycle
Reduction in debt levels
Performance
Source: Bloomberg, Ambit Capital research
10152025303540
17,000 19,000 21,000 23,000 25,000 27,000 29,000
Sep-
13
Oct
-13
Dec
-13
Jan-
14
Feb-
14
Apr
-14
Ma
y-1
4
Jul-
14
Au
g-14
Sensex Ashok Leyland (Rs)
Analyst Details Ashvin Shetty, CFA +91 22 3043 3285 [email protected]
Ritu Modi +91 22 3043 3292 [email protected]
Key financials - standalone Year to March (̀ mn) FY12 FY13 FY14 FY15E FY16E
Net Sales 128,420 124,817 99,434 119,837 151,432
EBITDA 12,561 8,770 1,666 8,465 14,827
EBITDA (%) 9.8% 7.0% 1.7% 7.1% 9.8%
EPS (`) 2.12 0.54 (1.79) 0.34 2.19
RoCE (%) 14% 7% -3% 7% 17% RoE (%) 19% 5% -15% 2% 14%
P/E (x) 17.2 67.2 NM NM 16.7
Source: Company, Ambit Capital research

Ashok Leyland
September 01, 2014 Ambit Capital Pvt. Ltd. Page 2
Visible green shoots in HCV sales Commercial vehicles have been the worst-affected automobile category in the downturn… Domestic medium and heavy commercial vehicles (MHCV) were the worst-affected automobile category in the economic downturn over the past two years. Volumes of MHCV goods (trucks) were down nearly 46% in FY14 vs the FY12 levels. In comparison, other automobile categories fared relatively better, with domestic 2Ws recording a CAGR of 6% over FY12-14. Similarly, domestic PVs recorded a negative CAGR of only 2% over FY12-14.
Exhibit 1: Domestic MHCV sales saw a continued decline in FY14
Source: SIAM, Ambit Capital research
Exhibit 2: Volumes of MHCV goods (trucks) were nearly 46% lower in FY14 vs FY12
Source: SIAM, Ambit Capital research
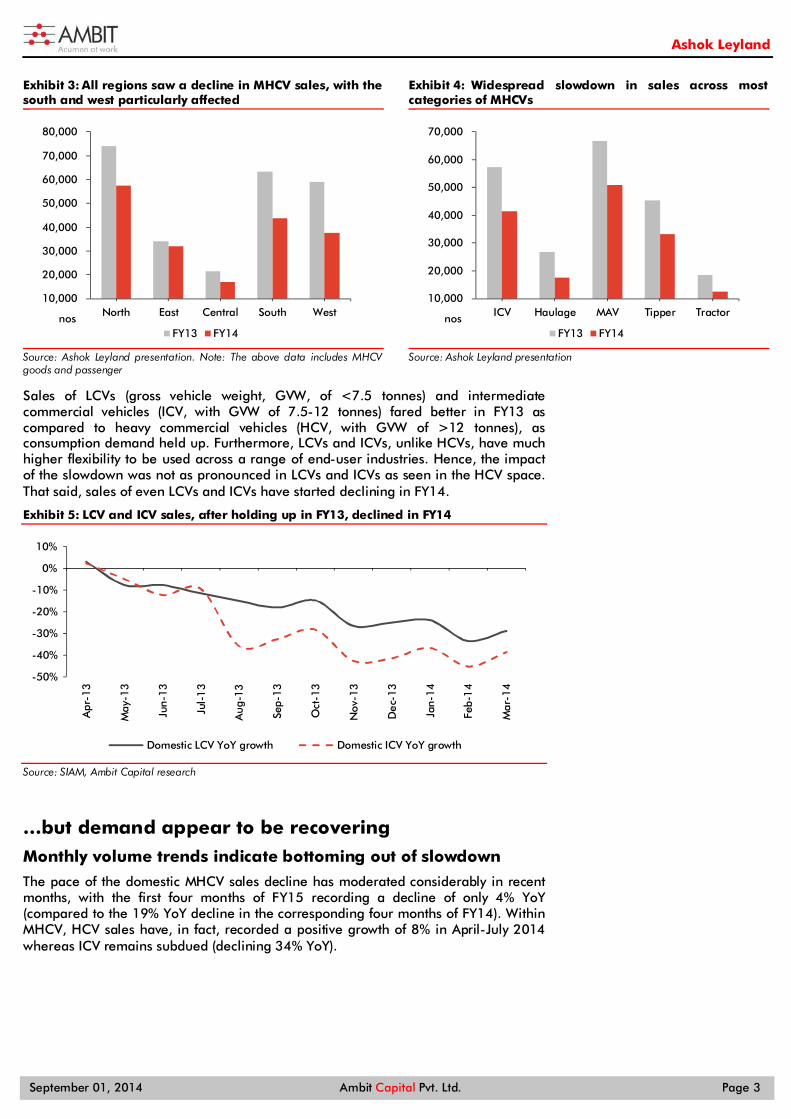
The slowdown has been widespread across all categories of MHCVs. Sales of tippers (accounting for 20% of total domestic trucks) have been particularly affected due to mining issues in Karnataka, Goa and other states and due to lack of infrastructure construction. On the other hand, the sales of tractor trailers and multi-axle vehicles (MAVs), which put together account for 40% of MHCV sales, have been affected by a severe slowdown in key user industries such as automobiles, capital goods and port cargo (imports and exports).
On a geographic basis, MHCV sales have declined across India. South and west India have been the worst affected, with MHCV industry volumes declining 31% and 36% respectively in FY14 in these regions. On the other hand, east India fared relatively better, with its MHCV volumes declining only 6% in FY14.
-48%
-40%
-32%
-24%
-16%
-8%
8,000
10,000
12,000
14,000
16,000
18,000
20,000
Apr
-13
May
-13
Jun-
13
Jul-
13
Aug
-13
Sep-
13
Oct
-13
Nov
-13
Dec
-13
Jan-
14
Feb-
14
Mar
-14
Domestic MHCV goods (nos) YoY growth
-45%
-30%
-15%
0%
15%
30%
45%
FY06
FY07
FY08
FY09
FY10
FY11
FY12
FY13
FY14
MHCV goods (trucks) (YoY) Avg (FY06-12)
Ashok Leyland
September 01, 2014 Ambit Capital Pvt. Ltd. Page 3
Exhibit 3: All regions saw a decline in MHCV sales, with the south and west particularly affected
Source: Ashok Leyland presentation. Note: The above data includes MHCV goods and passenger
Exhibit 4: Widespread slowdown in sales across most categories of MHCVs
Source: Ashok Leyland presentation
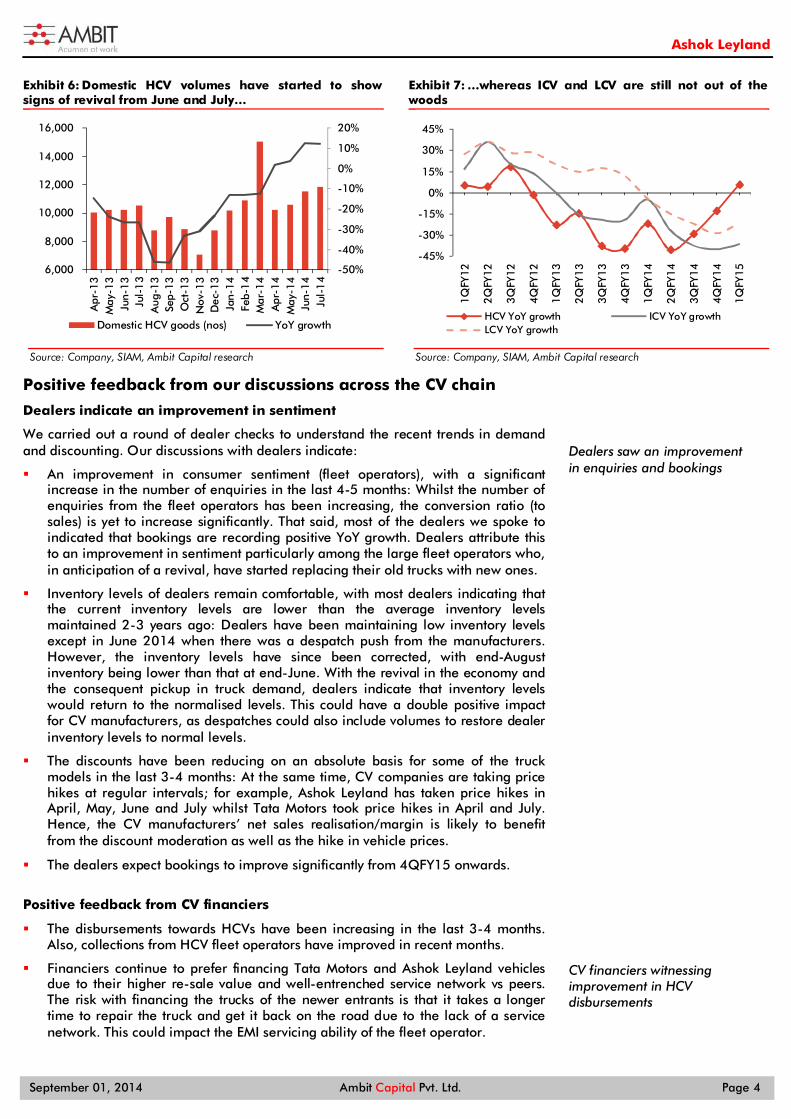
Sales of LCVs (gross vehicle weight, GVW, of <7.5 tonnes) and intermediate commercial vehicles (ICV, with GVW of 7.5-12 tonnes) fared better in FY13 as compared to heavy commercial vehicles (HCV, with GVW of >12 tonnes), as consumption demand held up. Furthermore, LCVs and ICVs, unlike HCVs, have much higher flexibility to be used across a range of end-user industries. Hence, the impact of the slowdown was not as pronounced in LCVs and ICVs as seen in the HCV space. That said, sales of even LCVs and ICVs have started declining in FY14.
Exhibit 5: LCV and ICV sales, after holding up in FY13, declined in FY14
Source: SIAM, Ambit Capital research
…but demand appear to be recovering
Monthly volume trends indicate bottoming out of slowdown
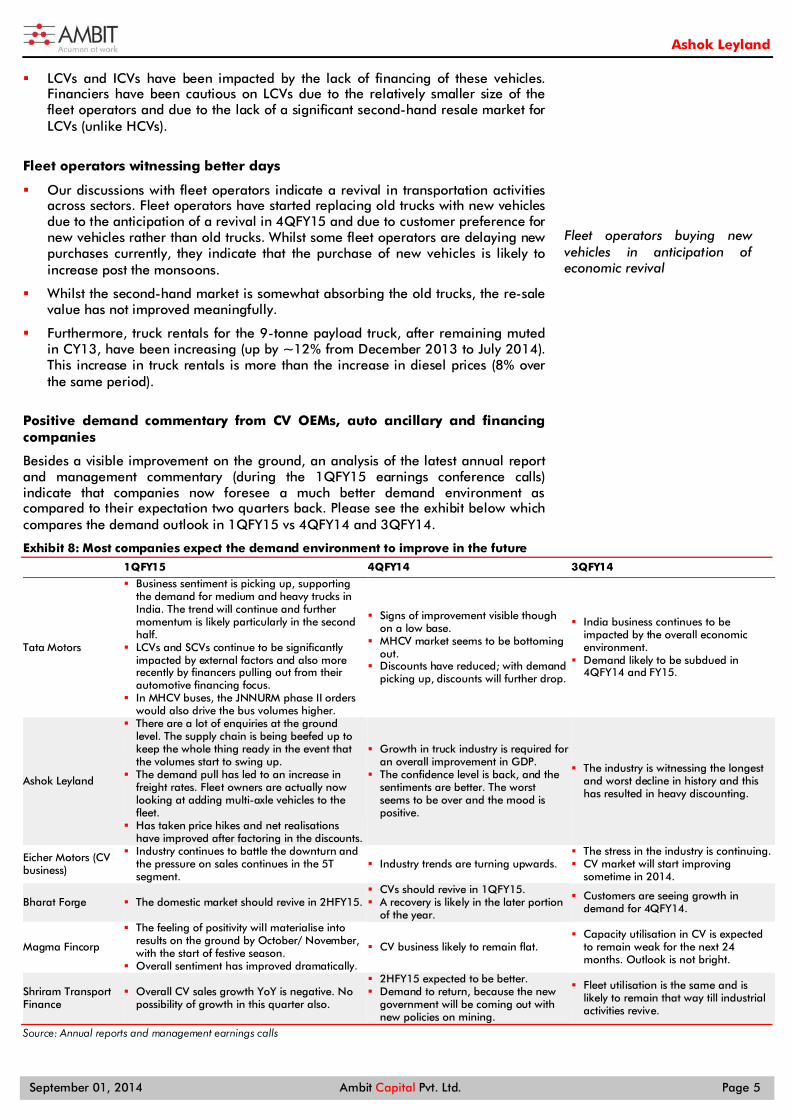
The pace of the domestic MHCV sales decline has moderated considerably in recent months, with the first four months of FY15 recording a decline of only 4% YoY (compared to the 19% YoY decline in the corresponding four months of FY14). Within MHCV, HCV sales have, in fact, recorded a positive growth of 8% in April-July 2014 whereas ICV remains subdued (declining 34% YoY).
10,000
20,000
30,000
40,000
50,000
60,000
70,000
80,000
North East Central South West
FY13 FY14nos
10,000
20,000
30,000
40,000
50,000
60,000
70,000
ICV Haulage MAV Tipper Tractor
FY13 FY14nos
-50%
-40%
-30%
-20%
-10%
0%
10%
Apr
-13
May
-13
Jun-
13
Jul-
13
Aug
-13
Sep-
13
Oct
-13
Nov
-13
Dec
-13
Jan-
14
Feb-
14
Mar
-14
Domestic LCV YoY growth Domestic ICV YoY growth
Ashok Leyland
September 01, 2014 Ambit Capital Pvt. Ltd. Page 4
Exhibit 6: Domestic HCV volumes have started to show signs of revival from June and July…
Source: Company, SIAM, Ambit Capital research
Exhibit 7: …whereas ICV and LCV are still not out of the woods
Source: Company, SIAM, Ambit Capital research
Positive feedback from our discussions across the CV chain
Dealers indicate an improvement in sentiment
We carried out a round of dealer checks to understand the recent trends in demand and discounting. Our discussions with dealers indicate:
An improvement in consumer sentiment (fleet operators), with a significant increase in the number of enquiries in the last 4-5 months: Whilst the number of enquiries from the fleet operators has been increasing, the conversion ratio (to sales) is yet to increase significantly. That said, most of the dealers we spoke to indicated that bookings are recording positive YoY growth. Dealers attribute this to an improvement in sentiment particularly among the large fleet operators who, in anticipation of a revival, have started replacing their old trucks with new ones.
Inventory levels of dealers remain comfortable, with most dealers indicating that the current inventory levels are lower than the average inventory levels maintained 2-3 years ago: Dealers have been maintaining low inventory levels except in June 2014 when there was a despatch push from the manufacturers. However, the inventory levels have since been corrected, with end-August inventory being lower than that at end-June. With the revival in the economy and the consequent pickup in truck demand, dealers indicate that inventory levels would return to the normalised levels. This could have a double positive impact for CV manufacturers, as despatches could also include volumes to restore dealer inventory levels to normal levels.
The discounts have been reducing on an absolute basis for some of the truck models in the last 3-4 months: At the same time, CV companies are taking price hikes at regular intervals; for example, Ashok Leyland has taken price hikes in April, May, June and July whilst Tata Motors took price hikes in April and July. Hence, the CV manufacturers’ net sales realisation/margin is likely to benefit from the discount moderation as well as the hike in vehicle prices.
The dealers expect bookings to improve significantly from 4QFY15 onwards.
Positive feedback from CV financiers
The disbursements towards HCVs have been increasing in the last 3-4 months. Also, collections from HCV fleet operators have improved in recent months.
Financiers continue to prefer financing Tata Motors and Ashok Leyland vehicles due to their higher re-sale value and well-entrenched service network vs peers. The risk with financing the trucks of the newer entrants is that it takes a longer time to repair the truck and get it back on the road due to the lack of a service network. This could impact the EMI servicing ability of the fleet operator.
-50%
-40%
-30%
-20%
-10%
0%
10%
20%
6,000
8,000
10,000
12,000
14,000
16,000
Apr
-13
May
-13
Jun-
13Ju
l-1
3A
ug-1
3Se
p-13
Oct
-13
Nov
-13
Dec
-13
Jan-
14Fe
b-1
4M
ar-1
4A
pr-1
4M
ay-1
4Ju
n-14
Jul-
14
Domestic HCV goods (nos) YoY growth
-45%
-30%
-15%
0%
15%
30%
45%
1QFY
12
2QFY
12
3QFY
12
4QFY
12
1QFY
13
2QFY
13
3QFY
13
4QFY
13
1QFY
14
2QFY
14
3QFY
14
4QFY
14
1QFY
15
HCV YoY growth ICV YoY growthLCV YoY growth
Dealers saw an improvement in enquiries and bookings
CV financiers witnessing improvement in HCV disbursements
Ashok Leyland
September 01, 2014 Ambit Capital Pvt. Ltd. Page 5
LCVs and ICVs have been impacted by the lack of financing of these vehicles. Financiers have been cautious on LCVs due to the relatively smaller size of the fleet operators and due to the lack of a significant second-hand resale market for LCVs (unlike HCVs).
Fleet operators witnessing better days
Our discussions with fleet operators indicate a revival in transportation activities across sectors. Fleet operators have started replacing old trucks with new vehicles due to the anticipation of a revival in 4QFY15 and due to customer preference for new vehicles rather than old trucks. Whilst some fleet operators are delaying new purchases currently, they indicate that the purchase of new vehicles is likely to increase post the monsoons.
Whilst the second-hand market is somewhat absorbing the old trucks, the re-sale value has not improved meaningfully.
Furthermore, truck rentals for the 9-tonne payload truck, after remaining muted in CY13, have been increasing (up by ~12% from December 2013 to July 2014). This increase in truck rentals is more than the increase in diesel prices (8% over the same period).
Positive demand commentary from CV OEMs, auto ancillary and financing companies
Besides a visible improvement on the ground, an analysis of the latest annual report and management commentary (during the 1QFY15 earnings conference calls) indicate that companies now foresee a much better demand environment as compared to their expectation two quarters back. Please see the exhibit below which compares the demand outlook in 1QFY15 vs 4QFY14 and 3QFY14.
Exhibit 8: Most companies expect the demand environment to improve in the future
1QFY15 4QFY14 3QFY14
Tata Motors
Business sentiment is picking up, supporting the demand for medium and heavy trucks in India. The trend will continue and further momentum is likely particularly in the second half.
LCVs and SCVs continue to be significantly impacted by external factors and also more recently by financers pulling out from their automotive financing focus.
In MHCV buses, the JNNURM phase II orders would also drive the bus volumes higher.
Signs of improvement visible though on a low base.
MHCV market seems to be bottoming out.
Discounts have reduced; with demand picking up, discounts will further drop.
India business continues to be impacted by the overall economic environment.
Demand likely to be subdued in 4QFY14 and FY15.
Ashok Leyland
There are a lot of enquiries at the ground level. The supply chain is being beefed up to keep the whole thing ready in the event that the volumes start to swing up.
The demand pull has led to an increase in freight rates. Fleet owners are actually now looking at adding multi-axle vehicles to the fleet.
Has taken price hikes and net realisations have improved after factoring in the discounts.
Growth in truck industry is required for an overall improvement in GDP.
The confidence level is back, and the sentiments are better. The worst seems to be over and the mood is positive.
The industry is witnessing the longest and worst decline in history and this has resulted in heavy discounting.
Eicher Motors (CV business)
Industry continues to battle the downturn and the pressure on sales continues in the 5T segment.
Industry trends are turning upwards. The stress in the industry is continuing. CV market will start improving
sometime in 2014.
Bharat Forge The domestic market should revive in 2HFY15. CVs should revive in 1QFY15. A recovery is likely in the later portion
of the year.
Customers are seeing growth in demand for 4QFY14.
Magma Fincorp
The feeling of positivity will materialise into results on the ground by October/ November, with the start of festive season.
Overall sentiment has improved dramatically.
CV business likely to remain flat. Capacity utilisation in CV is expected
to remain weak for the next 24 months. Outlook is not bright.
Shriram Transport Finance
Overall CV sales growth YoY is negative. No possibility of growth in this quarter also.
2HFY15 expected to be better. Demand to return, because the new
government will be coming out with new policies on mining.
Fleet utilisation is the same and is likely to remain that way till industrial activities revive.
Source: Annual reports and management earnings calls
Fleet operators buying new vehicles in anticipation of economic revival
Ashok Leyland
September 01, 2014 Ambit Capital Pvt. Ltd. Page 6
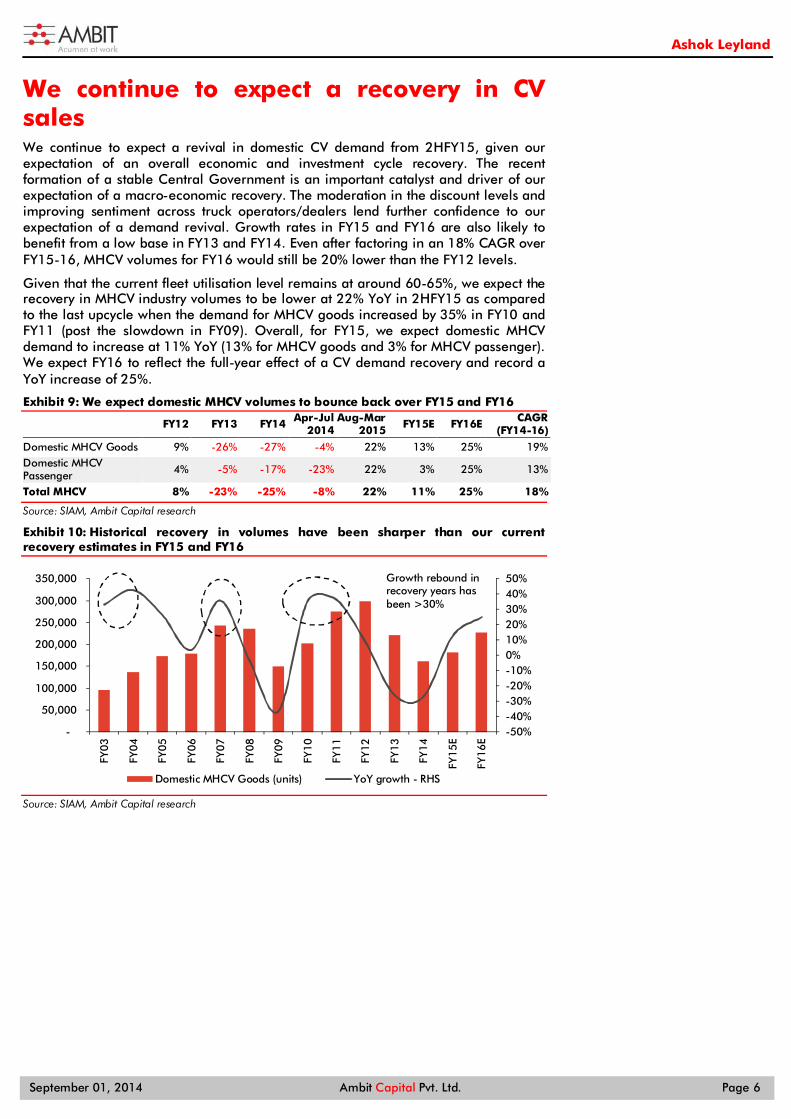
We continue to expect a recovery in CV sales We continue to expect a revival in domestic CV demand from 2HFY15, given our expectation of an overall economic and investment cycle recovery. The recent formation of a stable Central Government is an important catalyst and driver of our expectation of a macro-economic recovery. The moderation in the discount levels and improving sentiment across truck operators/dealers lend further confidence to our expectation of a demand revival. Growth rates in FY15 and FY16 are also likely to benefit from a low base in FY13 and FY14. Even after factoring in an 18% CAGR over FY15-16, MHCV volumes for FY16 would still be 20% lower than the FY12 levels.
Given that the current fleet utilisation level remains at around 60-65%, we expect the recovery in MHCV industry volumes to be lower at 22% YoY in 2HFY15 as compared to the last upcycle when the demand for MHCV goods increased by 35% in FY10 and FY11 (post the slowdown in FY09). Overall, for FY15, we expect domestic MHCV demand to increase at 11% YoY (13% for MHCV goods and 3% for MHCV passenger). We expect FY16 to reflect the full-year effect of a CV demand recovery and record a YoY increase of 25%.
Exhibit 9: We expect domestic MHCV volumes to bounce back over FY15 and FY16
FY12 FY13 FY14 Apr-Jul 2014
Aug-Mar 2015 FY15E FY16E CAGR
(FY14-16)
Domestic MHCV Goods 9% -26% -27% -4% 22% 13% 25% 19% Domestic MHCV Passenger 4% -5% -17% -23% 22% 3% 25% 13%
Total MHCV 8% -23% -25% -8% 22% 11% 25% 18%
Source: SIAM, Ambit Capital research
Exhibit 10: Historical recovery in volumes have been sharper than our current recovery estimates in FY15 and FY16
Source: SIAM, Ambit Capital research
-50%-40%-30%-20%-10%0%10%20%30%40%50%
-
50,000
100,000
150,000
200,000
250,000
300,000
350,000
FY03
FY04
FY05
FY06
FY07
FY08
FY09
FY10
FY11
FY12
FY13
FY14
FY15
E
FY16
E
Domestic MHCV Goods (units) YoY growth - RHS
Growth rebound in recovery years has been >30%

Ashok Leyland
September 01, 2014 Ambit Capital Pvt. Ltd. Page 7
We do not foresee significant market share challenges for AL in MHCV Given the duopoly nature of the HCV goods industry, new players have significant opportunities to grab market share in the domestic HCV space. Whilst this industry dynamic has attracted several new players like Bharat Benz (Daimler) and Volvo-Eicher in the HCV space, none of the new players have been able to make a significant dent in the aggregate market share of the top-two players. Tata Motors and Ashok Leyland continue to dominate the HCV goods segment, commanding a market share of 90.1% in YTD FY15 (i.e. April-July 2014, up 68bps YoY). Whilst Tata Motors has lost market share of 278bps YoY in YTD FY15, Ashok Leyland has gained close to 346bps YoY, indicating that the market share shift has been largely between these two players.
Exhibit 11: Tata Motors and AL have lost market share of only 8% in HCVs in the last ten years
FY04 FY05 FY06 FY07 FY08 FY09 FY10 FY11 FY12 FY13 FY14 YTDFY15* Change (bps) (FY04-current)
ICV (7.5 to 12 t) Tata Motors 29.1% 37.8% 42.8% 47.1% 46.9% 48.8% 48.6% 46.0% 48.2% 42.3% 45.0% 40.8% 1,161
Ashok Leyland 2.5% 3.6% 5.3% 3.8% 4.3% 4.6% 3.4% 5.1% 6.2% 11.3% 12.3% 14.0% 1,151
Eicher/VECV 46.2% 40.7% 36.1% 37.3% 39.8% 38.2% 39.1% 40.8% 38.3% 39.9% 37.7% 39.8% (644)
Others 22.2% 17.9% 15.7% 11.9% 9.0% 8.4% 8.8% 8.2% 7.3% 6.6% 5.1% 5.5% (1,668)
HCV (>12 t) Tata Motors 71.3% 72.2% 69.7% 67.1% 66.7% 70.3% 70.7% 66.4% 66.3% 61.6% 63.1% 62.1% (916)
Ashok Leyland 27.2% 24.6% 27.9% 30.8% 28.8% 24.5% 24.8% 27.2% 24.3% 27.7% 26.4% 27.9% 72
Eicher/VECV 1.2% 2.7% 1.9% 1.8% 2.3% 1.3% 1.3% 2.4% 3.3% 4.6% 4.2% 4.4% 315
Others 0.3% 0.4% 0.5% 0.3% 2.2% 3.9% 3.2% 4.0% 6.1% 6.2% 6.3% 5.6% 528
Total MHCV Tata Motors 66.4% 67.1% 64.8% 64.1% 63.3% 66.3% 65.9% 62.3% 62.2% 56.6% 58.5% 57.8% (859)
Ashok Leyland 24.3% 21.5% 23.8% 26.8% 24.6% 20.8% 20.2% 22.8% 20.2% 23.4% 22.8% 25.1% 77
Eicher/VECV 6.4% 8.5% 8.1% 7.1% 8.8% 8.2% 9.5% 10.1% 11.2% 13.7% 12.8% 11.5% 508
Others 2.8% 3.0% 3.3% 2.1% 3.4% 4.7% 4.4% 4.8% 6.4% 6.3% 6.0% 5.6% 274
Source: SIAM, Ambit Capital research. Note: * YTDFY15 indicates April-July 2014
Little room for error in the MHCV and more particularly the HCV space
Typically, the smaller fleet operators tend to choose the tried-and-tested manufacturers (conventional choices like trucks from Tata Motors and AL) whereas large fleet operators are more willing to experiment with newer brands, as the impact of any model failure would be limited due to the large fleet size.
The non-discretionary and rather highly value-conscious nature of the truck market leaves little room for error. Key deciding factors remain: (a) mileage offered by the product; (b) initial pricing of the product; (c) after-sales network; (d) product range; and (e) captive financing, with the first three factors mentioned above being the most important. The re-sale value of a model is a result of attaining success in the above factors over a period of time.
Amongst the newer players, only Bharat Benz (Daimler) and Volvo-Eicher are viewed as credible potential rivals by domestic peers as well as industry sources. However, some press articles1 suggest that the slowdown in the MHCV space has significantly impacted Daimler’s operations in India. (The company continued to insist that whilst the industry is in its worst phase, its plans for the Indian market are on track2.)
1http://timesofindia.indiatimes.com/business/india-business/Daimlers-India-truck-business-financially-sick/articleshow/29271293.cms 2 http://forbesindia.com/article/auto-expo/bharat-benz-still-a-challenger/37043/1

Ashok Leyland
September 01, 2014 Ambit Capital Pvt. Ltd. Page 8
In March 2014, Bharat Benz took several measures3 to support its dealers, some of which included 15 days’ credit on vehicles billed for a specific period. This clearly shows that besides having the right products, the viability of a dealer network poses an additional challenge to the new entrants. At the same time, as mentioned earlier, our discussions with CV financiers indicate their preference for Tata Motors and Ashok Leyland because of the much higher re-sale value of their products and well-entrenched service network. We expect market share loss for incumbents to be gradual
Overall, we believe the market share gain for the newer players in the MHCV and more particularly in the HCV space would be gradual given the significant time involved for newer players to set up a distribution network and ensure timely/adequate availability of spare parts.
Specific to AL, we believe market share gain in the domestic MHCV goods is likely to be of 100bps over FY15 and FY16 (vs Tata Motors’ market share loss of 200bps over these two years). This is due to the following factors:
(a) it being the distant second-largest player (22% market share) as compared to Tata Motors (59% market share); hence, we believe the brunt of the volume impact from the new competition will be borne by Tata Motors.
(b) the significant time involved for newer players to set up a distribution network and ensure timely/adequate availability of spare parts.
(c) the opportunity to gain market share in northern, central and western India (it has a market share of ~44% in south India vs 24% at the pan-India level): AL has been increasing its distribution network in the non-south markets in recent years. As a result, incremental volumes in the non-south markets should help arrest the market share loss in its main market, south India. The increasing sales in the non-south markets have also been responsible for AL more or less maintaining its market share in recent years despite the weak demand environment in the southern markets.
(d) the opportunity to increase market share in the ICV segment (25% of the MHCV market): AL’s market share in the ICV segment has increased in the last two years, growing from 6.2% in FY12 to 12.3% in FY14. The company has recently launched a new ICV called ‘Boss’ which has been well received in the limited markets that it was launched in. With the pan-India roll out of ‘Boss’ in FY15, we expect AL’s market share in the ICV segment to further expand.
In YTD FY15 (April-July 2014), AL’s market share in domestic MHCV goods increased to 25.1% (up 444bps YoY and 234bps higher than the average FY14 market share). We expect AL to have a market share of 24.3% in FY15 and 23.8% in FY16. This implies a loss of 132bps from YTD FY15 levels to factor in more product introductions from newer entrants. But the market share level of 23.8% in FY16 would still imply a net gain of 100bps over FY14 levels given the strong market share improvement in YTD FY15.
Overall, our expectation of the market share trend in MHCV goods over FY15 and FY16 has been mentioned in the exhibit below.
Exhibit 12: Our market share expectations in the domestic MHCV goods segment
Domestic MHCV Goods FY12 FY13 FY14 Apr-Jul
2014 Aug-Mar
2015 FY15E FY16E Change FY14-16
(bps)
Tata Motors 62.2% 56.6% 58.5% 57.8% 57.3% 57.4% 56.4% (204)
Ashok Leyland 20.2% 23.4% 22.8% 25.1% 23.9% 24.3% 23.8% 103
Volvo-Eicher 11.2% 13.7% 12.8% 11.5% 13.0% 12.5% 13.0% 25
Others 6.4% 6.3% 6.0% 5.6% 5.8% 5.8% 6.8% 76
Source: SIAM, Ambit Capital research 3http://timesofindia.indiatimes.com/business/india-business/Daimler-doles-out-incentives-for-dealers/articleshow/31557079.cms
AL’s market share in non-south regions has increased in FY14
Source: Ashok Leyland presentation
14.0
16.0
18.0
20.0
22.0
North East Central FY13 FY14

Ashok Leyland
September 01, 2014 Ambit Capital Pvt. Ltd. Page 9
Demand recovery and cost reduction efforts to lead to a recovery in margin AL’s margin performance has been improving in recent quarters. In 4QFY14, AL’s EBITDA margin at 6.0% expanded 66bps YoY and positively surprised our estimates by nearly 319bps. Similarly in 1QFY15, despite a YoY decline in revenues, EBITDA margin expanded by nearly 370bps YoY. We believe this is attributable to the cost reduction efforts of the company.
Exhibit 13: Historically, the EBITDA margin performance in the recovery years has been particularly strong
Source: Company, Ambit Capital research
Going forward, we expect AL’s EBITDA margin to further expand on the back of:
Our expectation of a recovery in volumes (as discussed above) and the consequent operating leverage benefits to AL.
Our expectation of a moderation in the high level of discounts (as AL witnesses a recovery in volumes).
The company’s continued efforts to bring down the break-even point by 20-30% through reduction in manpower, overhead and material costs.
Exhibit 14: AL's cost reduction strategy Strategy Results so far
Reduce manpower cost Manpower cost down 7% YoY in FY14
Reduce other overheads Overall fixed cost reduced by 9% in FY14; Production overheads down 33% in FY14
Reduce interest costs Reduced debt by `14.7bn between August 2013 and March 2014. Interest cost down from `1.24bn in 2QFY14 to ̀ 1.06bn in 1QFY15
Source: Company, Ambit Capital research
We expect AL’s margins to bounce back in FY15 to 7.1% (vs 1.7% in FY14) and further expand to 9.8% in FY16. We have broadly retained our FY15 EBITDA margin estimates at the earlier levels. But we have factored in an upgrade of 79bps to our FY16 EBITDA margin estimates, as we are marginally upgrading our FY16 volume estimates and we expect the cost reduction efforts of the company to further bear fruit in FY16. Even after this upgrade, we expect the FY15/16 EBITDA margin to be lower than AL’s historical margins (average EBITDA margin of 10% over FY07-12) due to the lower margin on ‘LCV Dost' vehicle sales. That said, even at current estimates, we expect EBITDA to record strong growth in FY15 and FY16.
0.0%
2.0%
4.0%
6.0%
8.0%
10.0%
12.0%
FY06 FY07 FY08 FY09 FY10 FY11 FY12 FY13 FY14 FY15E FY16E
Margins are strong in years of recovery
Avg EBITDA margin (FY07-12): 10.0%

Ashok Leyland
September 01, 2014 Ambit Capital Pvt. Ltd. Page 10
Exhibit 15: We expect margins to recover in FY15/16
` mn unless specified FY12 FY13 FY14 FY15E FY16E
Volumes (ex-Dost) (nos) 94,115 79,698 60,337 69,802 85,066
Volume growth 0% -15% -24% 16% 22%
Revenues 128,420 124,817 99,434 119,837 151,432
Revenue growth 15% -3% -20% 21% 26%
EBITDA 12,561 8,770 1666 8,465 14,827
EBITDA growth 3% -30% -81% 408% 75%
EBITDA margin 9.8% 7.0% 1.7% 7.1% 9.8%
Source: Company, Ambit Capital research

Ashok Leyland
September 01, 2014 Ambit Capital Pvt. Ltd. Page 11
Balance sheet deleveraging on track AL’s net debt reduced from `61bn as at end-August 2013 to `47bn as at end-FY14 (1.4x net debt:equity) was driven by reduction in the working capital and sale of non-core investments and assets. In June 2014, AL raised `6.67bn through QIP mainly to reduce the debt levels. As at end-June 2014, AL’s debt was `45bn (1.18x debt:equity) after factoring in the capital-raising through QIP. We expect AL’s net debt to reduce to `36bn by end-FY15 vs `45bn as at end-June 2014 driven by the following factors:
(i) Sale of non-core investments: We expect AL to raise `3.8 bn from sale of investments namely Albonair GmBH and Avia Ashok Leyland Motors Ltd s.r.o. We are factoring in sale at the carrying value of this investment. We expect AL to realise `185mn receivable in respect of sale of investments in FY14 held in the escrow account as at June 2014. We are not factoring in the sale of the remaining IndusInd Bank shares (at CMP, their value stands `2.8bn).
(ii) Sale of non-core asset: The amount receivable from the sale of a Chennai property (`1.1bn) which was concluded in FY14.
(iii) Strong cash flow from operations: We expect AL to generate cash flow from operations of `22.8bn over FY15 and FY16 on the back of higher revenues/margin and marginal reduction in working capital days (average working capital days at 20 days in FY15 and 19 days in FY16 vs 27 days in FY14).
(iv) Moderation in capex and investments: We expect capex in the standalone business and investments into the Nissan and John Deere JVs to be restricted to `6.5bn over FY15 and FY16.
Overall, we expect the net debt levels to come down by 24% YoY to `35.7bn (net debt:equity ratio of 0.9x) by end-FY15 and further by 18% to `29.1bn (net debt:equity ratio of 0.7x) by end-FY16.
Exhibit 16: Movement in net debt between FY14 and FY16E
` mn FY15 FY16 Total
Opening debt 46,786 35,658 46,786
Less: CFO (before WC changes) (9,058) (13,709) (22,767)
Add: Reduction in Net working cap 1,207 1,869 (3,075)
Add: Capex 2,000 2,000 4,000
Less: sale of non-core assets (1,062) - (1,062)
Add: investments in JVs 2,500 - 2,500
Less: sale of non-core investments (4,028) - (4,028)
Less: QIP (6,667) - (6,667)
Add: Finance costs 3,981 3,268 7,249
Closing debt 35,658 29,086 29,086
Source: Company, Ambit Capital research
Exhibit 17: After peaking in FY14, net debt:equity to continuously decline over FY15 and FY16
Source: Company, Ambit Capital research
0.6
0.8
1.0
1.2
1.4
1.6
15,000
20,000
25,000
30,000
35,000
40,000
45,000
50,000
FY10 FY11 FY12 FY13 FY14 FY15E FY16E
Net debt (Rs mn) Net debt:equity (x) - RHS
AL raised `9bn from non-core assets/investment sales in FY14
Name of the investment/ asset
Sale Value (̀ mn)
IndusInd Bank shares 5,280
Defiance Testing 1,668 Immovable properties (incl residential property at Chennai)
2,036
Total 8,983
Source: Company, Ambit Capital research

Ashok Leyland
September 01, 2014 Ambit Capital Pvt. Ltd. Page 12
Key assumptions and estimates Exhibit 18: Key assumptions and estimates (standalone) ` mn unless specified FY14 FY15E FY16E Remarks
Commercial vehicle volumes (ex-Dost) 60,337 69,802 85,066
We expect the domestic MHCV demand to recover in FY15 and record a CAGR of 18% over FY14-16. We expect AL to hold on to its MHCV market share in the domestic MHCV space and in fact register a net gain of 100bps over FY15 and FY16. The export order from the Sri Lankan Government of 2,200 buses would further boost AL’s export volumes and we expect exports to record a volume CAGR of 20% over FY14-16.
YoY growth (%) -24% 16% 22%
Dost volumes 28,995 27,695 34,627 We expect LCV Dost’s volume decline to moderate in FY15 and recover in FY16, recording a CAGR of 9% over FY14-16E. YoY growth (%) -17% -4% 25%
Net sales 99,434 119,837 151,432 We expect revenues to bounce back in FY15 and record a CAGR of 23% over FY14-16 on the back of a recovery in domestic volumes and strong growth in exports. YoY growth (%) -20% 21% 26%
EBITDA 1,666 8,465 14,827 We expect recovery in volumes, moderation in discount levels and the company’s cost reduction efforts to bring about a recovery in margin. However, margin is likely to remain below the historical average (FY07-12 average of 10.0%) due to the lower margin on 'Dost' vehicles.
EBITDA margin (%) 1.7% 7.1% 9.8%
Adjusted PAT (4,763) 954 6,223 We expect PAT to bounce back strongly in FY15 on the back of: (a) recovery in volumes and margin; and (b) reduction in the net debt levels and consequently interest expenses.
Fully diluted EPS (`) (1.79) 0.34 2.19
YoY growth (%) NM NM NM
Average work cap (ex-cash) days 27 20 19 We have maintained net working capital days (ex-cash) for FY15 and FY16 at FY14 levels. Closing work cap (ex-cash) days 22 22 22
Cash flow from operations 5,564 7,852 11,840 We expect cash conversion (CFO before tax) to remain strong at ~95% of EBITDA in FY15 and FY16.
Gross Capex (̀ mn) 2,198 2,000 2,000 We expect capex to moderate, as capex would be restricted towards maintenance and product development spends.
Free cash flow (before recurring investments) (` mn) 3,367 5,852 9,840 Strong cash flow generation and moderation in capex to lead to
improvement in recurring FCF generation. Sale of non-core assets (realised value) 1,933 1,062 -
We expect `1.1bn receivable in respect of sale of non-core assets in FY14 to be realised in FY15.
Gross investments 4,520 2,500 - We expect incremental investments in FY15 into only the Nissan and John Deere JVs.
Sale of non-core investments 5,097 4,028 - Sale of Albonair GmbH in FY15 to help raise cash.
Net debt/ (cash) (̀ mn) 46,786 35,658 29,086
We expect net debt levels to come down in FY15 and further in FY16 on the back of: (a) improvement in FCF generation; (b) `6.67bn raised through QIP; and (c) sale of non-core assets/investments.
Source: Company, Ambit Capital research
Ashok Leyland
September 01, 2014 Ambit Capital Pvt. Ltd. Page 13
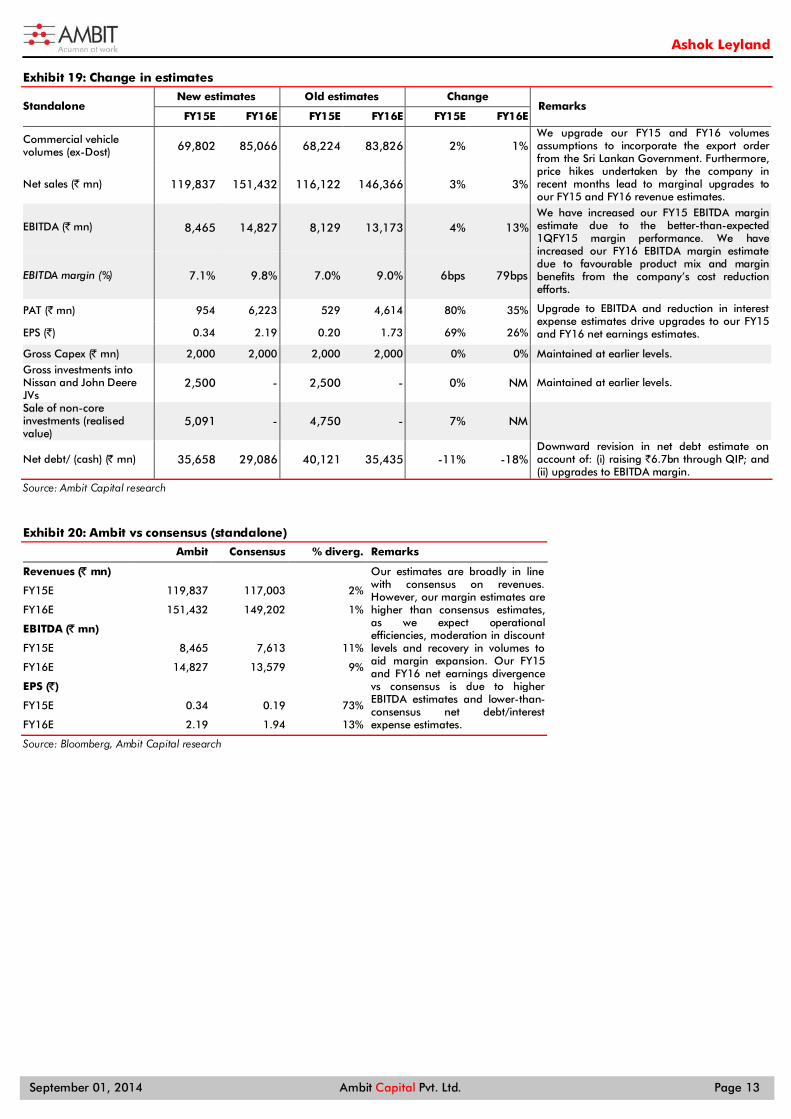
Exhibit 19: Change in estimates
Standalone New estimates Old estimates Change
Remarks FY15E FY16E FY15E FY16E FY15E FY16E
Commercial vehicle volumes (ex-Dost) 69,802 85,066 68,224 83,826 2% 1%
We upgrade our FY15 and FY16 volumes assumptions to incorporate the export order from the Sri Lankan Government. Furthermore, price hikes undertaken by the company in recent months lead to marginal upgrades to our FY15 and FY16 revenue estimates.
Net sales (` mn) 119,837 151,432 116,122 146,366 3% 3%
EBITDA (` mn) 8,465 14,827 8,129 13,173 4% 13% We have increased our FY15 EBITDA margin estimate due to the better-than-expected 1QFY15 margin performance. We have increased our FY16 EBITDA margin estimate due to favourable product mix and margin benefits from the company’s cost reduction efforts.
EBITDA margin (%) 7.1% 9.8% 7.0% 9.0% 6bps 79bps
PAT (` mn) 954 6,223 529 4,614 80% 35% Upgrade to EBITDA and reduction in interest expense estimates drive upgrades to our FY15 and FY16 net earnings estimates. EPS (`) 0.34 2.19 0.20 1.73 69% 26%
Gross Capex (̀ mn) 2,000 2,000 2,000 2,000 0% 0% Maintained at earlier levels. Gross investments into Nissan and John Deere JVs
2,500 - 2,500 - 0% NM Maintained at earlier levels.
Sale of non-core investments (realised value)
5,091 - 4,750 - 7% NM
Net debt/ (cash) (̀ mn) 35,658 29,086 40,121 35,435 -11% -18% Downward revision in net debt estimate on account of: (i) raising `6.7bn through QIP; and (ii) upgrades to EBITDA margin.
Source: Ambit Capital research
Exhibit 20: Ambit vs consensus (standalone)
Ambit Consensus % diverg. Remarks
Revenues (̀ mn) Our estimates are broadly in line with consensus on revenues. However, our margin estimates are higher than consensus estimates, as we expect operational efficiencies, moderation in discount levels and recovery in volumes to aid margin expansion. Our FY15 and FY16 net earnings divergence vs consensus is due to higher EBITDA estimates and lower-than-consensus net debt/interest expense estimates.
FY15E 119,837 117,003 2%
FY16E 151,432 149,202 1%
EBITDA (̀ mn)
FY15E 8,465 7,613 11%
FY16E 14,827 13,579 9%
EPS (̀ )
FY15E 0.34 0.19 73%
FY16E 2.19 1.94 13%
Source: Bloomberg, Ambit Capital research

Ashok Leyland
September 01, 2014 Ambit Capital Pvt. Ltd. Page 14
Valuation: Reiterate BUY with TP of `44 Absolute valuation Core commercial vehicle business (`37/AL share): Using FCF, we arrive at a fair value of `37/share for the standalone commercial vehicle business (as compared to our May 27, 2014 valuation of `31/share). We use a WACC of 12.6% (cost of debt of 10% and cost of equity of 15%) and terminal growth rate of 4% (all of these assumptions are unchanged from our May 27, 2014 note). The fair value for the standalone commercial vehicle business, so arrived at, implies a multiple of 9.3x one-year forward (FY16) EV/EBITDA, a premium of 15% to the five-year average multiple commanded by AL and 8% higher than the EV/EBITDA valuation multiple implied by our May 27, 2014 valuation estimate.
The increase of `6/share or 19% (from `31/share to `37/share) in the valuation of the core standalone CV business is mainly on account of:
Upgrades to our FY16 EBITDA estimate by 13% as compared to the last published estimates;
Roll-forward of the DCF which has a positive impact of around 3% on the valuation; and
Increase in the long-term margin assumption by 100bps to 9.5%.
Exhibit 21: FCF profile (standalone)
Source: Ambit Capital research
Exhibit 22: FCF assumptions (standalone – ̀ mn)
PV of FCF for forecasting period (FY16- FY25) 70,115
Terminal value 68,037
Enterprise value 138,152
Less: net debt/ (cash) at 31 March 2015 35,658
Implied equity value 102,494
Fully diluted equity shares (mn) 2,846
Implied equity value (̀ /share) 37
Source: Ambit Capital research
Investments (`7/AL share): We only assign values to the investments made by the company in: (a) Hinduja Leyland Finance Ltd (HLFL); (b) JVs with Nissan and John Deere; and (c) stake held by AL in IndusInd Bank. In our May 27, 2014 valuation, we had assumed that the company will sell its remaining stake in IndusInd Bank (the stake held in IndusInd Bank is 0.96% and worth `2.8bn at the current market price of IndusInd Bank). However, the management has indicated that they are not likely to liquidate the remaining stake in IndusInd Bank. Hence, we are not factoring in any further sale of IndusInd Bank shares in the future.
Note that we are not assigning any values to entities constituting nearly `9.6bn of AL’s investment book. At 1.0x end-FY15 book value, these investments would have accounted for `3/AL share as at end-FY15 (8% of our SOTP-based valuation for AL).
8%
10%
12%
14%
16%
18%
20%
22%
5,000
5,500
6,000
6,500
7,000
7,500
8,000
8,500
FY16
E
FY17
E
FY18
E
FY19
E
FY20
E
FY21
E
FY22
E
FY23
E
FY24
E
FY25
E
PVFF (LHS) (Rs mn) WACC (RHS) RoE (RHS)
AL’s investment book excluding investments in JVs/HLFL and stake held in IndusInd Bank
` mn FY15 book value
Optare UK Plc 1,499
Hinduja Foundries 3,459
Hinduja Energy 1,871 Ashok Leyland Wind Energy 780
Defiance Technologies 819
Ashley Alteams 575
Others 618
Total 9,621
Source: Company, Ambit Capital research

Ashok Leyland
September 01, 2014 Ambit Capital Pvt. Ltd. Page 15
Exhibit 23: Valuation for AL‘s investment outside of the standalone CV business
Investment name (̀ mn unless specified)
Book value of AL’s investment as at
end-FY15
Valuation methodology
Valuation multiple
Fair value of AL’s investment as at end-FY15
Value per AL share (̀ )
AL-Nissan JV 6,730 P/BV 1 6,730 2
AL-John Deere JV 2,036 P/BV 1 2,036 1
Hinduja Leyland Finance 7,785 P/BV 1 7,785 3
IndusInd Bank 2,810 Market price NA 2,810 1
Total (rounded off) 7
Source: Company, Ambit Capital research
SOTP valuation
After adding up our valuation of the standalone commercial vehicle business (`37/share) and investments (`7/share), we arrive at a September 2015 SOTP valuation of `44/share, a 21% upside from current levels and 19% higher than our previous target price. We retain our BUY stance on the stock.
Exhibit 24: SOTP valuation from AL (` 37/share)
Segment Methodology Implied multiple (x) Value (̀ /AL share)
Remarks New Old Change
Core business FCF 9.3x FY16 EV/EBITDA 37 31 19%
Increase in value is mainly driven by: (a) increase in FY16 EBITDA by 13%; (b) roll forward of DCF (3%); and (c) increase in our long-term EBITDA margin assumption by 100bps to 9.5%.
Investments P/B 1x FY15 P/B 7 6 17%
We include AL’s residual stake in IndusInd Bank – `1/share (not included in our earlier estimates as we expected sale of entire stake in IndusInd Bank). We value the Nissan and John Deere JVs on end-FY15 book.
Total (̀ ) 44 37 19%
Source: Ambit Capital research
Relative valuation Due to AL’s high depreciation and interest expenses relative to its peers, we believe EV/EBITDA is an appropriate metric for a comparison with its peers. On a comparative valuation on FY16 EV/EBITDA, the stock is trading at a 10% discount to domestic vehicle OEMs.
Exhibit 25: Comparative valuation
Mcap EV/EBITDA (x) P/E (x) CAGR (FY14-16) Price perf (%) RoE
US$ mn FY14 FY15 FY16 FY14 FY15 FY16 Sales EBITDA EPS 3m 1 yr FY14 FY15 FY16
India
Ashok Leyland 1,717 87.2 19.3 10.8 NA NA 18.8 22.5 183.9 NA 15 193 1 1 11
Bajaj Auto 10,979 15.5 14.1 12.2 20.5 18.8 16.2 14.3 12.8 12.4 16 33 37 33 32
M&M 14,261 18.1 15.4 13.1 22.0 22.0 18.6 11.9 17.3 8.8 17 78 24 21 21
Maruti Suzuki 13,832 14.3 12.4 9.9 30.0 23.7 17.9 16.6 20.0 29.5 20 120 14 15 17
Hero MotoCorp 8,495 13.5 12.2 10.2 24.4 18.6 15.2 13.1 15.0 26.7 11 35 40 44 45
Eicher Motors 4,432 37.0 23.1 15.0 67.8 38.8 25.5 32.2 57.0 63.0 40 202 21 28 33
Average (ex-Ashok Leyland) 19.7 15.4 12.1 32.9 24.4 18.7
Global CVs
Volvo 26,561 10.9 11.5 8.5 48.8 20.7 12.5 4.9 13.4 97.5 (12) (11) 5 10 18
PACCAR 22,255 7.9 7.6 7.0 19.0 17.2 15.2 6.5 6.5 11.7 (2) 19 19 19 19
MAN 17,460 21.2 13.2 10.8 NA 29.5 21.1 1.7 40.3 NA (1) 5 (10) 9 12
Navistar 3,059 NA 14.4 4.7 NA NA 24.0 8.9 NA NA 7 12 NA 12 (10)
Average 13.3 11.7 7.7 33.9 22.5 18.2 Source: Company, Bloomberg, Ambit Capital research

Ashok Leyland
September 01, 2014 Ambit Capital Pvt. Ltd. Page 16
Key risks Subsidiaries/JVs profitability
AL’s consolidated FY14 revenues and EBITDA are higher than that of the standalone entity (the company has provided consolidated financials for the first time in FY14 and only for FY14). FY14 consolidated revenues were higher than standalone revenues by `15bn or 16%. Similarly, consolidated EBITDA for FY14 at `4.2bn was much higher than standalone EBITDA of `1.7bn. However, at the net earnings level, the consolidated ‘loss’ at `7.5bn for FY14 was much higher than the standalone loss of `4.8bn (implying `2.7bn loss at subsidiaries/joint venture level).
Exhibit 26: While consolidated revenue and EBIDA are higher compared to standalone level, standalone is more profitable at the net earnings level ` mn unless specified Standalone Consolidated Difference
Revenue 99,434 114,867 15,433
EBITDA 1,666 4,220 2,555
EBITDA % 1.7% 3.7% Adjusted PBT (5,969) (8,210) (2,241)
Adjusted PAT (4,763) (7,525) (2,762)
Net debt 46,786 83,865 37,079
Source: Company, Ambit Capital research
An analysis of the performance of the key subsidiaries and joint ventures indicate that most of the net loss (`2.7bn) at the consolidated entity is contributed by three entities: (i) Ashok Leyland Nissan Vehicle Limited (`1.8bn); (ii) Optare Group (`0.4bn) and (iii) AL’s JV with John Deere (`0.4bn). On the positive front, Hinduja Leyland Finance generated net profit of `0.8bn in FY14.
Exhibit 27: Financial performance of key subsidiaries and joint ventures
Sr No Name of the Company Amount invested
by AL (̀ mn) Subsidiary/JV
(AL's stake) Country of
incorporation
Income Statement (̀ mn)
Revenue PBT PAT
1 Hinduja Leyland Finance Limited 7,785 Subsidiary (65.8%) India 5,962 1,230 812
2 Optare Group Limited 1,499 Subsidiary (75.1%) UK 5,373 (359) (359)
3 Ashok Leyland Nissan Vehicle Limited 3,729 Subsidiary (51%) India 10,522 (1,745) (1,745)
4 Ashley Alteams 575 Joint Venture (50%) India 6,011 (99) (99)
5 AL- John Deere 1,535 Joint Venture (50%) India 326 (391) (391)
Source: Company, Ambit Capital research. Note: Figures for JVs above are proportionate figures attributable to AL
We expect the level of loss incurred by these entities to continue in FY15 and hence we are factoring in an equity contribution of `2.5bn from AL in FY15. However, in FY16, with our expectation of a recovery in CV sales, we believe these entities should be able to cash break-even. Hence, we are not factoring in any further equity contribution from AL into these entities in FY16 (or post that).
Furthermore, the company has classified certain investments as ‘held for sale’ and not included the financial performance of these entities in the consolidated accounts. These entities together incurred a net loss of `1.6bn in FY14. The major entities classified as ‘held for sale’ and their financial performance is shown in the below exhibit.
Exhibit 28: Financial performance of key entities classified as investments 'held for sale'
Sr No Name of the Company Amount invested by AL (̀ mn)
Subsidiary/JV (AL's stake)
Country of incorporation
Income Statement (̀ mn)
Revenue PBT PAT
1 Albonair GmbH, Germany 3,828 Subsidiary (100%) Germany 700 (694) (694)
2 Avia Ashok Leyland Motors s.r.o 2,512 Subsidiary (100%) Czech Republic 297 (842) (842)
Source: Company, Ambit Capital research. Note: Figure before impairment provision
We are currently factoring in the sale of these entities (held for sale) in FY15 for `3.8bn (at book value net of provision for diminution). Any delay in the sale of these entities could lead to further equity infusion from AL to sustain these entities.

Ashok Leyland
September 01, 2014 Ambit Capital Pvt. Ltd. Page 17
Key catalysts Recovery in MHCV volumes: Whilst near-term demand remains subdued, we expect MHCV demand to recover in 4QFY15 on the back of an uptick in the investment cycle. Any improvement in monthly MHCV volumes reported by the company/industry can be a key trigger for the share price.
Deleveraging and/or sale of non-core assets/investments: Any positive development/announcement surrounding the sale of non-core investments/assets or any higher-than-expected reduction in debt levels post the QIP can have a positive impact on net earnings and thereby the share price.
Exhibit 29: Explanation for our forensic accounting scores on the cover page
Segment Score Comments
Accounting AMBER In most of the key accounting parameters used by us to analyse the accounting quality, AL has seen an improvement/stable trend in FY14 as compared to the five-year FY08-13 average. Further, the company has reported consolidated accounts for FY14 for the first time.
Predictability RED
Whilst volumes are reported by the company on a monthly basis (in line with the industry practice), the margin performance reported in the quarterly earnings tends to be unpredictable due to the high amount of fixed costs involved in the business. Whilst this is an industry-wide phenomenon, AL’s margin performance has been generally more volatile relative to its peers due to several one-offs usually contained in its results. Consequently, AL’s results tend to either significantly surprise or disappoint market expectations. Furthermore, the increased significance of capex and investments over the years has also increased the degree of volatility in the company’s financial performance.
Earnings momentum AMBER Bloomberg consensus earnings show marginal downgrades to FY15 and FY16 EBITDA and EPS estimates over the past four weeks.
Source: Ambit Capital research

Ashok Leyland
September 01, 2014 Ambit Capital Pvt. Ltd. Page 18
Balance sheet (standalone)
Year to March (̀ mn) FY12 FY13 FY14 FY15E FY16E
Shareholders' equity 2,661 2,661 2,661 2,846 2,846
Reserves and surpluses 39,421 41,890 41,818 49,255 52,158
Total net worth 42,082 44,551 44,479 52,100 55,004
Debt 30,979 43,554 46,903 36,903 31,903
Deferred tax liability 4,904 5,274 4,068 4,068 4,068
Total liabilities 78,000 93,379 95,450 93,071 90,975
Gross block 72,564 79,913 86,723 88,723 90,723
Net block 49,135 52,819 56,599 54,476 52,259
CWIP 6,903 7,057 1,919 1,919 1,919
Investments (non-current) 15,345 23,376 27,897 26,553 26,553
Cash & cash equivalents 326 139 117 1,246 2,817
Debtors 12,302 14,194 12,990 15,656 19,783
Inventory 22,306 18,960 11,887 14,326 18,103
Loans & advances 12,767 14,421 16,672 18,222 22,554
Total current assets 47,702 47,715 41,666 49,449 63,258
Current liabilities 36,188 33,716 31,070 37,446 47,318
Provisions 4,969 3,872 1,560 1,880 5,696
Total current liabilities 41,157 37,588 32,630 39,326 53,014
Net current assets 6,545 10,127 9,035 10,124 10,244
Miscellaneous expenditure 73 - - - -
Total assets 78,000 93,379 95,450 93,071 90,975
Source: Company, Ambit Capital research
Income statement (standalone) Year to March (̀ mn) FY12 FY13 FY14 FY15E FY16E
Net Sales 128,420 124,817 99,434 119,837 151,432
% growth 15% -3% -20% 21% 26%
Operating expenditure 115,859 116,047 97,769 111,372 136,605
EBITDA 12,561 8,770 1,666 8,465 14,827
% growth 3% -30% -81% 408% 75%
Depreciation 3,528 3,808 3,770 4,123 4,217
EBIT 9,033 4,962 (2,105) 4,342 10,610
Interest expenditure 2,553 3,769 4,529 3,981 3,268
Non-operating income 404 624 665 832 956
Adjusted PBT 6,884 1,817 (5,969) 1,193 8,298
Tax 1,240 370 (1,206) 239 2,074
Adjusted PAT 5,644 1,447 (4,763) 954 6,223
% growth -11% -74% -429% -120% 552%
Extraordinary income/ (expense) 16 2,896 5,057 - -
Reported PAT after minority interest 5,660 4,342 294 954 6,223
Source: Company, Ambit Capital research

Ashok Leyland
September 01, 2014 Ambit Capital Pvt. Ltd. Page 19
Cash flow statement (standalone)
Year to March (̀ mn) FY12 FY13 FY14 FY15E FY16E
Net profit before tax 6,900 4,707 (912) 1,193 8,298
Depreciation 3,528 3,865 3,789 4,123 4,217
Others 2,024 296 (1,183) 3,981 3,268
Tax (1,500) (1,100) (297) (239) (2,074)
(Incr)/decr in net working capital 218 (485) 4,168 (1,207) (1,869)
Cash flow from operations 11,171 7,283 5,564 7,852 11,840
Capex (net) (7,712) (6,492) (2,198) (2,000) (2,000)
(Incr)/decr in investments (3,031) (5,136) (5,379) 1,528 -
Other income (expenditure) 168 (16) 279 - -
Cash flow from investments (10,575) (11,643) (7,298) (472) (2,000)
Net borrowings 3,150 11,004 1,827 (10,000) (5,000)
Issuance/buyback of equity - - - 6,667 (0)
Interest paid (2,166) (3,628) (4,358) (3,981) (3,268)
Dividend paid (3,092) (3,092) (1,868) - -
Cash flow from financing (2,109) 4,283 (4,398) (7,314) (8,268)
Net change in cash (1,513) (77) (6,132) 66 1,572
Free cash flow (before investments) 3,459 791 3,367 5,852 9,840
Source: Company, Ambit Capital research
Ratio analysis (standalone)
Year to March FY12 FY13 FY14 FY15E FY16E
EBITDA margin (%) 9.8% 7.0% 1.7% 7.1% 9.8%
EBIT margin (%) 7.0% 4.0% -2.1% 3.6% 7.0%
Net prof. (bef min int) margin (%) 4.4% 1.2% -4.8% 0.8% 4.1%
Dividend payout ratio (%) 47% 37% 0% 0% 46%
Net debt: equity (x) * 1.1 1.4 1.4 0.9 0.7
RoCE (pre-tax) (%) 14% 7% -3% 7% 17%
RoIC (%) 12% 6% -3% 5% 13%
RoE (%) 19% 5% -15% 2% 14%
Source: Company, Ambit Capital research, Note: * excluding revaluation reserve
Valuation parameters (standalone)
Year to March FY12 FY13 FY14 FY15E FY16E
EPS (`) 2.12 0.54 (1.79) 0.34 2.19
Diluted EPS (`) 2.12 0.54 (1.79) 0.34 2.19
Book value per share (`) * 10.9 11.9 12.3 14.2 15.2
Dividend per share (`) 1.0 0.6 - - 1.0
P/E (x) 17.2 67.0 NM NM 16.7
P/BV (x) 3.4 3.1 3.0 2.6 2.4
EV/EBITDA (x) 10.6 15.1 79.6 15.7 8.9
EV/EBIT (x) 14.7 26.7 (63.0) 30.5 12.5
Source: Company, Ambit Capital research, Note: * excluding revaluation reserve

Ashok Leyland
September 01, 2014 Ambit Capital Pvt. Ltd. Page 20
Institutional Equities Team Saurabh Mukherjea, CFA CEO, Institutional Equities (022) 30433174 [email protected]
Research
Analysts Industry Sectors Desk-Phone E-mail
Nitin Bhasin - Head of Research E&C / Infra / Cement / Industrials (022) 30433241 [email protected]
Aadesh Mehta Banking / Financial Services (022) 30433239 [email protected]
Achint Bhagat Cement / Infrastructure (022) 30433178 [email protected]
Aditya Khemka Healthcare (022) 30433272 [email protected]
Ashvin Shetty, CFA Automobile (022) 30433285 [email protected]
Bhargav Buddhadev Power Utilities / Capital Goods (022) 30433252 [email protected]
Dayanand Mittal, CFA Oil & Gas / Metals & Mining (022) 30433202 [email protected]
Deepesh Agarwal Power Utilities / Capital Goods (022) 30433275 [email protected] Gaurav Mehta, CFA Strategy / Derivatives Research (022) 30433255 [email protected]
Karan Khanna Strategy (022) 30433251 [email protected]
Krishnan ASV Real Estate (022) 30433205 [email protected]
Pankaj Agarwal, CFA Banking / Financial Services (022) 30433206 [email protected]
Paresh Dave Healthcare (022) 30433212 [email protected]
Parita Ashar Metals & Mining / Oil & Gas (022) 30433223 [email protected]
Pratik Singhania Retail (022) 30433264 [email protected]
Rakshit Ranjan, CFA Consumer / Retail (022) 30433201 [email protected]
Ravi Singh Banking / Financial Services (022) 30433181 [email protected]
Ritesh Gupta, CFA Midcaps – Chemical / Retail (022) 30433242 [email protected]
Ritesh Vaidya Consumer (022) 30433246 [email protected] Ritika Mankar Mukherjee, CFA Economy / Strategy (022) 30433175 [email protected]
Ritu Modi Automobile (022) 30433292 [email protected]
Sagar Rastogi Technology (022) 30433291 [email protected]
Sumit Shekhar Economy / Strategy (022) 30433229 [email protected]
Tanuj Mukhija, CFA E&C / Infra / Industrials (022) 30433203 [email protected]
Utsav Mehta Technology (022) 30433209 [email protected]
Sales
Name Regions Desk-Phone E-mail
Sarojini Ramachandran - Head of Sales UK +44 (0) 20 7614 8374 [email protected]
Deepak Sawhney India / Asia (022) 30433295 [email protected]
Dharmen Shah India / Asia (022) 30433289 [email protected]
Dipti Mehta India / USA (022) 30433053 [email protected]
Hitakshi Mehra India (022) 30433204 [email protected]
Nityam Shah, CFA USA / Europe (022) 30433259 [email protected]
Parees Purohit, CFA UK / USA (022) 30433169 [email protected]
Praveena Pattabiraman India / Asia (022) 30433268 [email protected]
Production
Sajid Merchant Production (022) 30433247 [email protected]
Sharoz G Hussain Production (022) 30433183 [email protected]
Joel Pereira Editor (022) 30433284 [email protected]
Nikhil Pillai Database (022) 30433265 [email protected]
E&C = Engineering & Construction

Ashok Leyland
September 01, 2014 Ambit Capital Pvt. Ltd. Page 21
Explanation of Investment Rating Investment Rating Expected return
(over 12-month period from date of initial rating)
Buy >5%
Sell <5%
Disclaimer
This report or any portion hereof may not be reprinted, sold or redistributed without the written consent of Ambit Capital. AMBIT Capital Research is disseminated and available primarily electronically, and, in some cases, in printed form.
Additional information on recommended securities is available on request.
Disclaimer 1. AMBIT Capital Private Limited (“AMBIT Capital”) and its affiliates are a full service, integrated investment banking, investment advisory and brokerage group. AMBIT Capital is a Stock Broker, Portfolio
Manager and Depository Participant registered with Securities and Exchange Board of India Limited (SEBI) and is regulated by SEBI 2. The recommendations, opinions and views contained in this Research Report reflect the views of the research analyst named on the Research Report and are based upon publicly available information
and rates of taxation at the time of publication, which are subject to change from time to time without any prior notice. 3. AMBIT Capital makes best endeavours to ensure that the research analyst(s) use current, reliable, comprehensive information and obtain such information from sources which the analyst(s) believes to
be reliable. However, such information has not been independently verified by AMBIT Capital and/or the analyst(s) and no representation or warranty, express or implied, is made as to the accuracy or completeness of any information obtained from third parties. The information or opinions are provided as at the date of this Research Report and are subject to change without notice.
4. If you are dissatisfied with the contents of this complimentary Research Report or with the terms of this Disclaimer, your sole and exclusive remedy is to stop using this Research Report and AMBIT Capital shall not be responsible and/ or liable in any manner.
5. If this Research Report is received by any client of AMBIT Capital or its affiliate, the relationship of AMBIT Capital/its affiliate with such client will continue to be governed by the terms and conditions in place between AMBIT Capital/ such affiliate and the client.
6. This Research Report is issued for information only and should not be construed as an investment advice to any recipient to acquire, subscribe, purchase, sell, dispose of, retain any securities. Recipients should consider this Research Report as only a single factor in making any investment decisions. This Research Report is not an offer to sell or the solicitation of an offer to purchase or subscribe for any investment or as an official endorsement of any investment.
7. If 'Buy', 'Sell', or 'Hold' recommendation is made in this Research Report such recommendation or view or opinion expressed on investments in this Research Report is not intended to constitute investment advice and should not be intended or treated as a substitute for necessary review or validation or any professional advice. The views expressed in this Research Report are those of the research analyst which are subject to change and do not represent to be an authority on the subject. AMBIT Capital may or may not subscribe to any and/ or all the views expressed herein.
8. AMBIT Capital makes no guarantee, representation or warranty, express or implied; and accepts no responsibility or liability as to the accuracy or completeness or currentess of the information in this Research Report. AMBIT Capital or its affiliates do not accept any liability whatsoever for any direct or consequential loss howsoever arising, directly or indirectly, from any use of this Research Report.
9. Past performance is not necessarily a guide to evaluate future performance. 10. AMBIT Capital and/or its affiliates (as principal or on behalf of its/their clients) and their respective officers directors and employees may hold positions in any securities mentioned in this Research
Report (or in any related investment) and may from time to time add to or dispose of any such securities (or investment). Such positions in securities may be contrary to or inconsistent with this Research Report.
11. This Research Report should be read and relied upon at the sole discretion and risk of the recipient. 12. The value of any investment made at your discretion based on this Research Report or income therefrom may be affected by changes in economic, financial and/ or political factors and may go down as
well as up and you may not get back the full or the expected amount invested. Some securities and/ or investments involve substantial risk and are not suitable for all investors. 13. This Research Report is being supplied to you solely for your information and may not be reproduced, redistributed or passed on, directly or indirectly, to any other person or published, copied in whole
or in part, for any purpose. Neither this Research Report nor any copy of it may be taken or transmitted or distributed, directly or indirectly within India or into any other country including United States (to US Persons), Canada or Japan or to any resident thereof. The distribution of this Research Report in other jurisdictions may be strictly restricted and/ or prohibited by law or contract, and persons into whose possession this Research Report comes should inform themselves about such restriction and/ or prohibition, and observe any such restrictions and/ or prohibition.
14. Neither AMBIT Capital nor its affiliates or their respective directors, employees, agents or representatives, shall be responsible or liable in any manner, directly or indirectly, for views or opinions expressed in this Report or the contents or any errors or discrepancies herein or for any decisions or actions taken in reliance on the Report or inability to use or access our service or this Research Report or for any loss or damages whether direct or indirect, incidental, special or consequential including without limitation loss of revenue or profits that may arise from or in connection with the use of or reliance on this Research Report or inability to use or access our service or this Research Report.
Conflict of Interests 15. In the normal course of AMBIT Capital’s business circumstances may arise that could result in the interests of AMBIT Capital conflicting with the interests of clients or one client’s interests conflicting with
the interest of another client. AMBIT Capital makes best efforts to ensure that conflicts are identified and managed and that clients’ interests are protected. AMBIT Capital has policies and procedures in place to control the flow and use of non-public, price sensitive information and employees’ personal account trading. Where appropriate and reasonably achievable, AMBIT Capital segregates the activities of staff working in areas where conflicts of interest may arise. However, clients/potential clients of AMBIT Capital should be aware of these possible conflicts of interests and should make informed decisions in relation to AMBIT Capital’s services.
16. AMBIT Capital and/or its affiliates may from time to time have investment banking, investment advisory and other business relationships with companies covered in this Research Report and may receive compensation for the same. Research analysts provide important inputs into AMBIT Capital’s investment banking and other business selection processes.
17. AMBIT Capital and/or its affiliates may seek investment banking or other businesses from the companies covered in this Research Report and research analysts involved in preparing this Research Report may participate in the solicitation of such business.
18. In addition to the foregoing, the companies covered in this Research Report may be clients of AMBIT Capital where AMBIT Capital may be required, inter alia, to prepare and publish research reports covering such companies and AMBIT Capital may receive compensation from such companies in relation to such services. However, the views reflected in this Research Report are objective views, independent of AMBIT Capital’s relationship with such company.
19. In addition, AMBIT Capital may also act as a market maker or risk arbitrator or liquidity provider or may have assumed an underwriting commitment in the securities of companies covered in this Research Report (or in related investments) and may also be represented in the supervisory board or on any other committee of those companies.
Additional Disclaimer for U.S. Persons 20. The research report is solely a product of AMBIT Capital 21. AMBIT Capital is the employer of the research analyst(s) who has prepared the research report 22. Any subsequent transactions in securities discussed in the research reports should be effected through J.P.P. Euro-Securities, Inc. (“JPP”). 23. JPP does not accept or receive any compensation of any kind for the dissemination of the AMBIT Capital research reports. 24. The research analyst(s) preparing the research report is resident outside the United States and is/are not associated persons of any U.S. regulated broker-dealer and that therefore the analyst(s) is/are
not subject to supervision by a U.S. broker-dealer, and is/are not required to satisfy the regulatory licensing requirements of FINRA or required to otherwise comply with U.S. rules or regulations regarding, among other things, communications with a subject company, public appearances and trading securities held by a research analyst account.
Additional Disclaimer for Canadian Persons 25. AMBIT Capital is not registered in the Province of Ontario and /or Province of Québec to trade in securities nor is it registered in the Province of Ontario and /or Province of Québec to provide advice
with respect to securities. 26. AMBIT Capital's head office or principal place of business is located in India. 27. All or substantially all of AMBIT Capital's assets may be situated outside of Canada. 28. It may be difficult for enforcing legal rights against AMBIT Capital because of the above. 29. Name and address of AMBIT Capital's agent for service of process in the Province of Ontario is: Torys LLP, 79 Wellington St. W., 30th Floor, Box 270, TD South Tower, Toronto, Ontario M5K 1N2
Canada. 30. Name and address of AMBIT Capital's agent for service of process in the Province of Montréal is Torys Law Firm LLP, 1 Place Ville Marie, Suite 1919 Montréal, Québec H3B 2C3 Canada.
© Copyright 2014 AMBIT Capital Private Limited. All rights reserved.
Ambit Capital Pvt. Ltd. Ambit House, 3rd Floor 449, Senapati Bapat Marg, Lower Parel, Mumbai 400 013, India. Phone: +91-22-3043 3000 Fax: +91-22-3043 3100 CIN: U74140MH1997PTC107598 www.ambitcapital.com