company presentation -...
TRANSCRIPT

Company Presentation
April 2017

DISCLAIMER
The information contained herein pertaining to SIBUR (the "Company") has been provided by the Company solely for use at this presentation. By attending this presentation, or by reading these presentation slides, you agree to be bound by the limitations set out below. This presentation does not constitute or form part of, and should not be construed as, an offer, solicitation or invitation to sell or issue, or any solicitation of any offer to purchase or subscribe for, any securities of the Company, nor shall any part of it nor the fact of its distribution form part of, or be relied on in connection with, any contract or investment decision relating thereto. No representation or warranty, either express or implied, is made as to, and no reliance should be placed on, the fairness, accuracy, completeness, correctness or reliability of the information contained herein. It should not be regarded by recipients as a substitute for the exercise of their own judgment. The Company accepts no responsibility for any losses howsoever arising, directly or indirectly, from this presentation or its contents. The material contained in this presentation is presented solely for information purposes and is not to be construed as providing investment advice. As such, it has no regard to the specific investment objectives, financial situation or particular needs of any recipient. There may be material variances between estimated data set forth in this presentation and actual results, and between the data set forth in this presentation and corresponding data previously published by or on behalf of the Company. This presentation contains forward-looking statements, including (without limitation) statements containing the words "anticipates," "expects," "intends," "may," "plans," “forecasts,” "projects," "will," "would", "targets,“ “believes” and similar words. These statements are based on the current expectations and projections of the Company about future events and are subject to change without notice. All statements, other than statements of historical fact, contained herein are forward-looking statements. Forward-looking statements are subject to inherent risks and uncertainties, such that future events and actual results may differ materially from those set forth in, contemplated by or underlying such forward-looking statements. The Company may not actually achieve or realize its plans, intentions or expectations. There can be no assurance that the Company's actual results will not differ materially from the expectations set forth in such forward-looking statements. Factors that could cause actual results to differ from such expectations include, but are not limited to, the state of the global economy, the ability of the petrochemical sector to maintain levels of growth and development, risks related to petrochemical prices and regional political and security concerns. The above is not an exhaustive list of the factors that could cause actual results to differ materially from the expectations set forth in such forward-looking statements. The Company and its Affiliates are under no obligation to update the information, opinions or forward-looking statements in this presentation.
2
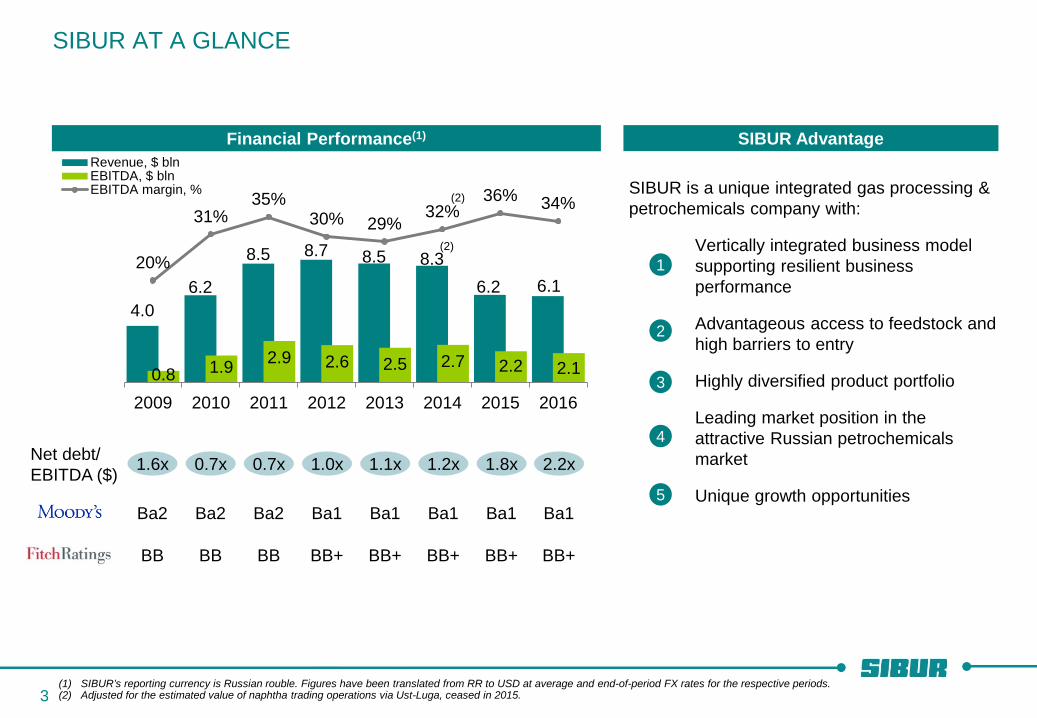
4.0 6.2
8.5 8.7 8.5 8.3 6.2 6.1
0.8 1.9 2.9 2.6 2.5 2.7 2.2 2.1
20%
31% 35%
30% 29% 32%
36% 34%
2009 2010 2011 2012 2013 2014 2015 2016
Revenue, $ blnEBITDA, $ blnEBITDA margin, % (2)
(2)
SIBUR AT A GLANCE
(1) SIBUR’s reporting currency is Russian rouble. Figures have been translated from RR to USD at average and end-of-period FX rates for the respective periods. (2) Adjusted for the estimated value of naphtha trading operations via Ust-Luga, ceased in 2015.
Financial Performance(1)
Net debt/ EBITDA ($)
SIBUR is a unique integrated gas processing & petrochemicals company with:
Vertically integrated business model supporting resilient business performance
Advantageous access to feedstock and high barriers to entry
Highly diversified product portfolio
Leading market position in the attractive Russian petrochemicals market
Unique growth opportunities
SIBUR Advantage
1
2
3
4
5
1.6x
Ba2
BB
0.7x
Ba2
BB
0.7x
Ba2
BB
1.0x
Ba1
BB+
1.1x
Ba1
BB+
1.2x
Ba1
BB+
1.8x
Ba1
BB+
3
2.2x
Ba1
BB+

4 (1) Numbers based on 2016 FY. (2) Associated petroleum gas is oil-based feedstock. (3) Natural gas liquids include raw NGL, LPG (liquefied petroleum gas), naphtha are gas-based feedstock.
LOGISTICS CLIENTS SUPPLIERS
NGLs(3) (6.2 mtpa) Natural gas (18.2 bcmpa)
Feedstock (3.4 mtpa)
Feedstock &
Energy
Gross sales: ₽ 196 bln
EBITDA margin:
30.9%
EXTERNAL SOURCING OF
HYDROCARBON FEEDSTOCK
APG(2)
(21.9 bcmpa)
NGLs(3)
(3.4 mtpa)
Olefins & Polyolefins Gross sales:
₽ 107 bln EBITDA margin:
45.5%
Plastics, Elastomers & Intermediates Gross sales:
₽ 132 bln EBITDA margin:
23.8%
PETROCHEMICALS
1. Vertically integrated business model supporting resilient business performance
SIBUR OPERATES A UNIQUE VALUE CHAIN(1)
(1.1 mtpa)
(2.3 mtpa)

YAMAL-NENETS AUTONOMOUS AREA
KHANTY-MANSI AUTONOMOUS AREA
Purovsky GCP (NOVATEK)
Gubkinskiy GPP
Muravlenkovskiy GPP
Vyngapurovskiy GPP
Nyagan GPP
Nizhnevartovskiy GPP
Belozerniy GPP
Yuzhno-Priobskiy GPP
Tobolsk production site
PYT-YAKH
TOBOLSK
PUROVSK
NOYABRSK
TYUMEN REGION
Yuzhno-Balykskiy GPP
UNIQUE LARGE-SCALE TRANSPORTATION AND FEEDSTOCK PROCESSING INFRASTRUCTURE IN WESTERN SIBERIA
2. Advantageous access to feedstock and high barriers to entry
SIBUR / third-party gas processing plant (GPP)
SIBUR / third-party compressor station
third-party gas condensate plant
SIBUR gas fractionation unit (GFU)
SIBUR propane dehydrogenation facility (PDH)
SIBUR polymers production SIBUR / third-party loading rack
SIBUR owns and operates the largest and most extensive infrastructure for processing and transportation of feedstock in Western Siberia:
8(1) out of 10 gas processing plants (GPP)
APG processing capacity of 25.4(1) bcm p.a.
Raw NGL processing capacity of 8.0 mmtpa at flagship gas fractionation unit (GFU) in Tobolsk (out of 9.5 mmtpa of the Company’s total capacity)
Pipeline network of 2,708 km
4 railway loading racks (out of 6 operated by Feedstock & Energy segment)
ECONOMIES OF SCALE
INTEGRATED INFRASTRUCTURE HIGH BARRIERS TO ENTRY
SIBUR / third-party power plant
SIBUR / third-party APG pipeline Gazprom condensate pipeline SIBUR / Gazprom natural gas pipeline SIBUR raw NGL pipeline truck transportation
5 (1) Including Yuzhno-Priobskiy GPP operated under JV.

Hyd
roca
rbon
Fee
dsto
ck
Purc
hasi
ng E
xpen
ses
SECURED ACCESS TO FEEDSTOCK
Notes: (1) Billion cubic metres. (2) 49% of APG supplied by Rosneft to the GPPs of its JV with SIBUR. In March 2014, SIBUR gained full control over the JV via acquisition of a 49% stake from Rosneft. (3) 49% of raw NGL produced at the GPPs of the JV between SIBUR and Rosneft. These volumes were obtained by Rosneft and sold to SIBUR. In March 2014, SIBUR gained full control over
the JV via acquisition of a 49% stake from Rosneft. (4) IHS CERA. (5) CDU TEK.
13.0 13.9 19.4
21.2 21.9 18.7 19.6
20.8
2012 2013 2014 2015 2016
0
10
20
30
40
50
60
2005 2010 2015 2020 2025 20300
20
40
60
80
100
2005 2010 2015 2020 2025 2030
1.9 2.1 2.2
3.4 3.6 2.6 2.8
3.4
2012 2013 2014 2015 2016
24.7 25.6 25.8 27.9 26.3
7.3 9.4 20.5 22.4 22.4 32.0 35.0 46.4 50.3 48.7
2012 2013 2014 2015 2016
Outlook for Feedstock-Rich Gas Production in Russia(4)
90% of APG supplies for 2017 guaranteed under multi-year contracts WA maturity of supply
contracts – 15.1 years
NOVATEK Gazprom Rosneft Gazprom Neft
RussNeft
Key Supply Contracts as of 31 December 2016
APG NGLs
93% of NGLs supplies for 2017 guaranteed under multi-year contracts WA maturity of supply
contracts – 16.9 years
SIBUR’s Feedstock Purchases
Associated Petroleum Gas Unstable Gas Condensate mln tonnes 2016 APG flaring –
c.13%(5) of produced volumes
bcm(1)
mln tonnes
bcm(1)
SIBUR’s purchases Purchases from Rosneft in JV(3)
SIBUR’s purchases Rosneft’s share in APG purchases(2)
₽ bln
APG NGLs
APG
N
GLs
2. Advantageous access to feedstock and high barriers to entry
6

(1) Based on 2016FY. (2) External sales. (3) LPG, naphtha and raw NGL.
F&E (Feedstock & Energy) O&P (Olefins & Polyolefins) PE&I (Plastics, Elastomers & Intermediates)
7
3. Highly diversified product portfolio
DIVERSE DRIVERS AND END-MARKETS(1)
Key end-markets
Petrochemicals, fractionation FMCG, construction, packaging
Residential applications
Power, utilities
FMCG, construction, automotive, fuels, chemicals, petrochemicals
Key drivers
Commodity cycle, global oil prices Transportation costs
and export duties
Indexation of regulated natural gas prices
Import substitution Demand/supply in multiple end-customer
markets
Demand/supply in multiple end-customer markets Natural rubber prices for synthetic rubbers
Correlation with oil prices S
Currency nature
$ ₽ Domestic sales Export sales
EBITDA (₽ bln) and
margin
61 49
32
Liquids(2) Natural Gas
Revenue(2) structure 100%
30%
70% 24%
76% 36%
64%
30.9% 45.5% 23.8%

51 49
LDPE
65
35
Ole
fins
&
Poly
olef
ins
Plas
tics,
ela
stom
ers
and
inte
rmed
iate
s
LEADING PLAYER IN THE HIGH-GROWTH DOMESTIC MARKET
2015
2015
2015
%
%
MEG
Others SIBUR’s share
Growth Fundamentals
Kg per Capita Consumption of Polyolefins
Polypropylene Polyethylene (LDPE)
Source: IHS, Market Report, IISPR.
SIBUR’s Share in Russia’s Production Capacity
4
4
6
8
Russia
China
Eastern Europe
Western Europe
7
14
13
18
Russia
China
Central Europe
Western Europe
72
28
BR
47 53
SBR SBS
% % %
100
%
4. Leading market position in the attractive Russian petrochemicals market
44 56
Polypropylene
%
17
83 55
45 %
PET
%
Expandable polystyrene
8
Russia Consumption Growth Outlook
CAGR, 2016-2022
5.0%
3.3%
3.3%
2.5%
2.4%
2.0%
2.0%
1.9%
LLDPE
PP
MEG
PVC
HDPE
PET
EPS
LDPE

Western Europe
PETROCHEMICALS
FEEDSTOCK
PETROCHEMICALS AND END-PRODUCTS
FEEDSTOCK
>6,000 km
>4,000 km
Long distances with infrastructural constraints
Significant export duties for naphtha and LPG in Russia Ample feedstock
base
Significant export duties for naphtha and LPG in Russia
SIBUR’s production assets China and Northeast Asia
EFFICIENT MONETISATION OF STRANDED FEEDSTOCK
5. Unique growth opportunities
SIBUR’s petrochemical hub
in Tobolsk
Naphtha price(1)
Notes: (1) USD per tonne. (2) USD per tonne of polyethylene, assuming naphtha consumption ratio of 2.2x, and net of by-product credits. (3) USD per tonne of polyethylene. (4) USD per tonne of LPG-mix (propane and butane). (5) USD per tonne of olefins, assuming LPG-mix consumption ratio of 1.35x.
Transportation to W.Europe(3)
PE
pric
e in
Wes
tern
Eur
ope
Illustrative HDPE price build-up
LPG price in Europe(4)
Transport & export duties(4)
LPG price in Tobolsk(4)
LPG feedstock cost in Tobolsk(5)
HDPE production cost net of by-product credits(3)
Wes
tern
Eur
ope
Tobo
lsk
Naphtha feedstock cost(2)
Total cost for producers(3)
HDPE production cost (3)
Total cost for producers(3)
9

(1) Source: IHS 2015, SIBUR estimates.
ZAPSIBNEFTEKHIM (ZAPSIB-2): EXPANSION OF POLYOLEFINS PRODUCTION IN TOBOLSK
5. Unique growth opportunities
10
Strong Position on the Global Cost Curve (2019)(1) HDPE and LLDPE Spreads to Feedstock
0
500
1,000
1,500
2,000
2,500PE CFR China - LPG spread LPG, West Europe, CIF NWE
PE HDPE Blow Moulding CFR China PE LLDPE Film CFR China
$ per tonne
Project Overview
Propane
Ethylene 1,500 Ethylene
cracking unit (ECU)
’000 tonnes
Ethane
N-Butane
HDPE - 350
HDPE - 350
LLDPE / HDPE - 400
LLDPE / HDPE - 400
PP - 500 Propylene
525
ECU
CONFIGURATION
PE Units
PP Unit
LICENSOR EP C
1.5 mtpa of ethylene 525 ktpa of propylene 100 ktpa of crude C4
1.5 mtpa of PE
0.5 mtpa
ME Avg NA Avg
NEA Avg WE Avg
0
500
1,000
1,500
2,000
2,500
0.0 50.0 100.0 150.0 200.0
1. Zapsibneftekhim 2. Tobolsk-Polymer 3. Sibur-Kstovo 4. Tomskneftekhim
ME – Middle East, NA – North America, NEA – Northeast Asia, WE – Western Europe
$ per tonne
Cumulative capacity (‘000 000 tonnes)
Ethylene Propylene
1 1
2 3 3 4 4
NA Avg
NEA Avg
ME Avg
WE Avg

11
ZAPSIB-2 PROGRESS UPDATE
Progress Update as of 28 February 2017, %
21
58
87
100
Construction
Procurement
Detail Engineering
FEED
Project Residual Budget for 2017-2020(1)
$ 5.8 bln
$ 30%
€ 30%
₽ 40%
Funding Sources Project Budget
65%
10%
25%
SIBUR own funds
NWF and RDIF(2)
ECA(3)
(1) Data as of 31 December 2016. Numbers and respective percentages calculated based on exchange rates as of 31 December 2016; RR/USD at 60.7, RR/EUR at 63.8. (2) Cash balances as of 31 December 2016. NWF stands for National Wealth Fund. RDIF stands for Russian Direct Investment Fund. (3) Undrawn amount of ECA (Export Credit Agency).
Overall progress as of 28 February 2017: 41%
Overall progress by major units as of 28 February 2017:
Steam cracker – 44%
PE unit – 30%
PP unit – 33%
RR 193 bln invested by 2016EY
More than 11,000 construction workers at the site as of 28 February 2017
Please follow the link to see the video of the construction site: https://www.sibur.ru/en/press-center/video/
5. Unique growth opportunities

1. Business Description: Additional Details
2. Key Recent Financials
3. Market Prices
12

EXTENSIVE ASSET BASE THROUGHOUT RUSSIA
Salekhard ●
Kemerovo ●
Tyumen ●
Omsk ●
Samara ● ● Ufa
Voronezh ●
● Saint-Petersburg
Tver●
Tula●
● Nizhniy Novgorod
Kursk●
● Tomsk Krasnoyarsk ●
● Purovsk Moscow●
Tobolsk ●
WESTERN SIBERIA
WESTERN SIBERIA Largest oil & gas
reserves region in Russia
22 tcm
48 bln bbl Proven oil reserves
Proven gas reserves
Joint Ventures
facilities operated under JVs
Energy Products
gas processing & fractionation, MTBE & other fuel additives
Petrochemicals
basic polymers synthetic rubbers plastics & organic synthesis
intermediates other chemicals
Logistics
raw NGL pipeline transshipment facility in Ust-Luga operated by SIBUR
Khanty-Mansiysk ● ● Perm
13
● Svobodny

ENERGY PRODUCTS
C1 C2
Methane (gas) Ethane (gas)
C3-4 C5-6 C7+
Propane (gas / liquid) Butane (gas / liquid)
Isobutane (gas / liquid)
Pentane (liquid) Isopentane (liquid)
Hexane (liquid)
Heavy fractions
Liquefied Petroleum Gas (LPG) Naphtha
Raw Natural Gas Liquids (Raw NGL)
Oil
Natural Gas
Associated Petroleum Gas (APG)
fractions can be used as petrochemical feedstock
14

MULTIPLE PRODUCTS, GEOGRAPHIES AND CUSTOMER GROUPS
Over 1,400 large customers…
…from more than 80 countries
…representing diverse range of end-customer industries
…with low customer concentration
…and balanced contract / spot sales structure
5%
6%
16%
25%
20%
58%
Plastics, Elastomers& Intermediates
Olefins & Polyolefins
Feedstock & Energy
Top-10 Largest customer
Customer Concentration Contract / Spot Structure of Sales 2016 2016
62% 54% 39%
38% 46% 61%
Feedstock &Energy
Olefins &Polyolefins
Plastics,Elastomers &Intermediates
Spot Contract
58 29
7 5 1
22
11
7 15 4
11
10
6 5
9
Total Group Sales Breakdown
Other
Asia CIS
Europe Russia
Other
LPG
Naphtha
Natural gas
MTBE and fuel additives
BOPP films
PP, PE
2016
%
By products By region
15
%
Plastics and organic synthesis products
Elastomers
Intermediates and other chemicals

24
Skovorodino
Chayandinskoye
Kovyktinskoye
Blagoveshchensk Irkutsk
Amur GPP (Gazprom)
Amur Chemical Plant (SIBUR)
WESTERN SIBERIA
EASTERN SIBERIA
Svobodny
Power of Siberia Gas Pipeline
GAZPROM AND SIBUR – JOINT INVESTMENT PROJECT ON CONSTRUCTION OF GAS PROCESSING AND CHEMICAL HUB IN AMUR REGION
(1) Billion cubic metres. (2) Million cubic metres.
60 mcm(2)
42 bcm(1) Gas processing capacity
Helium production capacity
Products: methane, ethane, propane, butane, pentane-
hexane fraction
16

1. Business Description: Additional Details
2. Key Recent Financials
3. Market Prices
17

6.2 6.1
2015 2016
(1.4%)
379.9 411.8
2015 2016
18
SIBUR FINANCIAL SUMMARY(1)
Operating Cash Flow Revenue Investing Cash Flow(3)
Rus
sian
Rou
bles
, bln
(1) Values in USD estimated based on average RR/USD rate of 67.0349 and 60.9579 in 2016 and 2015, respectively . (2) Adjusted EBITDA, including share of the Group’s portion in joint ventures and associates EBITDA (3) Includes CapEx and M&A.
+8.4%
289.2 308.7
2015 2016
Operating Expenses
+6.7%
4.5 4.6
2015 2016
+1.6%
Adj. EBITDA Operating Cash Flow Operating Expenses Investing Cash Flow(3)
USD
Equ
ival
ents
, bln
(il
lust
rativ
e)
Revenue
119.1 137.7
2015 2016
+15.6% 123.4 142.2
2015 2016
2.0 2.1
2015 2016
+5.1%
+15.3%
2.0 2.1
2015 2016
+4.8%
141.7 149.2
2015 2016
EBITDA(2)
+5.3%
2.3 2.2
2015 2016
(4.3%)
EBITDA(2)
Share of JVs and associates EBITDA

19
119.1 (84.4)
(40.4)
186.0
(18.1) (14.9)
(2.9)
144.4
Net OCF CapEx(1) M&A Net borrowings
Dividends paid
Interest paid
Other Net CF
(145.7) 137.7
(64.0)
(16.2) (21.9) (1.4)
(111.4)
Net OCF CapEx(1) Net debt repayment/settlement
Dividends paid
Interest paid
Other Net CF
CASH FLOW STATEMENT HIGHLIGHTS
FY 2015 Cash Flow Reconciliation
RR bln
FY 2016 Cash Flow Reconciliation
Net cash from operating activities increased by 17.3% y-o-y on higher EBITDA, adjusted for the changes in certain provisions, primarily related to Tyumenenergo lawsuit (closed in July 2015) positive impact from WC changes on higher trade and other payables …partially offset by higher income tax paid
Net cash used in investing activities increased by 15.3% y-o-y on substantial increase in CapEx due to expansive ZapSib-2 financing …partially compensated by M&A activities in 2015
Net cash used in financing activities attributable to substantial debt repayment as opposed to new borrowings for ZapSib-2 financing and Yugragazpererabotka acquisition in 2015
Key Factors
RR bln
(1) Includes purchase of property, plant and equipment, intangible assets and other non-current assets.

DEBT PROFILE
20
Key Figures
RR bln, except as stated 31 Dec 2016 31 Dec 2015 Change, % Total debt 341.8 457.1 (25.2%)
Conventional debt 182.1 299.0 (39.1%) ZapSibNeftekhim related debt 159.7 158.1 1.0%
Cash & cash equivalents 60.6 172.1 (64.8%) Net debt 281.2 285.1 (1.4%)
Conventional net debt 163.4 247.2 (33.9%)
ZapSibNeftekhim related net debt 117.8 37.9 210.8%
WA loan tenor (years) 6.8 6.3 WA Conventional debt 2.7 2.7 WA ZSN related debt 11.4 13.0
Available credit lines, incl. 184.5 287.7 (35.9%) Committed 112.5 169.9 (33.8%)
31 Dec 2016 31 Dec 2015
Debt / EBITDA 2.4x 3.4x
Net debt / EBITDA 2.0x 2.1x
Conventional net debt 1.2x 1.8x ZSN related net debt 0.8x 0.3x
Leverage Ratios
100%
47%
94%
58%
53%
6%
29% 13%
Unsecured/Secured
Fixed/Floating
Long-term/Short-term
USD/RUB/EUR
Overview
Loan portfolio structure as of 31 Dec’16
Total debt decreased by 25.2% mainly due to: repayment and refinancing of debt denominated
primarily in foreign currencies RR appreciation 31 Dect’16 vs. 31 Dec’15 Net debt moderately decreased mainly on substantial
debt repayments, while financing of ZapSibNeftekhim CapEx from the funds provided by the NWF Net leverage marginally decreased to 2.0x from 2.1x conventional net leverage decreased to 1.2x from 1.8x
on recent debt repayments ZapSibNeftekhim net leverage increased to 0.8x from
0.3x on on-going project financing As of 31 Dec’16, all of the debt was unsecured

LIQUIDITY AND DEBT MATURITY PROFILE(1)
21 (1) Items denominated in USD and EUR are converted into RR at RR/USD and RR/EUR FX rates as of 31 December 2016.
61
112
72
245
22 42 48 51 56
20 13 13 13
157
Liquidity 2017 2018 2019 2020 2021 2022 2023 2024 2025 After 2025
As of 31 December 2016, RR bln
cash & cash equiv.
committed credit lines
uncommitted credit lines
eurobond undrawn EUR ECA loans RR bonds ECA NWF

62 62 62 62
109 109
137 137
193 193
67 Fe
edst
ock
proc
essi
ngca
paci
ty, T
rans
porta
tion
infra
stru
ctur
e
Pet
roch
emic
als
Oth
er
TOTA
L
INVESTMENT PROGRAMME
RR bln (excl. VAT)
2009 – 2016(1)
567 in 8yrs
Transportation infrastructure
Feedstock processing
capacity
Petrochemicals Maintenance, R&D, IT,
and other
TOTAL
(1) CapEx includes purchase of property, plant and equipment, as well as purchase of intangible assets and other non-current assets. (2) The Board of Directors will review the budget later in the year and the number may be revised subject to macroeconomic and market environment.
RR 200 bln(2) (excl. VAT) investment programme approved by SIBUR BoD for 2017
22
ZapSibNeftekhim CapEx
170
330

1. Business Description: Additional Details
2. Key Recent Financials
3. Market Prices
23

Feedstock and Energy
MARKET UPDATE
Rebased to 100
Plastics, Elastomers and Intermediates Rebased to 100
Plastics, Elastomers and Intermediates Rebased to 100
Olefins and Polyolefins Rebased to 100
Source: Argus, Platts, Bloomberg, ICIS, Malaysian Rubber Board, Chemease, Federal Antimonopoly Service of Russian Federation 24
0%20%40%60%80%
100%120%140%160%180%200%220%240%
Natural Rubber Butadiene StyreneBrent ₽/$
0%
20%
40%
60%
80%
100%
120%
140%
160%
Polystyrene MEG MTBEPET Brent ₽/$
0%
20%
40%
60%
80%
100%
120%
140%
160%
Brent NaphthaLPG CIF ARA (large) Natural gasLPG DAF Brest ₽/$
0%
20%
40%
60%
80%
100%
120%
140%
LDPE PP raffia China Main PortPP MRC CPT Moscow Brent₽/$

INVESTOR RELATIONS CONTACTS
[email protected] Phone: +7 (495) 777-55-00 (*39-47) www.investors.sibur.com
25