company presentation november 2020 meeting october 2020
TRANSCRIPT

Meeting October 2020
Company presentation
November 2020

Presenters
Arve ReglandChief Financial Officer
Adam LindhHead of Finance
Arve is CFO of Heimstaden and Fredensborg AS, which he joined in
2019. Prior to joining Heimstaden he was CEO of Entra ASA. He also has
experience from ABG Sundal Collier, Arthur Andersen and EY.
Adam joined Heimstaden 2014, before which he was Vice President at
Situs, a real estate security consultancy firm in Copenhagen. Prior to that
he was Senior Project Manager at HSH Nordbank AG, Copenhagen
branch.
Christian Fladeland
Co-Chief Investment Officer
Christian joined Heimstaden in 2019 as the CIO. Prior to joining
Heimstaden, he was a Partner at Colliers International in Denmark.
Before Colliers, he was at Sadolin & Albæk.

Agenda

Fredensborg majority owner in Heimstaden and Heimavellir
Ownership structure
100%98%1
Institutional
investors
Heimavellir
Property
management
Bostad
Family-owned
private company
51%1
49%1
Fredensborg
ICE efh
Heimavellir
Assets
100%
100%
• Fredensborg functioning as an investment partner
• Heimstaden holds an operative role as an industrial partner
• Long term evergreen investment
Heimstaden establish local property management
(100% ownership)
Intention to move Heimavellir to Heimstaden and
rebrand to Heimstaden Iceland in 2021
Align Heimstaden’s focus on sustainability and social
responsibility
Align Heimstaden’s values and operational practices
Care Share Dare
1) Voting share

51% 49%
The Heimstaden Group
Ownership structure
Heimstaden
Bostad’s current
shareholders
Property owner
Property portfolio
Property and Asset
Management Agreement
Bostad
Institutional Investors
% of votes
41% 6% 2% 1%

Agenda

Heimstaden overview
Note: Rental income is reported earnings capacity. 1) Heimstaden Bostad is rated by S&P and is supported by institutional partners. 2) As defined by S&P with hybrid capital classified as 50% debt and 50% equity. FX EURSEK 10.5712
A leading European residential platform
13.2bnGAV (EUR)
0.7bnRENTAL INCOME (EUR)
2.8xICR
53%LTV2)
100,870HOMES
BBB-(Positive) S&P rating1)

55.3
25.3
13.2 13.0 11.7 11.68.0 7.9 7.7 6.4 5.7 5.3
Vonovia AkeliusDeutsche
Wohnen
Adler / AdoHeimstaden LEG KojamoBalder Grand Citiy Vesteda Tag Wallenstam
GAV (EURbn) and residential units
1
1)415’ 162’ 101’ 138’ 44’ 76’ 41’ 71’ 27’ 35’ 86’ 10’
Among Europe’s leading private residential real-estate companies
1)
Note: Largest privately owned residential real estate companies in Europe, not including state-/government owned companies
Source: Company information, latest reported figures per 28.10.2020. 1) Residential GAV only. FX EURSEK 10.5712
Heimstaden overview

Homes (#)
GAV
(EURm)1GAV
% GAV / sqm
Residential
area
Regulated
income Comment
30,076 4,301 33% 2,090 89% 100% 27 key growth
cities
9,728 3,507 27% 4,021 95% 16% Mostly centrally
located in
Copenhagen
12,635 2,204 17% 2,167 98% 60% Price well below
replacement cost
limits competition
4,589 1,562 12% 7,053 72% -Highly liquid
portfolio of small
residential units
42,544 1,282 10% 488 96% 38%
Moravia-Silesia region, 3rd most densely populated region
1,298 287 2% 3,198 93% 97% Attractive micro locations in Berlin with pipeline
100,870 13,143 100% 1,908 93% 54%
Heimstaden - Diversified portfolio
Σ
Portfolio & financial overview
1) Excluding Heimstaden’s Head office with a GAV of EUR 37m

18,700
EUNO DK SE CZ
8,063
NL DE
15,616
13,441
11,87311,191
3,258
Invested in advanced economies with welfare systems protecting
the downside
Heimstaden overview
Sources: Oxford Economics, Eurostat. 1) Example from Norwegian income and rental growth in Oslo
Strong markets Considerable social support Housing cost burden
AAA Aaa AAA
AAA Aaa AAA
AAA Aaa AAA
AAA Aaa AAA
AAA Aaa AAA
AA- Aa3 AA-
Social benefits spending, EUR per capita, 2017
4.2% 4.2% 6.7% 5.9% 5.7% 4.2% 9.1%
% Unemployment rate
27%26%
23%
22%21%
20%
24%
DE NODK NL SE CZ EU
Share of disposable income spent on housing, 2018

- Everyone needs a place to live
- Governments support housing costsEssential human need
Strong demand- Urbanisation, longer lifespan and smaller households
- Limited new housing supply
- European home ownership at 68%1)
- Drop in value has significant macroeconomic ramificationsCo-investing with the people
- Limited downside from regulated rents significantly below market
- Acquisition below replacement cost - gradual shift to market
Favourable regulatory
environment
Robust “hardware”- Living cannot be digitalised
- Long “facelift” intervals
Why residential
Heimstaden overview
Source: Eurostat. 1) Weighted average

Fully integrated platform ensures quality assets and
Friendly Homes
Friendly Homes
Marketing, customer experience, digital services and sustainable living
Investments Financing Asset management Operations
Heimstaden overview

ESG efforts - 10 key focus areas identified from the UN SDGs
Industry specific impact areas General impact areas
Achieve gender equality and
empower all women and girls
Promote sustained, inclusive and
sustainable economic growth, full and
productive employment and decent
work for all
Promote peaceful and inclusive
societies for sustainable development,
provide access to justice for all and
build effective, accountable and
inclusive institutions at all levels
Reduce inequality within and
among countries
Ensure sustainable
consumption and
production patterns
Protect, restore and
promote sustainable
use of terrestrial
ecosystems
Ensure access to
affordable, reliable,
sustainable and
modern energy
for all
Ensure availability
and sustainable
management of
water and
sanitation for all
Make cities and
human settlements
inclusive, safe,
resilient and
sustainable
Take urgent action
to combat climate
change and its
impacts
Heimstaden overview
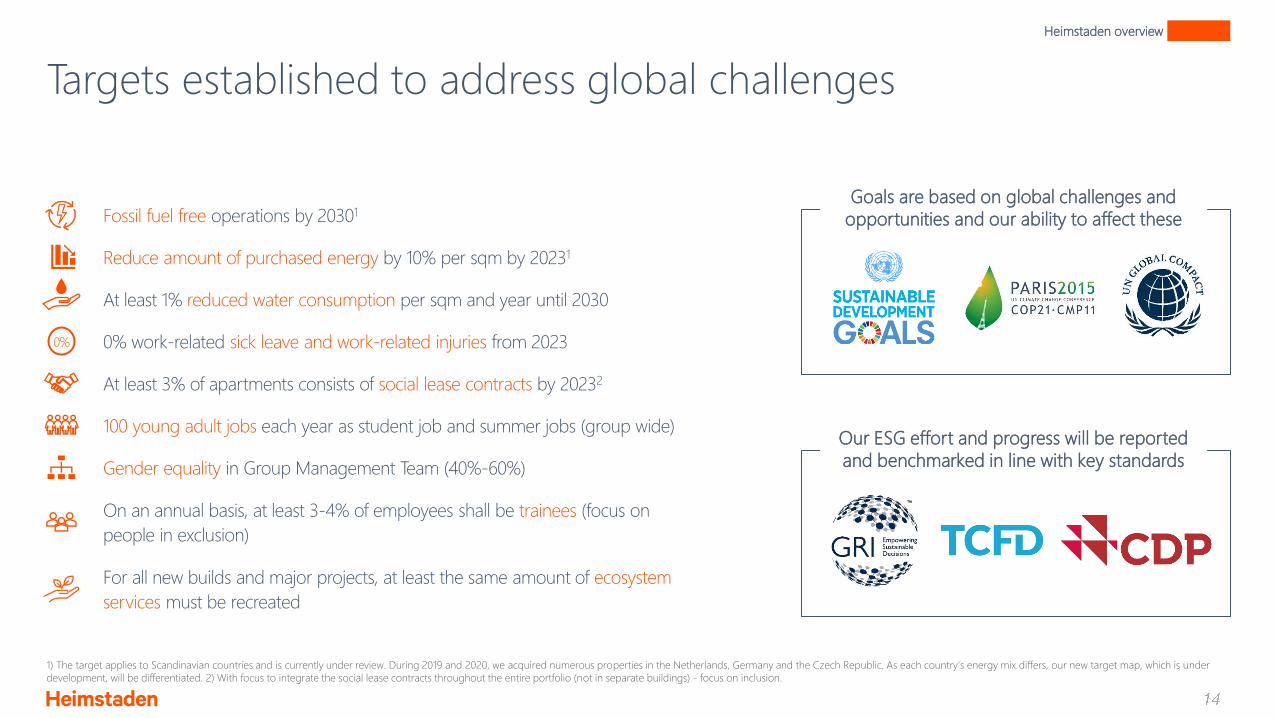
Targets established to address global challenges
Fossil fuel free operations by 20301
Reduce amount of purchased energy by 10% per sqm by 20231
At least 1% reduced water consumption per sqm and year until 2030
0% work-related sick leave and work-related injuries from 2023
100 young adult jobs each year as student job and summer jobs (group wide)
At least 3% of apartments consists of social lease contracts by 20232
For all new builds and major projects, at least the same amount of ecosystem
services must be recreated
Goals are based on global challenges and
opportunities and our ability to affect these
Our ESG effort and progress will be reported
and benchmarked in line with key standards
1) The target applies to Scandinavian countries and is currently under review. During 2019 and 2020, we acquired numerous properties in the Netherlands, Germany and the Czech Republic. As each country's energy mix differs, our new target map, which is under
development, will be differentiated. 2) With focus to integrate the social lease contracts throughout the entire portfolio (not in separate buildings) - focus on inclusion.
Gender equality in Group Management Team (40%-60%)
On an annual basis, at least 3-4% of employees shall be trainees (focus on
people in exclusion)
Heimstaden overview
0%

Actions & achievements 2020
● Support to tenants affected by Covid-19
● Social screening of new suppliers – labour
conditions, human rights, social impact
● Pilot project: “Sustainability coaches in student
housing”
● Social lease contracts:
– SE approx. 1.6% of total
– CZ approx. 2% of total
– Dialogues initiated with local authorities in
NO and DK
● Community Manager program to address
involuntary loneliness in SE
● Sustainability governance and reporting
process implementation in CZ
● Increased reporting capacity (GRI Standards,
Scope 3, CDP)
● Group Sustainability Controller at Group
Controlling function
● New function: Group Energy Management
● Sustainability Managers in CZ and NL.
Recruiting ongoing for SE
● Digital onboarding and training, including
sustainability and code of conduct, developed
and ready to be launched
● Updated Code of Conduct for employees
Heimstaden overview
● Completed mapping of GHG emissions, scope
1-3
● First CDP report submitted August 2020
● Switched to 100% renewable, origin certified
electricity in Denmark
● Started construction of three solar PV projects
in Sweden1
● Hired Environmental Manager Emma Bauer to
lead sustainability work regarding newbuilds,
major renovations, supply chain and EMS
● Planning of sustainability task force
● Systematic energy efficiency approach,
supported by intelligent, modern and cost-
efficient technologies

Agenda
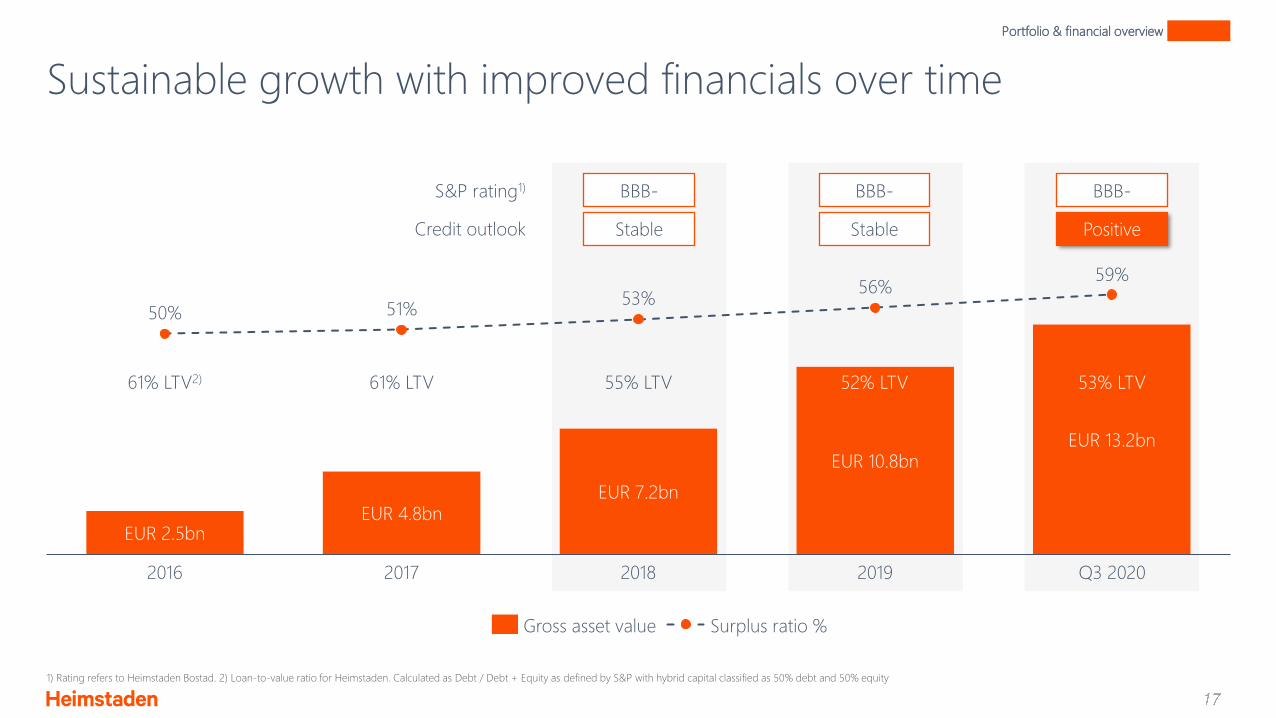
Sustainable growth with improved financials over time
Portfolio & financial overview
S&P rating1)
Credit outlook
BBB-
Stable
BBB-
Stable
BBB-
Positive
Gross asset value Surplus ratio %
50% 51%53%
56%59%
2018 2019
EUR 2.5bn
20172016
EUR 4.8bnEUR 7.2bn
EUR 10.8bnEUR 13.2bn
Q3 2020
61% LTV2) 61% LTV 55% LTV 52% LTV 53% LTV
1) Rating refers to Heimstaden Bostad. 2) Loan-to-value ratio for Heimstaden. Calculated as Debt / Debt + Equity as defined by S&P with hybrid capital classified as 50% debt and 50% equity

Diversified and well-distributed debt profile
Funding sources maturity profile Unencumbered assets Cost of debt and loan tenor
8.0
Q3 2020
1.7%
Q2 202020192017
1.9%1.8%
2018
1.8%1.7%
7.8
10.1 9.9 9.9
Average interest rate Average loan tenor (years)
EUR billion
• Undrawn revolving credit facilities of
EUR 1.3 billion
2023 20242020 20252021 20272022 2026 2028<
0.3
0.8
0.5
0.9
1.2
0.80.8
2.1
0.9
Bonds
Bank debt
Hybrid
Cert
Realkredit
Portfolio & financial overview
100%
94%
73%
35%
7%
35%
NL DKCZ NO DE
0%
SE Total

Increasing Hedge Ratio
Portfolio & financial overview
Hedge ratio policy1 changed to 75% from 50% in Q1 2020…
1) Refers to Heimstaden Bostad Financial Policy
…Hedge ratio in line with peers, e.g. DW, ADO/ADLER & GC
57%
69%
76% 76%
85%
Q3 2020Q2 2020Q3 2019 Q4 2019 Q1 2020
75%
93%
62%
95%
85%
NOKSEK TotalDKK EUR
Hedge ratio in each currency
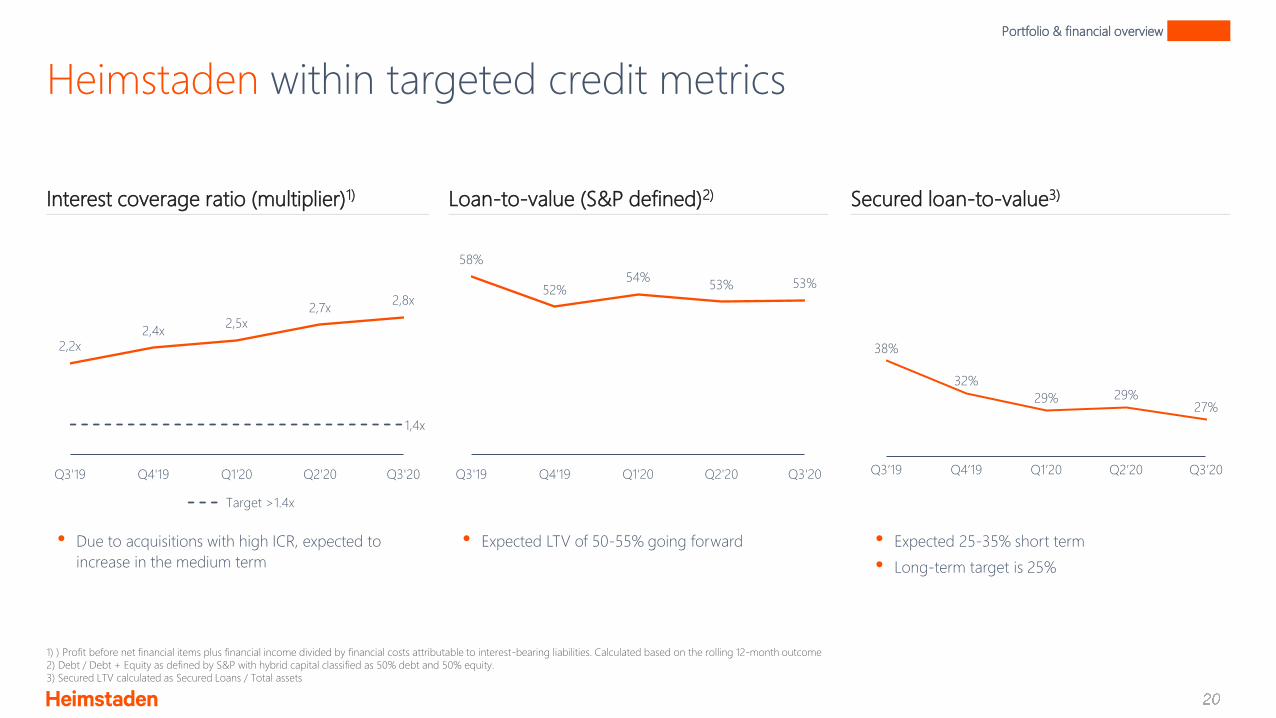
1,4x
2,2x2,4x
2,5x2,7x
2,8x
Q3'19 Q4'19 Q1'20 Q2'20 Q3'20
Target >1.4x
58%
52%54%
53% 53%
Q3'19 Q4'19 Q1'20 Q2'20 Q3'20
Heimstaden within targeted credit metrics
Portfolio & financial overview
1) ) Profit before net financial items plus financial income divided by financial costs attributable to interest-bearing liabilities. Calculated based on the rolling 12-month outcome
2) Debt / Debt + Equity as defined by S&P with hybrid capital classified as 50% debt and 50% equity.
3) Secured LTV calculated as Secured Loans / Total assets
Interest coverage ratio (multiplier)1) Loan-to-value (S&P defined)2) Secured loan-to-value3)
• Due to acquisitions with high ICR, expected to
increase in the medium term
• Expected LTV of 50-55% going forward
38%
32%
29% 29%27%
Q3’20Q3’19 Q4’19 Q1’20 Q2’20
• Expected 25-35% short term
• Long-term target is 25%

Heimstaden Standalone - Strong income stream
Note: 2019 refers to the income and financial cost for Heimstaden Standalone. 2019 pro-forma refers to the financial income and financial cost for Heimstaden Standalone after the properties in Heimstaden has been sold to Heimstaden Bostad. Not
including any potential income increase from the increased GAV in Heimstaden Bostad
Portfolio & financial overview
Figures in EUR million Comment 20192019
pro-forma
Net Operating Income NOI from previously
owned property
portfolio, foremost NL30 -
Net Management Fee 2 2
Cash dividend Actual dividend from
2019 paid in cash 67 67
Operating Income 99 67
Financial costs Reduced after sale of
property portfolio,
foremost NL-22 -10
Hybrid bonds -10 -10
Preference shares -4 -4
Financial costs -36 -24
ICR 2.8x 2.8x
• Net Management Fee calculated as a percentage of the
market value of Heimstaden Bostad’s property portfolio less
Heimstaden’s related costs
• Dividend payouts:
Class A pref share: percentage of the market value of
Heimstaden Bostad’s property portfolio
Class B pref share: calculated based on Heimstaden Bostad’s
loan-to-value
Common shares: subject to Heimstaden Bostad’s
dividend policy

Heimstaden Standalone - Solid asset base
Portfolio & financial overview
Net asset value
2 0892 021
197
CashShares in
subsidiaries
37
-284
Investment
properties
-19
BondsLoan
amount
Net asset
value
• Robust core holding with attractive underlying assets
Heimstaden Bostad is rated BBB- (positive outlook) by
S&P
Heimstaden has a strong commitment to its holding in
Heimstaden Bostad
All acquisitions of residential assets within the EU
(including the UK, Switzerland and Norway) will be
made by Heimstaden Bostad
• Heimstaden Standalone has net LTV of 5%
Including EUR 284 hybrids, net LTV is 22%
EUR million

Recently added former senior analyst from S&P to our new Ratings team. The
former senior analyst has experience with over 1,100 public S&P ratings across
various sectors and criteria.
Implementing new strategy to improve S&P rating to BBB+ in
Heimstaden Bostad
1) EBITDA Interest Coverage as defined by S&P with hybrid capital classified as 50% debt and 50% equity
2) Debt / Debt + Equity as defined by S&P with hybrid capital classified as 50% debt and 50% equity
Addition of new talent
In Q1 2021, Heimstaden Bostad will look to improve S&P’s Management &
Governance scoring, which is a key element that S&P looks for in a BBB+
rating. The improvement is as the result of governance and risk investments.
● Targeted interest coverage ratio1) growth to achieve a durable 3.0x to 3.5x.
● Expecting to maintain loan-to-value2) of 50%-54% in the medium term.
● Policy of >75% fixed rate loans to ensure limited interest rate risk.
● Ensuring S&P liquidity metrics remain well above the minimum threshold.
Investing in the non-
financial aspects
Building a BBB+
financial profile……
……while maintaining
BBB+ quality policies
Portfolio & financial overview
Investor information
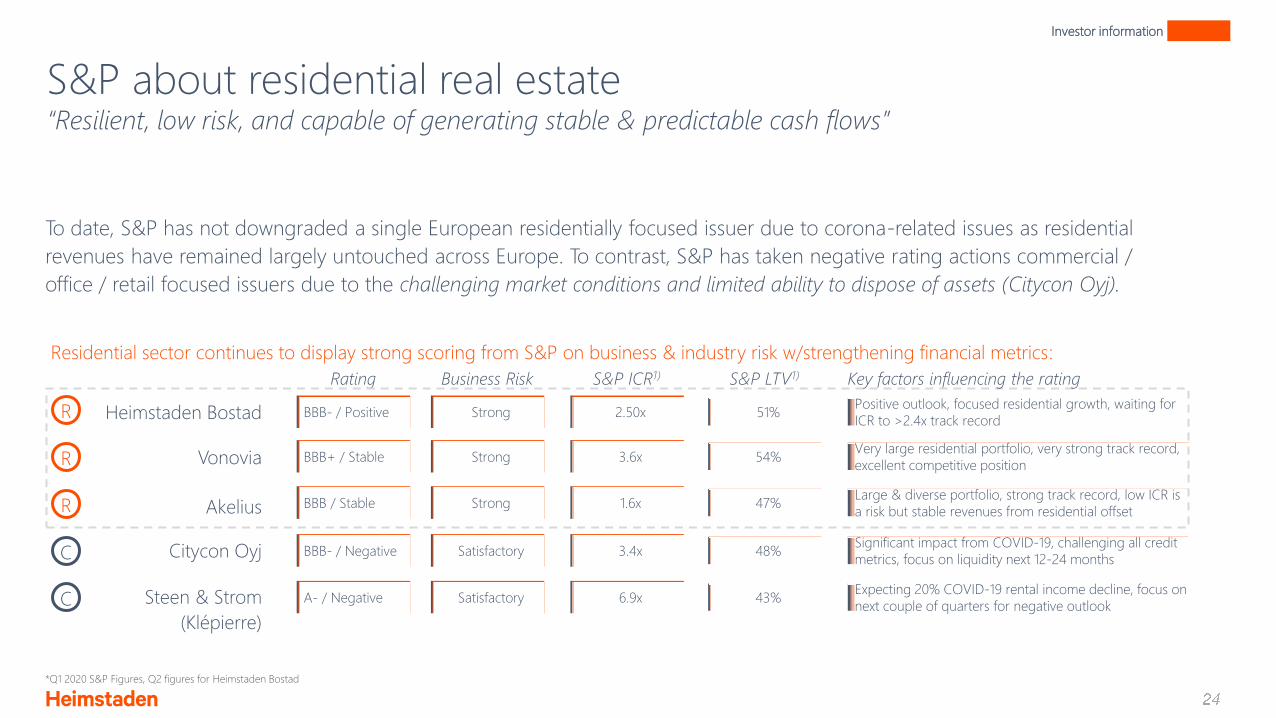
S&P about residential real estate“Resilient, low risk, and capable of generating stable & predictable cash flows”
To date, S&P has not downgraded a single European residentially focused issuer due to corona-related issues as residential
revenues have remained largely untouched across Europe. To contrast, S&P has taken negative rating actions commercial /
office / retail focused issuers due to the challenging market conditions and limited ability to dispose of assets (Citycon Oyj).
Rating
R
R
R
C
BBB / Stable
BBB- / Negative
Heimstaden Bostad
Vonovia
Akelius
Citycon Oyj
C Steen & Strom
(Klépierre)
A- / Negative
BBB+ / Stable
BBB- / Positive
Business Risk
Strong
Satisfactory
Satisfactory
Strong
Strong
S&P ICR1)
1.6x
3.4x
6.9x
3.6x
2.50x
S&P LTV1)
47%
48%
43%
54%
51%
Key factors influencing the rating
Large & diverse portfolio, strong track record, low ICR is
a risk but stable revenues from residential offset
Significant impact from COVID-19, challenging all credit
metrics, focus on liquidity next 12-24 months
Expecting 20% COVID-19 rental income decline, focus on
next couple of quarters for negative outlook
Very large residential portfolio, very strong track record,
excellent competitive position
Positive outlook, focused residential growth, waiting for
ICR to >2.4x track record
*Q1 2020 S&P Figures, Q2 figures for Heimstaden Bostad
Residential sector continues to display strong scoring from S&P on business & industry risk w/strengthening financial metrics:

Agenda

Why Iceland?
• Sound economic prospects
• Prudent fiscal policy
• Diversification across geographical and
financial risk-factors
• Favorable demographic outlook
• young and growing population
• High yet declining household size
• Pre-mature and growing rental market
• Declining home ownership rate
• Falling average household size
74.1%Home ownership rate
27.8Gini coefficient
• Egalitarian Nordic country
• Ideal cultural match with Heimstaden
• Based on scandinavian values
2.5Average household
size
2.8%Real GDP CAGR
2010-19’
Heimstaden in Iceland
Source: Oxford Economics, Statistics Iceland, Iceland Registers

Heimstaden in Iceland
1) Q3 2020
2) Net debt / GAV
Continue to grow our position as market leader with largest residential portfolio
in Iceland
Growth through acquisitions of standing assets and developments
Best in class operations with customer-centric solutions
Reach critical scale of ~3,000-4,000 units concentrated in capital area
1,581Residential units
53%Net LTV2
48,142Gross asset value (mISK)
2,173Net rental income LTM
(mISK)
184,000Average monthly rent per
unit (ISK)
93Average unit size (sqm)
Provide long-term friendly homes for our tenants
Portfolio metrics1 Our vision
Heimstaden in Iceland

Growth strategy
● Preferably small efficient residential units that are affordable by the many
● >90% of rental income from residential assets
● Acquisitions of standing assets and new developments
Focus on long term sustainable growth
● Assets located in the capital area and up-to ~45-minute drive from Reykjavík
● Focus on locations with good transportation and proximities to e.g. schools,
groceries and recreational areas
● Focus on risk adjusted long-term returns
● Active asset management utilizing value add potential by executing
business plans including e.g. unit splits and renovations
● Sustainability is an integrated part of ensuring the long-term value of our
investments
● We aim for positive impact on the local community, supporting long-term
relationships with our stakeholders
Sustainable growth
Heimstaden in Iceland
Residential assets
Strong locations
Risk-adjusted return
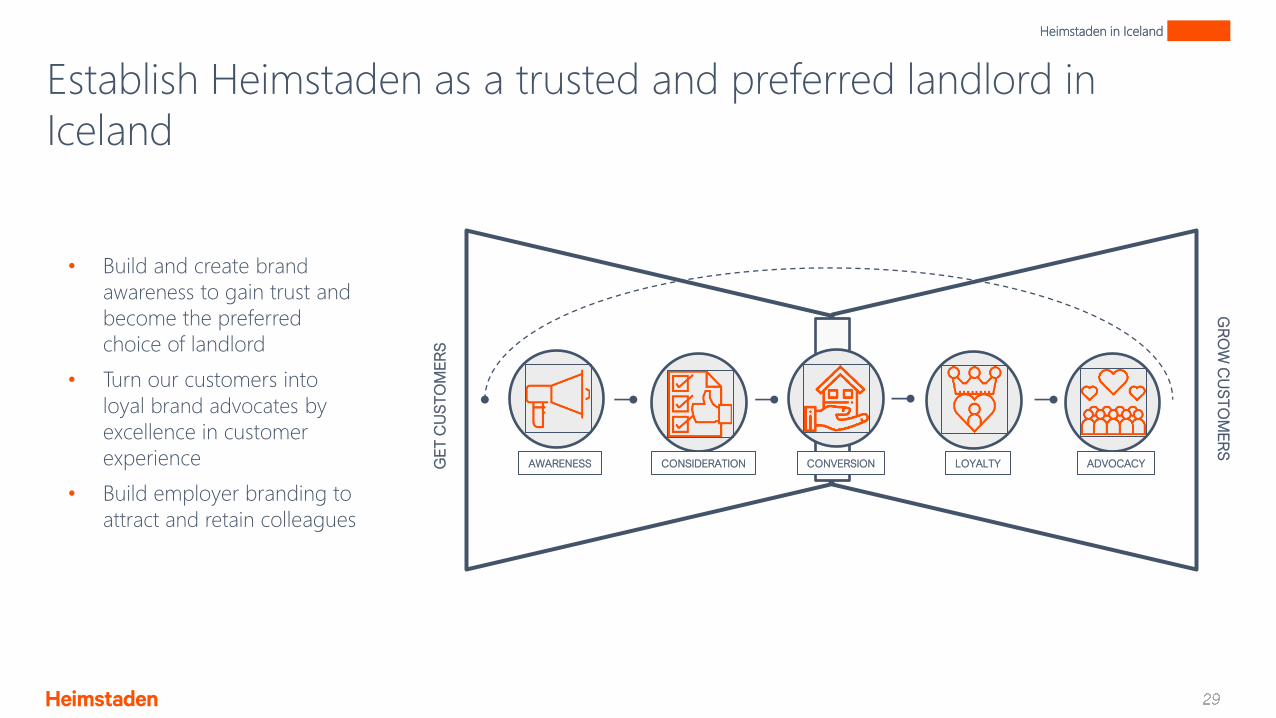
Establish Heimstaden as a trusted and preferred landlord in
Iceland
Heimstaden in Iceland
GE
T C
US
TO
ME
RS
GR
OW
CU
ST
OM
ER
S
CONVERSION LOYALTY ADVOCACYCONSIDERATIONAWARENESS
• Build and create brand
awareness to gain trust and
become the preferred
choice of landlord
• Turn our customers into
loyal brand advocates by
excellence in customer
experience
• Build employer branding to
attract and retain colleagues


HST earning capacity, 12 months
Figures in EUR million Q3 2020
Rental income 689
Property costs -308
Net operating income 382
Central administration -26
Other operating income -
Other operating expenses -
Profit from participation in associated companies -
Profit before financial items 355
Financial income -
Financial expenses - Interest bearing liabilities -124
Income from property management 231
Key data -
Surplus ratio (%) 55.4
ICR (multiplier) 2.9
Note: FX EURSEK 10.5712

Statement of comprehensive income Q3 2020Figures in EUR million Q3 20201) Q2 20201) Q1 20201) 20192)
Rental income 164 167 147 460
Property costs -67 -63 -67 -202
Net operating income 98 104 81 258
Central administration -6 -7 -6 -16
Other operating income 1 1 2 3
Other operating expenses -1 -3 -1 -4
Profit from participation in associated companies -2 0 0 19
Profit before financial items 91 95 77 258
Financial income 2 3 2 5
Financial expenses - Interest bearing liabilities -36 -34 -31 -109
Other financial costs3) -4 -5 -4 -18
Financial costs, right-of-use assets -1 -1 -1 -3
Currency gains and losses -3 11 11 -13
Income from property management 48 68 55 122
Change in value of investment properties 240 151 181 616
Change in the value of financial instruments 2 -21 -12 -10
Profit before tax 290 198 224 729
Current tax -10 -16 -14 -25
Deferred tax -56 -16 -53 -137
The result of the period 224 165 158 568
Other comprehensive income -81 -99 -73 41
Comprehensive income 143 66 85 609
Note: FX EURSEK 10.5712. 1) 3 months comprehensive income. 2) 12 months comprehensive income. 3) Other financial costs + other financial income

Balance sheet – assets
Figures in EUR million 30 September 2020 31 December 2019
Assets
Goodwill 7 7
Investment Property 13,180 10,757
Leases, right-of-use 66 85
Tangible fixed assets 6 3
Financial instruments 8 -
Other financial non-current assets 117 87
Total non-current assets 13,383 10,938
Development properties and tenant-owned apt in
progress97 82
Accounts receivable 7 2
Other receivables 133 100
Prepayments and accrued income 31 32
Cash and cash equivalents 908 1,011
Total current assets 1,176 1,227
Total assets 14,559 12,166
Note: FX EURSEK 10.5712

Balance sheet – equity and liabilities
Figures in EUR million 30 September 2020 31 December 2019
Equity 6,656 5,670
Liabilities
Interest-bearing secured liabilities 3,896 3,760
Interest-bearing unsecured liabilities 2,736 1,614
Leasing liability 66 85
Financial instruments - 6
Deferred tax liabilities 470 344
Total non-current liabilities 7,169 5,809
Interest-bearing secured liabilities 13 108
Interest-bearing unsecured liabilities 487 378
Accounts payable 30 31
Current liabilities 30 19
Other current liabilities 97 94
Accrued costs and prepaid income 78 56
Total current liabilities 735 686
Total equity and liabilities 14,559 12,166
Note: FX EURSEK 10.5712