comparability of blind and sighted subject test scores as
TRANSCRIPT
University of Central Florida University of Central Florida
STARS STARS
Retrospective Theses and Dissertations
Summer 1982
Comparability of Blind and Sighted Subject Test Scores as Comparability of Blind and Sighted Subject Test Scores as
Affected by Mode of Test Presentation Affected by Mode of Test Presentation
Gary A. Meiseles University of Central Florida
Part of the Industrial and Organizational Psychology Commons
Find similar works at: https://stars.library.ucf.edu/rtd
University of Central Florida Libraries http://library.ucf.edu
This Masters Thesis (Open Access) is brought to you for free and open access by STARS. It has been accepted for
inclusion in Retrospective Theses and Dissertations by an authorized administrator of STARS. For more information,
please contact [email protected].
STARS Citation STARS Citation Meiseles, Gary A., "Comparability of Blind and Sighted Subject Test Scores as Affected by Mode of Test Presentation" (1982). Retrospective Theses and Dissertations. 645. https://stars.library.ucf.edu/rtd/645
COMPARABILITY OF BLIND AND SIGHTED SUBJECT TEST SCORES AS AFFECTED BY MODE OF TEST PRESENTATION
BY
GARY A. MEISELES B.A., Fairleigh Dickinson University, 1976
THESIS
Submitted in partial fulfillment of the requirements for the Master of Science degree in Industrial Psychology
in the Graduate Studies Program of the College of Arts and Sciences University of Central Florida
Orlando, Florida
Summer Term 1982
1.
2.
3.
4.
TABLE OF CONTENTS
INTRODUCTION ............................................... METHOD.
RESULTS • •.•.••..••...•....•••..••.•..•••.•.•.••..••...•••..•
DISCUSSION ......••...•...•••....•.•.•••.........•••..•.•..••
5. APPENDICES
6.
A.
B.
c.
Subject Consent Form •.•..•..•.•••.•.••.••.•••...•••..••
Personal Information Sheet ••••••.••••••.•••••••.••.•.••
Verbal and Numerical Test Score Means ••••••••.••••••••.
REFERENCES . ....•...............•.•.....•...... ••...•••.....••
iii
1
18
24
30
36
38
40
42
On March 16, 1980 two hundred twenty-five blind people gathered in
New Delhi, India in order to present a petition to Prime Minister Indira
Gandhi. The petition was a request to be granted status as a special
backward class. This would have granted them more rights, and provided
better conditions than they then enjoyed. The Indian police beat back
the peaceful demonstrators with bamboo canes used as clubs.
One eyewitness gave the following account:
••• the blind, who had sticks in their hands with which they grope their way, put up whatever little resistance they could and in the process, without knowing who their enemy was, they hurt their own brethern.
With their black goggles falling off, their chappals (sandals) missing and their sticks being snatched by the police, blood oozing from their heads and faces and their clothes getting torn in the struggle, it was a pathetic scene to look at (Sentinel Star, March 18, 1980, p. 12-A).
The blind in the United States are not treated as poorly as those
in India, but they are persecuted in more subtle, yet equally
destructive ways. Less than one-third of working age visually
handicapped persons were in the labor force as of June, 1979.
Additionally, a mere 80% of that visually handicapped labor force was
actually employed. This is in contrast to the overall labor force which
includes three-fourths of the U.S. population, with 92% of that labor
force actually employed (Kirchner and Peterson, 1979).
Kirchner and Peterson also found that the visually disabled
attained fewer high prestige occupations, but were over-represented in
the "blue-collar" occupations. They speculated that the cause of this
discrepancy might be any combination of three general issues: (1)
discrimination, (2) discouragement, and (3) disincentives to work.
2
There is presently a bill, S.446, before the Senate known as the
"Equal Employment Opportunity for Handicapped Act of 1979", and if
passed it will bring handicapped workers under coverage of Title VII of
the 1964 Civil Rights Act. The 1973 Rehabilitation Act only extends
protection to the handicapped when dealing with Federal contractors and
sub-contractors, so this bill, which is expected to pass, will fill the
gap into which most handicapped workers currently fall.
Once this bill is passed there will be a rush to validate all
selection tools for the various types of handicapped people. The blind
will fall under the protection of this bill, which indicates a need to
determine the most efficient and accurate mode for presenting a test to
both blind and sighted job applicants.
The question of whether or not a test validated on a sighted
population is valid for use on a blind population has been considered
for a number of years. In 1914 Irwin and Goddard modified the 1911
edition of the Binet scales for use by the blind. Irwin, being blind
himself, used his personal judgement in eliminating items that were
inappropriate for use by the blind, and added items from other sources
to replace the ones that he had eliminated.
Haines (1916) reported the results of a new test, the Point Scale
for the Blind, which incorporated much of Irwin's material. Haines used
a point scale rather than an age scale because an age scale requires a
very large population for validation purposes, and for determining at
3
what age level a particular item belongs. When point scales are used,
similiar items are grouped together in order to make the test easier to
administer. The final score, the sum of the correct responses, can then
be compared to age norms in order to determine where the child is in
respect to other children his age. This test was used solely as a way
of eliminating the "feebleminded" from the Ohio State School for the
Blind. In doing so, Haines found that, in general, blind children
matched sighted children very closely in mental ability.
Maxfield (1927) adapted the Stanford Achievement Test for use with
blind children. The 1923 edition of the test was administered in
braille versions to blind students by adapting the directions and the
time limits. In 1933 Maxfield tried to present the Stanford tests
orally, but found that method too demanding on both the subjects and the
tester, and suggested using only a braille edition to help eliminate the
effect of fatigue.
During this period Samuel Hayes started his research on testing of
the blind. He began in 1923 by adapting the Stanford-Binet Scales for
the blind. This adaptation is well known as the "scissors and paste"
adaptation because all inappropriate items were eliminated by pasting an
appropriate item over it. It was not until 1930 that an adapted version
was finally printed by Hayes. Standardization problems became evident
in this adaptation, until the Terman-Merrill Revision of the Binet
became available in 1937.
In 1942, Hayes (1943) adapted the Terman-Merrill Revision for use
with the blind, naming it the Interim Hayes-Binet Intelligence Test for
the Blind. The term ''interim" was used by Hayes because he planned
further revisions of the test as data were collected. Unfortunately,
such adaptations never appeared. Although the content of the test is
dated, psychologists who are able to compensate for its' defects are
still using it.
4
The issue of vocational testing of the blind had been around for
about twenty years before the first major step in that direction was
taken. Bauman, in 1942, adapted the Minnesota Rate of Manipulation and
the Pennsylvania Bi-Manual Worksample tests. She felt that adapting
existing tests was better than creating new ones because the results
from the tests could then be given to potential employers in terms that
they already understood, from tests with which they were familiar.
In 1943 Bauman used five different tests to compare a group of
blind applicants for vocational training. The tests included: two
parts of the Minnesota Rate of Manipulation test, the Pennsylvania Bi
Manual Worksample, the O'Connor Finger Dexterity Test, and a Toolsample
test. A total of 86 subjects, either totally blind or with only light
perception, were used. The subjects' scores were converted to standard
scores, based on norms for sighted persons, in order to provide easy.
comparison with sighted applicants for the program. Bauman found that
the blind groups compared very favorably to the sighted persons.
In 1946 DiMichael prepared a manual for the use of the
Wechsler-Bellevue Intelligence Scale, Interim Hayes-Binet Intelligence
Test for the Blind, Kuhlmann-Anderson Intelligence Tests, Otis
Classification Test, and the Pintner General Ability Tests as measures
"
5
of intellectual development. The manual also included the Kuder General
Interest Survey as a measure of interest, and both the Minnesota
Multiphasic Personality Inventory and the Neyman-Kohlstedt Diagnostic
Test as measures of personality. A number of these_ t .ests were offered
in braille versions with this adaptation.
This early phase of the testing of the blind peaked in 1951 with
the publication, by Bauman and Hayes, of A Manual for the Psychological
Examination of the Adult Blind. This provided detailed information on
numerous tests, including the specific modifications for use with the
blind, and listings of standardization information, including
reliability and validity measures when available for blind populations.
This manual also presented general information that was, and still is,
very important for the examiner who is facing a test with a blind person
for the first time. In discussing this manual in 1972 Bauman said:
"Although that manual is twenty years old and cannot include the many
improved tests and techniques developed during those years, it is still
the only publication purporting to be a manual for the psychologist new
to work with the blind, and copies of it are still requested by
newcomers to the field (p. 190)."
Newland started his work on the Blind Learning Aptitude Test (BLAT)
in 1952 (Newland, 1961), but it was not published until 1969. This test
was developed for the use of the visually handicapped and was not
adapted from a test for the sighted. The BLAT is a tactual test,
similar to the adaptations of Ravens Progressive Matrices, and involves
no braille reading or verbal responses. Along the same lines, Wattron
6
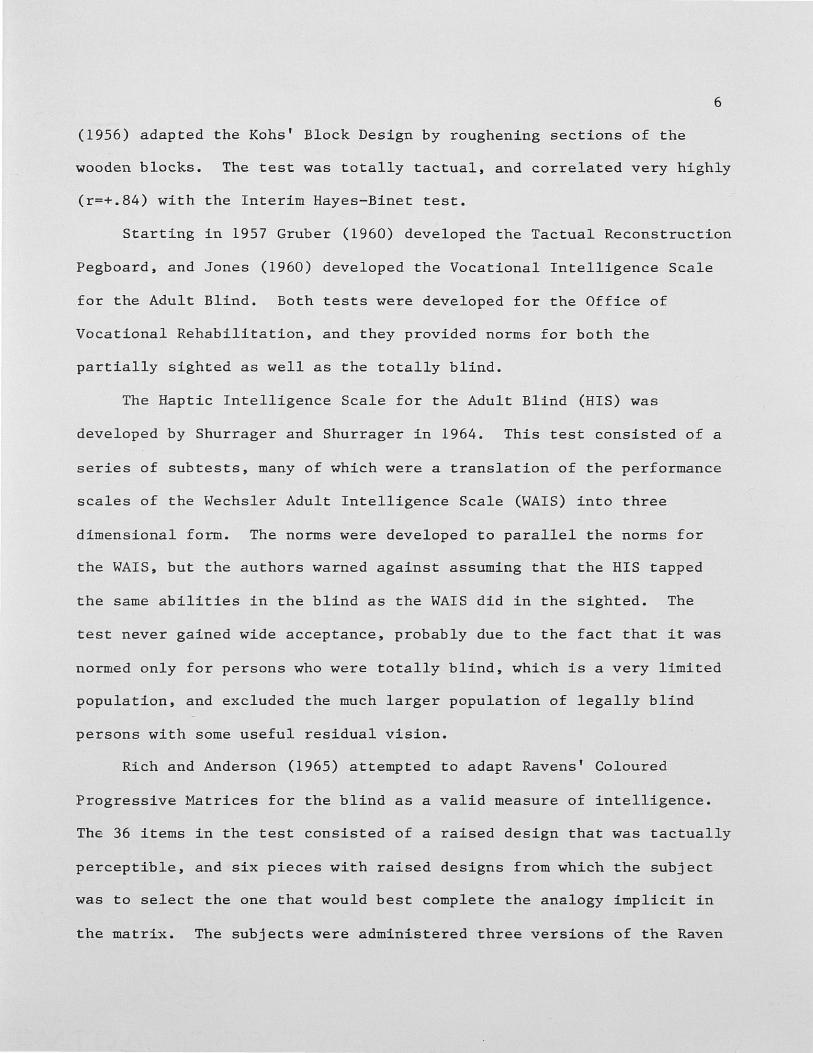
(1956) adapted the Kohs' Block Design by roughening sections of the
wooden blocks. The test was totally tactual, and correlated very highly
(r=+.84) with the Interim Hayes-Binet test.
Starting in 1957 Gruber (1960) developed the Tactual Reconstruction
Pegboard, and Jones (1960) developed the Vocational Intelligence Scale
for the Adult Blind. Both tests were developed for the Office of
Vocational Rehabilitation, and they provided norms for both the
partially sighted as well as the totally blind.
The Haptic Intelligence Scale for the Adult Blind (HIS) was
developed by Shurrager and Shurrager in 1964. This test consisted of a
series of subtests, many of which were a translation of the performance
scales of the Wechsler Adult Intelligence Scale (WAIS) into three
dimensional form. The norms were developed to parallel the norms for
the WAIS, but the authors warned against assuming that the HIS tapped
the same abilities in the blind as the WAIS did in the sighted. The
test never gained wide acceptance, probably due to the fact that it was
normed only for persons who were totally blind, which is a very limited
population, and excluded the much larger population of legally blind
persons with some useful residual vision.
Rich and Anderson (1965) attempted to adapt Ravens' Coloured
Progressive Matrices for the blind as a valid measure of intelligence.
The 36 items in the test consisted of a raised design that was tactually
perceptible, and six pieces with raised designs from which the subject
was to select the one that would best complete the analogy implicit in
the matrix. The subjects were administered three versions of the Raven
7
and the verbal scale of the Wechsler Intelligence Scale for Children
(WISC). The results indicated that the blind children scored much lower
on the Raven adaptations than did sighted subjects on the printed
version. The correlation of the Raven adaptation with the WISC Verbal
IQ was +.31, thereby showing a moderate degree of validity for the Raven
adaptation as a test of intelligence. Rich and Anderson concluded with
the warning that further research was needed before the Raven adaptation
could be used on a clinical basis.
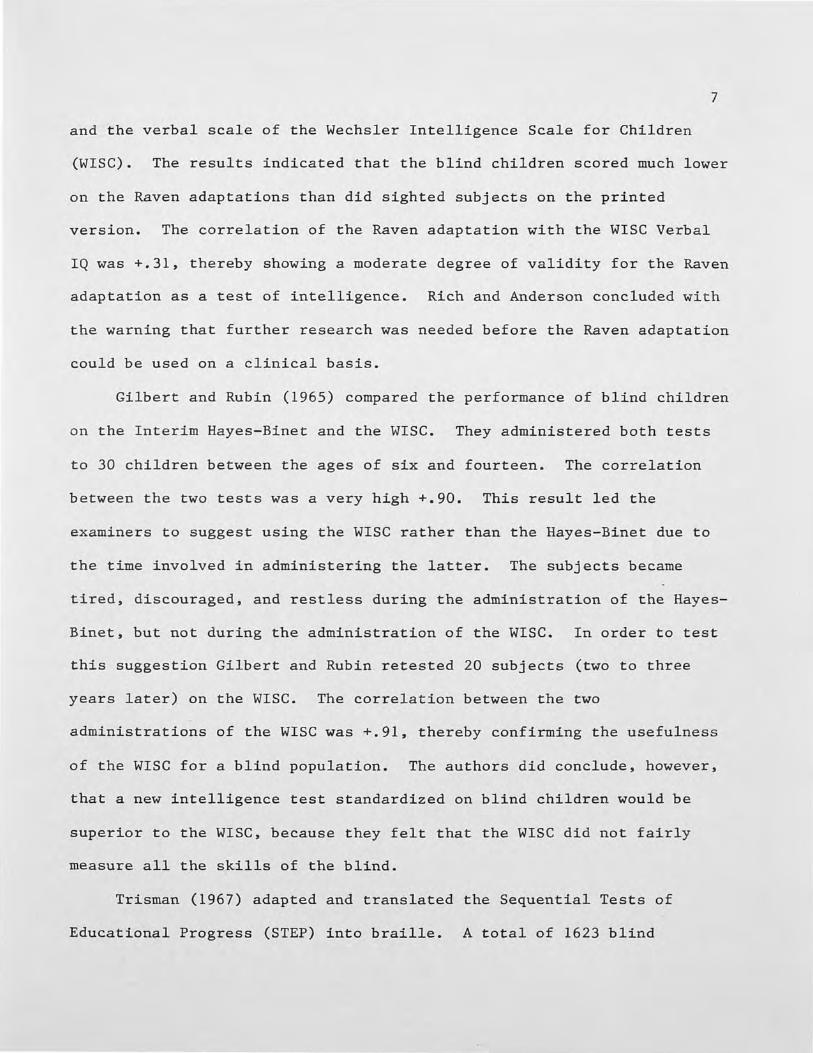
Gilbert and Rubin (1965) compared the performance of blind children
on the Interim Hayes-Binet and the WISC. They administered both tests
to 30 children between the ages of six and fourteen. The correlation
between the two tests was a very high +.90. This result led the
examiners to suggest using the WISC rather than the Hayes-Binet due to
the time involved in administering the latter. The subjects became
tired, discouraged, and restless during the administration of the Hayes
Binet, but not during the administration of the WISC. In order to test
this suggestion Gilbert and Rubin retested 20 subjects (two to three
years later) on the WISC. The correlation between the two
administrations of the WISC was +.91, thereby confirming the usefulness
of the WISC for a blind population. The authors did conclude, however,
that a new intelligence test standardized on blind children would be
superior to the WISC, because they felt that the WISC did not fairly
measure all the skills of the blind.
Trisman (1967) adapted and translated the Sequential Tests of
Educational Progress (STEP) into braille. A total of 1623 blind
8
subjects and 1868 sighted subjects were tested. The sighted subjects
were given two separately timed parts of 35 minutes each, and the blind
subjects were untimed, given the morning for part one, and the afternoon
for part two. The scores were converted in order to compare the scores
on the braille form to the existing norms. Trisman found that the
braille and sighted versions of the test were similar in difficulty, at
least under the conditions in which the test was administered. He also
found that his blind sample was comparable in achievement level to the
national norm sample when the blind were tested with the braille version
of the test.
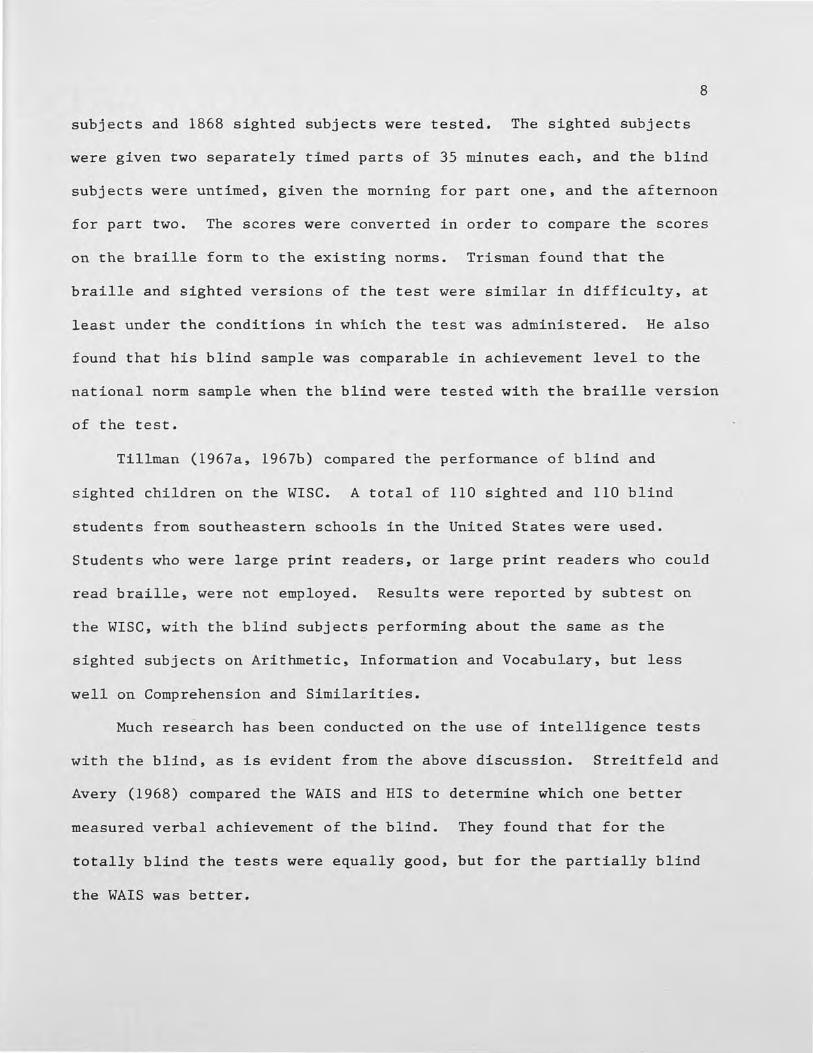
Tillman (1967a, 1967b) compared the performance of blind and
sighted children on the WISC. A total of 110 sighted and 110 blind
students from southeastern schools in the United States were used.
Students who were large print readers, or large print readers who could
read braille, were not employed. Results were reported by subtest on
the WISC, with the blind subjects performing about the same as the
sighted subjects on Arithmetic, Information and Vocabulary, but less
well on Comprehension and Similarities.
Much research has been conduc·ted on the use of intelligence tests
with the blind, as is evident from the above discussion. Streitfeld and
Avery (1968) compared the WAIS and HIS to determine which one better
measured verbal achievement of the blind. They found that for the
totally blind the tests were equally good, but for the partially blind
the WAIS was better.
9
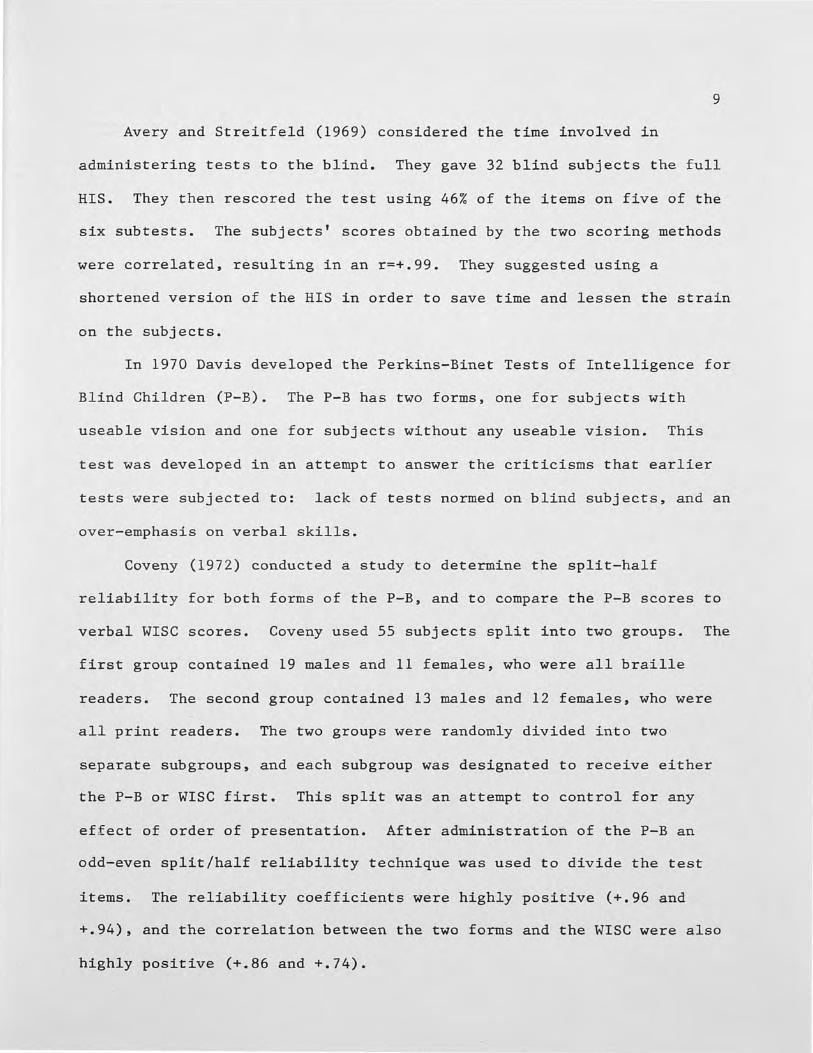
Avery and Streitfeld (1969) considered the time involved in
administering tests to the blind. They gave 32 blind subjects the full
HIS. They then rescored the test using 46% of the items on five of the
six subtests. The subjects' scores obtained by the two scoring methods
were correlated, resulting in an r=+.99. They suggested using a
shortened version of the HIS in order to save time and lessen the strain
on the subjects.
In 1970 Davis developed the Perkins-Binet Tests of Intelligence for
Blind Children (P-B). The P-B has two forms, one for subjects with
useable vision and one for subjects without any useable vision. This
test was developed in an attempt to answer the criticisms that earlier
tests were subjected to: lack of tests normed on blind subjects, and an
over-emphasis on verbal skills.
Coveny (1972) conducted a study to determine the split-half
reliability for both forms of the P-B, and to compare the P-B scores to
verbal WISC scores. Coveny used 55 subjects split into two groups. The
first group contained 19 males and 11 females, who were all braille
readers. The second group contained 13 males and 12 females, who were
all print readers. The two groups were randomly divided into two
separate subgroups, and each subgroup was designated to receive either
the P-B or WISC first. This split was an attempt to control for any
effect of order of presentation. After administration of the P-B an
odd-even split/half reliability technique was used to divide the test
items. The reliability coefficients were h~ghly positive (+.96 and
+.94), and the correlation between the two forms and the WISC were also
highly positive (+.86 and +.74).
10
Numerous other studies dealing with testing of the blind have been
conducted: Tillman and Osborne (1969) gave 12 blind and sighted
subjects the WISC and received varied results, with the blind performing
better on the Digit Span; Eaves and Klonoff (1970) compared 40 blind and
sighted children on the Tactual Performance Test and found no
significant differences between the groups; Bauman (1973) developed an
interest inventory for the blind that did not include activities which
required vision and achieved split/half reliabilities ranging from +.84
to +.92 on the ten scales, but no validity study was attempted.
Morris (1974) adapted the 1973 edition of the Stanford Achievement
Test Series for use by the visually handicapped. The norms for the test
were recomputed to include only those items that were going to appear in
the braille edition after all inappropriate items were eliminated.
Since the tests in this series were power tests there were no time
limits, and therefore no need for adjustment, but more time was allowed
for completion due to the slower braille reading rates. Morris
suggested administering the tests in braille or large print versions,
but they could be administered orally if needed.
There are many related issues in the testing of the blind. A major
debate concerns the mode of presentation to the subject. The most
obvious method, which has already been referred to, is translation into
braille. Auditory methods are also popular, including talking books,
compressed speech, and oral presentation.
The braille system was first developed by Charles Barbier, a French
Army officer, to allow his men to send and receive messages at night.
11
Louis Braille refined the system to meet the needs of the blind for a
method of reading. The method finally gained some acceptance in 1854
when it was further modified by the French School for Blind Children.
In 1869 the Missouri School for the Blind became the first American
school to use the system, but it was not standardized internationally
until 1932 when the United States and England accepted Grade 2 braille
as the standard (Birns, 1976).
Foulke (1970) sees braille as superior to auditory methods of
information processing because the reader can vary his rate at will,
retrace to clarify ambiguous material, and employ format cues ( i.e.
indentations and page numbers) to help him find information (p. 87).
Regardless of these advantages, braille is a very slow method of
reading.
The silent reading speed of sighted high school students is between
250 and 500 words per minute. Sighted adult readers often average 500
to 600 words per minute, with some rates as high as 1,000 words per
minute having been confirmed. Braille, however, is read at an average
of 60 words per minute by junior high school students and 80 words per
minute by senior high school students. Experienced adult braille
readers may attain speeds of 104 words per minute, less than half the
rate of sighted high school students. Subsequent to Foulkes' research,
Crandell and Wallace (1974) developed a training procedure to increase
braille reading rates up to 225 words per minute without a loss of
comprehension.
Braille presently offers 149 whole-word signs, purportedly the most
frequently used words in written English, thereby requiring braille
12
abbreviation (Buckley, 1977). Buckley found that whole-word signs were
not allocated to many common English words, and that many whole-word
signs actually occurred infrequently. He suggested that modifications
be made in the whole-word aspect of braille, but changes of such
magnitude are slow in coming and have yet to be realized.
Many studies have compared different procedures for presenting
material to blind and sighted subjects. Holland (1936) presented the
Otis Classification Test, Part II, in aural form to physically normal
and blind students. The blind were given braille sheets with the
question numbers and the possible answers. They were told to read the
answers as the tester pronounced them, and to then record their answers.
The sighted subjects were given mimeographed material with the same
information as the blind subjects. Results showed that, in general, the
physically normal and blind subjects performed equally well.
Holland performed item analyses on the items on which the blind
performed better than the sighted. He found that, with only one
exception, the sighted missed the longer and more complicated questions.
He concluded that the blind have a wider auditory memory span. That
conclusion seemed supported from his observation that the blind showed
fewer requests to have questions repeated.
Davis and Nolan (1961) presented the Word Meaning sub-test from the
Stanford Achievement Test Series in both braille and aural modes to 336
braille readers. The reported means showed that the subjects scored
highest in the aural modes, although the difference was significant at
only the two lowest grade levels. A more meaningful comparison for this
13
study would have been to compare a group of sighted subjects to a group
of blind subjects, with varying methods of administration.
Nolan (1963) reported that children comprehended story-telling
passages equally well in auditory and tactual modes, but textbook
passages were better comprehended in braille modes. Nolan then varied
the amount of practice with the material to be learned. After this
manipulation it was found that there were no significant differences
between the listening and reading conditions.
Nolan and Morris (1969) conducted a study to compare methods of
listening. Previous research indicated that attentive postures and some
sort of activity during listening aided comprehension. Results showed
that comprehension of materials presented at normal listening rates were
superior to comprehension of materials presented at compressed rates.
Comprehension was highest for the normal listening rate-note taking
mode. As the material increased in level of difficulty the
effectiveness of the note taking also increased.
Tuttle (1972) conducted a study comparing the three most common
modes of material presentation to the blind: braille, normal recording,
and compressed speech recording. Average reading speed is 104 words per
minute, and recordings at normal speeds are a little faster at 175 words
per minute. Compressed speech recording is a fairly new approach to
blind reading. This procedure speeds up the recording without voice or
pitch distortion. This allows for a "reading" speed of 275 words per
minute. This is within the average reading speed of high school seniors
as discussed earlier.
14
Tuttle transcribed the Reading Versatility Test into three modes.
Each of his 104 subjects took three equivalent forms of the test, one in
each mode, with control exercised over the order of presentation.
The subjects spent 31.8 minutes on the reading task in the braille
mode, 16.9 minutes in the normal recording mode, and 11.3 minutes in the
compressed recording mode. The comprehension score was highest for the
braille group, but not significantly so.
Tuttle then computed the Index of Learning Efficiency. This was
computed by dividing the number of correct responses by the number of
minutes spent reading the material. The indices were: .59 for braille,
.92 for normal recording, and 1.36 for compressed speech. These results
indicated that compressed speech was the most efficient mode.
Results such as Tuttles' should not be viewed as a blanket
condemnation of braille. Braille is still the most precise mode for
communicating verbal information to the blind and should still be
employed, especially for complex and technical materials.
Numerous researchers have observed the effects of aural
presentation on blind subjects: Bauman (1958) observed that subjects
that had been blinded for a long time had learned to obtain information
from subtle outside auditory cues, often not evident to the recently
blinded; Nolan and Davis (1967) noted that aural testing should diminish
that part of variance attributable to differences in reading ability;
Bauman (1972) commented that a blind subjects' remaining senses can be
improved by practice; and Carney (1972) observed that it was possible
for the blind to tell when someone was smiling, nervous, tense, or
unsure by his tone of voice.
A major conceptual problem in the testing of the blind has been
raised by numerous researchers, including Gilbert and Rubin (1965):
Some psychologists have held that all those tests in which the results might be influenced in any way by the physical handicap should be avoided since the disadvantage offered to the subject makes an accurate appraisal of his abilities impossible. Others have contended that since one of the purposes of the tests is to evaluate the handicapped person's ability to compete with others not so afflicted, the handicap cannot be ignored, and the afflicted must be evaluated on the same basis as the non-afflicted (p. 238).
As of January 1, 1973, there were only 24,195 legally blind
15
students enrolled in other than college programs throughout the United
States (Morris, 1974). This dearth of available subjects has greatly
hampered attempts to validate tests on a blind population.
Bateman (1965) and Swallow (1979) expressed similar concerns with
the effect of modifying existing tests for the blind. Once the tests
have been modified, in any way, the test is invalidated. One approach
to this problem would be to readapt the test norms using a test
adaptation procedure outlined by Nolan and Davis (1967).
In general, the question of norms should be dictated by the problem
being considered. Bauman (1972) felt that norms for the sighted could
still be used since, in most cases, the blind were being compared to the
sighted. This is especially true in cases of vocational testing where
the blind job applicant is competing against his sighted counterpart.
Malikin and Freedman (1970) stated the issue of norms succinctly:
"In most cases, we can only say that we have compared how a visually
impaired person performs on- a test as compared with a sighted person
whom he resembles in other aspects, not how he performs against himself,
16
or against a population of other visually impaired persons {p. 147).''
In most cases, that comparison is the vital one in vocational testing.
In situations such as this, the use of tests normed on a sighted
population would be acceptable.
Even if the issue of norms is solved by accepting the arguments of
Bauman (1972) and Malikin and Freedman (1970), then one issue remains a
glaring problem for the blind job applicant: most organizations do not
encounter many blind job applicants, and therefore do not have braille
versions of the tests employed for selection on hand. In most cases, an
employee of the organization will read the print version of the test to
the blind applicant. Even if the fact that the reader is not trained
for the task is ignored, the issue still remains concerning the mode of
presentation.
Numerous studies have been conducted comparing an adapted version
of a test (usually into braille) to the printed version of the test
(Rich and Anderson, 1965; Trisman, 1967; Tillman, 1967a; Tillman, 1967b;
Tillman and Osborne, 1969; Morris, 1974, for example). As yet, however,
no research has compared the performance of blind applicants and sighted
applicants on -the same test, but in differing modes of presentation as
in the case of the blind applicant having a print version of a test read
to them. The present study is being conducted in order to attempt to
answer that question. Specific hypotheses include:
I. Blind subjects will not score as well as sighted subjects when
the blind subjects take the test aurally and the sighted subjects take
the test in print.
II. Blind subjects will score better on braille versions of the
test than on aurally presented versions.
III. Blind subjects will not show a significant difference from
sighted subjects when both groups take the test in their respective
print modes.
17
METHOD
Subjects
Two groups of ten subjects each were used in this study. The first
group consisted of five male and five female blind, high school students
from the Florida School for the Deaf and Blind in St. Augustine,
Florida. The second group of subjects consisted of five male and five
female sighted, high school students from various schools in the
Orlando, Florida metropolitan area.
Apparatus
Parallel forms (A and B) of the Verbal and Numerical Personnel
Tests for Industry (PTI) were used. Alternate form reliability for both
the PT! Verbal Test and PTI Numerical Test varied from r= +.73 tor=
+.92. Both the Verbal and Numerical Tests of form A were transcribed
into braille. The Verbal and Numerical Tests of Form B were both
recorded onto audio cassettes.
Sighted subjects were provided with paper and pencil during all
testing conditions and a cassette tape player for the aural testing
conditions. Blind subjects were provided with braille writers and
braille paper during all testing conditions, and a cassette tape player
for the aural testing condition. During administrations of the braille
and aural Numerical Tests to the blind groups, subjects were provided
with an abacus as a substitute for scrap paper. Subject Consent Forms,
and Personal Information Sheets were completed by all subjects in both
groups (Appendices A and B).
19
Procedure
This study required the administration of two tests, one verbal and
one numerical, in a print mode, and then re-administration of both tests
in an aural mode. In actuality it is impossible to administer the same
test twice due to practice effects. To solve this problem parallel
versions of both tests were used. PTI Form A, Verbal and Numerical, was
designated as the form for the print mode of testing (braille for the
blind subjects). PTI Form B, Verbal and Numerical, was designated as
the form for the aural mode of testing.
Although the PTI did not provide norms for blind subjects the use
of a test normed on a sighted population was in line with Malikin and
Freedman (1970) and Bauman (1972). They agreed that such an approach
was appropriate in vocational testing situations because the blind
applicant would be compared to sighted counterparts when applying for
jobs.
In order to procedurally conduct the study, one of the two parallel
forms of the PTI needed to be transcribed into braille. Form A of the
PTI, designated as the print test, was transcribed into braille at the
Rehabilitation Center for the Blind in Daytona Beach, Florida.
The Form A Verbal Test was easily transcribed without any change in
the content of the test. The Form A Numerical Test, however, presented
a unique problem.
Forms A and B of the PTI Numerical Test consisted of mathematical
questions, some of which were accompanied by, or based on, diagrams,
charts or tables. Under ideal conditions the diagrams would be
20
transcribed into braille, thereby keeping the content of the test
intact. The Rehabilitation Center, however, did not have the capability
to transcribe diagrams. It was therefore decided to re-write all of the
diagrammatical questions, in both the Form A and Form B Numerical Tests,
into a verbal form, eliminating the need for the accompanying diagrams.
In re-writing the test items it was decided to retain the interpretive
nature of the items by describing the diagram, and not directly
providing the information from the diagram. The re-written questions
were also inserted in the print version of the test which was to be
presented to the sighted subjects.
As noted earlier, the number of legally blind persons enrolled in
programs, other than college, is extremely limited (Marcus, 1974). Due
to the limited availability of blind persons in the population it was
determined that the blind subjects should be secured and tested before
the sighted subjects were selected. It would then be possible to create
a matched sample of sighted subjects to form the sighted experimental
group.
Queries to the Rehabilitation Center quickly revealed the
difficulty to be encountered in securing a group of blind adults who
were proficient braille readers. The need to control as many extraneous
variables as possible (i.e. age, education, occupation) made the task
more difficult. It was, therefore, decided to obtain a homogeneous
group of blind subjects from the student population at the School for
the Deaf and Blind (SDB) in St. Augustine, Florida.
The SDB is a residential school that prepares deaf and blind
students to deal with their handicaps in the outside world. This is
accomplished in conjunction with a regular school curriculum that
progresses to the twelvth grade level.
21
The Principal for the Blind at the SDB was contacted for help in
securing the group of blind subjects. Due to the lengthy administration
time necessary for the tests (four hours), it was decided to offer ten
dollars ($10) to the first ten student volunteers. Critical data for
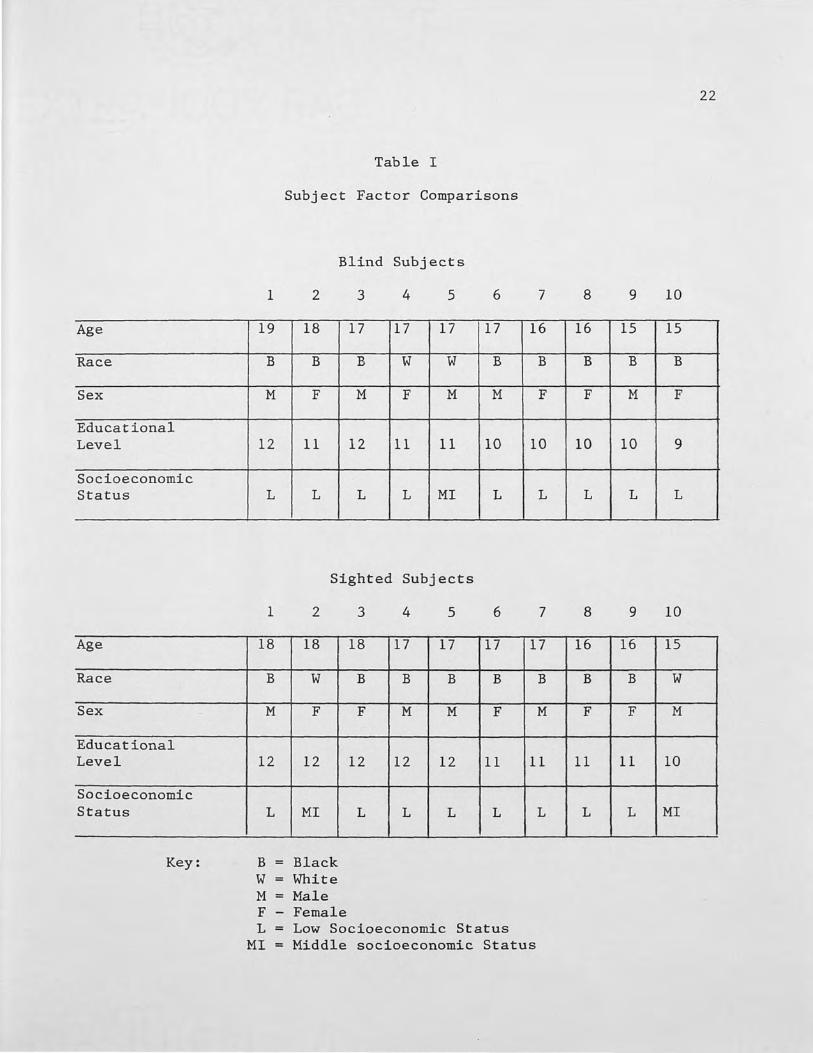
the subjects (age, race, sex, etc.) is summarized in Table I.
The sighted subjects were recruited from a group of summer intern
students working at the University of Central Florida. This group was
supplemented by individually obtained subjects, resulting in a group
closely matched to the group of blind subjects (Table I). Sighted
subjects also received ten dollars ($10) for their participation in the
study.
At the time of testing the students were randomly assigned to one
of the order conditions which would receive either the print or the
aural tests first. This controlled for order effects by averaging them
over all subjects. While still in a group, the purpose of the study was
explained to the subjects and Personal Information Sheets and Subject
Consent Forms were completed. Subjects were then divided into the two
order groups.
Group A was given the aural version of the tests first. Each
subject was assigned to a separate room with a cassette tape player
which they controlled. The tape was set to play a recorded version of
22
Table I
Subject Factor Comparisons
Blind Subjects
1 2 3 4 5 6 7 8 9 10
Age 19 18 17 17 17 17 16 16 15 15
Race B B B w w B B B B B
Sex M F M F M M F F M F
Educational Level 12 11 12 11 11 10 10 10 10 9
Socioeconomic Status L L L L MI L L L L L
Sighted Subjects
1 2 3 4 5 6 7 8 9 10
Age 18 18 18 17 17 17 17 16 16 15
Race B w B B B B B B B w
Sex - M F F M M F M F F M
Educational Level 12 12 12 12 12 11 11 11 11 10
Socioeconomic Status L MI L L L L L L L MI
Key: B Black w White M Male F - Female L Low Socioeconomic Status
MI Middle socioeconomic Status
23
the PTI Verbal Test B first. They were instructed as to the use of the
machine, but told not to rewind the tape. If there were any problems
they were to turn the tape off and call the experimenter. Group A
finished the Verbal Test in approximately twenty minutes. The cassettes
were then reversed and the subjects were given the same instructions and
started to work on the PTI Numerical Test B. Subjects finished the
Numerical Test in approximately forty-five minutes. After a short break
the subjects in Group A were given the print/braille versions of the
tests as detailed below.
Group B was given the appropriate print or braille versions of the
tests first. The print/braille test administrations were accomplished
in groups for ease of administration. The PTI Verbal Test A was
completed by the subjects first, followed by the PTI Numerical Test A.
Total testing time in this experimental condition averaged two hours.
After a short break, the subjects in Group B were given the aural
versions of the tests as detailed above.
The subjects were paid as they left the room. Their individual
results were mailed to them at the addresses they provided on the
Personal Information Sheets.
RESULTS
The mean age of the blind students was 16.7 years, and the mean
educational level was 10.6 years. The mean age of the sighted subjects
was 16.9 years, and the mean educational level was 11.4 years.
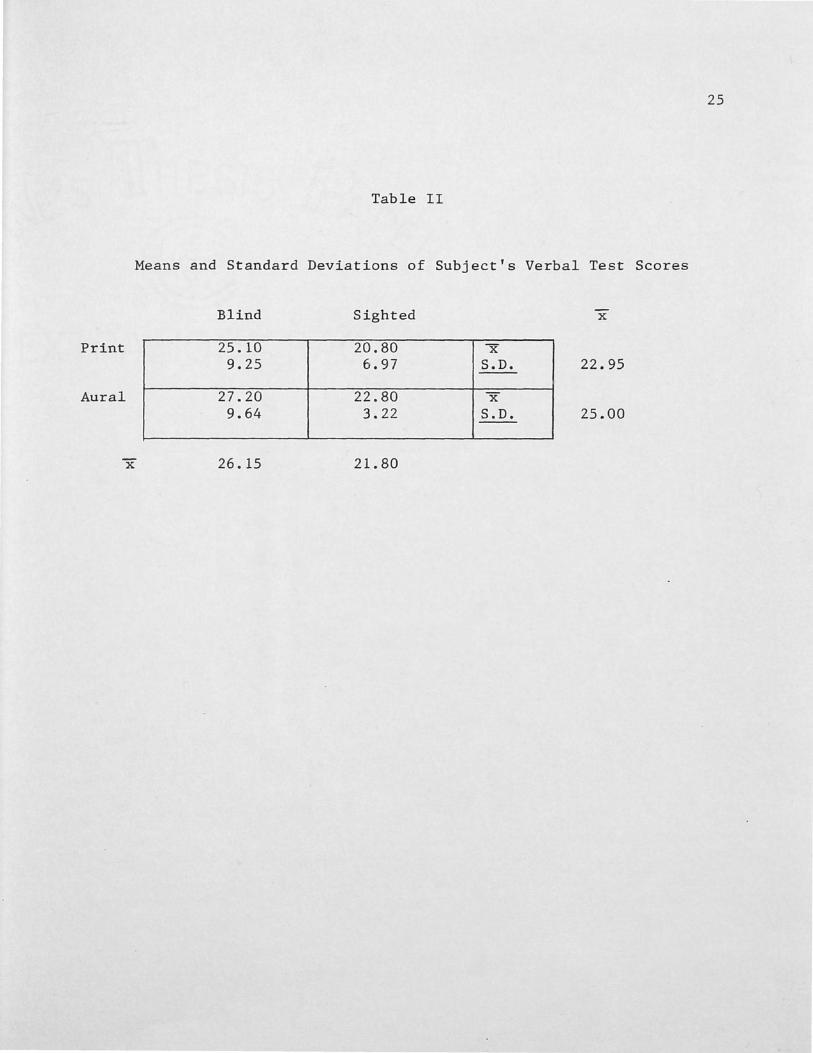
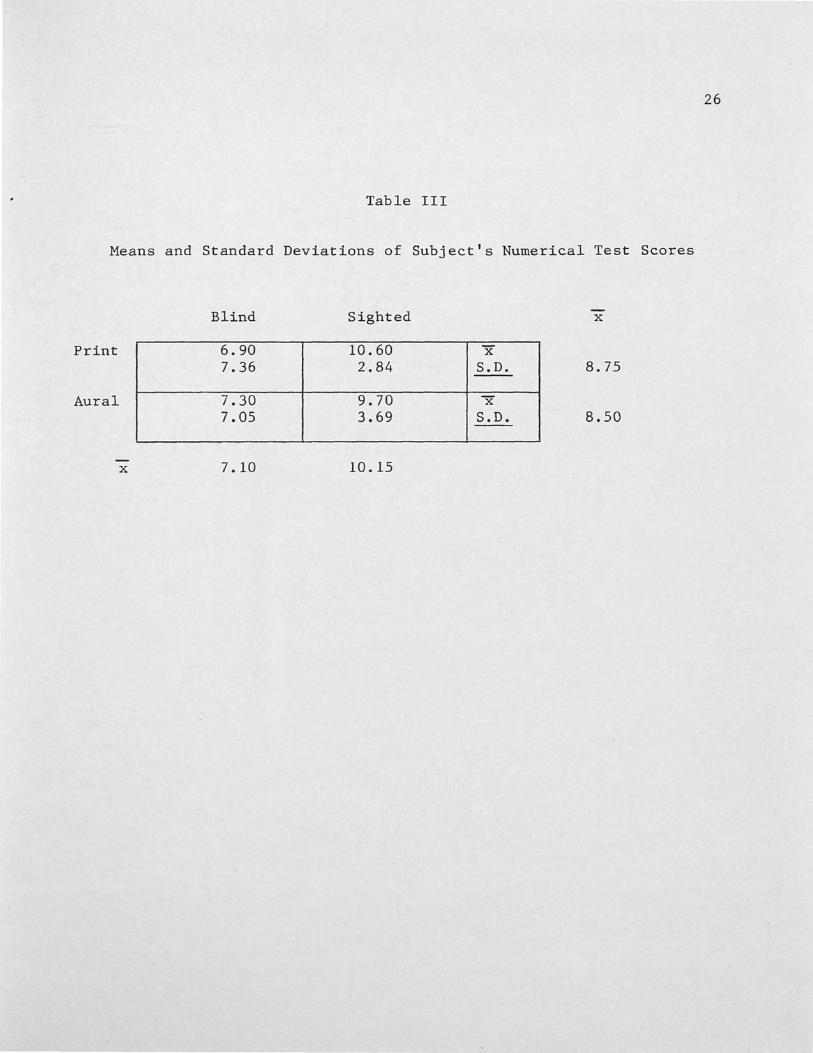
The group means and standard deviations for both the Verbal and
Numerical Test scores are summarized in Tables II and III, respectively.
All subject data was analyzed by a 2x2x2 Analysis of Variance
(ANOVA) with repeated measures on the third factor, mode of
presentation. The analysis was conducted separately for both the Verbal
and Numerical Test results.
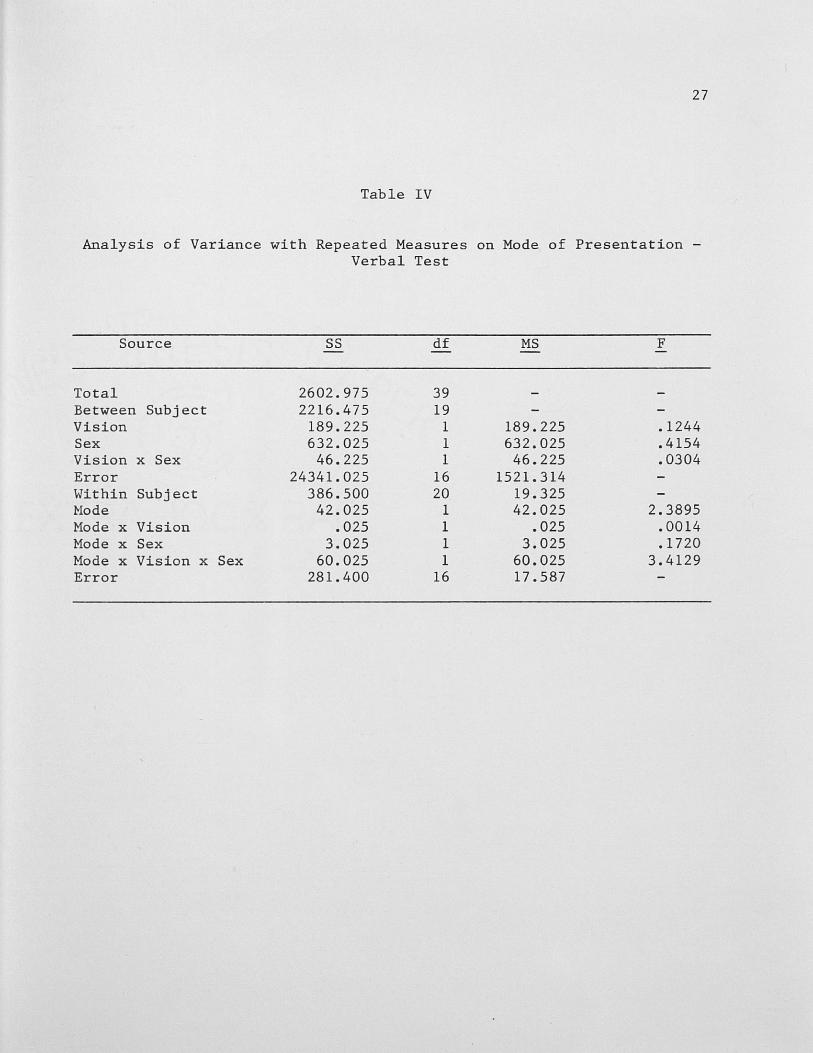
Table IV presents the results of the ANOVA for the Verbal Tests.
None of the main effects were found to be significant: !:_ (1,16) =
.1244, ,p_> .05 for the effect of vision;~ (1,16) = .4154, .E..> .05 for
the effect of sex;.!:_ (1,16) 2.3895, .£.> .05 for the effect of mode of
presentation. In addition, none of the factor interactions were found
to be significant.
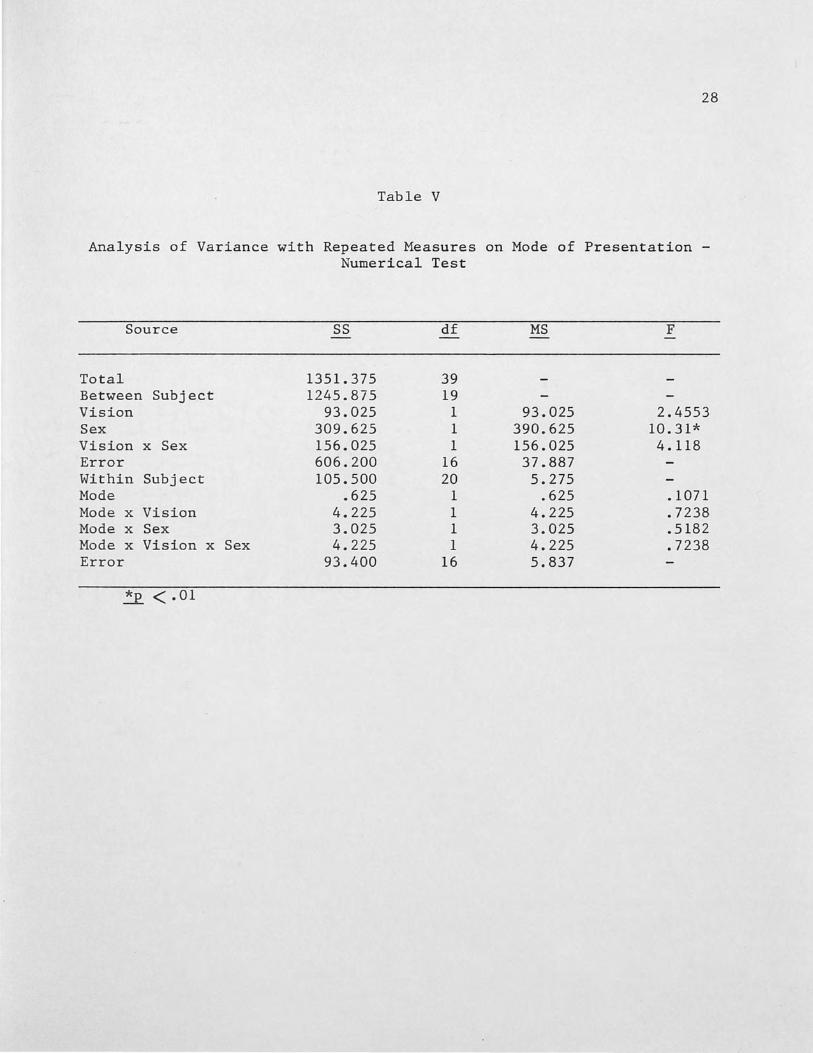
Table V presents the results of the ANOVA for the Numerical Tests.
The main effects of vision and mode of presentation were not found to be
significant with F (1,16) = 2.4553, .E..> .05 and F (1,16) = .1071, ,p_ > .OS, respectively. The main effect of sex, however, was found to be
significant with~ (1,16) = 10.31, .E.. < .01. None of the factor inter
actions were found to be significant.
25
Table II
Means and Standard Deviations of Subject's Verbal Test Scores
Blind Sighted x
Print 25.10 20.80 x 9.25 6.97 S.D. 22.95 --
Aural 27.20 22.80 x 9.64 3.22 S.D. 25.00 --
26.15 21. 80
26
Table III
Means and Standard Deviations of Subject's Numerical Test Scores
Blind Sighted x
Print 6.90 10.60 x 7.36 2.84 S.D. 8.75 --
Aural 7.30 9.70 x 7.05 3.69 S.D. 8.50 --
-x 7.10 10.15
27
Table IV
Analysis of Variance with Repeated Measures on Mode of Presentation -Verbal Test
Source SS df MS F
Total 2602.975 39 Between Subject 2216.475 19 Vision 189.225 1 189.225 .1244 Sex 632.025 1 632.025 .4154 Vision x Sex 46.225 1 46.225 .0304 Error 24341.025 16 1521.314 Within Subject 386.500 20 19.325 Mode 42.025 1 42.025 2.3895 Mode x Vision .025 1 .025 .0014 Mode x Sex 3.025 1 3.025 .1720 Mode x Vision x Sex 60.025 1 60.025 3.4129 Error 281. 400 16 17.587
28
Table V
Analysis of Variance with Repeated Measures on Mode of Presentation -Numerical Test
Source SS df MS F
Total 1351.375 39 Between Subject 1245.875 19 Vision 93.025 1 93.025 2.4553 Sex 309.625 1 390.625 10.31* Vision x Sex 156.025 1 156.025 4.118 Error 606.200 16 37.887 Within Subject 105.500 20 5.275 Mode .625 1 .625 .1071 Mode x Vision 4.225 1 4.225 .7238 Mode x Sex 3.025 1 3.025 .5182 Mode x Vision x Sex 4.225 1 4.225 .7238 Error 93.400 16 5.837
*p < .01
29
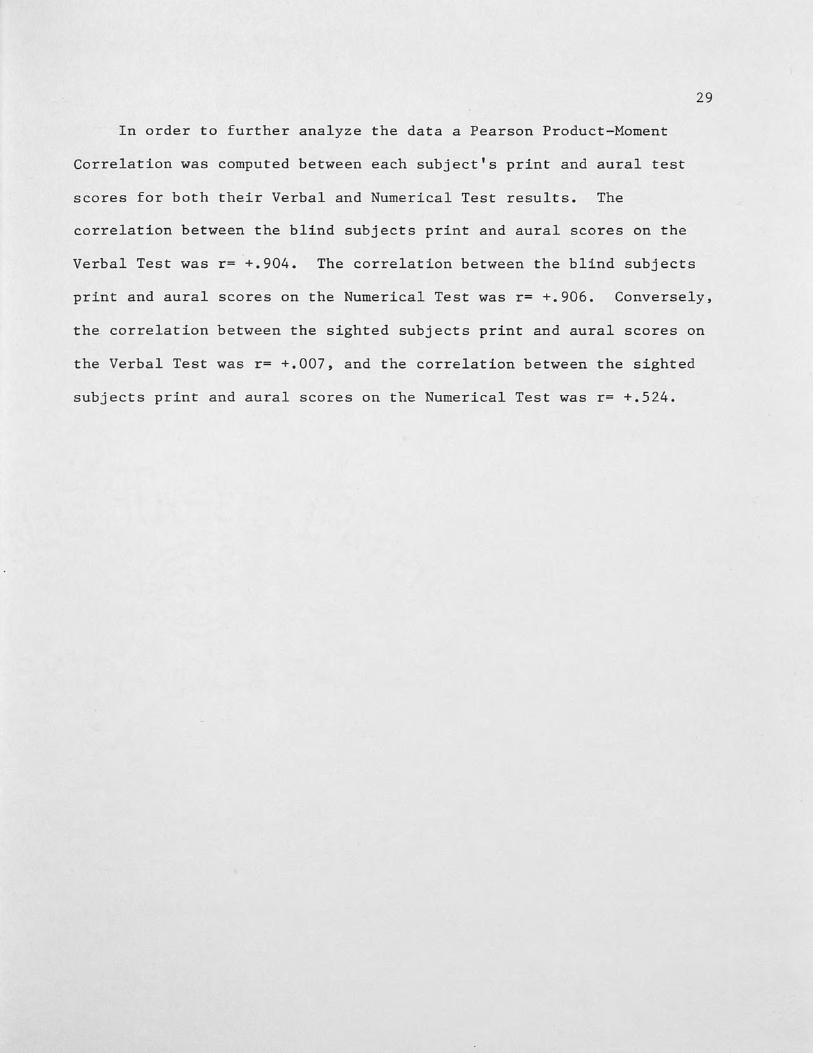
In order to further analyze the data a Pearson Product-Moment
Correlation was computed between each subject's print and aural test
scores for both their Verbal and Numerical Test results. The
correlation between the blind subjects print and aural scores on the
Verbal Test was r= +.904. The correlation between the blind subjects
print and aural scores on the Numerical Test was r= +.906. Conversely,
the correlation between the sighted subjects print and aural scores on
the Verbal Test was r= +.007, and the correlation between the sighted
subjects print and aural scores on the Numerical Test was r= +.524.
DISCUSSION
The results of this study did not support any of the three
hypotheses. The first problem encountered with the study came during
the test selection phase. Extreme difficulty was encountered in
identifying a test (other than intelligence and achievement tests) that
had been validated on a blind population.
When dealing with general ability tests or tests that have a wide
usage, such as intelligence tests, it would be feasible to consider
separate norms for the blind. In an applied setting, however, this
would be virtually impossible. Organizations that utilize selection
tests may never encounter a blind job applicant, therefore, obtaining
norms for the blind would not be cost effective. Further, should an
organization decide to go to the time and expense of obtaining norms for
the blind, most would be unable to validate the test due to the limited
number of blind employees within their organization.
The thrust of this study was to consider the blind job applicant,
-
and it was therefore desirable to utilize a selection instrument that
might be encountered in the "real world." The Personnel Tests for
Industry were selected for that reason.
As noted earlier, test items containing diagrams were re-written to
eliminate the diagrams and permit transcription into braille. Test
items containing diagrams typically test two factors: the testee's
ability to answer the question based on their knowledge of the subject
31
matter; and the testee's ability to interpret the diagram, by extracting
and utilizing the needed information. Eliminating the diagram also
eliminates the information concerning the testee's ability to interpret
diagrams.
Re-writing the test items resulted in items that were very lengthy.
In attempting to retain the interpretative nature of the items, they
were re-written so as to describe the diagram. The re-written items
were therefore complex and time consuming, and possibly more difficult
than they were in their original form.
The preferred alternative to re-writing the test items would, of
course, be to have the diagrams transcribed into braille along with the
rest of the question. If this proved to be impossible, as in the case
of the present study, an alternate approach would be to eliminate all of
the diagrammatic items from the test. Scores would then be adjusted to
compensate for the reduced number of items. Future studies, if unable
to transcribe diagrams into braille, should take one of these alternate
approaches rather than altering the test items and possibly invalidating
the test (Bateman, 1965 and Swallow, 1979).
The data analysis tends to support the theory that re-writing the
test items may have affected the validity of the test. The Verbal Test,
unlike the Numerical Test, was virtually unaltered in the transcription
to braille. The scores on the Verbal Test resulted in an F = 2.3895 for
mode of presentation. Although this F ratio is not significant, the
mean differences were in the expected direction. Altering the Numerical
Test may have weakened the discriminative power of the test.
32
An alternative interpretation to the above might dismiss the result
as due to verbal skills being more sensitive to differences in mode of
presentation. Logically, however, one would assume that the
quantitative skills required for the Numerical Test would be more
sensitive to such differences.
The only significant result in this study was unexpected and
unpredicted, namely, the significant main effect of sex in the Numerical
Test. Appendix C summarizes the test scores by sex of the subjects and
mode of presentation. Males, both blind and sighted, performed
significantly better on the Numerical Test than their female counter
parts. Although the F ratio for the interaction of Vision x Sex was not
significant (F = 4.118), the effect was strong between blind males and
blind females. The pattern, although not as strong, is the same for the
sighted males and sighted females. This result may ultimately be found
to be significant once problems are worked out in future studies.
In addition to the analysis of variance, correlational procedures
were utilized to examine the relationship between each subject's print
and aural scores for both the Verbal Test and the Numerical Test. As
noted earlier, -the blind subjects' test scores were highly correlated
when computed among the same trait, but different mode of presentation
(r= +.904 for the Verbal Test and r= +.906 for the Numerical Test). The
test scores for the sighted subjects, however, produced much lower
correlations (r= +.007 for the Verbal Test and r= +.524 for the
Numerical Test). The restriction of range as evidenced by the low
standard deviations (Table II and Table III) may help to explain the
33
disparity between the correlations for the scores of the blind subjects
and the correlations for the scores of the sighted subjects.
If we are able to assume that the test scores of blind subjects are
not significantly different than the test scores of sighted subjects,
the correlations reported above for the blind subjects take on a new
light. The high correlations between the blind subjects' test scores in
both test modes may provide the needed predictability for selection
decisions, once again, assuming there are no significant mean
differences.
In summary, although the results of the present study did not
support the stated hypotheses, there may still be a positive result.
This study did not find a significant difference between the test scores
of blind and sighted subjects, regardless of the mode of presentation.
This fact, coupled with the correlations reported for the blind
subjects, implies that a blind subject's score on a print test may be
predicted by their score on an aural version of the same test.
It would not be advisable, however, for an organization to base
their defense of their testing program on this study because of the many
procedural problems encountered. The problems with test selection have
already been discussed, but additional problems were encountered while
obtaining the subjects.
The most striking feature of Table I concerns the race of the
subjects. Of all blind subjects tested, 80% were black. This
observation raised some questions concerning the sample as a true
representation of the SDB population. The SBD was contacted requesting
34
information concerning the racial makeup of the student population. The
overall student population at the SDB was reported as approximately 50%
white and 50% black. The sample secured for this study was, therefore,
not representative of the SDB population, much less the blind population
in general. This, of course, severly limits the external validity of
the study.
A possible explanation for the over representation of black
students in the blind sample could be related to socio-economic status.
All of the black students were from the low end of the socio-economic
scale. The offer of ten dollars ($10) for four hours work may have been
more tempting to them than to the students at or near the middle or high
end of the socio-economic scale. Therefore, the offer of ten dollars
($10) for participation, which was utilized to secure subjects, may have
been the variable that biased the sample.
The overrepresentation of black subjects carried over to the
sighted sample because the sighted sample was matched to the blind
sample. As a result, the sighted sample was secured by preselection
based on factors of race and socio-economic status.
In order for a study of this nature to be helpful, and applicable
to employment situations, it is critical that the subject samples be
truly representative of the population. To this end, future research
must take a broader view than was possible in this limited study. It is
essential that the entire student population of a specific grade level
at a school such as the SDB be tested. This procedure would average out
all subject variables (age, race, sex, etc.). Once this step was
35
completed it would be possible to test the same grade level in a public
school system to obtain a matched sample. A procedure such as this
would provide a larger and more representative sample on which to base
compari.sons. This would also increase the external validity of the
study.
If it were not possible to test an entire grade level in the school
systems additional controls would have to be placed upon the subject
variables. When dealing with small sample sizes and a subject matching
design it is important to control as many variables as possible. Future
studies should therefore include a control for intellectual ability
which could be obtained either from historical subject information or
from a pre- test. This information would provide controls for the
individual differences in intellectual ability that are not possible to
obtain by the matching of other subject variables.
It is entirely possible that future research which corrects the
problems encountered with the Numerical Test and the sample selection
will find significant results. It is also possible that future research
will duplicate the results of this study. In either case, the possible
-effects of mode of test presentation to blind subjects will be one st~p
closer to being settled.
Appendix A
37
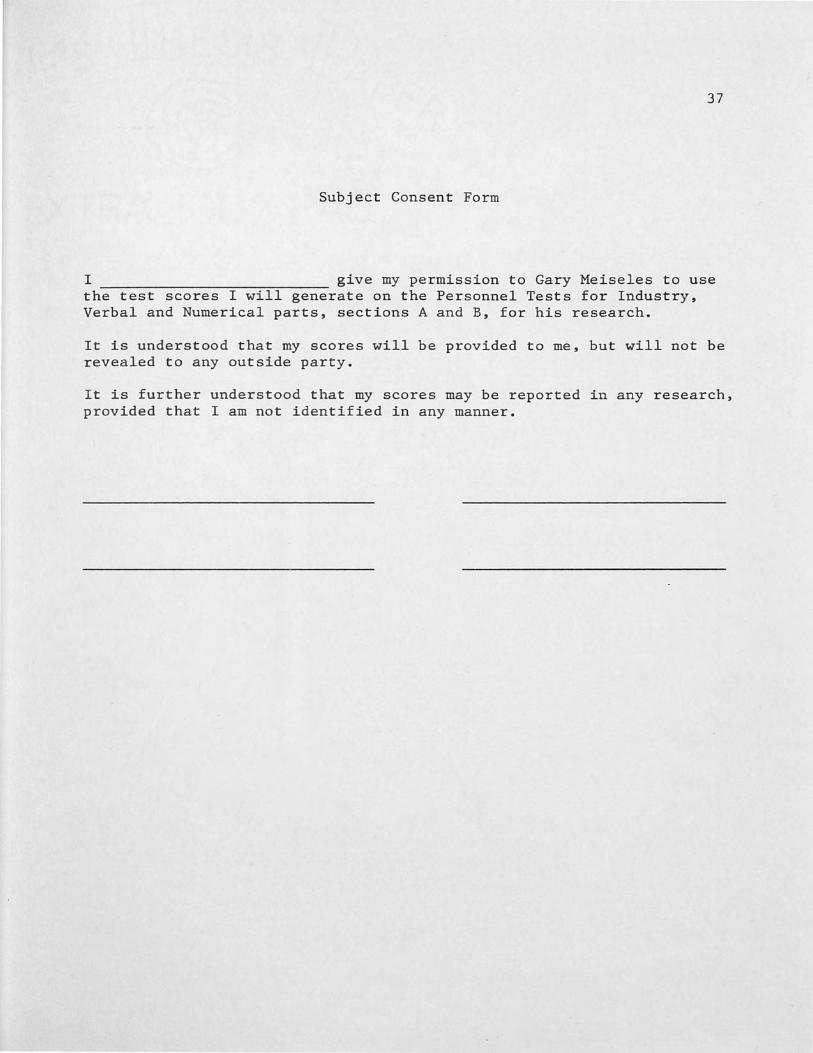
Subject Consent Form
I give my permission to Gary Meiseles to use the test scores I will generate on the Personnel Tests for Industry, Verbal and Numerical parts, sections A and B, for his research.
It is understood that my scores will be provided to me, but will not be revealed to any outside party.
It is further understood that my scores may be reported in any research, provided that I am not identified in any manner.
Appendix B
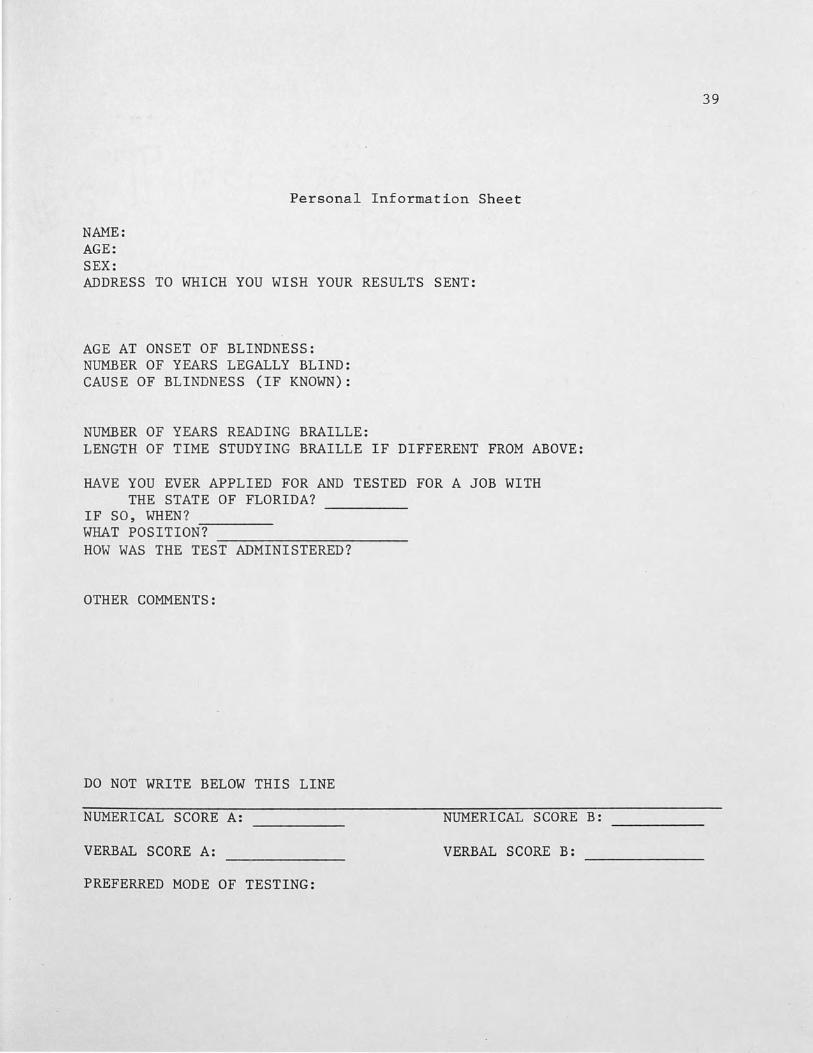
Personal Information Sheet
NAME: AGE: SEX: ADDRESS TO WHICH YOU WISH YOUR RESULTS SENT:
AGE AT ONSET OF BLINDNESS: NUMBER OF YEARS LEGALLY BLIND: CAUSE OF BLINDNESS (IF KNOWN):
NUMBER OF YEARS READING BRAILLE: LENGTH OF TIME STUDYING BRAILLE IF DIFFERENT FROM ABOVE:
HAVE YOU EVER APPLIED FOR AND TESTED FOR A JOB WITH THE STATE OF FLORIDA?
IF SO, WHEN? ----WHAT POSITION? HOW WAS THE TEST ADMINISTERED?
OTHER COMMENTS:
DO NOT WRITE BELOW THIS LINE
NUMERICAL SCORE A: NUMERICAL SCORE B:
VERBAL SCORE A: VERBAL SCORE B:
PREFERRED MODE OF TESTING:
39
Appendix C
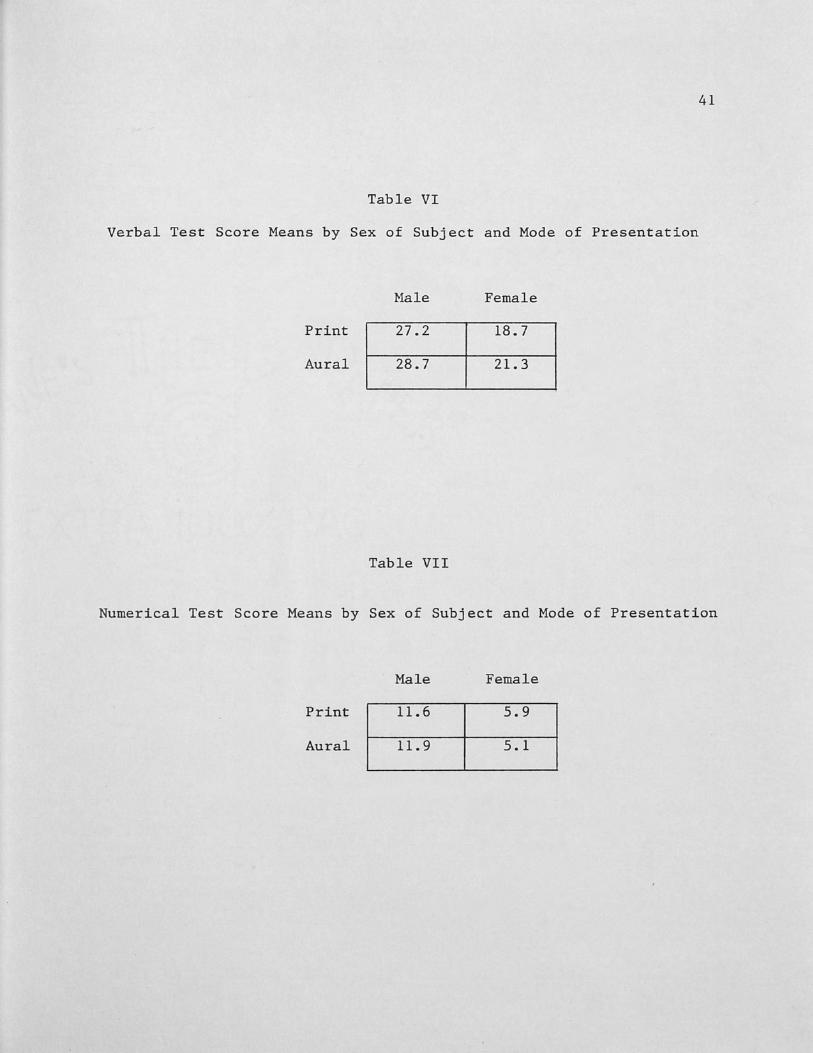
Table VI
Verbal Test Score Means by Sex of Subject and Mode of Presentation
Aural
Male
27.2
28.7
Table VII
Female
18.7
21. 3
41
Numerical Test Score Means by Sex of Subject and Mode of Presentation
Aural
Male
11. 6
11. 9
Female
5.9
5.1
REFERENCES
American Society for Personnel Administration. Fair Employment Digest, (A Quarterly Report to the Members), September, 1979.
Avery, C.D., & Streitfeld, J.W. An abbreviation of the Haptic Intelligence Scale for clinical use. Education of the Visually Handicapped, 1969, _!_(2), 37-40.
Bateman, B. Psychological evaluation of blind children. The New Outlook for the Blind, 1965, l2_, 193-196.
Bauman, M.K. Selection techniques for the industrial placement of the blind. In American Association of Workers for the Blind, Proceedings of the Twentieth Biennial Convention, 1943, 34-38.
Bauman, M.K. A manual of norms for tests used in counseling blind persons. In American Association of Workers for the Blind, A Report and a Reprint, 1968, 36-66. (Originally published: -American Foundation for the Blind, Research Series, 1958, No. 6.)
Bauman, M.K. Tests used in the psychological evaluation of blind and visually handicapped persons. In American Association of Workers for the Blind, A Report and a Reprint, 1958, 8-33.
Bauman, M.K. Psychological testing and blindness - A retrospect. In American Association of Workers for the Blind Annual-Blindness 1972. Washington: AAWB, Inc., 1972.
Bauman, M.K. An interest inventory for the visually handicapped. Education of the Visually Handicapped, 1973, ~(3), 78-83.
Bauman, M.K. Blindness, visual impairment, deaf-blindness: Annotated listing of the literature, 1953-75. Philadelphia: Temple University Press, 1976.
Bauman, M.K., & Hayes, S.P. A manual for the psychological examination of the adult blind. New York: The Psychological Corporation, 1951.
Bauman, M.K. & Mullen, S.C. Performance tests of intelligence for the adult blind. In American Association of Workers for the Blind Annual-1965. Washington: AAWB, Inc., 1965.
Birns, S. Review of literature on braille reading. The New Outlook for the Blind, 1976, !..5!_, 392-397.
43
Buckley, J.E. The efficiency of braille as a medium of communication. Braille Research Newsletter, 1977, .§_, 11-25.
Carney, C. Adaptations of psychological testing for use by the blind. Journal of School Psychology, 1972, ..!_Q_(2), 221-223.
Coveny, T.E. A new test for the visually handicapped. Education of the Visually Handicapped, 1972, !±_, 97-101.
Coveny, T.E. Standardized tests for visually handicapped children: A review of research. The New Outlook for the Blind, 1976, 70, 232-236.
Crandell, J.M., & Wallace, D.R. Speed reading in braille: An empirical study. The New Outlook for the Blind, 1974, ~, 13-19.
Davis, C.J. New developments in the intelligence testing of blind children. In Proceedings of the Conference on New Approaches to the Evaluation of Blind Persons. New York: American Foundation for the Blind, 1970, 83-103.
Davis, C.J. & Nolan, C.Y. A comparison of the oral and written methods of administering achievement tests. The Education of the Blind, 1961, 10, 80-82.
DiMichael, S.G. Psychological aptitude and ability tests in the rehabilitation of the adult blind. In American Association of Instructors of the Blind. Proceedings of the Thirty-Eighth Stated Meeting of the American Association of Instructors of the Blind. Philadelphia: Lyon & Armor, 1946, 149-152.
Eaves, L. & Klonoff, H. A comparison of blind and sighted children on a tactual and performance test. Exceptional Children, 1970, l?_, 269-273.
Foulke, E. Non-visual communication: VIII. Reading by touch. Education of the Visually Handicapped, 1970, l_, 87-88.
Gilbert, J.G. & Rubin, E.J. Evaluating the intellect of blind children. The New Outlook for the Blind, 1965, -22_, 238-240.
Gruber, A. The development of a reconstruction-form tactual test for use with the adult blind. Unpublished doctoral dissertation, Purdue University, 1959.
Haines, T.H. A point scale for the mental measurement of the blind. Journal of Educational Psychology, 1916, ]_, 143-149.
44
Hayes, S.P. Preface to the adaptation of the Terman-Binet Scale for use with the blind. Outlook for the Blind, 1923, 17, 26-28.
Hayes, S.P. Blind.
Terman's condensed guide for the Stanford Revision for the Watertown, Mass.: Perkins Institution for the Blind, 1930.
Hayes, S.P. A second test scale for the mental measurement of the visually handicapped. Outlook for the Blind, 1943, lZ._, 37-41.
Hill, E. Deaf /blind bibliography. University of Birmingham, Birmingham, England: Research Centre for the Education of the Visually Handicapped, 1975.
Holland, B.F. A study of the reactions of physically normal, blind, and deaf children to questions in a verbal intelligence test. Teachers Forum, 1936, .2_, 2-10.
Irwin, R.B., & Goddard, R.H. Adaptation of . the Binet-Simon tests. Vineland, N.J., 1914.
Jones, W.R. The development of a non-verbal tactual intelligence scale for the adult blind. Unpublished doctoral dissertation, Purdue University, 1960.
Kirchner, C. & Peterson, R. Statistical brief #5-Employment: Selected characteristics. Journal of Visual Impairment and Blindness, 1979, .zl, 239-242.
Malikin, D. & Freedman, S. Test construction or adaptation for use with blind adults. In Proceedings of the Conference on New Approaches to the Evaluation of Blind Persons. New York: American Foundation for the Blind, 1970, 7-18, 147-148.
Maxfield, K.E. Adaptation of educational tests for use with blind pupils. New York: American Foundation for the Blind, Inc., 1927.
Morris J.E. The 1973 Stanford Achievement Test Series as adapted for use by the visually handicapped. Education of the Visually Handicapped, 1974, ~' 33-40.
Morris, J.E. & Nolan, C.Y. Bibliography on tests and testing of the blind. Louisville, Ky.: American Printing House for the Blind, 1971.
Newland, T.E. The blind learning aptitude test. Report of the proceedings of the conference on research needs in braille. New York: American Foundation for the Blind, 1961.
Nolan, C.Y. Reading and listening in learning by the blind. Exceptional Children, 1963, ~' 313-316.
45
Nolan, C.Y. & Davis, C.J. Measurement of scholastic attainment with standardized tests. In International Council of Educators of Blind Youth, Fourth Quinquennial Conference. Watertown, Mass.: Perkins School for the Blind, 1967, 86-92.
Nolan, C.Y. & Morris, J.E. and passive listening.
Learning by blind students through active Exceptional Children, 1969, 35, 173-181.
Rich, C.C. & Anderson, R.P. A tactual form of the progressive matrices for use with blind children. Personnel and Guidance Journal, 1965, 43, 912-919.
Rusalem, H. Coping with the unseen environment: vocational rehabilitation of blind persons. College Press, 1972.
An introduction to the New York: Teachers
Scholl, G. & Schnur, R. Measures of psychological, vocational, and educational functioning in the blind and visually handicapped. New York: American Foundation for the Blind, 1976.
Shurrager, H.C., & Shurrager, P.S. Manual for the Haptic Intelligence Scale for the blind. Chicago: Psychology Research Technology Center, Illinois Institute of Technology, 1964.
Streitfeld, J.W. & Avery, C.D. The WAIS and HIS tests as predictors of academic achievement in a residential school for the blind. International Journal for the Education of the Blind, 1968, ~, 73-77.
Swallow, R.M. Fifty assessment instruments commonly used with blind and partially seeing individuals. Unpublished manuscript, California State University, Los Angeles, 1979.
Tillman, M.H. The performance of blind and sighted children on the Wechsler Intelligence Scale for Children: Study I. The Education of the Blind, 1967, _!i, 65-74. (a)
Tillman, M.H. The performance of blind and sighted children on the Wechsler Intelligence Scale for Children: Study II. The Education of the Blind, 1967, ~' 106-112. (b)
Tillman, M.H. & Osborne, R.T. The performance of blind and sighted children on the Wechsler Intelligence Scale for Children: Interaction effects. Education of the Visually Handicapped, 1969, _!_, 1-4.
Tobin, M.J. Testing the blind and partially sighted. Birmingham, England: Research Centre for the Education of the Visually Handicapped, University of Birmingham, 1977.
46
Tobin, M.J. An introduction to the psychological and educational assessment of blind and partially sighted children. Birmingham, England: Research Centre for the Education of the Visually Handicapped, University of Birmingham, 1978.
Trisman, D.A. Equating braille forms of the Sequential Tests of Educational Progress. Exceptional Children, 1967, 34, 419-424.
Tuttle, D.W. A comparison of three reading media for the blind. Education of the Visually Handicapped, 1972, i, 40-44.
United Press International. In Sentinel Star, 1980, March 18, 12-A.
Wattron, J.B. A suggested performance test of intelligence. New Outlook for the Blind, 1956, 2Q_, 115-121.
Winer, B.J. Statistical principles in experimental design. New York: McGraw-Hill Book Co., 1971.