comparative analysis between cfse flow cytometric and...
TRANSCRIPT

Comparative Analysis Between CFSE FlowCytometric and Tritiated Thymidine
Incorporation Tests for Beryllium Sensitivity
Tatyana N. Milovanova*Institute for Environmental Medicine, Pulmonary, Allergy and Critical Care Division, Department of Pathology and LaboratoryMedicine, Flow Cytometry and Cell Sorting Facility, Abramson Cancer Center, University of Pennsylvania Medical Center,
Philadelphia, Pennsylvania 19104
Background: In this study, we evaluated alternative possibility for CFSE beryllium flow cytometric testagainst beryllium blood lymphocyte proliferation test (BeLPT) as a standard radioactive clinical screeningmethod to identify sensitization to beryllium.Methods: Delta PD (the ratio of divided cell population to the total number of cells with subtracted
counts of unstimulated cells) of specific beryllium-induced pathogenic CD3þCD4þ T-lymphocytes andstimulation index (SI) in CFSE proliferation test was compared with delta counts per minute (mean testCPM minus mean control CPM) and SI in radioactive blood BeLPT.Results: Comparison analysis of CFSE and BeLPT demonstrated excellent agreement between delta PD
and delta CPM (j 5 0.845, P << 0.0001). We determined 6.8% positive subjects in the beryllium-exposed, Be-LPT-negative group. The decreased mean difference of these indexes to percentage of aver-age and the long tail in the plot reflects increased sensitivity. CFSE/CD4þ T-cell proliferation assay has100% specificity, significantly higher sensitivity and efficiency than BeLPT.Conclusions: Both delta PD, measured by the precursor frequencies method in CFSE assay and delta
CPM, defined by tritiated thymidine in BeLPT, can be used for the enumeration of beryllium specificCD41 T-cell proliferation and may substantially improve the quality of the early diagnosis of berylliumhypersensitivity. q 2007 Clinical Cytometry Society
Key terms: CFSE; lymphocyte proliferation; CD4; CD8; BeLPT
Beryllium blood lymphocyte proliferation test (BeLPT)remains to be the primary screening diagnostic tool inassessing hypersensitivity to beryllium (1–5). Berylliumsensitization is clinically defined as positive proliferativeresponse of lymphocytes challenged in vitro with beryl-lium (1,4), whereas chronic beryllium disease (CBD) isconfirmed by noncaseating granulomas and/or interstitialinfiltration of mononuclear phagocytes and lymphocytes(6,7). Bronchoalveolar lavage (BAL) BeLPT and transbron-chial biopsy for histological examination are consideredto be gold standard for CBD diagnosis (4,6,8–10),although there is no gold standard for beryllium sensitiv-ity (11). In the United States, 800,000 workers were con-sidered to be at risk for developing CBD (1,12,13), butthere may be over 10 million workers exposed (14).Summary of the estimated number of workers currentlyexposed to beryllium in 2004 are 134,000, the ratio offormerly exposed to currently exposed are at least 3:1,and may be as much as 5:1 (15). Although this methodis sensitive and well established, it gives no informationabout responding lymphocyte subsets, requires radioac-
tivity and has high inter- and intralaboratory variability(9,11,16). Establishment of CFSE flow cytometric clini-cally relevant assay might help to resolve these prob-lems.New flow cytometric methods have been developed
to measure the proliferation of T cells (17–22). Combin-ing a fluorescent proliferation dye such as 5,6-carboxy-fluorescein diacetate succinimidyl ester (CFSE) andmonoclonal antibodies, determination of immunopheno-type and precursor frequency of proliferating cellsbecome possible (20,22–25). In our previous report (17)
*Correspondence to: Tatyana N. Milovanova, M.D., Ph.D., Universityof Pennsylvania Medical Center, Institute for Environmental Medicine,3620 Hamilton Walk, 1 John Morgan Bldg., Philadelphia, PA 19104.E-mail: [email protected]
Grant sponsor: National Institute of Health; Grant number: HL 48210.
Received 17 September 2005; Revision 29 June 2006; Accepted18 October 2006Published online 27 February 2007 in Wiley InterScience (www.
interscience.wiley.com).DOI: 10.1002/cyto.b.20166
Cytometry Part B (Clinical Cytometry) 72B:265–275 (2007)
q 2007 Clinical Cytometry Society

we demonstrated that beryllium stimulated only CD3þ
CD4þ T-lymphocytes responses, utilizing proliferativeratio parameter (percentage of divided cells to undividedcells, PD). In this study, we used more sensitive andappropriate for clinical evaluation precursor frequencymarker-delta proportion of cells that divided (delta PD)-the ratio of divided cell population to the total numberof cells with subtracted counts of unstimulated cells, tomeasure proliferation of beryllium-induced CD3þCD4þ Tcells. We also calculated stimulation index (SI) based ondelta PD responses.
Establishment of equivalent markers in both tests,delta CPM in BeLPT (mean test CPM minus mean controlCPM) and delta PD in CFSE allowed us to compare pro-liferation results of both tests and to determine the cor-relation agreement between the flow cytometric andstandard tritiated thymidine incorporation assays. Wealso investigated sensitivity, specificity, and efficiency ofboth tests and recognized CFSE flow cytometric assaywith 100% specificity, higher sensitivity and efficiencythan BeLPT as alternative test for BH evaluation andmonitoring or might, possibly, replace BeLPT in future.
MATERIALS AND METHODS
Population Tested
Of 72 employees from beryllium industry, evaluated inthe Hospital of the University of Pennsylvania (HUP) forberyllium sensitization and CBD, 38 were considered tohave beryllium hypersensitivity (BH) by positive bloodBeLPT on at least two occasions (two different days or attwo different concentrations of beryllium) and or a posi-tive bronchoalveolar BeLPT. CBD was diagnosed whenthere was evidence of beryllium hypersensitivity withgranulomas on biopsy and/or radiological changes con-sistent with a granulomatous process. Seven of the 38were diagnosed with CBD based on the positive bloodand previous BAL BeLPT and had granulomas on biopsy;nine had a diagnosis of beryllium alveolitis (BA), basedon findings of positive blood and BAL BeLPT withoutgranulomas on biopsy; and 22 had a diagnosis of beryl-lium sensitivity based on positive blood BeLPT on atleast two occasions with negative findings on bronchos-copy. Normal unexposed volunteers were used as con-trols.
Blood BeLPT (3H-Thymidine Incorporation Assay)
Peripheral blood lymphocytes (PBLs) were isolatedfrom heparinized blood under sterile conditions usingdensity centrifugation with lymphocyte separation me-dium (ICN Biomedicals, Aurora, OH). Blood BeLPT wasperformed as previously reported (4,17). The cells werepulsed with 3H-thymidine (DuPont NEN, Boston, MA)and harvested on a filter fiber (Wallac, Turku, Finland) af-ter 3, 5, or 7 days of culture at 378C in 5% CO2. Theuptake of 3H-thymidine was measured as counts per mi-nute (CPM) using a Wallac 1205 b-plate liquid scintilla-tion system (Wallac, Gaithersburg, MD). Results wereexpressed as a stimulation index (SI ¼ mean CPM of test
wells/mean CPM of control wells). A positive responsewas defined as a SI > 3.0 for blood from the subject. Asan additional index to quantity final proliferativeresponses of blood T-cells � delta CPM (mean testcounts per minute minus mean control CPM) was meas-ured. Delta CPM of normal unexposed subjects isdefined 0 or negative because of the lower CPM in beryl-lium-treatment wells that from the unstimulated controls.The response was considered positive with CPM > 500,or less �500 (cutoff is based on the responses of normalunexposed volunteers).
CFSE Labeling and Measurements of Proliferation
The CFSE labeling method was adapted from a previ-ously described protocol (17). Aliquots of the same pe-ripheral blood lymphocyte sample used in the BeLPTassay were split between two methods, washed threetimes in 10 mL of phosphate buffered saline (dPBS,Gibco BRL, Grand Island, NY) at room temperature. Fol-lowing CFSE labeling, the cells were cultured in 24-wellplates at 2 3 106 per well in the presence of PHA, Can-dida and 10 or 100 lM of beryllium sulfate. Stimulantsincluded 500 lg of phythohemagglutinin (PHA; L-9132,Sigma, Chemical Co., St. Louis, MO), 20 lL/mL of Can-dida (M15; Greer Labs, Lenoir, NC) and 10 or 100 lM ofberyllium sulfate (Brush Welman, Cleveland, OH). Unsti-mulated CFSE labeled cells were defined as controls. Thecells were incubated for seven days at 378C and 5% CO2.Surface or intracellular labeling of T-lymphocytes wasperformed at the time of harvest.
Surface and Intracellular Staining
Cell surface marker and intracellular staining was per-formed as described (17). The following monoclonalantibodies were used: Phycoerythrin (PE) conjugatedanti-human CD4, Tricolor conjugated (TC) anti-humanCD3, allophycocyanin (APC) conjugated anti-human CD8(Caltag, Burlingame, CA). The vital dye TO-PRO-3 (Molec-ular Probes, Eugene, OR) was used to discriminate liveand dead cells (24).
Flow Cytometric Data Acquisition and Analysis
All data were acquired on a four-color, dual laser FACS-Calibur (Becton Dickinson, San Jose, CA). CFSE wasmeasured in the FL1 channel, CD4PE- in the FL2,CD3TC- in the FL3, and TO-PRO-3 or CD8APC- in theFL4 channel. The gating strategy was as follows: foranalysis of CD3þ T cells alone, an initial region wasdefined as lymphocytes by light scatter, and a broadregion was set to include medium to high forward/lowside scatter events after stimulation with PHA, Candida,BeSO4 10 and 100 lM vs. unstimulated control cells(Fig. 1A). For multiparameter analysis acquired data wereplotted in a contour plot FL3 or FL4 on the ordinate andSSC-H or FL2 on the abscissa. A gate was set aroundthe T-cells population to be determined separately forCD3, CD4, CD8 proliferation (Figs. 1B–1D). The eventswithin the gates were analyzed for CFSE and were
266 MILOVANOVA
Cytometry Part B: Clinical Cytometry DOI 10.1002/cyto.b

plotted in the histograms. Histogram analysis of precur-sor frequencies was set on PHA stimulated T-cell popula-tion (positive control) and gated waves of proli-feration of the experimental samples were measured in-dependently; the order of the samples is presented inFigure 1A.
The quantitative analysis of proliferation using CFSEhas been described previously (19,20,22,24). CFSE flowcytometric data files were analyzed using CellQuestTM ac-quisition/analysis software (Becton Dickinson, San Jose,CA). Fifty thousand events were collected. We used pre-cursor frequencies method to utilize delta PD (propor-tion of cells that divided is the ratio of divided cell popu-lation to the total number of cells with subtracted PD ofunstimulated cells) and SI (the ratio of proliferated cellsto unproliferated) as a measure of CFSE response similar3H-thymidine test by Day 7. The response was consid-ered positive with SI > 2.0 and delta PD > 0.015 basedon the values of three standard deviations of delta PD in
control group of normal unexposed volunteers (mean0.01, standard deviation 0.005). We compared delta CPMresults with previously used proliferative ratio (PD),defined as the ratio of the percentage of divided cells toundivided on Day 7 (%M1/%M2) (17).
Statistical Analysis
All values are presented as means 6 standard error ofthe mean. Data are presented only if a minimum of1,000 cells were detected within a population. For the3H-thymidine test, the results were expressed as a stimu-lation index and delta CPM and group differences (beryl-lium-sensitized and unexposed controls) were evaluatedwith using Student’s t-test for paired and unpaired deter-minations or by analysis of variance (ANOVA) as appropri-ate. For the CFSE tests, because the results were expressedas delta CPM and proliferative ratio (PD), the Mann–Whitney version of the Wilcoxon’s signed rank test was
FIG. 1. Gating strategy for beryllium sensitiv-ity analysis. (A) Density plots of T-cellsresponses to PHA and Candida (1&2), BeSO4
10&100 lM (3&4) vs. unstimulated controls(5) by Day 7. (B). For CD3þCD4þ T-cells analy-sis, initial gating was on the lymphocyte popu-lation by light scatter (R1), followed by gatingon CD3þ/ TO-PRO-3� population (R2). CD4high/CD4low subsets were identified using R3 3 R4in formatted contour plot formatted in R1 3R2. (C) For CD4þ and CD8þ T-cell subset anal-ysis, light scatter gating (R1) was followed byidentification of the CD3þ events, using a SSCvs. CD3þ contour plot (R2), and CD4þ andCD8þ phenotype by R3&4 formatted in R1 3R2 gate. Population specific proliferation wasdetermined using single parameter histograms(CFSE). (D) Gating strategy presented in (B)was used for CFSE analysis of CD3þ/CD4þ
T lymphocytes population. [Color figure can beviewed in the online issue, which is availableat www.interscience.wiley.com.]
267A FLOW CYTOMETRIC BLOOD BERYLLIUM LYMPHOCYTE PROLIFERATION TEST
Cytometry Part B: Clinical Cytometry DOI 10.1002/cyto.b

used to determine whether it was a difference between thenormal donors and beryllium-exposed patients. Statisticalsignificance of differences was defined as P < 0.05. Forthe comparison analysis of the investigated groups,we used MedCalc Software (Belgium) and presented thedata in Box-and-Whisker, Bland–Altman, and Mountainplots. The level of the intra- and inter-groups agreementwas quantified by calculating a kappa statistic (j) andby McNemar and Fisher tests (GraphPad QuickCalcula-tions Software). A j of 0.0 is interpreted as evidencethat the agreement is no better than chance alone anda j between 0.81 and 1.00 demonstrates excellent(almost perfect) agreement. Values of �0.20, 0.21–0.40,0.41–0.60, and 0.61–0.80 are interpreted as showingpoor, fair, moderate, good, and substantial agreement,respectively (16,26).
RESULTS
Beryllium Sensitivity Evaluated by 3H-TritiatedThymidine Assay
The National Institute for Occupational Safety andHealth (NIOSH) established BeLPT cutoff of SI ¼ 3.0. Be-ryllium-sensitized subjects (27) were divided in twogroups by BeLPT results at the day of test—Be-sensitized-negative (SI < 3.0) and beryllium-sensitized-positive (SI> 3.0)—and compared with the results of beryllium-neg-ative unexposed donors (Table 1). Positive responseswere observed in the control and beryllium-sensitizedpopulations to PHA on Day 3 and Candida on Days 5and 7 in all three groups with higher SI and delta CPMin beryllium-sensitized groups. In contrast, although noresponses to beryllium were noted in the control groupsby SI, positive responses to beryllium were observed inthe beryllium-sensitized positive population (P < 0.05).
Delta CPM was noted negative in the group of normalvolunteers (beryllium-stimulated CPM at Day 7 waslower than unstimulated) at Days 5 and 7 because of cellcycle arrest or cell death due to beryllium toxicity(18,28–30). However, in BeLPT-negative-sensitized groupwe defined five (7.8%) positive or three (4.8%) high-neg-
ative delta CPM responses from 72 measurements forboth concentrations (10 and 100 lM) of beryllium sul-fate. We unexpectedly determined single positive deltaCMP at Day 5 in the group of BeLPT-negative unexposedvolunteers that could, possibly, be explained byunknown individual environmental or neighborhood ex-posure revealed by BeLPT.We also applied for delta CPM of total BeLPT-negative
subjects (52) with long-term beryllium exposure,involved in this study, and demonstrated that 12 (6.8%)from 176 measurements had weak-positive or high-nega-tive (false-negative due to well volume) delta CPM atDays 5 and 7 (Fig. 3A).
CFSE-Measured Blood CD4þ/CD8þ T-cellResponses to Beryllium In Vitro
In the initial experiments, we investigated the pheno-type of T cells, responding to beryllium by proliferation,defined the optimal gating strategy to collect maximumof proliferating events and established the cutoffs fordelta PD marker. We previously reported that berylliumspecific CD3þCD4þ T cells demonstrated proliferation inberyllium-sensitized population and suggested thatCD4low population resulted from down-regulation of sur-face CD4high in proliferated T cells (17). CFSE-labeledblood T-cells were cultured for 7 days in the presence ofPHA, Candida, and 10 and 100 lM beryllium sulfate. Af-ter 7 days of culture, cells were harvested and surfacestained with CD3TC/CD4PE/TO-PRO-3 (Fig. 1B). PHAand Candida were used as positive controls. For nega-tive control, unstimulated cells labeled with CFSE, weretested. We gated on the live CD3þ T-cell population (TO-PRO-3-negative) and calculated delta PD of CD4high orCD4low T-cells populations separately by CFSE histograms(Fig. 2A, Table 2). We observed that in BeLPT-sensitized,positive group delta PD and SI of CD4low results weretwice higher than CD4high that could confirm the loss ofpositivity of cytotoxic CD4þ T cells while proliferating.There was no T cells proliferation of normal donors toberyllium (delta PD 0, and SI < 2.0) noted.
Table 1Mitogen-and Antigen Proliferative Responses of Cells (mean 6 SEM) From Beryllium-Sensitized
and Control Subjects Measured by Thymidine Incorporation
Subjects groupsNormal controls
SI < 3.0 to be (n ¼ 15)Beryllium-sensitized
SI < 3.0 to be (n ¼ 18)Beryllium-sensitized
SI > 3.0 to be (n ¼ 20)
Stimulants SI Delta CPM SI Delta CPM SI Delta CPM
Day 3PHA 187 6 32.2 155,000 6 13,400 218 6 49.5 157,000 6 5,503 308 6 88.00* 195,000 6 38,960*
Day 5Candida 24.8 6 14.5 14,400 6 7120 36.7 6 11.2 19,200 6 4,970 38.4 6 14.4* 22,000 6 6,480*Be 10 lM 1.0 6 0.12 �215 6 207 1.6 6 0.22 548 6 250 20.0 6 11.2* 9,470 6 2,720*Be 100 lM 1.50 6 0.35 199 6 140 1.5 6 0.30 673 6 415 30.9 6 20.1* 13,100 6 5,230*
Day 7Candida 29.4 6 19.9 35,000 6 22,000 43.4 6 15.7 49,800 6 15,300 62.9 6 35.9* 40,900 6 11,100*Be 10 lM 0.60 6 0.20 �1,470 6 1,030 1.2 6 0.39 1400 6 1,800 47.6 6 38.0* 24,800 6 8,850*Be 100 lM 0.77 6 022 �1,310 6 1,114 0.59 6 0.25 161 6 1,000 27.6 6 19.1* 20,100 6 5,500*
SI, Stimulation index; Be, beryllium; delta CPM, delta counts per minute.*P < 0.05 versus controls.
268 MILOVANOVA
Cytometry Part B: Clinical Cytometry DOI 10.1002/cyto.b

FIG. 2. (A) Example of CFSE-labeled CD3þCD4þ T-cell proliferation, cultured for seven days with PHA,100 lM BeSO4 or control. The subject was BeLPT posi-tive. CFSE fluorescence intensity is displayed on a logscale. Deconvolution of the histogram distributions intogenerations was performed by CellQuest and samplesID were saved. TO-PRO-3 was measured on Fl-4 to dis-criminate live and dead population. Contour plots: dem-onstrate CD4high and CD4low expression with PHA andberyllium vs. unstimulated control. CD4-positive (103–102) and CD4-negative (101) populations in unstimu-lated cells are separate. CD4high and CD4low subsets ofproliferating CD4 T-cells demonstrated the link betweenthe populations. Central histograms: illustrate CFSECD4high T-cell proliferation response stimulated by PHAand beryllium vs. negative control. Bottom histograms:illustrate CFSE/CD4low T-cell proliferation responsestimulated by PHA and beryllium with vs. negative con-trol. Delta PD in the corners of histograms representsthe initial proliferation of T-cells populations. (B) Exam-ple of CFSE-labeled CD3þCD8þ T-cell proliferation,cultured for seven days with PHA, 100 lM BeSO4 orcontrol. The subject was BeLPT positive. CFSE fluores-cence intensity is displayed on a log scale. Deconvolu-tion of the histogram distributions into generations wasperformed by CellQuest and samples ID were saved.Measurements of CD8APC proliferation were performedon Fl-4. Contour plots: demonstrate CD8þ and CD8�
proliferation with PHA and beryllium vs. unstimulatedcontrol. Central histograms: illustrate CFSE/CD8þ T-cellresponse stimulated by PHA, beryllium vs. negativecontrol. Bottom histograms: illustrate CFSE/CD8� T-cellproliferation response stimulated by PHA, berylliumwith vs. negative control. Delta PD in the corners of his-tograms represents the initial proliferation of T cellspopulation. (C) Contour plot of cells of an individualwith a positive BeLPT. Cells were labeled with CFSEand then cultured in the presence of 100 lM BeSO4
for seven days. Cells were harvested and divided intotwo aliquots. a. One aliquot was surface stained withCD3, CD4 and CD8. b. Another aliquot was permeabil-ized before staining with CD3, CD4 and CD8. Smallcells were initially identified by forward and side scatterand then gated on CD3þ cells. The contour plots illus-trate the CD4 and CD8 staining patterns of the CD3þ
population. R3 (CD4high) þ R4 (CD4low) ¼ R6. The per-centages represent the proportion of the cells in theselected population in reference to the initial small cellpopulation identified. [Color figure can be viewed in theonline issue, which is available at www.interscience.wiley.com.]
269A FLOW CYTOMETRIC BLOOD BERYLLIUM LYMPHOCYTE PROLIFERATION TEST
Cytometry Part B: Clinical Cytometry DOI 10.1002/cyto.b

Because cultured T-cells CD3þCD4low may contain notonly CD4 T-cells with the surface CD4 marker that hasbeen down regulated, but also CD8þ T-cells, we replacedTO-PRO-3 by CD8APC (Fig. 1C) due to allowance of con-firmed viability of CD3þCD4 þ T-cells and measureddelta PD and SI of CD3þCD8þ and CD3þCD4þ T-cellsproliferation separately (Fig. 2B, Table 3). As expected,no proliferation to beryllium was noted from CD8þ Tcells in all three experimental groups while strong posi-tive response was defined to Candida and PHA.
Because of the fact, that activated cytotoxic T-cells of-ten internalize the CD4 marker, we performed intracellu-lar staining of proliferating under beryllium stimulationCD4 and CD8 T-cells and demonstrated, that over ex-pressed CD4high and CD4low populations are parts ofone CD4 T-cell population with lower fluorescence (Fig.2C), whereas CD8þ T-cells population remainedunchanged as was earlier reported (17). Confirmation ofthe fact, that CD8 T cells are not able not proliferate byberyllium stimulation, allowed the authors to combineCFSE/CD3þ/CD4þ T cells results from both experimentalgroups to one group.
To establish cutoffs for delta PD and because CD4high
and CD4low results could not be summarized to enumerateCD4þ proliferating T cells, we have chosen a different gat-ing strategy to assure appropriate measurement of CD4T-cells (gating on CD3þCD4þ T-cells population, Fig. 1C)and recalculated delta PD and SI in the combined experi-mental group (Table 3). This gating strategy allows per-forming comparison analysis of CFSE/CD4þ T cell deltaPD with similar marker delta CPM in the existing BeLPT.
Comparison Analysis Between Be-LPT and CFSEProliferation Tests
In Table 4 we compared BeLPT, determined by stand-ard SI, and delta PD of CFSE on a split specimen. Weexpressed the level of agreement between tests as a jstatistics. The data included 53 records from 38 beryl-lium-exposed, sensitized subjects and 15 unexposeddonors. Number of observed agreements: 45 (84.91% ofthe observation); 8 (15.1%) demonstrated disagreementbetween two tests. Number of agreements expected bychance: 28.1 (53.01% of all observations), j ¼ 0.679, the
Table 3Mitogen and Antigen-Induced CD3þ/CD4þ and CD3þ/CD8þ T-Lymphocyte Proliferative Responses (Mean 6 SEM)
From Beryllium-Sensitized and Control Subjects Measured by CSFE Assay (Day 7)
Subjects groupsNormal controls
SI < 3.0 to be (n ¼ 15)Beryllium-sensitized
SI < 3.0 to be (n ¼ 18)Beryllium-sensitized
SI > 3.0 to be (n ¼ 20)
Stimulants SI PD Delta PD SI PD Delta PD SI PD Delta PD
CD4þ
PHA 33.60 6 5.00 0.910 6 0.027 77.20 6 18.20 0.943 6 0.031 51.60 6 14.60 0.832 6 0.063Candida 9.60 6 3.90 0.259 6 0.112 6.40 6 2.60 0.049 6 0.016 2.10 6 0.60 0.018 6 0.011Be 10 lM 1.20 6 0.36 0.008 6 0.015 1.50 6 1.18 0.007 6 0.002 7.60 6 4.50* 0.113 6 0.084*
Be 100 lM 0.75 6 0.21 �0.012 6 0.008 2.80 6 1.20 0.019 6 0.007 8.70 6 5.50* 0.125 6 0.102*
CD8þ n ¼ 4 n ¼ 4 n ¼ 7PHA 48.00 6 15.20 0.798 6 0.161 106.00 6 29.40 0.927 6 0.028 82.7 6 17.8 0.930 6 0.039Candida 5.00 6 1.20 0.069 6 0.021 15.30 6 9.30 0.072 6 0.031 11.00 6 6.7 0.138 6 0.105*
Be 10 lM 0.62 6 0.08 �0.007 6 0.002 1.30 6 0.16 0.003 6 0.002 1.30 6 0.42 �0.007 6 0.010Be 100 lM 0.60 6 0.18 �0.006 6 0.004 1.50 6 0.50 0.005 6 0.005 1.31 6 0.34 �0.005 6 0.009
SI, Stimulation index; Be, beryllium; delta PD, delta proportion of cells that divided.*P < 0.05 versus controls.
Table 2Mitogen and Antigen-Induced CD3þ/CD4high and CD3þ/CD4low Responses (mean 6 SEM) From Beryllium-Sensitized
and Control Subjects Measured by CSFE Assay (Day 7)
Subjects groupsNormal controls
SI < 3.0 to be (n ¼ 9)Beryllium-sensitized
SI < 3.0 to be (n ¼ 11)Beryllium-sensitized
SI > 3.0 to be (n ¼ 13)
Stimulants SI PD Delta PD SI PD Delta PD SI PD Delta PD
CD4high
PHA 29.00 6 3.60 0.830 6 0.036 34.70 6 11.40 0.845 6 0.054 39.50 6 7.00 0.803 6 0.042Candida 2.30 6 0.40 0.048 6 0.020 3.00 6 0.70 0.056 6 0.019 3.80 6 1.00 0.052 6 0.010Be 10 lM 1.10 6 0.19 0.002 6 0.007 1.40 6 0.30 0.013 6 0.009 2.80 6 0.80* 0.049 6 0.033*
Be 100 lM 1.40 6 0.44 0.006 6 0.013 2.00 6 0.70 0.041 6 0.038 2.00 6 0.58* 0.021 6 0.013*
CD4low
PHA 33.20 6 8.40 0.720 6 0.046 32.80 6 14.50 0.733 6 0.074 33.00 6 8.20 0.710 6 0.043Candida 2.70 6 0.70 0.046 6 0.013 2.30 6 0.50 0.059 6 0.026 5.10 6 1.10 0.146 6 0.039Be 10 lM 1.10 6 0.26 �0.014 6 0.017 1.10 6 0.11 0.006 6 0.006 3.44 6 1.20* 0.092 6 0.048*
Be 100 lM 1.50 6 0.38 0.006 6 0.033 1.80 6 0.66 0.033 6 0.026 2.90 6 0.93* 0.062 6 0.035*
SI, Stimulation index; Be, beryllium; delta; delta PD-delta proportion of cells that divided.*P < 0.05 versus controls.
270 MILOVANOVA
Cytometry Part B: Clinical Cytometry DOI 10.1002/cyto.b
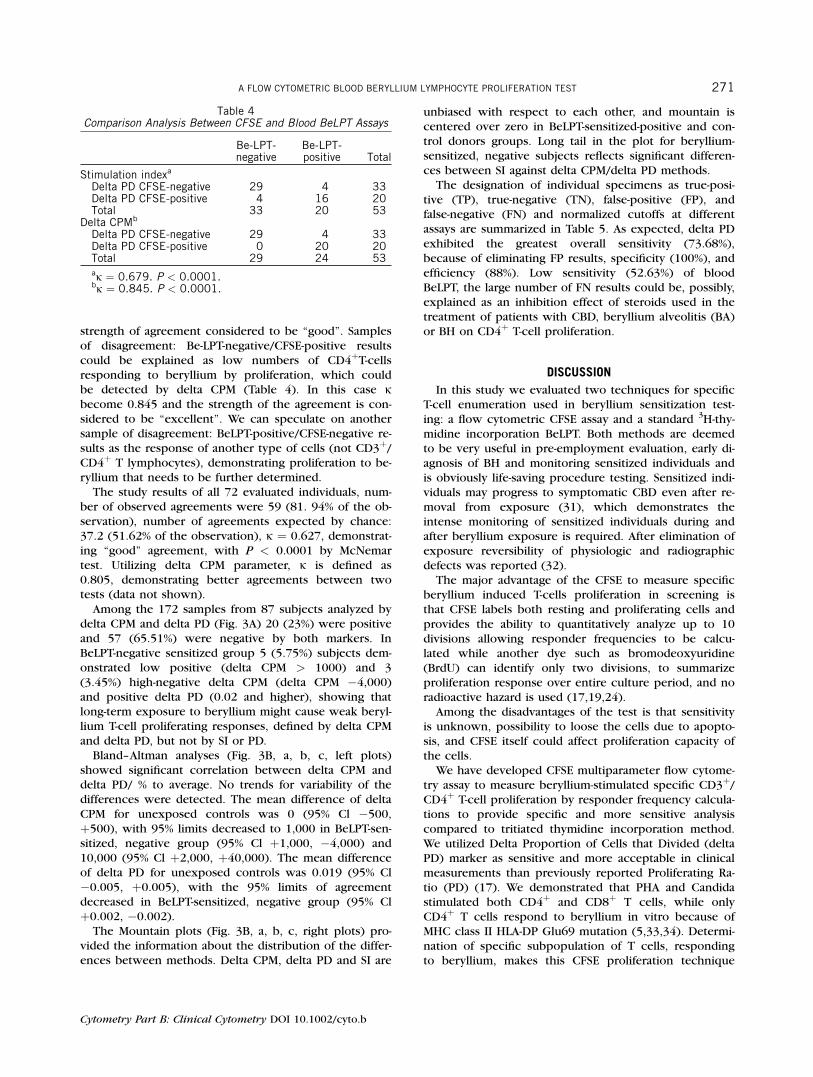
strength of agreement considered to be ‘‘good’’. Samplesof disagreement: Be-LPT-negative/CFSE-positive resultscould be explained as low numbers of CD4þT-cellsresponding to beryllium by proliferation, which couldbe detected by delta CPM (Table 4). In this case jbecome 0.845 and the strength of the agreement is con-sidered to be ‘‘excellent’’. We can speculate on anothersample of disagreement: BeLPT-positive/CFSE-negative re-sults as the response of another type of cells (not CD3þ/CD4þ T lymphocytes), demonstrating proliferation to be-ryllium that needs to be further determined.
The study results of all 72 evaluated individuals, num-ber of observed agreements were 59 (81. 94% of the ob-servation), number of agreements expected by chance:37.2 (51.62% of the observation), j ¼ 0.627, demonstrat-ing ‘‘good’’ agreement, with P < 0.0001 by McNemartest. Utilizing delta CPM parameter, j is defined as0.805, demonstrating better agreements between twotests (data not shown).
Among the 172 samples from 87 subjects analyzed bydelta CPM and delta PD (Fig. 3A) 20 (23%) were positiveand 57 (65.51%) were negative by both markers. InBeLPT-negative sensitized group 5 (5.75%) subjects dem-onstrated low positive (delta CPM > 1000) and 3(3.45%) high-negative delta CPM (delta CPM �4,000)and positive delta PD (0.02 and higher), showing thatlong-term exposure to beryllium might cause weak beryl-lium T-cell proliferating responses, defined by delta CPMand delta PD, but not by SI or PD.
Bland–Altman analyses (Fig. 3B, a, b, c, left plots)showed significant correlation between delta CPM anddelta PD/ % to average. No trends for variability of thedifferences were detected. The mean difference of deltaCPM for unexposed controls was 0 (95% Cl �500,þ500), with 95% limits decreased to 1,000 in BeLPT-sen-sitized, negative group (95% Cl þ1,000, �4,000) and10,000 (95% Cl þ2,000, þ40,000). The mean differenceof delta PD for unexposed controls was 0.019 (95% Cl�0.005, þ0.005), with the 95% limits of agreementdecreased in BeLPT-sensitized, negative group (95% Clþ0.002, �0.002).
The Mountain plots (Fig. 3B, a, b, c, right plots) pro-vided the information about the distribution of the differ-ences between methods. Delta CPM, delta PD and SI are
unbiased with respect to each other, and mountain iscentered over zero in BeLPT-sensitized-positive and con-trol donors groups. Long tail in the plot for beryllium-sensitized, negative subjects reflects significant differen-ces between SI against delta CPM/delta PD methods.The designation of individual specimens as true-posi-
tive (TP), true-negative (TN), false-positive (FP), andfalse-negative (FN) and normalized cutoffs at differentassays are summarized in Table 5. As expected, delta PDexhibited the greatest overall sensitivity (73.68%),because of eliminating FP results, specificity (100%), andefficiency (88%). Low sensitivity (52.63%) of bloodBeLPT, the large number of FN results could be, possibly,explained as an inhibition effect of steroids used in thetreatment of patients with CBD, beryllium alveolitis (BA)or BH on CD4þ T-cell proliferation.
DISCUSSION
In this study we evaluated two techniques for specificT-cell enumeration used in beryllium sensitization test-ing: a flow cytometric CFSE assay and a standard 3H-thy-midine incorporation BeLPT. Both methods are deemedto be very useful in pre-employment evaluation, early di-agnosis of BH and monitoring sensitized individuals andis obviously life-saving procedure testing. Sensitized indi-viduals may progress to symptomatic CBD even after re-moval from exposure (31), which demonstrates theintense monitoring of sensitized individuals during andafter beryllium exposure is required. After elimination ofexposure reversibility of physiologic and radiographicdefects was reported (32).The major advantage of the CFSE to measure specific
beryllium induced T-cells proliferation in screening isthat CFSE labels both resting and proliferating cells andprovides the ability to quantitatively analyze up to 10divisions allowing responder frequencies to be calcu-lated while another dye such as bromodeoxyuridine(BrdU) can identify only two divisions, to summarizeproliferation response over entire culture period, and noradioactive hazard is used (17,19,24).Among the disadvantages of the test is that sensitivity
is unknown, possibility to loose the cells due to apopto-sis, and CFSE itself could affect proliferation capacity ofthe cells.We have developed CFSE multiparameter flow cytome-
try assay to measure beryllium-stimulated specific CD3þ/CD4þ T-cell proliferation by responder frequency calcula-tions to provide specific and more sensitive analysiscompared to tritiated thymidine incorporation method.We utilized Delta Proportion of Cells that Divided (deltaPD) marker as sensitive and more acceptable in clinicalmeasurements than previously reported Proliferating Ra-tio (PD) (17). We demonstrated that PHA and Candidastimulated both CD4þ and CD8þ T cells, while onlyCD4þ T cells respond to beryllium in vitro because ofMHC class II HLA-DP Glu69 mutation (5,33,34). Determi-nation of specific subpopulation of T cells, respondingto beryllium, makes this CFSE proliferation technique
Table 4Comparison Analysis Between CFSE and Blood BeLPT Assays
Be-LPT-negative
Be-LPT-positive Total
Stimulation indexa
Delta PD CFSE-negative 29 4 33Delta PD CFSE-positive 4 16 20Total 33 20 53
Delta CPMb
Delta PD CFSE-negative 29 4 33Delta PD CFSE-positive 0 20 20Total 29 24 53aj ¼ 0.679. P < 0.0001.bj ¼ 0.845. P < 0.0001.
Cytometry Part B: Clinical Cytometry DOI 10.1002/cyto.b
271A FLOW CYTOMETRIC BLOOD BERYLLIUM LYMPHOCYTE PROLIFERATION TEST

FIG. 3. (A) Comparison analysis of blood BeLPT results of the experimental groups by delta CPM (left upper plot) and SI (right upper plot). Com-parison analysis of CFSE proliferation results of the experimental groups by delta PD (left lower plot) and PD (right lower plot). *Denotes the signifi-cance (p<0.05) of differences between positive and negative responses. (B) Relationship between the different techniques used for measuring T cellproliferation (delta CPM/delta PD/% average) of the experimental groups: a. BeLPT-sensitized, positive; b BeLPT-sensitized, negative; c. controldonors. Left plots: Bland–Altman analysis: solid line represents the regression line; dotted lines show 95% limits of agreement. Right plots: Mountainplots comparison of delta CPM and delta PD to SI of blood BeLPT being used as the reference method: a. BeLPT-sensitized, positive; b. BeLPT-sen-sitized, negative; c. control donors. [Color figure can be viewed in the online issue, which is available at www.interscience.wiley.com.]
Cytometry Part B: Clinical Cytometry DOI 10.1002/cyto.b

compatible to BeLPT, and would have great potential tobe developed further for early diagnosis of sensitizationto beryllium.
Recently, a subset of antigen-specific CD4þ cytotoxicT-cells was described (35). These cells do not expressCD45RA, nor the chemokine receptor CCR7; they alsohave lack of CD27 and CD28 markers (36). By bindingto MHC class II molecules, CD4 serves as a co-receptorduring Ag recognition by the TCR. CD4 contributes tothe formation of cooperative assembly of TCR-MHC classII complexes. During T-cell activation, surface expressionof toxic CD4 T cells and triggered TCRs are down-regu-lated (37,38). We demonstrated down-regulation of cyto-toxic beryllium specific proliferating CFSE/CD3þ/CD4þ
T-cells by surface and intracellular staining, determinedthe optimal gating strategy and defined delta PD cutoff.
Genetic counseling could be implicated in sensitizedsubjects for HLA-DPGlu69 mutation (27,39). Testing forcarrier status in a pre-employment population, however,is problematic not only because of ethical issues butbecause HLA-DPGlu69 is a haplotype frequently encoun-tered within the general population (40).With a CBD dis-ease frequency of 5% in exposed workers, the positivepredictive value of this test has been calculated to beonly 8.3%–14.3% in different racial groups (40). Utilizingspecific delta CPM in BeLPT and delta PD of specificCD4 T cell in CFSE assay we might focus and improvethe quality of genetic pre-employment testing.
The major advantage of BeLPT is that this method sen-sitive and well established, but it gives no informationabout responding lymphocyte subsets, requires radioac-tivity and has high inter- and intralaboratory variability,there is no dose-response and data-related relationshipbetween beryllium exposure and sensitization, longpotential duration from first exposure to positive(41,42). The test may produce both false-positive andfalse-negative results being unable to identify specificpopulation responding, the estimated predictive valuepositive of a single unconfirmed BeLPT for CBD is 52%(16). BeLPT does not differentiate between persons whoare sensitized and those who have CBD (11). By determi-nation of beryllium specific CD3þ/CD4þ T lymphocyte
proliferation, CFSE flow cytometric test demonstrates adistinct advantage over the 3H-tritiated thimidine assayand might help to understand explain intra- and inter-laboratory variability.Final results of the BeLPT are expressed as a Stimulation
Index, where the mean counts per minute of control (beryl-lium-free) cultures are divided into the mean counts per mi-nute of each beryllium-exposed culture. We suggested deltaCPM as more sensitive marker for recognizing of low beryl-lium specific T-cell proliferation in pre-clinical evaluation.We determined good agreement between the tests: almost70% of the samples were either positive or negative by bothtests. We suggested that, possibly, Be-LPT-negative/CFSE-positive response can be explained as low numbers ofCD4þT-cells responding to beryllium by proliferation thatcould not be detected by SI; BeLPT-positive/CFSE-negativeresults could be suggested as unknown type of cells (notCD3þ/CD4þ T lymphocytes), responding by proliferationto beryllium that needs to be determined in future. Replac-ing SI by delta CPM, we improved the agreement betweentests and confirmed stronger sensitivity of CFSE test.A comparison between SI and delta CPM in BeLPT, as
well as PD and delta PD in CFSE tests, revealed the sig-nificant difference between positive and negative results,and detected potentially susceptible to hypersensitivitysubjects in BeLPT-sensitized, negative group (Fig. 3A).Results of Bland & Altman analysis shows that no trendfor a variability of differences was detected, though CFSEassay is more sensitive than BeLPT. By Mountain plotswe demonstrated that the distribution of differenceswith SI more expressed than between delta CPM ordelta PD.Current immunological testing for beryllium sensitiza-
tion claims the sensitivity range from 38% to 100%, andspecificity, 97%–100% (4,6,43). In our observations deltaPD marker in CFSE assay and delta CPM marker inBeLPT demonstrated much higher sensitivity, specificityand efficiency than standard proliferative ratio in CFSEor/and SI in BeLPT.In conclusion, we have demonstrated that CFSE blood
lymphocyte proliferation test is useful for enumeratingantigen-specific proliferating population of both strong
Table 5Sensitivity, Specificity, and Efficiency of BeLTP and CFSE Tests With the Different Cell Proliferation Markers (n ¼ 87)
Testsubjects
BeLPT CFSE
SI(cutoff 3.0)
Delta CPM(cutoff 500)
PD(cutoff 0.25)
Delta PD(cutoff 0.015)
TP 20 26 23 28FP 5 3 2 0TN 44 46 47 49FN 18 12 15 10Sensitivity (%)a,b 52.63 68.42 60.52 73.68Sensitivity (%)a,b 89.79 93.87 95.91 100.00Efficiency (%)a,b 71.26 82.75 80.45 88.50
aSensitivity, specificity, and efficiency were calculated using the following formula: sensitivity ¼ TP/(TPþFN) 3 100; specificity ¼TN/(TNþFP) 3 1000, and efficiency ¼ (TPþTN)/(TPþTNþFPþFN) 3 100.TP, True-positive; TN, true-negative; FN, false-positive;FN, false-negative.
bP < 0.05 versus controls.
273A FLOW CYTOMETRIC BLOOD BERYLLIUM LYMPHOCYTE PROLIFERATION TEST
Cytometry Part B: Clinical Cytometry DOI 10.1002/cyto.b

and weak responses of the original cells and may de-velop dose- and time-dependent relationship for BH toaid in the diagnosis (and, perhaps, prognosis). The CFSEflow cytometric method described, is not only radioactiv-ity-free, but can identify a specific cell population, char-acterizing the proliferation response over the entire cul-ture period. This test can be quality controlled to agreater extent, than BeLPT, to allow better repetitionacross the laboratories, may be supportive in geneticscreening test in pre-employment evaluation. This assay,together with delta CPM marker in standard BeLPT, maybe important in early diagnosis of sensitivity to beryl-lium, will provide the opportunity for the further identi-fication of new biomarkers, that may enhance diagnosisand provide prognostic information, and a beneficial oralternative addition to traditional radioactive lymphocyteproliferation test.
ACKNOWLEDGMENTS
The authors thank Dr. A. Fisher, Dr. M. Rossman, Dr.C. Saltini, Dr. M. Amicosante, Dr. Deubner and Dr. J.Moore for reviewing this manuscript and excellent sug-gestions. The authors sincerely appreciate the uniquehighest professionalism and outstanding work of thereviewers and the editorial board on this manuscript.
LITERATURE CITED1. Barna BP, Culver DA, Yen-Lieberman B, Dweik RA, Thomassen MJ.
Clinical application of beryllium lymphocyte proliferation testing.Clin Diagn Lab Immunol 2003;10:990–994.
2. Kreiss K, Newman LS, Mroz MM, Campbell PA. Screening blood testidentifies subclinical beryllium disease. J Occup Med 1989;31:603–608.
3. Newman LS. Significance of the blood beryllium lymphocyte prolif-eration test. Environ Health Perspect 1996;104 (Suppl 5):953–956.
4. Rossman MD, Kern JA, Elias JA, Cullen MR, Epstein PE, Preuss OP,Markham TN, Daniele RP. Proliferative response of bronchoalveolarlymphocytes to beryllium. A test for chronic beryllium disease. AnnIntern Med 1988;108:687–693.
5. Saltini C, Winestock K, Kirby M, Pinkston P, Crystal RG. Mainte-nance of alveolitis in patients with chronic beryllium disease byberyllium-specific helper T cells. N Engl J Med 1989;320:1103–1109.
6. Rossman MD. Chronic beryllium disease: Diagnosis and manage-ment. Environ Health Perspect 1996;104 (Suppl 5):945–947.
7. Rossman MD. Chronic beryllium disease: A hypersensitivity disor-der. Appl Occup Environ Hyg 2001;16:615–618.
8. Kreiss K, Miller F, Newman LS, Ojo-Amaize EA, Rossman MD, SaltiniC. Chronic beryllium disease—From the workplace to cellular im-munology, molecular immunogenetics, and back. Clin ImmunolImmunopathol 1994;71:123–129.
9. Deubner D, Kelsh M, Shum M, Maier L, Kent M, Lau E. Berylliumsensitization, chronic beryllium disease, and exposures at a beryl-lium mining and extraction facility. Appl Occup Environ Hyg2001;16:579–592.
10. Henneberger PK, Cumro D, Deubner DD, Kent MS, McCawley M,Kreiss K. Beryllium sensitization and disease among long-term andshort-term workers in a beryllium ceramics plant. Int Arch OccupEnviron Health 2001;74:167–176.
11. Maier LA. Beryllium health effects in the era of the beryllium lym-phocyte proliferation test. Appl Occup Environ Hyg 2001;16:514–520.
12. National Occupational Hazard Survey: National Institute for occupa-tional safety and health. Washington, DC:US Department of Health,Education, and Welfare; 1978. Report nr DHEW Publication No.(NIOSH)78–114.
13. McCanlies EC, Kreiss K, Andrew M, Weston A. HLA-DPB1 andchronic beryllium disease: A HuGE review. Am J Epidemiol 2003;157:388–398.
14. Newman L.Update to chronic beryllium disease. New developmentsin occupational and environmental health. In: PostgraduateCourse 6, American Thoracic Society, Atlanta, Georgia; 2002. pp 1–13.
15. Henneberger PK, Goe SK, Miller WE, Doney B, Groce DW. Indus-tries in the United States with airborne beryllium exposure and esti-mates of the numers of current workers potentially exposed.J Occup Environ Hyg 2004;1:648–659.
16. Deubner DC, Goodman M, Iannuzzi J. Variability, predictive value,and uses of the beryllium blood lymphocyte proliferation test(BLPT): Preliminary analysis of the ongoing workforce survey. ApplOccup Environ Hyg 2001;16:521–526.
17. Milovanova T, Popma S, Cherian S, Moore JS, Rossman ,MD. Flowcytometric test for beryllium sensitivity. Cytometry B Clin Cytome-try 2004;60:23–30.
18. Farris GM, Newman LS, Frome EL, Shou Y, Barker E, Habbersett RC,Maier L, Smith HN, Marrone BL. Detection of beryllium sensitivityusing a flow cytometric lymphocyte proliferation test: The Immuno-Be-LPT. Toxicology 2000;143:125–140.
19. Bernard S, Pujo-Menjouet L, Mackey MC. Analysis of cell kineticsusing a cell division marker: Mathematical modeling of experimentaldata. Biophys J 2003;84:3414–3424.
20. Lyons AB. Analysing cell division in vivo and in vitro using flowcytometric measurement of CFSE dye dilution. J Immunol Methods2000;243:147–154.
21. Lyons AB. Divided we stand: Tracking cell proliferation with carbox-yfluorescein diacetate succinimidyl ester. Immunol Cell Biol 1999;77:509–515.
22. Lyons AB, Hasbold J, Hodgkin PD. Flow cytometric analysis of celldivision history using dilution of carboxyfluorescein diacetate succi-nimidyl ester, a stably integrated fluorescent probe. Methods CellBiol 2001;63:375–398.
23. Givan AL, Fisher JL, Waugh M, Ernstoff MS, Wallace PK. A flow cyto-metric method to estimate the precursor frequencies of cells prolif-erating in response to specific antigens. J Immunol Methods 1999;230:99–112.
24. Wells AD, Gudmundsdottir H, Turka LA. Following the fate of individ-ual T cells throughout activation and clonal expansion. Signals fromT cell receptor and CD28 differentially regulate the induction and du-ration of a proliferative response. J Clin Invest 1997;100:3173–3183.
25. Wells AD, Walsh MC, Sankaran D, Turka LA. T cell effector functionand anergy avoidance are quantitatively linked to cell division.J Immunol 2000;165:2432–2443.
26. Spitzer RL, Cohen J, Fleiss JL, Endicott J. Quantification of agree-ment in psychiatric diagnosis. A new approach. Arch Gen Psychia-try 1967;17:83–87.
27. Lehnert NM, Gary RK, Marrone BL, Lehnert BE Inhibition of normalhuman lung fibroblast growth by beryllium. Toxicology 2001;160:119–127.
28. Wang Z, Farris GM, Newman LS, Shou Y, Maier LA, Smith HN, Mar-rone BL. Beryllium sensitivity is linked to HLA-DP genotype. Toxi-cology 2001;165:27–38.
29. Sawyer RT, Parsons CE, Fontenot AP, Maier LA, Gillespie MM, Gott-schall EB, Silveira L, Newman LS. Beryllium-induced TNF-{alpha}production by CD4þ T Cells is mediated by HLA-DP. Am J RespirCell Mol Biol 2004;31:122–130.
30. Maier LA. Clinical approach to chronic beryllium disease and othernonpneumoconiotic interstitial lung diseases. J Thorac Imaging 2002;17:273–284.
31. Maier LA. Genetic and exposure risks for chronic beryllium disease.Clin Chest Med 2002;23:827–839.
32. Bill JR, Mack DG, Falta MT, Maier LA, Sullivan AK, Joslin FG,Martin AK, Freed BM, Kotzin BL, Fontenot AP. Beryllium presenta-tion to CD4þ T cells is dependent on a single amino acidresidue of the MHC class II beta-chain. J Immunol 2005;175:7029–7037.
33. Fontenot AP, Palmer BE, Sullivan AK, Joslin FG, Wilson CC, MaierLA, Newman LS, Kotzin BL. Frequency of beryllium-specific, centralmemory CD4þ T cells in blood determines proliferative response.J Clin Invest 2005;115:2886–2893.
34. Appay V, Zaunders JJ, Papagno L, Sutton J, Jaramillo A, Waters A,Easterbrook P, Grey P, Smith D, McMichael AJ, Cooper JA, Rowland-Jones SL, Kelleher AD. Characterization of CD4(þ) CTLs ex vivo.J Immunol 2002;168:5954–5958.
35. Nikolaeva N, Uss E, Van Leeuwen EM, Van Lier RA, Ten Berge IJ.Differentiation of human alloreactive CD4þ and CD8þ T cells invitro. Transplantation 2004;78:815–824.
36. Janeway CA Jr, Carding S, Jones B, Murray J, Portoles P, RasmussenR, Rojo J, Saizawa K, West J, Bottomly K. CD4þ T cells: Specificityand function. Immunol Rev 1988;101:39–80.
274 MILOVANOVA
Cytometry Part B: Clinical Cytometry DOI 10.1002/cyto.b

37. Viola A, Salio M, Tuosto L, Linkert S, Acuto O, LanzavecchiaA. Quantitative contribution of CD4 and CD8 to T cell anti-gen receptor serial triggering. J Exp Med 1997;186:1775–1779.
38. Bartell SM, Ponce RA, Takaro TK, Zerbe RO, Omenn GS,Faustman EM. Risk estimation and value-of-information analy-sis for three proposed genetic screening programs forchronic beryllium disease prevention. Risk Anal 2000;20:87–99.
39. Amicosante M, Sanarico N, Berretta F, Arroyo J, Lombardi G, LechlerR, Colizzi V, Saltini C. Beryllium binding to HLA-DP molecule carry-ing the marker of susceptibility to berylliosis glutamate beta 69.Hum Immunol 2001;62:686–693.
40. Weston A, Ensey J, Kreiss K, Keshava C, McCanlies E. Racial differ-ences in prevalence of a supratypic HLA-genetic marker immaterialto pre-employment testing for susceptibility to chronic berylliumdisease. Am J Ind Med 2002;41:457–465.
41. Viet SM, Torma-Krajewski J, Rogers J. Chronic beryllium disease andberyllium sensitization at Rocky Flats: A case-control study. Am IndHyg Assoc J 2000;61:244–254.
42. Stange AW, Hilmas DE, Furman FJ, Gatliffe TR. Beryllium sensitiza-tion and chronic beryllium disease at a former nuclear weapons fa-cility. Appl Occup Environ Hyg 2001;16:405–417.
43. Stokes RF, Rossman MD. Blood cell proliferation response to beryl-lium: Analysis by receiver-operating characteristics. J Occup Med1991;33:23–28.
275A FLOW CYTOMETRIC BLOOD BERYLLIUM LYMPHOCYTE PROLIFERATION TEST
Cytometry Part B: Clinical Cytometry DOI 10.1002/cyto.b