comparative analysis of metabolic syndrome...
TRANSCRIPT
DOI: 10.1161/CIRCGENETICS.113.000386
1
Comparative Analysis of Metabolic Syndrome Components in over 15,000
African Americans Identifies Pleiotropic Variants:
Results from the PAGE Study
Running title: Carty et al.; Comparative analysis of MetS components in AA
Cara L. Carty, PhD1; Samsiddhi Bhattacharjee, PhD2,3; Jeff Haessler, MS1; Iona Cheng, PhD4;
Lucia A. Hindorff, MPH, PhD5; Vanita Aroda, MD6; Christopher S. Carlson, PhD1; Chun-Nan
Hsu, PhD7; Lynne Wilkens, PhD8; Simin Liu, MD, ScD9; Elizabeth Selvin, PhD, MPH10;
Rebecca Jackson, MD11; Kari E. North, PhD12; Ulrike Peters, PhD1; James S. Pankow, PhD13;
Nilanjan Chatterjee, PhD2; Charles Kooperberg, PhD1
1Division of Public Health Sciences, Fred Hutchinson Cancer Research Center, Seattle, WA; 2National CancerInstitute, 5National Human Genome Research Institute, National Institutes of Health, Bethesda, MD; 3National
Institute of Biomedical Genomics, Kalyani, WB, India; 4Cancer Prevention Institute of California, Fremont, CA; 6MedStar Health Research Institute, Hyattsville, MD; 7University of Southern California, Marina del Rey, CA; 8University of Hawaii Cancer Center, Honolulu, HI; 9Brown University, Providence, RI; 10Johns Hopkins Bloomberg School of Public Health, Baltimore, MD; 11Ohio State University, Columbus, OH; 12University of
North Carolina, Chapel Hill, NC; 13University of Minnesota, Minneapolis, MN
Correspondence:
Cara L. Carty
Division of Public Health Sciences
Fred Hutchinson Cancer Research Center
1100 Fairview Ave N. / M3-A410
Seattle, WA 98109
Tel: 206-667-2873
Fax: 206-667-4142
E-mail: [email protected]
Journal Subject Codes: [90] Lipid and lipoprotein metabolism, [8] Epidemiology, [146] Genomics, [89] Genetics of cardiovascular disease
th Selvin, PhD, MPHPHPHPH
JJJJameseseses S.S.S.S. PPPPanananankokokokow,w,w,w, PPPhhhh
PhD111
a Ne
a dr HS r
PPuP bbblb ic Health ScSS iiienccesss, FrFrFrFrededede Hutuutchchchiniini son CCanccerr RRResesearcrch CeCCenter,, SSSeatattltltltle, WWWWAAAA; 2222NaNaNaN tititiionononal atititionnnnal Human GeGGenomemee Reeeseeae rch Inssstiituteee, Nattioonalll IIInnnnstit ttuteees of HHeaalth,h,h Bethhheh ssds aaa, MDDD; 3NBioioioomememem dididd ccccalalalal GGGenenenomomomomicicics,,,, Kalalllyayayyanininini,,,, WBWBWBB, , InInInndddid aaa;;; 4CaCaCaCancncn ereere PPPPrererereveveveentnttioooon n n n Innnsttttitututte e ee ofofoof CCCCaaala iffffororrornin a,a,a,a, FFFre
ar Health Researccchhhh Instituttte,e,e, HHyattsville, MD; 77Universiiiitytyt of Southeeernrnrn California, Marina drsity of Hawaii CCCCananananceceecerrr r CeCeCeC ntntntnterer,, , HoHoHoHonononoolululululululuu, , , , HIHIHHI;;;; 999BrBrBrBrowowoownnn UnUnUnUnivivviverererersisisitytytyy,, PrPrPrProvovovidididenenenenceccc , RI; 10Johns HSchool of Public Health,,, Baltimore, ,, MD;; 1111111 Ohio State University,y,y, Columbus,,, OH;; 12Univer
North CaCaaCarorororolililinananana,, , ChChChChapapapelelelel HHHHilillill,ll,l, NNNNCCCC;;; 13UnUnUnUniviviverererersisissitytyyty oof ff MiMiMiMinnnnnnesesesesotoo a,a,a,a MMMMininininnenenneapappapololoolisisiss, ,, MNMNMNM
by guest on May 12, 2018
http://circgenetics.ahajournals.org/D
ownloaded from
by guest on M
ay 12, 2018http://circgenetics.ahajournals.org/
Dow
nloaded from
by guest on May 12, 2018
http://circgenetics.ahajournals.org/D
ownloaded from
by guest on M
ay 12, 2018http://circgenetics.ahajournals.org/
Dow
nloaded from
by guest on May 12, 2018
http://circgenetics.ahajournals.org/D
ownloaded from
by guest on M
ay 12, 2018http://circgenetics.ahajournals.org/
Dow
nloaded from

DOI: 10.1161/CIRCGENETICS.113.000386
2
Abstract:
Background - Metabolic syndrome (MetS) refers to the clustering of cardio-metabolic risk
factors including dyslipidemia, central adiposity, hypertension and hyperglycemia in individuals.
Identification of pleiotropic genetic factors associated with MetS traits may shed light on key
pathways or mediators underlying MetS.
Methods and Results - Using the Metabochip array in 15,148 African Americans (AA) from the
PAGE Study, we identify susceptibility loci and investigate pleiotropy among genetic variants
using a subset-based meta-analysis method, ASsociation-analysis-based-on-subSETs (ASSET).
Unlike conventional models which lack power when associations for MetS components are null
or have opposite effects, ASSET uses one-sided tests to detect positive and negative associations
for components separately and combines tests accounting for correlations among components.
With ASSET, we identify 27 SNPs in 1 glucose and 4 lipids loci (TCF7L2, LPL, APOA5, CETP,
LPL, APOC1/APOE/TOMM40) significantly associated with MetS components overall, all P<
2.5e-7, the Bonferroni adjusted P-value. Three loci replicate in a Hispanic population, n=5172.
A novel AA-specific variant, rs12721054/APOC1, and rs10096633/LPL are
MetS components. We find additional evidence of pleiotropy for APOE, TOMM40, TCF7L2 and
CETP variants, many with opposing effects; e.g. the same rs7901695/TCF7L2 allele is
associated with increased odds of high glucose and decreased odds of central adiposity.
Conclusions - We highlight a method to increase power in large-scale genomic association
analyses, and report a novel variant associated with all MetS components in AA. We also
identify pleiotropic associations that may be clinically useful in patient risk profiling and for
informing translational research of potential gene targets and medications.
Key words: metabolic syndrome, population studies, high-density lipoprotein cholesterol, genetic variation, hyperglycemia, ASSET, PAGE Study, African Americans, cardio-metabolic traits, Metabochip
p
e eee anananand d d d nenenenegagagagatitititiveveveve aaaasss ocooo iiaiaa
ons amomomomongngngng ccccomomomompopopoponenn n
E C
C l
Bonferroni adjusted P-value. Three loci replicate in a Hispanic population, n=5
A
p L
a , y pp g ; g
ET,, wewewe iiidededed ntntntifffyyy 2227 y SNPs in 1 glucose annnd ddd 4 44 lipids loci (((TCCCF7FFF L2, LPL, APOA5, C
C11/1//AAAPA OE/TOMOMOMM4M4M4000) ) ) sisisiigngngnififificiciccaantlttt yy assssoociaated wwititith h hh MeMeMMetSSS cccommompoonenn ntntntsss ovovoverrralalalllll, alaaa l
BoBoBoonfnfnfn erroniiii aadjdjuuusteeddd P-vavvalull e. Thhhhrree looci reeplililil ccatee iin aaa Hispppaaanicicic ppppoppppululululatttiooon, nn==5
A-specific variaaantnnt,,, rs12727272100054/APOCOCC1//// ,,, aaandnd rs1s 00000096966633/3 LPPPLLLL// arre
ponents. We findd dd ddadddiddd tiiiionallllff evididididence offff ppplell iiioi tropppy yyff fofff r APAPAPPOEOEOEOE,, TOTOTOTOMM40,,, TCF7L
anaantsts,, mamanyny wwititithh hh opoppoposisisiingng eeffffffffecectstts;; e.e.g.g. ttheheheh ssamamee rsrs79797990101010 69696995/5/5/5 TCTCTCTCF7F7F77L2L2L2L alalallelelelelele iiiss
by guest on May 12, 2018
http://circgenetics.ahajournals.org/D
ownloaded from
DOI: 10.1161/CIRCGENETICS.113.000386
3
Metabolic Syndrome (MetS) is the designation used for the clustering of cardio-metabolic risk
factors within an individual including dyslipidemia, central obesity, high blood pressure and
insulin resistance. Individuals with MetS are at increased risk of chronic diseases including
diabetes and cardiovascular disease, and all-cause mortality.1-4 Prevalence of MetS varies by
race and sex; in the US, it is higher in African American women than men, and higher in
Hispanics than in other race/ethnicity groups.5 Overall, the age-adjusted prevalence ranges from
16-36% in the US and has been increasing in recent years,5 yet the etiology of MetS is not well-
understood. While insulin resistance, obesity, abnormal adipose tissue metabolism and
endothelial dysfunction are key contributors,6, 7 elucidation of the precise MetS pathophysiology
is complicated by the relatedness of these pathways and potentially common underlying
mediators. Investigation of genetic factors associated with several MetS component traits may
shed light on key pathways or mediators underlying the syndrome as a whole, and also aid in
genetic risk prediction of MetS.
As per the National Cholesterol Education Program Adult Treatment Panel III (NCEP-
ATP-III) criteria,4, 8 MetS requires the presence of least three of the five following components:
central obesity, high blood pressure, elevated triglycerides, low high density lipoprotein
cholesterol (HDL), or fasting hyperglycemia; use of medication to treat the prior four conditions
also qualifies. The heritability of MetS, as defined above, is estimated to be approximately 30%,
although heritability of the individual components is generally higher and may vary by
ethnicity.9, 10 Genetic analyses of MetS are complicated by the inherently heterogeneous
definition of MetS. For example, the same three components may not cluster in all MetS cases,
and SNPs may be associated with one MetS component and not with another. This complexity
has prompted the use of novel methods such as factor analysis or gene network analysis to better
e metabolism and
cise MeMMM tStStStS p tttathhhhophphhphyysysysio
a
m
o
k
per the National Cholesterol Ed cation Program Ad lt Treatment Panel III (NCE
atedddd bbbby yy thththhee rerr laaatettetedness of these pathwaysss anand potentially coommmmon underlying
IInvvvev stigation oof genennet cicicc fffactototors aassooociiateedd wiiiththth ssses vverarral MetttS ccooompoooonnnentntnt traaaitttts m
on key yy papapapathththwawaysysys oorr memediatatatorororors undeddede llrlrlyiyiyiy nggg ttthheheh sssynynynyndrdrdromomomeee asas aa wholelelele, and dd llalalsoso aaididid
k ppprediction of MeMM SStS.
hth NNa iti lal CChhollest lol EEdd iti PP AdAd llt TTr tm t PPa ll IIIIII (N(NCCE by guest on May 12, 2018
http://circgenetics.ahajournals.org/D
ownloaded from
DOI: 10.1161/CIRCGENETICS.113.000386
4
characterize the genetic architecture of MetS. Applying a recently described method,
ASsociation analysis based on subSETs (ASSET),11 we sought to identify MetS susceptibility
loci in African Americans and investigate whether the identified genetic variants show evidence
of pleiotropy (i.e. a genetic variant influencing multiple traits), and thus may explain some of the
correlated architecture of MetS traits.
Using the Metabochip genotyping array12 in African Americans from the Population
Architecture using Genomics and Epidemiology (PAGE) Study, we contrast SNP association
findings from ASSET with those from a) logistic regression modeling MetS as a binary outcome,
and b) meta-analysis of the 5 individual components of MetS, coded as binary variables. Unlike
the traditional meta-analysis which may lack power when associations for each of the
components are heterogeneous (i.e. null, or have effects in opposite directions), ASSET uses
one-sided tests to detect positive and negative results for the components separately and
combines the tests taking into account correlations among the components, and correction for
these multiple tests. Significant results from ASSET are tested in an independent Hispanic
population.
Methods
Study Population
The study population includes 15,148 African American (AA) adults from the Atherosclerosis
Risk in Communities (ARIC) and Women’s Health Initiative (WHI) who are part of the
Population Architecture using Genomics and Epidemiology (PAGE) Study.13 Briefly, the ARIC
study is a population-based cohort of non-Hispanic white and AA men and women who were
between 45-64 years of age in 1987-89 and recruited from four U.S. communities: Forsyth
County, North Carolina; Jackson, Mississippi; suburban areas of Minneapolis, Minnesota; and
MetS as a binaryy ooooutuuu
s binary variaiii bbblblessss. UUUU
n
s e
e
he tests taking into account correlations among the components, and correction f
ple tests Significant res lts from ASSET are tested in an independent Hispanicd
nal mememetattata---anananalysysysis which may lack poweeer rr whw en associationns s for each of the
s arrrer heterogenneeeouus (i.ee.e.e null,lll orrr hhaveee efffecects iiinn oopoo pposissite dddirrreccctititioons)))),,,, ASASASSSSETTT uuse
ests tototo ddddetetete ect tt popoposisiitititiveve anddd nnnneeeegativivveee rereeesultltltltss ffofof r thhththe cococompmpmponoononenentttsts sepepepeparararatelelly anand ddd
he tests taking gg ini to account correllal tions among gg thhhhe comppponents, ,, and correction f
plle t ts SiSi ififiic t llt ffr AASSSSETET test ded ii ii dnd ddent HHiis inidd by guest on May 12, 2018
http://circgenetics.ahajournals.org/D
ownloaded from

DOI: 10.1161/CIRCGENETICS.113.000386
5
Washington County, Maryland.14 A subset of the ARIC cohort, n= 3,340 ARIC AA with
available Metabochip genotyping were included in these analyses. The WHI is a study of the
etiology and prevention of chronic diseases in 161,838 postmenopausal women aged 50–79
years at recruitment (1993-98) from 40 clinical centers in the US.15, 16 WHI consists of an
observational study, two clinical trials of postmenopausal hormone therapy (estrogen alone or
estrogen plus progestin), a calcium and vitamin D supplement trial, and a dietary modification
trial. A subset of the baseline WHI cohort, n=11,808 AA women with Metabochip genotyping
data or imputed genotypes were included in these analyses. The independent validation
population includes 5172 self-reported Hispanic/Latina women from the WHI that were
genotyped on the Metabochip as a part of the PAGE Study. All study protocols were approved
by Institutional Review Boards at the participating institutions, and all included participants gave
informed consent.
Outcomes
MetS was defined in men and women according to the American Heart Association/National
Heart Lung and Blood Institute modified NCEP-ATP-
150 mg/dl or treatment for dyslipidemia; HDL levels < 40 mg/dl in men or <50mg/dL in women
8, 17
Practically, these guidelines differ from the NCEP-ATP-III guidelines for the elevated fasting
glucose criterion; the threshold is reduced from 110 to 100 mg/dL, which corresponds to the
recently modified American Diabetes Association criteria for impaired fasting glucose.18 MetS
-missing data for the majority of
pendent validationnnn
he WHWHWHWHIIII thththth tttat wereeee
on the Metabochip as a part of the PAGE Study. All study protocols were appro
o
o
defined in men and omen according to the American Heart Association/Nation
on tttheheheh MMMMetetetabaaa ococochih p as a part of the PAGGE EE StSS udy. All study y ppprotocols were appro
onnnnaaal Review BoBoBoardsdsdss at ththththe paaarrticccippatiniing innsstitttututioioionsnsn , anaand allll inclclclluudedddd pppararrtitiiicipappant
onsentntnt.
ddd fefiin ded ii dd drdiin to thhe AA iri HHe t AAs iciatiio /n/NNa iti by guest on May 12, 2018
http://circgenetics.ahajournals.org/D
ownloaded from

DOI: 10.1161/CIRCGENETICS.113.000386
6
components (three of five) at baseline were included as MetS cases or controls in analyses; for
example, an individual having three of five components but missing data for the other two, was
included as a MetS case, and an individual not meeting criteria for three of the five components,
even if the other two were missing, was included as a control. In both ARIC and WHI, blood
lipids and glucose were measured in fasting samples. Using a tape measure, waist circumference
was measured at the level of the natural waist in a horizontal plane to the nearest 0.5cm. Resting
blood pressure was measured using standard protocols. Baseline medication use was assessed
using a combination of self-report and a medication inventory in ARIC and WHI. For analyses
involving MetS components, binary variables were created using the above criteria to reflect
either the presence or absence of the condition in individuals with non-missing data for that
component. The ASSET methodology, as described below, includes any participant with
baseline data for at least one of the five MetS components.
Genotyping
The Metabochip is a high density genotyping array designed for fine-mapping GWAS-identified
regions for cardio-metabolic and anthropometric traits (including genes previously associated
with blood lipids and glucose, waist circumference, and blood pressure), and also includes
genetic variants to capture ancestral diversity.12 Our analysis includes all polymorphic SNPs with
Genotyping QC procedures have been described previously,19 but briefly, the following SNP QC
e -
excessive heterozygosity (|F| > .35); no over-
C and WHI. For ananananalaaa
above c iriiittett riiiia tttto refefefeflelelelec
r t
.
t
ochip is a high densit genot ping arra designed for fine mapping GWAS iden
resesesencncnceee oror aaabsssenenence of the condition in indndndndivividuals with non-n-n-missing data for that
. TTThe ASSET mmmethhhoododo lololloogo y, aas ddeescrrribbedd bbelooow,w,w,w, innclulluddes annny y y pppap rticcccippppannnttt wiiiithhhh
ta for rr atatatat llleasttt oonene ooffff thththe fififiveeveve MettttSSS cocococompmpononeentststs.
ggg
o hchiip ii hihi hgh dd isit ot iin dde isi ded ff ffiin iing GWGWASAS idid by guest on May 12, 2018
http://circgenetics.ahajournals.org/D
ownloaded from

DOI: 10.1161/CIRCGENETICS.113.000386
7
PCA); and among estimated 1st
degree relative pairs, the 1st degree relatives with lower call rates were dropped. A proportion of
the WHI AA samples (54%) had high quality imputed genotype data that were included in these
analyses. QC methods for the imputation are described in Liu et al. 20
Analysis
SNPs were coded using additive genetic models (0/1/2). Logistic regression was used to test for
study-specific associations between a) SNPs and MetS as a binary outcome, and b) SNPs and
individual MetS components coded as binary variables based on the modified NCEP-ATP-III
guidelines. All models were adjusted for age, sex (except WHI) and global ancestry using
principal components. Determination of ancestry principal components (PCs) was performed
with EIGENSOFT21, 22 as described in Buyske et al. (supplemental methods).19 In both ARIC
and WHI, models were adjusted for the first two ancestry PCs. For each trait, the results
between ARIC and WHI were combined using a fixed effect meta-analysis using inverse-
variance weighting (no notable heterogeneity was observed). We then combined the results for
the five traits in ASSET (http://www.bioconductor.org/packages/devel/bioc/html/ASSET.html)
using R software.23 ASSET uses a fixed effect meta-analysis on an adaptively selected
combination of the traits. As a comparison of the ASSET results, we performed straightforward
fixed effect meta-analysis between the five traits. In the discovery phase to identify MetS
susceptibility loci using either the binary MetS outcome or the ASSET method, significance was
defined as P<2e-7 (i.e. 0.05/169,196 SNPs tested). For investigation of pleiotropy for SNPs that
were significant in the ASSET models, i.e. looking at SNP associations for the individual
components, we used a nominal significance threshold for each component, P<0.05.
modified NCEP-ATTTTPPPP-
globalll ancestrttt y yyy usininininggg
o m
N R
m
R
eighting (no notable heterogeneit as obser ed) We then combined the res lt
ompopoponenenentntnts.s. DeDeDetettt rmination of ancestry prprprinincipal compponenntttts (PCs) was perform
NNNSOOOFT21, 22 ass dddescrrribb dededd in BuBuBuB yyyskke eeet al. (supppppplelelememmm nnntaal mmettthooodddsd ).19999 InIII bbbbothhh h AAARA
moddelelelsss s wewewew re aadjdjdjususttetedddd for thththheeee first ttt twtwtwoooo anncece tststtryyy PCPCPCPCsss. FoFoFoForr eaea hhchch traaaaitiitit, tttthe reresusultltlltss
RIC and WHI were combbbinii dded u iisinggg a ffffiiixi deddd effff ect meta-anallllysyy isii usinggg inverse-
eii hgh iti (( ot bablle hhet ieit bbs d)d) WWe thhe bmbiin ded thhe llt by guest on May 12, 2018
http://circgenetics.ahajournals.org/D
ownloaded from

DOI: 10.1161/CIRCGENETICS.113.000386
8
ASSET
Proposed by Bhattacharjee et al., ASSET11 is a suite of statistical tools designed for pooling
association signals across multiple traits (or studies) when true effects may exist only in a subset
of the traits and could be in opposite directions. The method explores all possible subsets of traits
and evaluates fixed-effect meta-analysis-type test-statistics for each subset. The final test-statistic
is obtained by maximizing the subset-specific test-statistics over all possible subsets and then
evaluating its significance after efficient adjustment for multiple-testing, taking into account the
correlation between test-statistics across different subsets due to overlapping participants (since
multiple phenotypes may be available on participants). The method not only returns a p-value for
the overall evidence of association of a SNP across traits, but also outputs the "best subset"
containing the traits that contributed to the overall association signal. The resulting test is much
more powerful than considering all combinations of traits and using a Bonferroni correction. For
detection of association signals with effects in opposite directions, ASSET allows subset
searches separately for positively- and negatively- associated traits and then combines
association signals from two directions using a chi-square test-statistic.
Validation
For the validation of significant SNPs in the Hispanic population, we used a nominal threshold of
significance, P<0.05.
Results
Overall, 15,148 AA were included in the ASSET analysis; these individuals had Metabochip
genotype data and baseline data for at least one MetS component. A subset of those individuals,
n=12,574, had sufficient non-missing data for the classification of 5,507 MetS cases (43.7%) and
7,067 controls (56.2%). In both ARIC and WHI, the triglycerides component was most
appp ing g participantstststs (s(
ot onlylylly r ttteturns a pp---vvvval
"
the traits that contributed to the overall association signal. The resulting test is m
r n
f
paratel for positi el and negati el associated traits and then combines
evididididenenencecece ooof fff assssosociation of a SNP acrossss trtrtraia ts, but also outttppputs the "best subset"
thheh traits that ccooontrribbbbutedededed to thththt e ovverralll assssociiiaatioioionn signgnal. TTThee e rrresultltltl ininininggg tttest iss m
rful thththanananan connsisiidddedeririingng all ccommomombinaaatititionononons ofofff tttraraitttsss anaananddd usinininngg aa BBBoBonffffererererrororoni cocorrrrecectititioon
f association sigignalllsl wiiiti hhh efffffects inii oppppppositii e ddid rections,,, ASASASA SESESESET TT lalllows subset
tell ff iitii lel dd iti ll iciat ded t iit dd hth bibi by guest on May 12, 2018
http://circgenetics.ahajournals.org/D
ownloaded from
DOI: 10.1161/CIRCGENETICS.113.000386
9
frequently missing, with 4% and 24% missing, respectively. Among those who could be
classified, 38% of ARIC participants met MetS criteria, and 46% of WHI women had MetS
(Table 1). In ARIC, MetS cases were more likely to be female than controls. In both ARIC and
WHI, the high triglycerides component was the least prevalent component in MetS cases, and
also was rare (~5%) in controls.
Discovery
A total of 27 SNPs were significant (P<2e-7) in the 2-sided ASSET models (Table 2). Given
that many SNPs in each Metabochip locus are in high LD with each other and not independent,
we restrict further discussion to the most significant SNPs, i.e. ‘top SNPs’, in each locus and to
other significant SNPs that are in low LD (r2<0.2 in AA) with these top SNPs for a total of 11
SNPs in 5 loci. Only one SNP was significant in the logistic regression analysis
(rs10096633/LPL) or in the meta-analysis of MetS components (rs12721054/APOC1). As
indicated in Table 2, these two SNPs were also significant in the ASSET analysis.
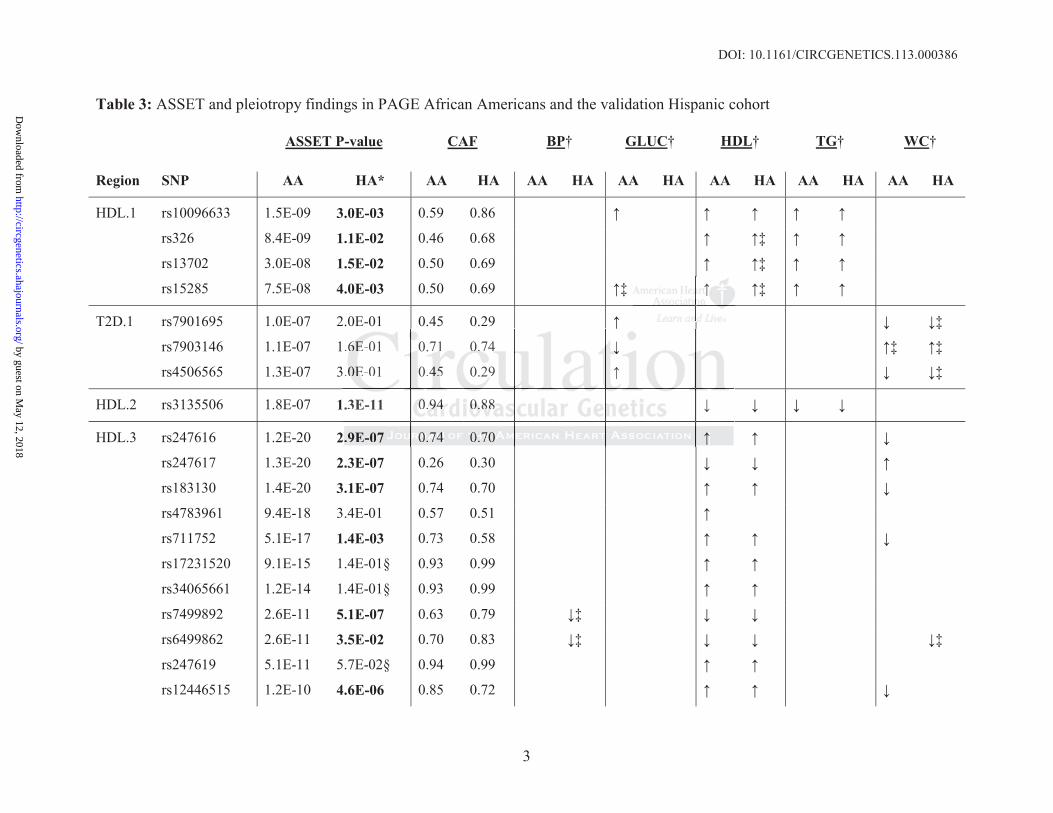
Pleiotropy
Of the top ASSET SNPs: rs12721054/APOC1 was associated with all five MetS components;
rs10096633/LPL was associated with glucose, triglycerides and HDL; rs3135506/APOA5 was
associated with triglycerides and HDL; rs7901695/TCF7L2 was associated with waist
circumference and glucose; and rs247616/CETP, rs7412/APOE and rs61679753/TOMM40 were
associated with waist circumference and HDL (Table 3). Several top SNPs in CETP were
significantly associated with only the HDL component in ASSET: rs7205692, rs247619,
rs6499862, and rs7499892. Pleiotropy results for other significant SNPs are shown in Table 3.
As an illustration of the ASSET method, results for rs247616 from the ASSET, logistic
regression model of MetS, and the meta-analysis of MetS components are plotted in Figure 1.
ther and not indeppppenenenend
NPs’, iiiin eachhhh lllol cuussss aaaan
f 2 f
l
n
ficananant tt SNSNSNSNPsPsPs thahahaatttt are in low LD (r2<0.2 in nn AAAA ) with these topopop SNPs for a total of
looocii. Only onee SSSNPP P wassss ssis gnnnififificccanant iiin thee lloggisisistititicccc rregggreessiononn aaanannalysisiiis
3/LPPPPLLLL// )) )) orororo in ttthhehe memettata-anaaalyylylysis ofofoff MMMMetetete SSS cocompmponnononennntsttsts (((rsrsrss12121212727272210111 54545454///APAPAPA OCOCOC1111///// ))). AAAss
n Table 2,,, these two SNSNSNSNPPPs were llalso sigigi iinififificant in hthhhe ASASASASSESESEET TT analysyy is.
by guest on May 12, 2018
http://circgenetics.ahajournals.org/D
ownloaded from

DOI: 10.1161/CIRCGENETICS.113.000386
10
Validation
We investigated MetS traits associations for the 27 SNPs significant in the AA ASSET models in
a large, independent population of Hispanic Americans, n=5172. Characteristics of the
population are presented in Supplementary Table 1. Of the 5172 Hispanic women, 3734 had
sufficient data to be classified into MetS cases (42.6%) and controls (57.4%). In contrast to AA
cases in which high triglycerides was the least prevalent component, in Hispanic cases, high
glucose was the least prevalent component, at 60%. Of the 27 SNPs, 17 SNPs from three loci
(LPL, APOA5, and CETP) were significant in the Hispanic population at P<0.05 (Table 3).
(Note: these loci also replicated at a more stringent threshold of P=0.05/#of loci.) Pleiotropy was
less evident in the Hispanic population, though overall, trends were consistent with AA. None of
the SNPs in the APOC1 or TCF7L2 loci were significant in Hispanics, although the TCF7L2
SNPs were modestly associated with the waist circumference component.
Discussion
While the clinical utility of MetS is a subject of ongoing debate,25 MetS is a highly prevalent
condition, and its prevalence is expected to increase along with the growing obesity epidemic.5
Some propose that obesity is a critical precursor of MetS8, 26, yet interestingly, MetS is also
present among normal-weight individuals (at a prevalence of approximately 5% in NHANES
III)27, which may suggest that genetic factors unrelated to obesity also play a role in MetS
development.28 Indeed, the majority of MetS genes identified in previous studies are from lipid
metabolism pathways,29-31 though glucose30, 31 and blood pressure pathways30 are also
implicated. Our study is consistent with these findings; we identified variants in lipid genes
(LPL, CETP, and APOA5) and in the transcription factor 7-like 2 gene (TCF7L2). TCF7L2
variants are associated with increased risk of type 2 diabetes (T2D), including the intronic SNP
at P<0.05 (Table 3333))).
5/#offff lllloci.iii ))) ) PPPPlllel iooootrtrtrtroop
t in the Hispanic population, though overall, trends were consistent with AA. N
n L
t innnn ttthehehee HHHHisisisspapp ninininiccc population, though oveeerraralll , trends were cooconnnsistent with AA. N
n thththe e APOC1 ororr TCCCFFF7L2222 lociciici wwereere siiiggnifficicant t ininin HHHispappanicss, althththhoughghhgh thtt eee TCTCFFF7L
modededdeststststlylylyl asssocociaiaii tetet dddd wiw thhh ttthehehehe waiaiaisttstst cccciirircucu fmfmffererennenenceee cccommmpoppoponenennt.
by guest on May 12, 2018
http://circgenetics.ahajournals.org/D
ownloaded from
DOI: 10.1161/CIRCGENETICS.113.000386
11
that we identified (rs7903146) which was recently reported in African Americans.32 For these
SNPs, we also describe additional associations with other MetS traits. Importantly, we report
novel associations with multiple MetS traits for rs12721054/APOC1, which may be African-
specific, and rs61679753/TOMM40. The validation of many of the associations in Hispanics,
with the exception of the putative African-specific SNPs, is supportive of the veracity our
findings, especially given that the Hispanic sample has a distinct genetic background from the
AA population.
Although family studies suggest that undetected genetic loci may contribute to the
clustering of MetS components, candidate gene and GWA studies of MetS have had variable
success in identifying reproducible, common genetic mechanisms underlying MetS. Instead,
these studies have generally identified genes from specific pathways which may be strongly
associated with 1 or 2 of the MetS components, but not necessarily 3 or more.29, 30 Similarly,
most factor analysis and principal component (PC) studies have identified several factors
associated with MetS rather than a single common factor.9 In a PC analysis of MetS and related
(inflammation and thrombosis) domains using the IBC-chip genotyping platform, Avery et al.
identified variants in the diverse genes (APOC1, BRAP, and PLCG1) associated with multiple
domains in European-descent individuals.33 Specifically, rs4420638/APOC1 was associated
with elevated plasma glucose, atherogenic dyslipidemia, vascular inflammation, and central
obesity. These APOC1 results are consistent with our findings, although our nearby APOC1
variant, rs12721054, was associated with all 5 MetS components in AA, and is only modestly
correlated with rs4420638, r2=0.39 in AA. (rs4420683 failed our SNP QC so we are unable to
assess its association in AA) Interestingly, rs12721054 is potentially a novel African-descent
variant. It is essentially monomorphic in HapMap-3 CEU and rare in other HapMap-3
may contribute to thhhhe eee
MetSSS hahhh ve hhhhadddd varrrriaiaiaiabbb
i a
e y
w l
r
ith MetS rather than a single common factor 9 In a PC anal sis of MetS and r
identntntifififyiyiyiyingngng rrreprprprodooo ucible, common genettticicicic mmechanisms undededeerlying MetS. Instea
essss hhhave generaalllly iddddeeentififfifieede gggeenesees frooomm sppeeciffficicic ppppatthwwwaays whww iccchhh h maaay yyy beee sstrooonngly
withhhh 111 oooorrr r 222 offf ttthhhehe MMM tetetS cooommpmpmponenenntststs, bbubut ttt nonot ttt neneneccccessssssarilililyyy 3333 oror mmororrreeee.29292929, 3000 SiSSiSimimiillalarl
r analysyy is and pppriiiincipiipi lall compopp nent (PP(PPC)C)C)) studdddiiei s hahhh ve iiidded ntiffffiiiei d dd several factors
iithh MMe StS athhe hth iin lgl ff to 99 IIn PCPC lal iis ff MMe StS dd by guest on May 12, 2018
http://circgenetics.ahajournals.org/D
ownloaded from
DOI: 10.1161/CIRCGENETICS.113.000386
12
populations, e.g. minor allele frequency=1% in HapMap-3 Mexicans. It was recently reported to
be associated with triglycerides in an AA GWAS of lipid traits.34 We found two additional
significant SNPs in this gene-rich region: a missense variant in APOE, rs7412, and rs61679753,
an intronic variant in TOMM40; both variants were associated with the HDL and waist
circumference components and are correlated in AA, though neither is in high LD with
rs12721054/APOC1 in AA (Supplemental Figure 1). Another variant associated with multiple
MetS components in the literature is an intronic SNP in the glucokinase regulatory protein
(GCKR) gene. The rs780094-T allele has been previously associated with increased triglyceride
levels and lower glucose levels in European-descent populations.35, 36 Although GCKR SNPs did
not reach our stringent threshold for statistical significance, we also found strong inverse
associations in AA for triglyceride and glucose components and additionally, the waist
circumference component for rs780094 (ASSET P-value= 7.4e-6) and for the nearby GCKR
variants: rs780093/intron (ASSET P-value=8.3e-6) and rs1260326/missense (ASSET P-
value=7.1e-7). In our study, rs780094 was also weakly associated with a fourth component,
HDL levels (Supplemental Figure 2). With component effects in opposite directions and one
decidedly null component, rs780094 provides another interesting example of the utility of an
approach such as ASSET to illustrate relationships between the MetS components.
Overall, many of our top SNPs have been reported in GWAS of lipids traits
(rs10096633/LPL37, rs247616/CETP 38, rs7412/APOE 39, rs7499892/CETP 40) or T2D
(rs7901695/TCF7L2) 41 in mainly European-descent populations. The CETP association with
MetS has been implicated previously.42 We additionally identified several SNPs with evidence
of pleiotropic effects on MetS components. In addition to the APOC1 variant associated with all
components, variants in APOE, TOMM40, and CETP were associated with HDL and waist
with increased trigigigglylylylyc
Althohhh ughhhh GCGCGCGCKRKRKRKR SSSSNNNN
u
s
n R
7
7) In o r st d rs780094 as also eakl associated ith a fo rth componend
ur stststririringngngenenent t tt thhhrerereshold for statistical signnnifififificicance, we also fofofouuund strong inverse
s innn n AA for triiiglllycerrridde e aana d glglglg ucccoose coompoponeentntttss ss annd aaaddittiooonalalalllllyl , ththhtheee wawawaist
nce cocococompmpmpmponenenttt fffoforr rsrs7877 00009449494 (ASSSSSSS EEEETTTT PPP-vavalulull e=e=e= 7777.444e-6)6)6)6) andndd fffofor ththththeee neararbbyby GCGCGCG KKRK
780093/intron (A(A(A(ASSSSSSSSEETTT PP-value=8.88 3e 6-666)))) andddd rs12626262 03333262626d ///m/ issense (A( SSET P-
7)7) IIn t dd 787800009944 lal klkl iciat ded iithh ffo hth ndd by guest on May 12, 2018
http://circgenetics.ahajournals.org/D
ownloaded from

DOI: 10.1161/CIRCGENETICS.113.000386
13
circumference components, often with effects in opposite directions so that the same allele was
associated with increased risk of having one component (i.e. low HDL) and decreased risk of
having another component (i.e. high waist circumference). TCF7L2, an important locus for
diabetes, was associated with waist circumference and glucose components in opposing
directions, which may make it difficult to detect in the context of MetS. LPL variants were
associated with increased odds of having the triglycerides, HDL and glucose components. In
contrast to the ASSET findings, only one LPL SNP was significantly associated with MetS in the
logistic regression analysis.
While we have mentioned limitations of the conventional approaches, the ASSET method
also has limitations. It clusters associations into three categories: positive, null and negative
associations. For some SNP-trait associations, this categorization may be arbitrary and not
scientifically meaningful, i.e. if no trait has a null association. In cases with no heterogeneity of
effects, ASSET may perform similarly to a conventional meta-analysis, but with an additional
multiple testing penalty. Additionally, the two-sided ASSET test only provides a P-value and
not an overall effect size.
Our use of the Metabochip array has some advantages; namely, we capture and finely
map many of the known cardio-metabolic and anthropometric genetic variants identified to date
and genotype them on a common platform across studies using a centralized, stringent QC
process. However, our ability to identify novel MetS variants or pathways (in gene regions not
previously associated with cardio-metabolic traits in GWAS) is limited. One challenge of the
MetS outcome is that it requires non-missing data for several variables measured at the same
time point. For example, only 83% of our total sample had sufficient data for the MetS analysis.
An advantage of ASSET is that it can be used in samples with missing data to give population
oachhhhes, ththththe ASASASASSEEESETTT T m
m v
s t
l i
S o
sting penalt Additionall the t o sided ASSET test onl pro ides a P al e a
mitatatatioioioi nsnsns. ItItItIt cllllusususters associations into thrhrhrhreeeee categories: possititittivi e, null and negativ
s.. . FFFor some SNSNSNP-ttraaaia t asasasa sociciciciaatiooonns, thtthis ccaateggororrrizizizaatiooonn maay beee aaarbitrtrtrraaaryyy aaand d d d nnot
ly meaeaeaanininininnngfuul,ll iiii.ee. iffifif nnno trraiaiaiitttt hhas a aa nunununullllll aassssocociaaatiititiononon. Inn cccasesess wiw thththth nononono hetettererogogenenei
SET may yy pepp rform iisii imiiilllal rly yy to a conven iitiion llal meta-an lalllysyy is,,, bbbub t with an additio
iti llt AAddddiitiio llll hth t isiddedd ASASSESETT test lnl idid PP lal by guest on May 12, 2018
http://circgenetics.ahajournals.org/D
ownloaded from
DOI: 10.1161/CIRCGENETICS.113.000386
14
level associations with MetS components, though it is important to emphasize that in this case,
these inferences may not be shared among individuals in the population, i.e. ecological fallacy.43
In other words, while a SNP may be associated with 3 or more components in an ASSET
analysis, it should not be inferred that accordingly, the SNP is also associated with MetS in
individuals. Also, ASSET may yield significant results in the absence of pleiotropy, such as we
saw for rs3764261/CETP or identify antagonistic pleiotropy associations inconsistent with
clinical MetS, i.e. the TCFL2 variants. We acknowledge that common underlying cardio-
metabolic mediators may contribute to the observed pleiotropy; SNP effects on multiple traits
may not be independent. (For more discussion of mediated pleiotropy see review by
Solovieff.44) An additional limitation impacts our pleiotropy inferences; namely, the potential
misclassification error inherent in the MetS definition. For example, a user of lipid-lowering
medication due to LDL dyslipidemia would automatically be classified as having at least two
MetS components (HDL and triglycerides) even if he/she had normal HDL and triglyceride
levels. Consistent with ATP III criteria in which the presence of T2D does not preclude a
diagnosis of MetS,8 type 2 diabetics were not excluded from analyses, and account for <10% of
the total sample. But, similarly, a treated diabetic (and therefore classified as having the glucose
component) will likely have more aggressive treatment for cardiovascular disease prevention,
such as use of dyslipidemia medication, even if his/her lipid values are not particularly high,
which could create a spurious pleiotropic relationship between glucose, HDL, and triglycerides.
Although two LPL variants were associated with these three components, we do not see strong
evidence of this scenario in our results; lipids medication use (and potential misclassification)
was low at baseline in the WHI and ARIC AA populations, approximately 7% and 1%
respectively.45 More generally, dichotomization of continuous traits into binary components in
effects on multiple ee e trtrtrtra
y see re iviiiew bbbby yyy
4 n
c n
w
p e
nsistent ith ATP III criteria in hich the presence of T2D does not precl de a
4) AnAnAn aaaddddddd ititititioiii nananal limitation impacts our ppplelell iotropy inferencceees; namely, the poten
caata iooon error inheheherentntt in ththththe MeMeMeM tSSS ddefiniinitioonn. FoFoFor r r r exexee ammmpple, a useseserrr of llllippppiddd-l-lllowwweerin
due tttooo o LDLDLDL L dydyd lslslipipi iddidideme iaiaa wwwwould ddd auauautoooomamatititicacalllly yy bebbebe cccllllasssssssififififieiei dddd aas hhhhavavava iiiing attat llleaea tstst tttw
ponents (H( DL a ddnd trigiigi lylyl ceriiiides) )) ) even iiifff f hehhh ///shehhh haddd normall l HDHDHDL LL and trigglyyceride
iistent iithh ATATPP IIIIII iite iri iin hihi hch thhe fof T2T2DD dd t lcl dd by guest on May 12, 2018
http://circgenetics.ahajournals.org/D
ownloaded from
DOI: 10.1161/CIRCGENETICS.113.000386
15
this analysis also could result in loss of power and misclassification, although we expect this
misclassification error to be non-differential with respect to genotype and any potential bias to be
towards the null.
In summary, our discovery and validation results support previous genetic findings
emphasizing the importance of lipids traits for MetS. Of the 27 significant variants, 24 were
associated with the low HDL component in AA. With the exception of the potentially AA-
specific APOC1 variant which was associated with all MetS components, we did not find strong
evidence of a single underlying heritable factor for MetS clustering. This result is consistent
with other studies suggesting that a complex genetic architecture underlies MetS.9 However, we
did identify a number of pleiotropic variants in AA, many demonstrating antagonistic pleiotropy
for cardio-metabolic traits important for MetS. We also report SNP associations for these
important cardiometabolic traits in a population with a high burden of MetS, Hispanics, though
pleiotropy findings in the Hispanic population were attenuated, perhaps due to reduced power in
the smaller sample. However, if confirmed, such information on pleiotropy, and particularly,
alleles with opposing effects, may be clinically important, as it could inform translational
research of potential gene targets and be useful in risk profiling and in the development,
marketing and prediction of side effects of new medications.46 Additionally, we highlight the
value of using new methods to increase power and efficiency in large scale genomic association
analyses, and demonstrate challenges related to the use of the MetS construct in large-scale
genomic studies.
Acknowledgments: The PAGE consortium thanks the staff and participants of all PAGE studies for their important contributions. The authors thank the WHI investigators and staff for their dedication, and the study participants for making the program possible. A full listing of WHI investigators can be found at:
This result is consiiiiststststen
rlies MeMMM tStStStS.9999 HHHHowwwweeeev
y o
m
c o
f w
sample Ho e er if confirmed s ch information on pleiotrop and partic larl
y a nununumbmbmbmbererer ooof plplplpleiotropic variants in AAAA, mmany demonstratttinininng antagonistic pleio
mmmem ttaatabolic traitts impopoortanannntt t for rr MeMeMettS. WWe aallso rerepopopoporrt SSSNNP aassssoccciaaaationnnns ss fooorrr theseese
cardioioiiomemememetatatabobolililicc tttrtraiaiittsts in a poopopopulatittitionononon witittith hhh aa hihihighghghgh bbbuuurdededennnn ofoff MMMMetSSSS, HHHHiiispapa iininicscs, thththo
findingsgg in the HiHiHH spppanicii pppopppulllatiiioi n were attenuated,d,d ppperhahhh pspp dddue to reduced popp w
lle HH ifif fifi ded hch ii fnf iti lpl ieiot dd rtiic ll by guest on May 12, 2018
http://circgenetics.ahajournals.org/D
ownloaded from
DOI: 10.1161/CIRCGENETICS.113.000386
16
https://cleo.whi.org/researchers/Documents%20%20Write%20a%20Paper/WHI%20Investigator%20Long%20List.pdf
Funding Sources: (a) This work is supported by the Population Architecture Using Genomics and Epidemiology (PAGE) program which is funded by the National Human Genome Research Institute (NHGRI) [U01HG004803 (to the Genetic Epidemiology of Causal Variants Across the Life Course (CALiCo) program, U01HG004798 (to the Epidemiologic Architecture of Genes Linked to Environment (EAGLE)), U01HG004802 (to the Multi-Ethnic Cohort (MEC)), U01HG004790 (to the Women’s Health Initiative (WHI)), and U01HG004801 (to the PAGE Coordinating Center), and their respective NHGRI ARRA supplements. The contents of this paper are solely the responsibility of the authors and do not necessarily represent the official views of the NIH. The complete list of PAGE members can be found at http://www.pagestudy.org. (b) The data and materials included in this report result from collaboration between the following studies. Funding support for the “Epidemiology of putative genetic variants: The Women’s Health Initiative” study is provided through the NHGRI PAGE program (U01HG004790 and its NHGRI ARRA supplement). The WHI program is funded by the National Heart, Lung, and Blood Institute, National Institutes of Health, U.S. Department of Health and Human Services through contracts HHSN268201100046C, HHSN268201100001C, HHSN268201100002C, HHSN268201100003C, HHSN268201100004C, and HHSN271201100004C. Funding support for the Genetic Epidemiology of Causal Variants Across the Life Course (CALiCo) program is provided through the NHGRI PAGE program [U01HG004803 and its NHGRI ARRA supplement]. The following CALiCo studies contributed to this manuscript and are funded by the following agencies: The Atherosclerosis Risk in Communities (ARIC) Study is carried out as a collaborative study supported by National Heart, Lung, and Blood Institute contracts [N01-HC-55015, N01-HC-55016, N01-HC-55018, N01-HC-55019, N01-HC-55020, N01-HC-55021, N01-HC-55022]. Assistance with phenotype harmonization, SNP selection and annotation, data cleaning, data management, integration and dissemination, and general study coordination was provided by the PAGE Coordinating Center [U01HG004801-01 and its NHGRI ARRA supplement]. The National Institutes of Mental Health also contributes to the support for the PAGE Coordinating Center.Additional support for this work was provided by the NHGRI through [R01 HG006124].
Conflict of Interest Disclosures: None.
References:
1. Ballantyne CM, Hoogeveen RC, McNeill AM, Heiss G, Schmidt MI, Duncan BB, et al. Metabolic syndrome risk for cardiovascular disease and diabetes in the ARIC study. Int J Obes.2008;32 Suppl 2:S21-24.
2. Sattar N, McConnachie A, Shaper AG, Blauw GJ, Buckley BM, de Craen AJ, et al. Can metabolic syndrome usefully predict cardiovascular disease and diabetes? Outcome data from two prospective studies. Lancet. 2008;371:1927-1935.
aaririririanananantstststs::: ThThThThe e ee WoWoWoWomemememen’n’n’n’sm (U0U0U0U01H1H1H1HG0G0G0G004040404797979790000 aananaonal HeHeHeHearararart,t,t,t, LLLLunununung,g,g,g, aaaand
tute, National Institutes of Health, U.S. Department of Health and Human Servintracts HHSN268201100046 HHSN268201100001C, HHSN268201100002C201100003C, HHSN268201100004C, and HHSN271201100004C. Fundi s pnetic Epidemiology of Causal Variants Across the Life Course (CALiCo) programhtagencies: The Atherosclerosis Risk in Communities (ARIC) Study is carried out v -1 , , , , -55021
tute, NNNatatationann l InInInstitutes of Health, U.S. Depe artment of Heaaltll h and Human Servintrararar ctctcc s HHHHSNSNSNS 262626268201100046C, HHSN266682201100001CCC, HHHHHSN268201100002C20010 100003C, HHHHSHSHSN2N2N2N2686868682020202 1111111000000000000 4C4C4CC, andd HHHHSNSNSNN2272 111201010110101000000404044CCC.C FFFFununu didididingngng sssupuu pnettit ccc c Epidemioolooogyy ooof CaCaCaC usuu al Vaaariianttts Accroosss ttthehehehe LLifffeee Couurssse (CCCAC LLLiL CoCoCo) progoogramhrougugugughh h ththththe e e NHNHNHN GRGRGRGRIII PAPAPAPAGEGEGEE pppprorororogramamamam [[[[U0U0U0U01H1H1H1HG0G0G0G004040448080808 3333 ananandd dd itititi sss NHNHNHN GRGRGRGRII I ARARARARRARARARA t]. The followingngng CALiCoCCo studiees contribububub ted d too ttthihh s manuscscscrirrr ptppp and are funded agencies: The AtAtAtAtheheheh rororor scscclelelelerororosisisisis ss RiRiRiRisksksk iiiinnnn CoCoCoC mmmmmmmunuu ittttieieiei ss s (A(A(A(ARIRIRIIC)C)C)C SSStututuudydydydy is carried out vvveee stststudududyyy sususuupppppppporororteteteddd bybyby NNNatatatioioionananalll HeHeHeH ararart,t,t, LLLununung,g,g,g, aaandndndn BBBlololoododod IIIInsnsnstitititutututetete cccononontrtrtracacactststs [[[N0N0N0111-1-HCHCHC-5555550101016,6,6,6 NNNN0101010 -HCHCHCHC-5-5-5550505018181818,, N0N0N0N01-1-1-HCHCHCH -5-5-5550505001919191 ,, N0N0N0N 1-1-1-1 HCHCHCC-55555555020202020,0,0, NNNN0101011-HCHCHC-555505050212121
by guest on May 12, 2018
http://circgenetics.ahajournals.org/D
ownloaded from
DOI: 10.1161/CIRCGENETICS.113.000386
17
3. Lakka HM, Laaksonen DE, Lakka TA, Niskanen LK, Kumpusalo E, Tuomilehto J, et al. The metabolic syndrome and total and cardiovascular disease mortality in middle-aged men. JAMA.2002;288:2709-2716.
4. Alberti KG, Zimmet P, Shaw J. The metabolic syndrome--a new worldwide definition. Lancet.2005;366:1059-1062.
5. Ford ES, Giles WH, Dietz WH. Prevalence of the metabolic syndrome among US adults: findings from the third National Health and Nutrition Examination Survey. JAMA.2002;287:356-359.
6. Huang PL. A comprehensive definition for metabolic syndrome. Dis Model Mech.2009;2:231-237.
7. Eckel RH, Grundy SM, Zimmet PZ. The metabolic syndrome. Lancet. 2005;365:1415-1428.
8. Grundy SM, Brewer HB, Jr., Cleeman JI, Smith SC, Jr., Lenfant C. Definition of metabolic syndrome: Report of the National Heart, Lung, and Blood Institute/American Heart Association conference on scientific issues related to definition. Circulation. 2004;109:433-438.
9. Teran-Garcia M, Bouchard C. Genetics of the metabolic syndrome. Appl Physiol Nutr Metab.2007;32:89-114.
10. Zabaneh D, Chambers JC, Elliott P, Scott J, Balding DJ, Kooner JS. Heritability and genetic correlations of insulin resistance and component phenotypes in Asian Indian families using a multivariate analysis. Diabetologia. 2009;52:2585-2589.
11. Bhattacharjee S, Rajaraman P, Jacobs KB, Wheeler WA, Melin BS, Hartge P, et al. A subset-based approach improves power and interpretation for the combined analysis of genetic association studies of heterogeneous traits. Am J Hum Genet. 2012;90:821-835.
12. Voight BF, Kang HM, Ding J, Palmer CD, Sidore C, Chines PS, et al. The metabochip, a custom genotyping array for genetic studies of metabolic, cardiovascular, and anthropometric traits. PLoS Genet. 2012;8:e1002793.
13. Matise TC, Ambite JL, Buyske S, Carlson CS, Cole SA, Crawford DC, et al. The next PAGE in understanding complex traits: design for the analysis of Population Architecture Using Genetics and Epidemiology (PAGE) study. Am J Epidemiol. 2011;174:849-859.
14. The ARIC Investigators. The Atherosclerosis Risk in Communities (ARIC) Study: design and objectives. Am J Epidemiol. 1989;129:687-702.
15. Anderson GL, Manson J, Wallace R, Lund B, Hall D, Davis S, et al. Implementation of the Women's Health Initiative study design. Ann Epidemiol. 2003;13:S5-17.
cccetetetet. 2020202005050505;3;3;3;365656565:1:1:1:14144415-5-5-5-1444
Defininininititititionononon ooooffff memememetatatatabobbReport of the National Heart, Lung, and Blood Institute/American Heart Associ
a M9
h D, Chambers JC, Elliott P, Scott J, Balding DJ, Kooner JS. Heritability and ges ge anal sis Di b t l i 2009;52:2585 2589
Repopoportrttrt ooof f f ththththe NaNNN tional Heart, Lung, and ddd BlBlBB ood Institute/AmAmAmerican Heart Associooonn n sscs ientiffffiiici iiissssssssueeessss rererelalalaateeed d d totototo ddddefefefe inini ititititioioion. CCCirculullulatatatatioii nnnn. 202020040404;1;;; 09:4:4:4:433333333-43838838.
arcicicia aa M, Bouououcchaaardd CCC. GGGenneticcss ofoof theee mmettaabolololiic ssynyndddroome. ApAApplpll Phyhyyyssis oool NNNutttrr Ml-114444.
h D,,, Chambers JCJCJCJ ,,, ElEE lililiiott P,P,P, SSScott J,,, BBaldldldl inii g gg DJ, ,, KKooner JS.SSS HHeriitii ability yy and geggsss of insuliin n rererresisisiststststananannceccece aaaandndndnd ccccomomomompopopoponeneenentnntnt pppphehehehenonoonotytytyt pepeepes s s ininnin AAAsisisisianananan IIIIndndndndiaiaaian nnn fafafaamimmimilill es usingge ll isi DiDi bb t ll ii 20200909 5;522:25258585 22585899 by guest on M
ay 12, 2018http://circgenetics.ahajournals.org/
Dow
nloaded from
DOI: 10.1161/CIRCGENETICS.113.000386
18
16. The Women's Health Initiative Study Group. Design of the Women's Health Initiative clinical trial and observational study. Control Clin Trials. 1998;19:61-109.
17. Alberti KG, Eckel RH, Grundy SM, Zimmet PZ, Cleeman JI, Donato KA, et al. Harmonizing the metabolic syndrome: a joint interim statement of the International Diabetes Federation Task Force on Epidemiology and Prevention; National Heart, Lung, and Blood Institute; American Heart Association; World Heart Federation; International Atherosclerosis Society; and International Association for the Study of Obesity. Circulation. 2009;120:1640-1645.
18. Genuth S, Alberti KG, Bennett P, Buse J, Defronzo R, Kahn R, et al. Follow-up report on the diagnosis of diabetes mellitus. Diabetes Care. 2003;26:3160-3167.
19. Buyske S, Wu Y, Carty CL, Cheng I, Assimes TL, Dumitrescu L, et al. Evaluation of the metabochip genotyping array in African Americans and implications for fine mapping of GWAS-identified loci: the PAGE study. PLoS ONE. 2012;7:e35651.
20. Liu EY, Buyske S, Aragaki AK, Peters U, Boerwinkle E, Carlson C, et al. Genotype imputation of Metabochip SNPs using a study-specific reference panel of ~4,000 haplotypes in African Americans from the Women's Health Initiative. Genet Epidemiol. 2012;36:107-117.
21. Patterson N, Price AL, Reich D. Population structure and eigenanalysis. PLoS Genet.2006;2:e190.
22. Price AL, Patterson NJ, Plenge RM, Weinblatt ME, Shadick NA, Reich D. Principal components analysis corrects for stratification in genome-wide association studies. Nat Genet.2006;38:904-909.
23. R Development Core Team. A language and environment for statistical computing. 2008
24. Berglund G, Elmstahl S, Janzon L, Larsson SA. The Malmo Diet and Cancer Study. Design and feasibility. J Intern Med. 1993;233:45-51.
25. Kahn R. Metabolic syndrome--what is the clinical usefulness? Lancet. 2008;371:1892-1893.
26. Monda KL, North KE, Hunt SC, Rao DC, Province MA, Kraja AT. The genetics of obesity and the metabolic syndrome. Endocr Metab Immune Disord Drug Targets. 2010;10:86-108.
27. Park YW, Zhu S, Palaniappan L, Heshka S, Carnethon MR, Heymsfield SB. The metabolic syndrome: prevalence and associated risk factor findings in the US population from the Third National Health and Nutrition Examination Survey, 1988-1994. Arch Intern Med. 2003;163:427-436.
28. Joy T, Hegele RA. Genetics of metabolic syndrome: is there a role for phenomics? Curr Atheroscler Rep. 2008;10:201-208.
C, et ttt llall. GGGGenotytytytypepepee l of ~4~44~4 000000000000 hhhhapapapaplolololotytytytypppe
m 7
o
s n0
mericicicicanananss s frfrfromomo tthehhh Women's Health Initiaaaatititt vve. Genet Epip demimimiol.t 2012;36:107-117
onn n NNN, Price ALL, Reeiccchc DDDD. Popuppulaaatiion strucctturee aandndnd eigggeenannalllysssisisiss. PLLLoSoSoS GGGeneetet..0.
L, Patterson NJNJNJNJ, PlPlPllenenene gegegege RRRM,M,M,M, WWWWeieieie nbnbnbnblalalal ttt tt MEMEMEE, ShSS adadada icicicck k k k NANANANA,,, ReReReR icicich h h h D.DDD Principal s analyysis corrects ffffor stratifififificatiiioi n iniii gggenome-wiiiidded associai iitiion studies. Nat Gen
044-909.
by guest on May 12, 2018
http://circgenetics.ahajournals.org/D
ownloaded from

DOI: 10.1161/CIRCGENETICS.113.000386
19
29. Kristiansson K, Perola M, Tikkanen E, Kettunen J, Surakka I, Havulinna AS, et al. Genome-wide screen for metabolic syndrome susceptibility Loci reveals strong lipid gene contribution but no evidence for common genetic basis for clustering of metabolic syndrome traits. Circ Cardiovasc Genet. 2012;5:242-249.
30. Zabaneh D, Balding DJ. A genome-wide association study of the metabolic syndrome in Indian Asian men. PLoS ONE. 2010;5:e11961.
31. Kraja AT, Vaidya D, Pankow JS, Goodarzi MO, Assimes TL, Kullo IJ, et al. A bivariate genome-wide approach to metabolic syndrome: STAMPEED consortium. Diabetes.2011;60:1329-1339.
32. Ng MC, Saxena R, Li J, Palmer ND, Dimitrov L, Xu J, et al. Transferability and fine mapping of type 2 diabetes loci in African Americans: the Candidate Gene Association Resource Plus Study. Diabetes. 2013;62:965-976.
33. Avery CL, He Q, North KE, Ambite JL, Boerwinkle E, Fornage M, et al. A phenomics-based strategy identifies loci on APOC1, BRAP, and PLCG1 associated with metabolic syndrome phenotype domains. PLoS Genet. 2011;7:e1002322.
34. Coram MA, Duan Q, Hoffmann TJ, Thornton T, Knowles JW, Johnson NA, et al. Genome-wide characterization of shared and distinct genetic components that influence blood lipid levels in ethnically diverse human populations. Am J Hum Genet. 2013;92:904-916.
35. Orho-Melander M, Melander O, Guiducci C, Perez-Martinez P, Corella D, Roos C, et al. Common missense variant in the glucokinase regulatory protein gene is associated with increased plasma triglyceride and C-reactive protein but lower fasting glucose concentrations. Diabetes. 2008;57:3112-3121.
36. Sparso T, Andersen G, Nielsen T, Burgdorf KS, Gjesing AP, Nielsen AL, et al. The GCKR rs780094 polymorphism is associated with elevated fasting serum triacylglycerol, reduced fasting and OGTT-related insulinaemia, and reduced risk of type 2 diabetes. Diabetologia.2008;51:70-75.
37. Aulchenko YS, Ripatti S, Lindqvist I, Boomsma D, Heid IM, Pramstaller PP, et al. Loci influencing lipid levels and coronary heart disease risk in 16 European population cohorts. Nat Genet. 2009;41:47-55.
38. Smith EN, Chen W, Kahonen M, Kettunen J, Lehtimaki T, Peltonen L, et al. Longitudinal genome-wide association of cardiovascular disease risk factors in the Bogalusa heart study. PLoS Genet. 2010;6
39. Kettunen J, Tukiainen T, Sarin AP, Ortega-Alonso A, Tikkanen E, Lyytikainen LP, et al. Genome-wide association study identifies multiple loci influencing human serum metabolite levels. Nat Genet. 2012;44:269-276.
M, et alll.l AAAA phhhhenomimimimiccccs-h metataaabobobobolilililicccc sysysysyndndndndrorororommme
d
MA, Duan , Hoffmann TJ, Thornton T, Knowles JW, Johnson NA, et al. Genoc ly
M am
lasma trigl ceride and C reacti e protein b t lo er fasting gl cose concentratio
domamamainininnss.s PLPLPLPLoSSoSS Genet. 2011;7:e100232222.
MAMMA, Duan Q, HHHoffffffmmmannnnnnnn TJ, TTThhhorrntooonn T,, KKnoowlwlwlesesee JW,WW Johhhnnnsononon NAAA,A et aalall. GeGeGeG nocteere iziizization ofoo sshhhareeddd anddd did stinincttt gggennnettic ccomommpoponeennts thhat iinnnfluuenenence bbbllol ododod lipppiid ly diiveveversrsrsrseeee hhhumamann popopupulatititionnonons. Ammm JJJJ HHHHum GGGGenetetett. 2020201313131 ;9;99;922:2:2 90909044-44 91111666.6
Melander M,,, Mellall ndddder OOOO, ,, GuGGG idididucciii CCCC, ,, PPeP rez-MMartiiinez P,P,P, CCCor llelllla DDD,,, Roos C,,, et ammmissense vavaririririananant t tt ininiin tttthehhehe ggggluululucocoocokikkikinanaanasesesse rrrregeegegululululatataatororrory yyy prprrprotoototeieiein nn n geeegenennene iiiis ss s asasassosososociciciatatatatededed with
lll t iri lgl idid dd CC ctii ot iei bb t llo ffastiin lgl tratiio by guest on May 12, 2018
http://circgenetics.ahajournals.org/D
ownloaded from

DOI: 10.1161/CIRCGENETICS.113.000386
20
40. Zemunik T, Boban M, Lauc G, Jankovic S, Rotim K, Vatavuk Z, et al. Genome-wide association study of biochemical traits in Korcula Island, Croatia. Croat Med J. 2009;50:23-33.
41. Zeggini E, Weedon MN, Lindgren CM, Frayling TM, Elliott KS, Lango H, et al. Replication of genome-wide association signals in UK samples reveals risk loci for type 2 diabetes. Science.2007;316:1336-1341.
42. Park YM, Province MA, Gao X, Feitosa M, Wu J, Ma D, et al. Longitudinal trends in the association of metabolic syndrome with 550 k single-nucleotide polymorphisms in the Framingham Heart Study. BMC Proc. 2009;3 Suppl 7:S116.
43. Robinson WS. Ecological correlations and the behavior of individuals. Am Sociol Rev.1950;15:351-357.
44. Solovieff N, Cotsapas C, Lee PH, Purcell SM, Smoller JW. Pleiotropy in complex traits: challenges and strategies. Nat Rev Genet. 2013;14:483-495.
45. Dumitrescu L, Carty CL, Taylor K, Schumacher FR, Hindorff LA, Ambite JL, et al. Genetic determinants of lipid traits in diverse populations from the population architecture using genomics and epidemiology (PAGE) study. PLoS Genet. 2011;7:e1002138.
46. Sivakumaran S, Agakov F, Theodoratou E, Prendergast JG, Zgaga L, Manolio T, et al. Abundant pleiotropy in human complex diseases and traits. Am J Hum Genet. 2011;89:607-618.
ropy in complex trrrraiaiaiaits
Ambibibibitetetete JJJJLLLL eeeetttt alalalal GGeGt
a
mp 7
ts ooof f f f lililipipipipid dd trtrttraitststs in diverse populations frfrfrfromoom the population n aaarchitecture using andndd eeeepidemimiimioloolo ogoggogy (P(PP(PAGAGAGGE)E)E) sssstutututudyydyy. PLPLPLoSoSoS GGennet. 22220101010 1;;77:7:7 e1e1e10000021222 38888...
maaaraaan n S, AAAgaggg kokoov FF, Theeeododoratatouuu E, Prrenndeergggaast JGJG, ZgZgZgagaa L, MMMManolololiioi TTT, ettt aal. pleiotrtrtropopopopyyy in hhhumumanan ccomo plplpleeeex diseeeasasasesesese andndd ttttrraitititssss. AmAmAm JJJ HuHuHuH m GeGGG neeeettt. 2222011111;1;8989889:6:660070
by guest on May 12, 2018
http://circgenetics.ahajournals.org/D
ownloaded from

DOI: 10.1161/CIRCGENETICS.113.000386
1
Table 1: Baseline characteristics of metabolic syndrome cases and controls, and all individuals in the ASSET analyses
ARIC WHI
Characteristic Casesn=1229
Controls n=1979
ASSET n=3340
Cases n=4278
Controls n=5088
ASSET n=11,808
Mean age ± SD in years 54.3 ± 5.6 53.1 ± 5.9 53.5 ± 5.9 62.3 ± 6.9 61.1 ± 7.2 61.5 ± 7.1
Female, N(%*) 861 (70.1) 1142 (57.8) 2094 (62.7) 4278 (100.0) 5088 (100.0) 11, 808 (100.0)
MetS components, N (%*)
Low HDL/lipid med† 816 (67.2) 285 (14.5) 1104 (34.6) 2868 (67.0) 651 (12.8) 3559 (38.9)
High triglycerides/lipid med† 521 (42.9) 73(3.7) 596 (18.7) 2113 (49.4) 252 (5.0) 2378 (26.5)
High waist circumference 1062 (86.4) 831 (42.0) 1981 (59.5) 3576 (83.6) 1782 (35.0 ) 6698 (56.9)
High blood pressure/hypertension med† 854 (69.7) 695 (35.2) 1615 (48.6) 3928 (91.8) 2905 (57.1) 8521 (72.2)
High glucose/diabetes med† 1042 (84.9) 615 (31.1) 1736 (53.3) 2890 (67.6) 732 (14.4) 3760 (39.7)
*percentage reflects proportion of MetS Cases, MetS Controls or ASSET totals with non-missing data, respectively; †med=medications
4242424278787878 ((((101010100.0.0.0.0)0)0)0)
816666 (6(6(6( 7.7.7.7 2)))) 282828285555 (1((( 44.44 5)5)5)) 1104040404 ((((34343434.6.6.6) ) ) 22822 68686868 (((67676 .00)
52521 (4(4( 2.2.2.9)9)9)9 7373733(3(3(3.7.7.77) ) ) 5959595 6 6 6 (1(1(18.8.8.7)7)7) 2121211313 (((4949.4.4)))
by guest on May 12, 2018
http://circgenetics.ahajournals.org/D
ownloaded from

DOI: 10.1161/CIRCGENETICS.113.000386
2
Table 2: Significant results from all models in PAGE African Americans
LD=linkage disequilibrium; AA=African Americans; Chr=chromosome; CA=coded allele; CAF=coded allele frequency; Log Reg= logistic regression; EA= individuals of European ancestry.*The Metabochip consists of 257 finely-mapped regions based on GWAS hits for cardio-metabolic and anthropometric traits; regions listed are arbitrarily numbered. † The SNP with the lowest P-value in each Metabochip region is bolded.‡ LD estimates reflect r2 values between SNP and the bolded SNP in the same Metabochip region in the PAGE AA population and in a European-ancestry population24
SNP was also significant in the §logistic regression analysis of MetS or ||meta-analysis of MetS components.#While these SNPs are not highly correlated with the bolded SNP in their region, they are highly correlated with each other in AA (r2>0.6).
Model P-values in PAGE AA LD‡
Region* (Chr) SNP† Annotation CA/CAF MetS Log Reg Components Meta-Analysis ASSET AA EA
HDL.1 (8) rs10096633§ LPL/near 3` UTR C/0.59 4.5e-8 1.1e-5 1.5e-9 1.0 1.0rs326 LPL/intron T/0.46 5.1e-5 9.0e-4 8.4e-9 0.58 0.32rs13702 LPL/3` UTR A/0.50 3.1e-6 2.0e-4 3.0e-8 0.68 0.33rs15285 LPL/3` UTR G/0.50 4.1e-6 2.3e-4 7.5e-8 0.67 0.33
T2D.1 (10) rs7901695 TCF7L2/intron C/0.45 4.8e-1 6.3e-1 1.0e-7 1.0 1.0rs7903146 TCF7L2/intron G/0.71 2.5e-1 4.9e-1 1.1e-7 0.49 0.84rs4506565 TCF7L2/intron A/0.45
\3.9e-1 7.3e-1 1.3e-7 0.99 0.96
HDL.2 (11) rs3135506 APOA5/missense C/0.94 3.7e-4 3.5e-4 1.8e-7 1.0 1.0
HDL.3 (16) rs247616 CETP/near-5’ G/0.74 2.6e-2 2.8e-2 1.2e-20 1.0 1.0rs247617 CETP/near-5’ A/0.26 2.6e-2 2.7e-2 1.3e-20 1.0 0.99rs183130 CETP/near-5’ G/0.74 2.7e-2 2.8e-2 1.4e-20 1.0 1.0rs4783961 CETP/near-5’ G/0.57 2.0e-2 1.4e-3 9.4e-18 0.46 0.48rs711752 CETP/intron G/0.73 3.7e-2 5.2e-2 5.1e-17 0.65 0.57rs17231520 CETP/near-5’ G/0.93 1.1e-2 6.2e-2 9.1e-15 0.21 <0.01rs34065661 CETP/missense C/0.93 1.2e-2 6.4e-2 1.2e-14 0.21 <0.01rs6499862# CETP/near-5’ G/0.70 3.4e-2 2.6e-3 2.6e-11 0.16 0.11rs7499892 CETP/intron G/0.63 5.5e-3 2.5e-2 2.6e-11 0.05 0.11rs247619 CETP/near-5’ G/0.94 7.1e-3 1.7e-2 5.1e-11 0.19 <0.01rs12446515 CETP/near-5’ G/0.85 2.7e-1 1.6e-1 1.2e-10 0.47 0.99rs17231506 CETP/near-5’ G/0.85 2.6e-1 1.8e-1 1.4e-10 0.48 0.99rs56156922 CETP/near-5’ A/0.85 2.6e-1 1.8e-1 1.8e-10 0.47 0.99rs3764261 CETP/near-5’ C/0.68 1.4e-1 4.9e-2 7.5e-10 0.74 0.99rs12149545 CETP/near-5’ G/0.91 1.1e-1 1.8e-1 1.3e-8 0.27 0.96rs7205692# CETP/near-5’ A/0.67 3.1e-2 1.8e-3 5.5e-8 0.14 0.11
LDL.1 (19) rs12721054|| APOC1/3` UTR G/0.12 2.3e-7 9.7e-8 2.0e-11 1.0 1.0rs7412# APOE/missense C/0.90 5.0e-2 8.3e-2 4.7e-9 0.01 <0.01rs61679753# TOMM40/intron A/0.89 1.1e-1 2.3e-1 6.9e-8 0.01 <0.01
7.7..3e3e3 -11
3.333 5e555 -4444
/near 5 G/0 74 2 6e 2 2 8e 2////////intron G/0 63 5 5e 3 2 5e 2
/near-555 G/0.74 2.6e-2 2.8e-2/neaeaeaearrrr-5’ A/0.26 2.6e-2 2.7e-2/nnneaaar-5’ G/G/G/G 0...77774444 22.777e-2222 2.2.22 8e---2222/nnnneaeaeaearrr-5’ G//0..57 2.000e-22 111.1 4e-3333/inttttrorororonnnn G/G/G//00.73777 3.7e7e7e7e----2222 55.55 2e2e2e2e----2222/near-5’ G/G/G/G/0.0.0.0.93939393 1.1.1..1ee1ee--2222 6.6.6.6.2e222 -2/missense CCCC/0/0/0/0.99993333 1.111 2e2e2e2e-2222 6.666 4e444 -2/nnnear-5’ G/G/G/G 0.00 70000 3....4e4e4e4e-22 2.2.2.2.6e6e6e6 -3333/iiintntroronn G/G/00 6363 55 5e5e-33 22 5e5e-22
by guest on May 12, 2018
http://circgenetics.ahajournals.org/D
ownloaded from
DOI: 10.1161/CIRCGENETICS.113.000386
3
Table 3: ASSET and pleiotropy findings in PAGE African Americans and the validation Hispanic cohort
ASSET P-value CAF BP† GLUC† HDL† TG† WC†
Region SNP AA HA* AA HA AA HA AA HA AA HA AA HA AA HA
HDL.1 rs10096633 1.5E-09 3.0E-03 0.59 0.86
rs326 8.4E-09 1.1E-02 0.46 0.68 ‡
rs13702 3.0E-08 1.5E-02 0.50 0.69 ‡
rs15285 7.5E-08 4.0E-03 0.50 0.69 ‡ ‡
T2D.1 rs7901695 1.0E-07 2.0E-01 0.45 0.29 ‡
rs7903146 1.1E-07 1.6E-01 0.71 0.74 ‡ ‡
rs4506565 1.3E-07 3.0E-01 0.45 0.29 ‡
HDL.2 rs3135506 1.8E-07 1.3E-11 0.94 0.88
HDL.3 rs247616 1.2E-20 2.9E-07 0.74 0.70
rs247617 1.3E-20 2.3E-07 0.26 0.30
rs183130 1.4E-20 3.1E-07 0.74 0.70
rs4783961 9.4E-18 3.4E-01 0.57 0.51
rs711752 5.1E-17 1.4E-03 0.73 0.58
rs17231520 9.1E-15 1.4E-01§ 0.93 0.99
rs34065661 1.2E-14 1.4E-01§ 0.93 0.99
rs7499892 2.6E-11 5.1E-07 0.63 0.79 ‡
rs6499862 2.6E-11 3.5E-02 0.70 0.83 ‡ ‡
rs247619 5.1E-11 5.7E-02§ 0.94 0.99
rs12446515 1.2E-10 4.6E-06 0.85 0.72
1
3
1
2
1.6E6E6E6E-01 0.7111 0.0.0..74
3.0E0E0E0E-01 0.45455 0.29
1.3E-11 00.00 94949494 0.0.0.0 8888888
2.9E-07 0.000 7474747 0.000 70707070
by guest on May 12, 2018
http://circgenetics.ahajournals.org/D
ownloaded from

DOI: 10.1161/CIRCGENETICS.113.000386
4
CAF=coded allele frequency; AA=African Americans; HA= Hispanic Americans* Bolded SNPs reflect significant replication in ASSET, at P<0.05 †These columns reflect individual MetS components SNP associations. Arrows indicate significantly increased ( ) or decreased ( ) odds of the MetS component where BP= high blood pressure; GLU= high glucose; HDL= low HDL; TG= high triglycerides; and WC= high waist circumference.‡Component P-value significant before multiple testing correction (i.e. P<0.05), but not after correction.§No overall evidence of association across traits, though HDL component was significant.
rs17231506 1.4E-10 1.0E-05 0.85 0.72
rs56156922 1.8E-10 4.9E-06 0.85 0.72
rs3764261 7.5E-10 5.7E-08 0.68 0.70
rs12149545 1.3E-08 7.4E-06 0.91 0.73 ‡
rs7205692 5.5E-08 1.0E-02 0.67 0.83 ‡
LDL.1 rs12721054 2.0E-11 9.6E-02 0.12 0.01 ‡ ‡ ‡
rs7412 4.7E-09 5.2E-01 0.90 0.96 ‡
rs61679753 6.9E-08 6.5E-01 0.89 0.97 ‡
; pnm
Wtr
; pn ininnn AAAASSSSSSSSETEEE , aaata P<0.05 mmmmpopopoponents SNSNSNNP PPP asasasassosososociciciciatatatatioioioionsnsnsns. AArrrrrrrowss iindidididicacacacatetetete sisisisigngnggnifififficicicicannntltltltly yyy inininincrcrcrcreaeaeaeasesesesed d d d (
GLGLGLGLU= high h ggluccooose; HHHDL== lloww HDDDLL; TTTTG=G=G=G higigigh trrigglyyyccecc ridededees;; aandd WWtiplplplpleee e teteteteststststininining ggg cococoorrrrrrrrecececctittt onnnn (i(i(i(i.e.e.ee. P<P<P<P<0.0.0.0 05050505)))),,, bubububut ttt nonononot ttt afafafa teteteter r r r cocococorrrrrrrrecececctitititionononon.raits, though HHHHDLDLDLDL ccccomomomompopopoponenenen ntntntnt wwwwasasasa ssigigiggnininnififff cacacacantntntnt....
by guest on May 12, 2018
http://circgenetics.ahajournals.org/D
ownloaded from
DOI: 10.1161/CIRCGENETICS.113.000386
5
Figure Legend:
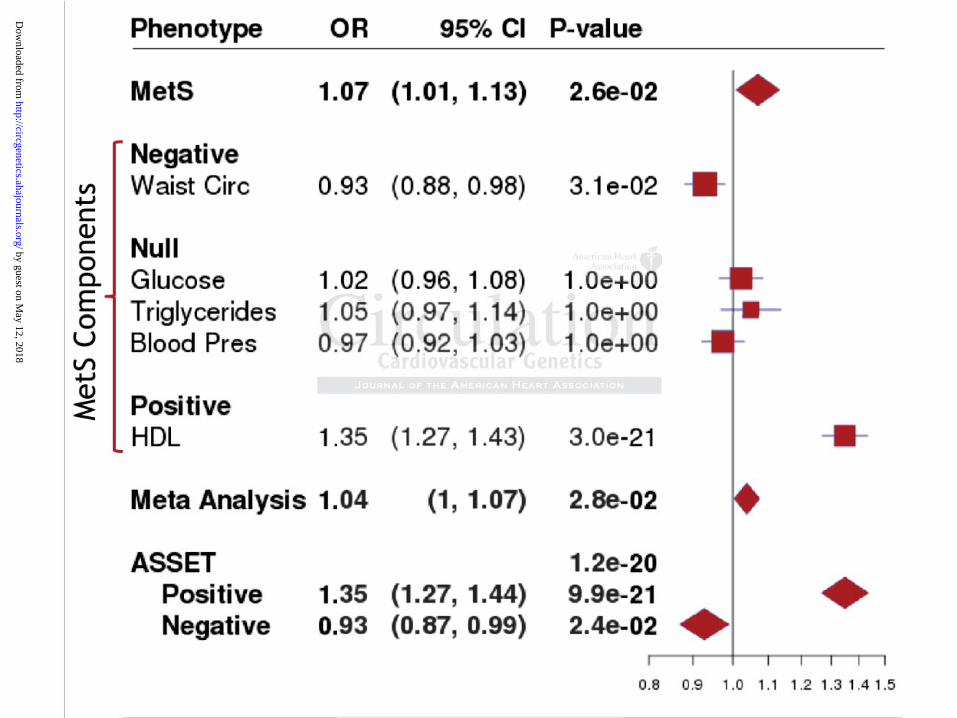
Figure 1: Plot of ASSET top SNP (rs247616) contrasting results from different methods
Results from ASSET, logistic regression models of MetS and MetS individual components, and
the meta-analysis of MetS components for rs247616-G are plotted. Note: P-values for MetS
components already include correction for multiple testing. The rs247616-G allele is strongly
associated with higher odds of low HDL levels, OR=1.35 (95%CI: 1.27-1.43; P=3e-21),
modestly associated with reduced odds of high waist circumference, OR=0.93 (95%CI: 0.88-
0.98; P=0.031) and not associated with other MetS components (P>0.05). The ASSET test takes
these component effects in opposite directions into account (hence the low P-value=1.2e-20). In
contrast, results from the logistic regression analysis of MetS (P=0.026) and the meta-analysis of
MetS components (P=0.028) are attenuated due to null component effects and effects in opposite
directions.
OR=0.93 (95%CI: 0.0.0.0.8
05). ThThThThe ASASASASSESESESETT ttttesesesestt
onent effects in opposite directions into account (hence the low P-value=1.2e-20
s y
ponents (P=0.028) are attenuated due to null component effects and effects in op
onenenent tt efefefeffefefectctcts inininn opposite directions into oo acaaccount (hence thehehe low P-value=1.2e-20
suuuulttts from the looogisstiiiic reeeeggrg essisisis onnn aanaaalyysiss oof MMMetetetetSSS (P=0==0.0262626) ananand thhhhe eee mememettta-aaanala y
ponentntntssss (P(P(P( =0.0002882828))) araree attenuununuatedd dddueueueue ttto nunulllllll comomommpopoponentntntt eeffffffecectst aandnndnd effffececttsts iiinn opo
by guest on May 12, 2018
http://circgenetics.ahajournals.org/D
ownloaded from
by guest on May 12, 2018
http://circgenetics.ahajournals.org/D
ownloaded from

Jackson, Kari E. North, Ulrike Peters, James S. Pankow, Nilanjan Chatterjee and Charles KooperbergChristopher S. Carlson, Chun-Nan Hsu, Lynne Wilkens, Simin Liu, Elizabeth Selvin, Rebecca
Cara L. Carty, Samsiddhi Bhattacharjee, Jeff Haessler, Iona Cheng, Lucia A. Hindorff, Vanita Aroda,Identifies Pleiotropic Variants: Results from the PAGE Study
Comparative Analysis of Metabolic Syndrome Components in over 15,000 African Americans
Print ISSN: 1942-325X. Online ISSN: 1942-3268 Copyright © 2014 American Heart Association, Inc. All rights reserved.
TX 75231is published by the American Heart Association, 7272 Greenville Avenue, Dallas,Circulation: Cardiovascular Genetics
published online July 14, 2014;Circ Cardiovasc Genet.
http://circgenetics.ahajournals.org/content/early/2014/07/14/CIRCGENETICS.113.000386World Wide Web at:
The online version of this article, along with updated information and services, is located on the
http://circgenetics.ahajournals.org/content/suppl/2014/07/14/CIRCGENETICS.113.000386.DC1Data Supplement (unedited) at:
http://circgenetics.ahajournals.org//subscriptions/
is online at: Circulation: Cardiovascular Genetics Information about subscribing to Subscriptions:
http://www.lww.com/reprints Information about reprints can be found online at: Reprints:
document. Permissions and Rights Question and Answer this process is available in the
located, click Request Permissions in the middle column of the Web page under Services. Further information aboutnot the Editorial Office. Once the online version of the published article for which permission is being requested is
can be obtained via RightsLink, a service of the Copyright Clearance Center,Circulation: Cardiovascular Genetics Requests for permissions to reproduce figures, tables, or portions of articles originally published inPermissions:
by guest on May 12, 2018
http://circgenetics.ahajournals.org/D
ownloaded from

SUPPLEMENTAL MATERIAL
Supplemental Table 1: Baseline characteristics of the Hispanic population used for validation
*percentage reflects proportion of MetS Cases, MetS Controls or ASSET totals with non-missing
data, respectively; †med=medications
WHI Hispanics
Characteristic
Cases
n=1592
Controls
n=2142
ASSET
n=5172
Mean age ± SD in years 61.1 ± 6.7 59.8 ± 6.7 60.2 ± 6.8
Female, N(%*) 1592 (100.0) 2142 (100.0) 5172 (100.0)
MetS components, N (%*)
Low HDL/lipid med† 1271 (83.6) 551 (26.1) 1855 (50.5)
High triglycerides/lipid med† 1182 (77.8) 484 (23.0) 1691 (46.3)
High waist circumference 1161 (73.2) 377 (17.6) 2131 (41.4)
High blood pressure/hypertension med† 1213 (76.2) 654 (30.5) 2541 (49.2)
High glucose/diabetes med† 919 (60.2) 245 (11.5) 1230 (32.6)

2
Supplementary Figure 1: Regional plot of rs12721054/APOC1 in PAGE AA
LocusZoom1 plots show AA p-values vs. base pair location on chromosome 19. Linkage
disequilibrium (LD), expressed as r2 between the top SNP in the region, rs12721054 (purple star) and
other SNPs, is shown in individuals of African ancestry (1000G Mar 2012 AFR/hg19). rs12721054
is not in strong LD with other SNPs in this region, including the other significant SNPs: the non-
synonymous rs7412 or rs61679753. rs12721054 is essentially monomorphic in individuals of
European descent (not shown).
3
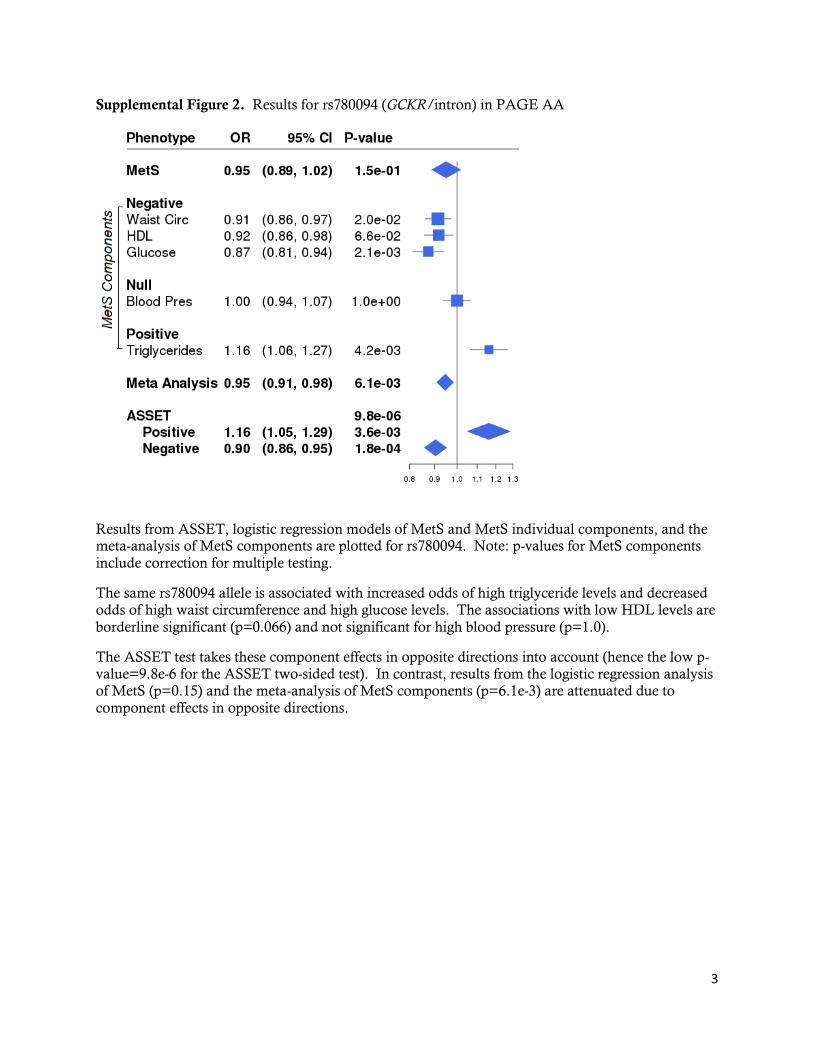
Supplemental Figure 2. Results for rs780094 (GCKR/intron) in PAGE AA
Results from ASSET, logistic regression models of MetS and MetS individual components, and the meta-analysis of MetS components are plotted for rs780094. Note: p-values for MetS components
include correction for multiple testing.
The same rs780094 allele is associated with increased odds of high triglyceride levels and decreased odds of high waist circumference and high glucose levels. The associations with low HDL levels are
borderline significant (p=0.066) and not significant for high blood pressure (p=1.0).
The ASSET test takes these component effects in opposite directions into account (hence the low p-value=9.8e-6 for the ASSET two-sided test). In contrast, results from the logistic regression analysis of MetS (p=0.15) and the meta-analysis of MetS components (p=6.1e-3) are attenuated due to
component effects in opposite directions.

4
Supplemental Reference
1. Pruim RJ, Welch RP, Sanna S, Teslovich TM, Chines PS, Gliedt TP, Boehnke M, Abecasis GR, Willer CJ. LocusZoom: regional visualization of genome-wide association scan results. Bioinformatics. 2010 Sep 15;26(18):2336-7.