comparative analysis of various edge detection … · detection techniques in biometric application...
TRANSCRIPT

Comparative Analysis of Various Edge Detection Techniques in Biometric
Application Sanjay Kumar#1, Mahatim Singh#2 and D.K. Shaw#3
#1,2Department of Computer Science and Engineering, NIT Jamshedpur #3Department of Computer Application, NIT Jamshedpur, Jharkhand, India
[email protected] [email protected] [email protected]
Abstract--Authentication and Identification is one of the key features of Biometric Application. In such applications before generating the templates, a feature is extracted from the input image captured by a sensor after pre-processing. In pre-processing steps, the goal is to enhance the visual appearance of the image by noise removal, dilation, erosion, segmentation etc. In feature extraction, the edge is detected where there is an abrupt change in the intensity values of the image. This paper is aimed to analyse various edge detection techniques like Prewitt, Sobel, Roberts, Canny, LoG, Zerocrossing etc. and proposing the best suitable method of edge detection for biometric application. The comparison of biometric image edge detection is based on the comparison parameter Mean Square Error (MSE), Root Mean Square Error (RMSE), Peek Signal to Noise Ratio (PSNR) using MATLAB software.
Keywords- Authentication, Identification, Edge Detection, Pre-processing, Comparison.
I. INRODUCTION
Edge detection is an image processing technique for finding the boundaries of objects within images. It works by detecting discontinuities in brightness or change in pixel intensity. Edge detection is used for image segmentation and data extraction in areas such as image processing, computer vision, and machine vision. In present scenario biometric features are widely used in user authentication and identification, attendance, user entry, authentication at server in wired or wireless mode etc. For such application Biometric image is captured and pre-processed for better visual appearance and noise removal. Edge detection of noisy image is difficult due to abrupt change in intensity values of the said biometric image. An edge in an image is a significant local change in the image intensity, usually associated with a discontinuity in either the image intensity or the first derivative of the image intensity. Edges can be modelled according to their intensity profiles, and can be of following types:
(1) Step edge:The image intensity abruptly changes from one value to one side of the discontinuity to a different value on the opposite side.
(2) Ramp edge: A step edge where the intensity change is not instantaneous but occurs over a finite distance.
(3) Ridge edge:The image intensity abruptly changes value but then returns to the starting value within some short distance.
(4) Roof edge:A ridge edge where the intensity change is not instantaneous but occurs over a finite distance, generated usually by the intersection of surfaces.
One can has to be cautious about variations showing points (pixels) in image, since edge can be mistaken due to any variation in the certain pixel which is due to poor lighting condition or instantaneous variation in noise. Steps in edge detection technique are as follows:
Smoothing: Suppress as much noise as possible, without destroying the true edges.
Enhancement: Apply a filter to enhance the quality of the edges in the image.
Detection: Determine which edge pixels should be discarded as noise and which should be retained . Thresholding provides the criterion used for detection.
Localization: Determine the exact location of an edge. Edge thinning and linking are usually required in this step.
Rest of the paper organized as follows: Section 2 deals with related work, Section 3 deals with proposed comparison schemes for edge detection, Section 4 deals with experimental results and comparative analysis, Section 5 deals with conclusion and in section 6 we have references.
ISSN (Print) : 2319-8613 ISSN (Online) : 0975-4024 Sanjay Kumar et al. / International Journal of Engineering and Technology (IJET)
DOI: 10.21817/ijet/2016/v8i6/160806409 Vol 8 No 6 Dec 2016-Jan 2017 2452

II. RELATED WORK
In general, the edge detection can be divided into following categories as shown in diagram:
Gradient Based Edge Detection: The most common type of edge detection process uses a gradient operator, of which there have been several variations. Mathematically, for an image function f(x, y), the image gradient ( )the gradient magnitude (g(x, y)) and the gradient direction ( (x, y)) are computed as
∆∆
Where,
, ≅ ∆ ∆
And,
, ≅ atan∆
∆
Where,
∆ , , ∆ , ,
Where n is a small integer, usually unity.
Roberts Operator: It uses 2x2 convolution filters ∆ and∆ in sequence, which is applied on the given input biometric image to detect the edges. The mask of ∆ can be derived from mask of ∆ by simply rotating it by 90° as shown below:
∆ 1 00 1
∆ 0 11 0
These masks are designed to respond maximally for detection of edge by rotating ∆ by 45° to obtain ∆ .
Prewitt Operator: Thisoperator uses3x3 convolution filters ∆ and∆ in sequence, which is applied on the given input biometric image to detect the edges. Both filters are applied to the image and summed to form the final result.The mask of ∆ can be derived from mask of ∆ by simply rotating it by 90° as shown below:
∆ 1 0 11 0 11 0 1
∆ 1 1 10 0 01 1 1
Sobel Operator: This operator performs a 2-D spatial gradient measurement on a biometric image, and edges are detected at the regions of high spatial frequency.This operator uses 3x3 convolution filters ∆ and∆ . The mask of ∆ can be derived from mask of ∆ by simply rotating it by 90° as shown below:
∆ 1 0 12 0 21 0 1
∆ 1 2 10 0 01 2 1
Canny Edge Detector: The presence of noise in the biometric image give results in a detection of an edge. All previous operators have demerit to assume noise as a part of the biometric image, and sometimes not detecting the true edge due to presence of noise in biometric image. But canny edge detector overcomes this demerit by using the Gaussian filter before applying the masks. The canny edge detection is a multistage process as shown below:
1. The Gaussian filter is used to smoothen the biometric image by reducing noise and unwanted details.
, , ∗ ,
ISSN (Print) : 2319-8613 ISSN (Online) : 0975-4024 Sanjay Kumar et al. / International Journal of Engineering and Technology (IJET)
DOI: 10.21817/ijet/2016/v8i6/160806409 Vol 8 No 6 Dec 2016-Jan 2017 2453

Where,
1
√2
2
2. The gradient magnitude and orientation is computed using any of the gradient operators as shown below:
, , ,
, tan , ,⁄
3. Apply thresholding to the gradient magnitude
, , ,0
Where T is so chosen that all edge elements are kept while most of the noise is suppressed.
4. Select the all non-maxima pixel in , obtained in step 3 and suppress them by comparing to see whether each non-zero , is greater than its two neighbours along the gradient direction , . If so, keep , unchanged, otherwise, set it to 0.
5. The two threshold and (where ) is calculated to obtain two binary images and . With greater has less noise and fewer false edges but greater gaps between edge segments, when compared to with smaller .
6. Link edge segments in to form continuous edges. To do so, trace each segment in to its end and then search its neighbours in to find any edge segment in to bridge the gap until reaching another edge segment in .
Laplacian based operator:It uses the second order partial differential and is known as second order operator for edge detection. It is used to construct the isotropic filter which is rotational invariant i.e. after applying the filter with 90°rotation, it will give the same result. The Laplacian is the simplest isotropic derivative for a function of two variables (Biometric image) and is expressed as:
This operator can be further categorized as:
1. Laplacian of Gaussian
2. Zero Crossing
Laplacian of Gaussian: It is also known as Marr-Hildreth edge detector. The fundamental characteristics of LoG edge detector are as given below:
1. For high frequency noise removal Gaussian and for enhancement of the image Laplacian is used.
2. This operator is a differential operator that can calculate the first and second derivative at a point. The edge detection criteria is based on zero crossing in the second derivative combined with corresponding large peak in first derivative.
3. The edge location can be estimated using sub-pixel resolution by interpolation.
The operator which fulfil the above condition is the filter where Laplacian isoperator and g is Gaussian function, can be represented as:
, 1
2
Zero Cross: This filter to detect edge, find the places in the Laplacian of the image where the value of Laplacian passes through zero. At the zero crossing, feature of the image can be detected and these features may or may not be an edge. Hence the zero crossing filter is known as feature detector.
III. PROPOSED COMPARISON SCHEMES FOR DIFFERENT EDGE DETECTION OPERATORS
For finding the difference and similarities between all different edge detection operators, we have used the following parameter:
1. Mean Squared Error (MSE): This is the most important criterion used to evaluate the performance of a predictor or an estimator. In this approach squared difference of random variable is used in place of absolute difference, to measure the loss between the outputs of two different edge detectors.The mean-squared error (MSE) between two biometric images , ′ , ) can be expressed as:
ISSN (Print) : 2319-8613 ISSN (Online) : 0975-4024 Sanjay Kumar et al. / International Journal of Engineering and Technology (IJET)
DOI: 10.21817/ijet/2016/v8i6/160806409 Vol 8 No 6 Dec 2016-Jan 2017 2454

1
, ,
2. Root Mean Squared Error (RMSE): It is very common and excellent general purpose error metric for numerical predictions. Compared to the similar Mean Squared Error, RMSE amplifies and severely punishes large errors. It can be expressed as:
3. Peak Signal to Noise Ratio (PSNR): It is ratio between the maximum possible power of a signal and the power of corrupting noise that affects the fidelity of its representation. Image reconstruction is directly proportional to the PSNR. It can be expressed as:
10 log Where S is maximum pixel value.
IV. EXPERIMENTAL RESULTS AND COMPARATIVE ANALYSIS
We have taken three types of biometric images like Iris, Thumbprint, and Face for the comparison between all the edge detection techniques using MATLAB software as shown in below Fig1, Fig2 and Fig3 respectively.
Fig 1. Edge detection of Iris
Fig 2. Edge detection of Thumbprint
Fig 3. Edge detection of Face
ISSN (Print) : 2319-8613 ISSN (Online) : 0975-4024 Sanjay Kumar et al. / International Journal of Engineering and Technology (IJET)
DOI: 10.21817/ijet/2016/v8i6/160806409 Vol 8 No 6 Dec 2016-Jan 2017 2455

For finding the similarities and dissimilarities between all different edge detection techniques, the parameters MSE and PSNR are used and their comparison values are tabulated in the below tables Table I to Table VI. Thecomparative graphs of the parameters MSE and PSNR of the corresponding biometric images like iris, fingerprint and face are plotted from Fig 4 to Fig 9 respectively.
TABLE I. MSE comparison values for Iris image
Prewitt Sobel Roberts Canny LoG ZC
Prewitt 0 0.0044 0.0208 0.0585 0.0974 0.0974
Sobel 0.0044 0 0.0207 0.0590 0.0976 0.0976
Roberts 0.0208 0.0207 0 0.0625 0.0966 0.0966
Canny 0.0585 0.0590 0.0625 0 0.1141 0.1141
LoG 0.0974 0.0976 0.0966 0.1141 0 0
ZC 0.0974 0.0976 0.0966 0.1141 0 0
TABLE II. PSNR comparison values for Iris image
Prewitt Sobel Roberts Canny LoG ZC
Prewitt ∞ 23.5315 16.8200 12.3321 10.1138 10.1138
Sobel 23.5315 ∞ 16.8348 12.2920 10.1039 10.1039
Roberts 16.8200 16.8348 ∞ 12.0401 10.1524 10.1524
Canny 12.3321 12.2920 12.0401 ∞ 9.4284 9.4284
LoG 10.1138 10.1039 10.1524 9.4284 ∞ ∞
ZC 10.1138 10.1039 10.1524 9.4284 ∞ ∞
TABLE III. MSE comparison values for Thumbprint image
Prewitt Sobel Roberts Canny LoG ZC
Prewitt 0 0.0011 0.0123 0.0641 0.0210 0.0210
Sobel 0.0011 0 0.0123 0.0642 0.0212 0.0212
Roberts 0.0123 0.0125 0 0.0703 0.0167 0.0167
Canny 0.0641 0.0642 0.0703 0 0.0702 0.0702
LoG 0.0210 0.0212 0.0167 0.0702 0 0
ZC 0.0210 0.0212 0.0167 0.0702 0 0
TABLE IV. PSNR comparison values for Thumbprint image
Prewitt Sobel Roberts Canny LoG ZC
Prewitt ∞ 29.7138 19.0859 11.9311 16.7735 16.7735
Sobel 29.7138 ∞ 19.0355 11.9224 16.7461 16.7461
Roberts 19.0859 19.0355 ∞ 11.5334 17.7712 17.7712
Canny 11.9311 11.9224 11.5334 ∞ 11.5382 11.5382
LoG 16.7735 16.7461 17.7712 11.5382 ∞ ∞
ZC 16.7735 16.7461 17.7712 11.5382 ∞ ∞
ISSN (Print) : 2319-8613 ISSN (Online) : 0975-4024 Sanjay Kumar et al. / International Journal of Engineering and Technology (IJET)
DOI: 10.21817/ijet/2016/v8i6/160806409 Vol 8 No 6 Dec 2016-Jan 2017 2456

TABLE V. MSE comparison values for Face image
Prewitt Sobel Roberts Canny LoG ZC
Prewitt 0 0.0099 0.0497 0.1040 0.0971 0.0971
Sobel 0.0099 0 0.0495 0.1049 0.0975 0.0975
Roberts 0.0497 0.0495 0 0.1173 0.0946 0.0946
Canny 0.1040 0.1049 0.1173 0 0.1208 0.1208
LoG 0.0971 0.0975 0.0964 0.1208 0 0
ZC 0.0971 0.0975 0.0964 0.1208 0 0
TABLEVI. PSNR comparison values for Face image
Prewitt Sobel Roberts Canny LoG ZC
Prewitt ∞ 20.0270 13.0339 9.8311 10.1285 10.1285
Sobel 20.0270 ∞ 13.0541 9.7924 10.1110 10.1110
Roberts 13.0339 13.0541 ∞ 9.3077 10.2398 10.2398
Canny 9.8311 9.7924 9.3077 ∞ 9.1801 9.1801
LoG 10.1285 10.1110 10.2398 9.1801 ∞ ∞
ZC 10.1285 10.1110 10.2398 9.1801 ∞ ∞
Fig 4. MSE graph of Iris
Fig 5. PSNR graph of Iris
ISSN (Print) : 2319-8613 ISSN (Online) : 0975-4024 Sanjay Kumar et al. / International Journal of Engineering and Technology (IJET)
DOI: 10.21817/ijet/2016/v8i6/160806409 Vol 8 No 6 Dec 2016-Jan 2017 2457
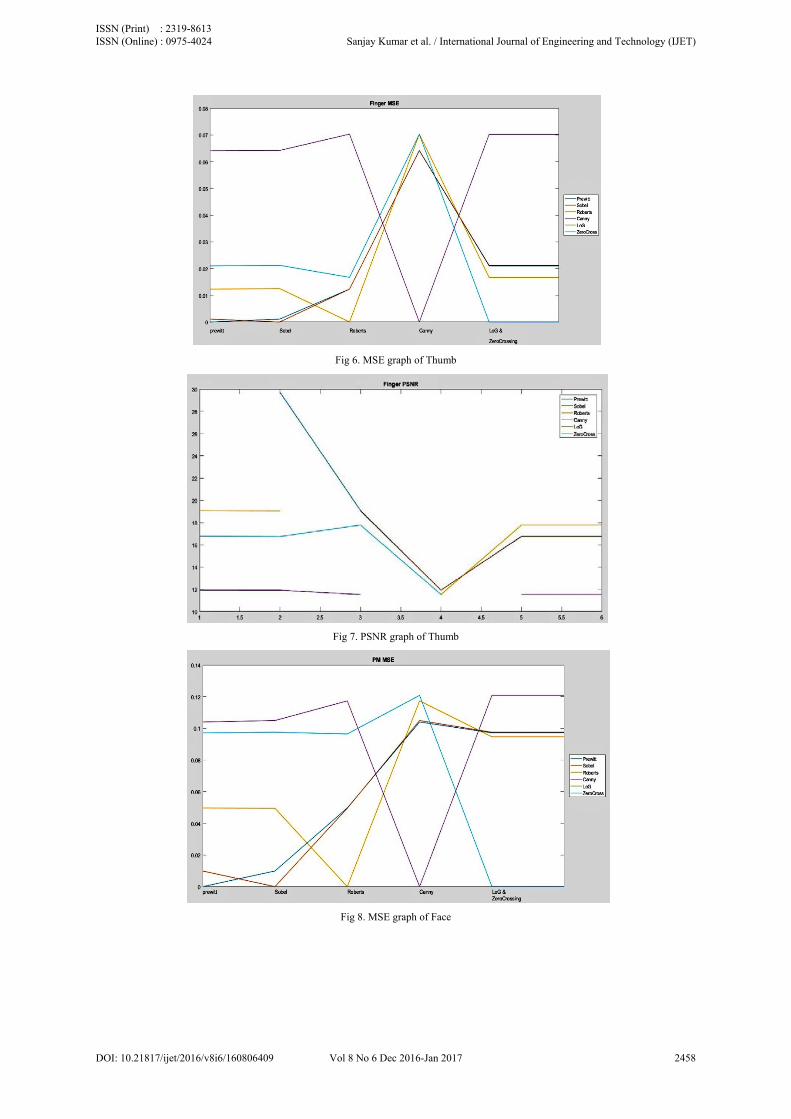
Fig 6. MSE graph of Thumb
Fig 7. PSNR graph of Thumb
Fig 8. MSE graph of Face
ISSN (Print) : 2319-8613 ISSN (Online) : 0975-4024 Sanjay Kumar et al. / International Journal of Engineering and Technology (IJET)
DOI: 10.21817/ijet/2016/v8i6/160806409 Vol 8 No 6 Dec 2016-Jan 2017 2458

Fig 9. PSNR graph of Face
V. CONCLUSION
The best edge detector of biometric images may be decided based on following conclusions:
1. By visual appearance of the results after applying the different edge detectors on the biometric image, one can easily decide the best edge detector for the biometric images. From the Fig1, Fig2 and Fig3 it is concluded that canny edge detector is best among others.
2. The minimum PSNR value and maximum MSE value give results to best edge detector. From the graphs drawn from Fig 4 to Fig 9, it is clear that on an average canny operator has less PSNR value and high MSE value and concluded to be the best edge detector for biometric application.
3. Similarities and dissimilarities among different edge detectors can be calculated based on MSE analysis of the biometric images. The higher value of dissimilarities can be considered as best edge detector. In the TableII and TableIII, canny edge detector has higher dissimilarity but in TableI, LoG/Zero crossing have slightly higher value of dissimilarity, which may be due to false edge detection as depicted in Fig 1. So finally we are at conclusion that canny operator can be considered as best edge detector for biometric images.
ACKNOWLEDGMENT
We are thankful to Mr. Surjit Paul student of M.Tech CSE NIT, Jamshedpur for manuscript formatting. We also like to thank to almighty for giving us strength to do fruitful work in the area of research to make our nation building.
REFERENCES [1] J Canny, “A computational approach to edge detection” IEEE TRANSACTIONS ON PATTERN ANALYSIS AND MACHINE
INTELLIGENCE, VOL. PAMI-8, NO.6, PP 679-697, 1986. [2] G.T. Shrivakshan and Dr. C. Chandrasekar, “A Comparison of various Edge Detection Techniques used in Image Processing”, IJCSI
International Journal of Computer Science Issues, Vol. 9, Issue 5, No 1, 2012. [3] D. Poobathy and Dr. R. Manicka Chezian, “Edge Detection Operators: Peak Signal to Noise Ratio Based Comparison”, I.J. Image,
Graphics and Signal Processing, 2014, 10, 55-61. [4] Simranjit Singh and Rakesh Singh, “Comparison of various edge detection techniques”, computing for Sustainable Global
Development (INDIACom), 2015 2nd International Conference, PP 393-396, 2015. [5] Rafael C. Gonzalez and R. E. Woods, “Digital Image Processing 3rd ed. Prentice Hall, 2008. [6] Nick Kanopoulos, et.al, “Design of an Image Edge Detection Filter using the Sobel Operator”, Journal of solid state circuits, IEEE,
vol. 23, Issue 2, pp 358-367, April 1988. [7] T. G. Smith jr., et.al, “Edge Detection in images using Marr-Hildreth filtering techniques”, Journal of Neuroscience Methods, Vol. 26,
Issue 1, pp 75-81, November 1988.
AUTHOR PROFILE
Sanjay Kumar is an associate professor of Department of Computer Science and Engineering at National Institute of Technology, Jamshedpur, India. His areas of research are Cryptography and Network security, mobile computing, parallel and distributed computing and VANET.
Mahatim Singh is an M.Tech Scholar of Department of Computer Science and Engineering at National Institute of Technology, Jamshedpur, India. His areas of interest are Biometrics, Computer Vision and Data Sciences.
Dr. Dilip Kumar Shaw is an associate professor of Department of Computer Application at National Institute of Technology Jamshedpur, India. His areas of research are Supply Chain Management,Data Mining, Cryptography, Computational Complexity, and Network Optimization.
ISSN (Print) : 2319-8613 ISSN (Online) : 0975-4024 Sanjay Kumar et al. / International Journal of Engineering and Technology (IJET)
DOI: 10.21817/ijet/2016/v8i6/160806409 Vol 8 No 6 Dec 2016-Jan 2017 2459