comparative life cycle assessments of conventional
TRANSCRIPT

IN DEGREE PROJECT MATERIALS SCIENCE AND ENGINEERING,SECOND CYCLE, 30 CREDITS
, STOCKHOLM SWEDEN 2020
Comparative Life Cycle Assessments of Conventional Products and 3D-Printed Wood-Plastic Composite Alternatives
SANGHO KIM
KTH ROYAL INSTITUTE OF TECHNOLOGYSCHOOL OF INDUSTRIAL ENGINEERING AND MANAGEMENT


i
As additive manufacturing gains market potential as a mainstream process in various
sectors of industry, there is a growing need for addressing environmental aspects of
this technology and the materials associated with it. In this master thesis, comparative
life cycle assessments (LCAs) from cradle to grave between the conventional products
and 3D-printed alternatives made of wood-plastic composite (WPC) were conducted
based on the ISO 14044:2006 standard. Environmental impacts of each product were
quantified for 10 impact categories. The goal of the LCAs was to determine whether
the use of the 3D-printed WPC products may suggest a sustainable alternative to the
conventional ones.
This master thesis presents three case studies in which comparative LCAs were
carried out. The first two case studies are about storage compartments for trucks from
Scania, and the third one is about ceiling boards from Veidekke. The results showed
that, in all case studies, the 3D-printed WPC alternatives would have smaller
environmental impacts compared with the conventional products. The most
significant difference was observed in the first two case studies because of the light-
weighting effect. The alternatives showed 51%, 68% and 13% lower global warming
potential (GWP) than the conventional products in each case study, respectively.
However, the results of the cradle-to-gate LCAs suggested that the 3D-printed WPC
alternative might cause greater environmental impact than the conventional products
regarding some impact categories.
Therefore, in the LCA context, the 3D-printed WPC alternatives would be much
more beneficial to the environment compared with the conventional products, but the
environmental benefits might be insignificant from the manufacturer’s perspective.
Keywords: Life cycle assessment, Wood-plastic composite, Additive manufacturing,
3D printing, Environmental impact, Global warming

ii
Eftersom additive tillverkningsteknik ökar marknadspotentialen som en vanlig
process inom olika industrisektorer, finns det ett växande behov av att ta itu med
miljöaspekterna av denna teknik och de material som är associerade med den. I detta
examensarbete avhandling genomfördes jämförande livscykelanalys (LCA) från vagga
till grav mellan de konventionella produkterna och 3D-printade alternativ av
träplastkomposit (WPC) baserat på ISO 14044: 2006-standarden. Miljöpåverkan av
varje produkt kvantifierades för 10 miljöeffekter. Målet med LCA var att avgöra om
användningen av de 3D-printade WPC-produkterna kan vara ett hållbart alternativ
till de konventionella.
Denna avhandling presenterar tre fallstudier där jämförande LCA utfördes. De
två första fallstudierna handlar om förvaringsutrymmen för lastbilar från Scania, och
den tredje om takskivor från Veidekke. Resultaten visade att de 3D- printade WPC-
alternativen i alla fallstudier skulle ha mindre miljöpåverkan jämfört med
konventionella produkter. Den mest signifikanta skillnaden observerades i de två
första fallstudierna på grund av den lägre vikten viktningseffekten. Alternativen
visade 51%, 68% och 13% lägre global uppvärmningspotential (GWP) än de
konventionella produkterna i respektive fallstudie. Emellertid föreslog resultaten av
vaggan-till-grind-LCA att det 3D-printade WPC-alternativet kan orsaka större
miljöpåverkan än de konventionella produkterna avseende vissa miljöeffekter.
Därför, i LCA-sammanhang, skulle de 3D-printade WPC-alternativen vara
mycket mer fördelaktiga för miljön jämfört med konventionella produkter, men
miljöfördelarna kan vara obetydliga ur tillverkarens perspektiv.
Nyckelord: Livscykelanalys, Träplastkomposit, Additive tillverkningsteknik,
Friformsframställning, Miljöpåverkan, Global uppvärmning

iii
Abstract .................................................................................................. i
Sammanfattning .................................................................................... ii
Table of contents .................................................................................. iii
Nomenclature........................................................................................ v
1 Introduction .................................................................................... 1
1.1 Motivation .................................................................................................. 1
1.2 Problem definition ..................................................................................... 1
1.3 Case studies ................................................................................................ 2
2 Literature review ............................................................................. 4
2.1 Wood-plastic composites ........................................................................... 4
2.2 AM and conventional manufacturing ........................................................ 4
2.3 WPCs integrated with AM .......................................................................... 5
3 Methods .......................................................................................... 7
4 Case studies ................................................................................... 10

iv
4.1 Case study A: storage box ......................................................................... 10
4.1.1 Goal and scope definition ............................................................. 10
4.1.2 Inventory analysis ......................................................................... 12
4.1.3 Life cycle impact assessment ........................................................ 16
4.1.4 Life cycle interpretation ................................................................ 18
4.2 Case study B: tunnel storage .................................................................... 20
4.2.1 Goal and scope definition ............................................................. 20
4.2.2 Inventory analysis ......................................................................... 22
4.2.3 Life cycle impact assessment ........................................................ 26
4.2.4 Life cycle interpretation ................................................................ 28
4.3 Case study C: ceiling board ...................................................................... 30
4.3.1 Goal and scope definition ............................................................. 30
4.3.2 Inventory analysis ......................................................................... 32
4.3.3 Life cycle impact assessment ........................................................ 35
4.3.4 Life cycle interpretation ................................................................ 37
5 Conclusions ................................................................................... 39
6 Future work .................................................................................. 40
7 Acknowledgements ....................................................................... 41
8 References .................................................................................... 42
Appendix A: LCI details ....................................................................... 47
Appendix B: LCIA details ..................................................................... 54

v
3D three-dimensional
AD terrestrial acidification
AM additive manufacturing
APP ammonium polyphosphate
DB database
EP freshwater eutrophication
EU European Union
FD fossil depletion
FDM fused deposition modelling
FEC freshwater ecotoxicity
FFF fused filament fabrication
FGF fused granular fabrication
FP fine particulate matter formation
FPF fused particle fabrication
GW global warming
GWP global warming potential

vi
HT human toxicity
IM injection moulding
ISO International Organization for Standardization
LCA life cycle assessment
LCCA life cycle cost analysis
LCI life cycle inventory
LCIA life cycle impact assessment
MEC marine ecotoxicity
MSW municipal solid waste
OD stratospheric ozone depletion
PLA polylactic acid
PP polypropylene
PUR polyurethane
RISE Research Institutes of Sweden
SEC specific energy consumption
STPP sodium tripolyphosphate
TEC terrestrial ecotoxicity
UCO used cooking oil
UNGA United Nations General Assembly
WPC wood-plastic composite

1
Environmental issues such as climate change and resource depletion have been global
concerns in recent decades. In September 2015 the United Nations General Assembly
(UNGA) included details on climate action and responsible consumption and
production in 17 sustainable development goals [1], and in December most countries
agreed on efforts to curb climate change through the Paris Agreement [2]. Sweden
also aims to reach zero net atmospheric greenhouse gas emissions by the year 2045,
and pursues reduction measures including carbon dioxide and energy taxes, the
European Union (EU) Emissions Trading System and the Environmental Code [3].
Accordingly, companies are committed to reducing their carbon footprint and
developing resource-efficient products [4]. However, these efforts are concentrated
on traditional manufacturing—subtractive and formative manufacturing, and
research on environmental impacts of additive manufacturing (AM) is still scarce.
AM, commonly known as three-dimensional (3D) printing, is a manufacturing
process used to build a product layer by layer using a digital model. Since its advent
in the 1980s, AM has mostly been used for rapid prototyping due to its ability to create
objects with complex geometries [5]. Recent studies have shown that there is market
potential for this technology as a manufacturing process to produce end-use parts in
various sectors of industry—such as automotive and construction [6, 7, 8, 9]. These
studies, however, often do not address environmental benefits and drawbacks that
AM has over traditional manufacturing.

2
To consider the environmental aspects, a systematic approach is necessary.
Therefore, the purpose of this master thesis is to investigate the potential
environmental impacts of AM through comparative life cycle assessments (LCAs) of
the conventional products and the 3D-printed alternatives. LCA is an analytical
technique for assessing environmental impacts associated with the phases of a
product’s life [10]. It provides a quantitative evaluation on the environmental impacts
that would occur during the life cycle of the product so that users can identify which
phase causes which environmental impacts and make decisions based on that.
This master thesis presents three case studies which are part of a project called
Wouldwood coordinated by Research Institutes of Sweden (RISE) and funded by
Vinnova together with various partners. The project is an integrated platform to
develop wood-based materials and apply them to large-scale AM. It also covers digital
design, production equipment and recycling strategies. [11]
In each case study, a comparative LCA was conducted for the existing
conventional product and the 3D-printed alternative made of wood-based materials.
Due to the different nature of the products, each case study is discussed in the separate
sections. The first two case studies are about storage compartments for trucks from
Scania, a Swedish vehicle manufacturer [12]. Both compare the original injection-
moulded products made of mineral-filled plastics with the 3D-printed alternatives
made of wood-based composites. The third one is about ceiling boards from Veidekke,
a Norwegian construction company [13]. It compares a commercial gypsum
plasterboard with the 3D-printed alternative made of wood-based composites.
Although fused filament fabrication (FFF)—more commonly known as the
trademarked term, fused deposition modelling (FDM)—is the most common
technology of material extrusion, fused particle fabrication (FPF)—also known as
fused granular fabrication (FGF)—is used as the AM process for all the case studies.
This process is a newer type of FDM that uses pellets directly instead of converting
them into filaments, and has the possibility to utilize more recycled materials [14].
The pellets for AM are from Stora Enso, a Finnish wood-based material manufacturer
[15]. Other types of AM such as photopolymerization and powder bed fusion are not
discussed in this report (see Table 1.)

3
Table 1 Common AM technologies
Type Technologies
Material extrusion Fused filament fabrication (FFF)
Fused particle fabrication (FPF)
Photopolymerization Stereolithography (SLA)
Powder bed fusion Selective laser sintering (SLS)

4
Wood is one of the oldest structural materials. Due to its long history associated with
traditional manufacturing industries, the image of wood-based materials has been
obsolete in an engineering sense. In contrast to this misperception of them as low-
tech, new wood-based materials are being continuously developed and introduced to
the high-tech engineering field and construction market. For example, wood-based
composites such as laminated veneer lumber have acted as a solution to overcome
structural limitations of today's plantation wood caused by its small diameter, and
increase the reliability of final products by minimizing local deformation through the
random distribution of defects. They also allow utilization of recycled materials as
new resource supplies. [16]
Recently, the trend is to directly combine wood and synthetic materials. Among
this type of materials, wood-plastic composites (WPCs) emerged as a solution for
sustainable development because there are more and more demands for
biodegradability for both automotive and architectural applications [17, 18]. WPCs
have already gained substantial ground in the market by offering the light-weighting
potential in automotive industries and the flexibility in designing buildings [19, 20].
As the use of AM increases around the world, research is being actively conducted to
compare this technology with traditional manufacturing. While there are numerous
opportunities for AM to make significant changes in the way products are
manufactured in various industries, it is still facing several challenges to its
implementation.
5
Most 3D printers can only produce objects that are smaller than the printer
enclosure. It means there is a limit on the size of objects that can be manufactured at
a time, which necessitates segmented production and additional assembly. Besides,
AM is slower in mass production than conventional manufacturing processes such as
injection moulding (IM). Longer production time leads to higher cost, and relatively
expensive 3D printing equipment and the materials also contribute to rising
production cost although they will be cheaper and cheaper as the related technologies
advance. [6]
Experts do not believe AM will replace existing manufacturing processes: it will
not revolutionize manufacturing industry to shut down traditional factories. Instead,
it is recommended to utilize its unique features as a complement to conventional
manufacturing. For example, conventional manufacturing processes are still
dominant in manufacturing industries with high production volume. However, even
for these industries AM can be more useful than conventional manufacturing when
the complexity of a product’s geometry or the customization of a product are the main
concern. Its strength is best shown in manufacturing industries with low production
volume such as rapid prototyping and component manufacturing. Manufacturers can
modify or redesign a part with no penalty thanks to its process flexibility, which
facilitates rapid tooling and on-demand manufacturing. AM can also be more eco-
friendly than conventional manufacturing as it leaves little waste. [6, 21]
Thanks to their superior aesthetics, WPCs for AM have market recognition [22]. The
following included only research on materials for AM using material extrusion
processes because these materials and the materials used for other AM technologies
are different in nature.
When it comes to material, polylactic acid (PLA) filled with wood fibre is the most
common in the market. While the plastic part is mostly fixed with PLA, various types
of wood are used as wood materials [23].
With respect to the optimal wood content, there is a big difference from study to
study although commercial products typically have 30%. Tao et el. published a paper
on the development of wood flour-filled PLA composite filament for FDM. The
researchers observed that the composite filament with 5wt% wood content had
enhanced deformation resistance compared with pure PLA filament, displaying
different microstructure on the material’s fracture surface [24]. Kariz et al.
investigated the effect of wood content in FDM filament on the properties by varying

6
wood content in wood-PLA composite filaments from 0wt% to 50wt%. The results
showed that tensile strength increased at 10% wood content but decreased with
higher levels of wood content [25]. Liu et al. investigated the effect of wood content
and types of wood filler in PLA-based WPC on the properties such as tensile strength
and thermal stability. The results showed that the optimal wood content was 15% and
the superior combination was lignin-PLA under the same wood content [26].
Montalvo Navarrete et al. tested thermal and mechanical behaviour of polypropylene
and PLA filled with different percentages of wood flour. They concluded that the
samples with 20% wood content were suitable for AM and those with 30% wood
content were relatively brittle [27]. Martikka et al. published a paper on the
mechanical properties of 3D-printed WPCs. The results indicated that the tensile
strength and impact resistance of WPC parts are about 50% of those of pure PLA parts
when the infill percentage is the same, however, it was implied that these WPC parts
could be strong enough for low-stress applications [28].
In addition to the material composition, infill percentage has a significant impact
on the properties of 3D-printed products. The infill is the amount of material that fills
up the internal structure of the 3D-printed products. Alvarez et al. investigated the
influence of infill percentage on the mechanical properties and effective printing time
of 3D-printed parts. The results showed that the tensile strength and impact
resistance improve as the infill percentage increases, and the parts have their
maximum tensile strength and impact resistance with 100% infill. It was also
observed that the tensile strength does not improve efficiently as the infill percentage
gets close to 100%. In reference to the effective printing time, it is longer with 50-98%
infill than with 100% infill. Therefore, the researchers indicated that 50-98% infill is
not recommended from the manufacturing perspective. However, actual products
manufactured with AM often do not have 100% either. [28, 29]

7
This master thesis applied the LCA methodology based on the ISO 14044:2006
standard by the International Organization for Standardization (ISO) [30]. LCA is an
analytical technique for assessing environmental impacts associated with the phases
of a product’s life—pre-manufacturing (resource extraction and materials processing),
manufacturing, distribution, use and disposal (end-of-life). According to the ISO
standard, an LCA consists of the following four steps (see also Figure 1):
• Goal and scope definition
• Life cycle inventory analysis (LCI)
• Life cycle impact assessment (LCIA)
• Life cycle interpretation
Figure 1 General steps of an LCA
In the first step, the goal and scope of the LCA are defined. The definition shall
be consistent with the intended application and the reasons for carrying out the study.
This step shall describe the product system to be studied, the functional unit and the
system boundary. The functional unit is a quantified description that represents the
performance requirements fulfilled by the studied product system. It provides a

8
reference associated with the inputs and outputs. The system boundary is a boundary
that determines which unit processes of the product’s life cycle to be included in the
LCA. If an LCA covers from resource extraction to disposal phase, it is called cradle-
to-grave (see Figure 2). If it only covers until manufacturing phase before the product
is transported to the consumer, it is called cradle-to-gate. All general decisions shall
be made including geography, time horizon, allocation method, LCIA method and
types of impact categories to be included in the LCA. Assumptions and limitations
shall also be stated in this step.
Figure 2 General phases of life cycle
Next, an LCI consists of the data collection on the inputs and outputs of materials
and energy related to the product studied and the calculation process for quantifying
them. Data shall be collected for every raw material, process and activity in the
product’s life cycle that has impacts on the environment. The collected data shall be
reliable to simulate a valid model for each phase in the product’s life cycle.
Then in an LCIA, the collected data shall be processed and the actual results of
the LCA shall be given. The emissions of the product shall be divided into different
environmental impact categories that are selected during goal and scope definition.
The final step is life cycle interpretation. The significant issues shall be identified
and discussed based on the results of the LCI and LCIA. This step includes conclusions
and recommendations. Sensitivity analysis may also be conducted for further
investigation of the effect of certain materials and processes on the environmental
impact categories.

9
The LCI and LCIA have been conducted with the software SimaPro 9.1.0.11, one
of the leading LCA tools to model a life cycle of a product or system and analyse the
environmental impacts. With its resourceful database, it is possible to simulate almost
all materials and processes, and build a life cycle with them. [31]

10
The main goal of this case study is to perform a comparative LCA between two interior
parts for trucks from Scania. One is the conventional injection-moulded storage box
made of mineral-filled polypropylene (PP), and the other is the 3D-printed alternative
made of wood fibre and PP with a small addition of a flame retardant (see Figure 3).
The objective is to determine, with a quantitative analysis, if the use of the 3D-printed
WPC product may suggest a sustainable alternative to the conventional storage box.
Figure 3 3D modeling of the compared products in the case study A
The functional unit for the storage boxes is simply a single unit product with a
volume of 4.04 L, each having a different material composition. The difference in

11
mass between them was considered irrelevant because both the products achieve the
same task. Since it was intended is to compare the products based on the functional
unit, the production volume was excluded from consideration.
The system boundary for the LCAs of this study is cradle-to-grave: pre-
manufacturing, manufacturing, distribution, use and end-of-life phases. The process
trees for the injection-moulded storage box and the 3D-printed WPC alternative are
presented in Figure 4 and Figure 5, respectively. The system boundary and the
assumptions and limitations used in data collection are presented in Table 2.
Figure 4 Process tree of the injection-moulded storage box
Figure 5 Process tree of the 3D-printed WPC storage box
The geography for the manufacturing, distribution, use and end-of-life phases
was set to Sweden, and the time horizon 2020. Ecoinvent 3 was used for the LCI
database [32]. Allocation at the point of substitution—which is also called Ecoinvent
default—was chosen as the allocation method [33]. The chosen LCIA method is
ReCiPe 2016 Midpoint (Hierarchist) which is considered to be the default model [34].
The impact categories included in the LCAs are: global warming, stratospheric ozone
depletion, fine particulate matter formation, terrestrial acidification, freshwater
eutrophication, human toxicity, fossil depletion and three types of ecotoxicity—
terrestrial ecotoxicity, freshwater ecotoxicity and marine ecotoxicity.

12
Table 2 System boundary and assumptions/limitations for the case study A
Life cycle stages
System boundary Assumptions and
limitations
Pre-manufacturing
- Resource extraction
- Materials processing
- Transport from the suppliers to the processing site
- Geography data are unavailable for some raw materials
Manufacturing - Product manufacturing
- Transport from the processing site to the manufacturing site
- SEC for FPF is the same as SEC for FDM
- Energy consumption and emissions for the manufacturing facilities are excluded
Distribution - Transport from the manufacturing site to the distribution site
- Distribution to the individual consumers is excluded
Use - Consumer use 40,570 km per year [35]
- Consumer use for 6.2 years [36]
- Both products have the same use phase
End-of-life - Incineration
- Recycling
- Wasted PP during IM is recycled
Inventory analysis was performed in accordance with the framework provided by the
ISO. Data collected are: the list of the raw materials, transport modes and distance for
each item, production data of manufacturing processes, fuel consumption during the
use phase, and disposal processed. The project Wouldwood is based in Sweden, so the
energy and production data were used according to the average value of the European
market. The field data were primarily collected, and if they were unavailable
experimental data from the literature were adopted.
All the databases used in the LCAs for the injection-moulded storage box and the
3D-printed WPC alternative are presented in Table 3 and Table 4, respectively. Data
collection and processing methods are described separately for each stage of the LCAs.
The shortcuts attached to the end of each item show geographical reference. For
example, SE represents Sweden and means the corresponding item contains average
data for Sweden. GLO and RER represent global and Europe, respectively.

13
Table 3 Life cycle inventory database used for the injection-moulded storage box
Life cycle stages
Items LCI DB (Ecoinvent 3)
Pre-
manufacturing
Polypropylene, SE Polypropylene, granulate, GLO
Mineral, SE Kaolin, GLO
Grinding, SE Electricity, medium voltage, SE
Compounding, SE Electricity, medium voltage, SE
Water, lake, SE
Road Transport, lorry, EURO5, RER
Manufacturing Injection moulding, SE Injection moulding, RER
Road Transport, lorry, EURO5, RER
Distribution Road Transport, lorry, EURO5, RER
Use Road Transport, lorry, EURO6, RER
End-of-life Incineration, SE Incineration of MSW, SE
Recycling of PP, SE Recycling of PP, GLO
Road Transport, lorry, EURO6, RER
Table 4 Life cycle inventory database used for the 3D-printed WPC storage box
Life cycle stages
Items LCI DB (Ecoinvent 3)
Pre-
manufacturing
Polypropylene, SE Polypropylene, granulate, RER
Woold wool, SE Wood wool, RER
Flame retardant, SE Sodium tripolyphosphate, GLO
Compounding, SE Electricity, medium voltage, SE
Water, lake, SE
Road Transport, lorry, EURO5, RER
Water Transport, sea, natural gas, GLO
Manufacturing Fused particle fabrication, SE Electricity, low voltage, SE
Transport, lorry, EURO5, RER
Use Road Transport, lorry, EURO6, RER
End-of-life Incineration, SE Incineration of MSW, SE
Road Transport, lorry, EURO6, RER

14
The pre-manufacture phase includes extraction, acquisition, processing, and
transportation of raw materials. Masses of the raw materials were calculated based on
the volume and material composition of the products. Raw material productivity—the
ratio of production quantity against the amount of raw material used—is assumed to
be 100% for the sake of simplicity. When the transportation data for the raw materials
were not available, average transportation modes and distance in the European
market were adopted.
The conventional storage box is made of mineral-filled PP. Therefore, the pre-
manufacturing process begins with the extraction and acquisition of granulated PP
and raw minerals. The material data obtained from the manufacturer only specified
the filler as mineral, so kaolin—a mineral filler known to increase impact strength and
heat resistance—was chosen as the filler material in the simulation. The process is
followed by the grinding of kaolin [37]. It ends with the compounding of PP and kaolin,
obtaining PP (20% kaolin).
Pellets for the WPC storage box are made of wood fibre, PP, and a small addition of a
flame retardant. Therefore, the pre-manufacturing process begins with the extraction
and acquisition of them. According to the material data obtained from the
manufacturer, the flame retardant was supposed to be ammonium polyphosphate
(APP), however, sodium tripolyphosphate (STPP)—which is also used as a flame
retardant—was chosen as the flame retardant in the simulation because APP was not
available in the LCI DB [38]. It is assumed that the flame retardant is prepared as
powder form. The process ends with the compounding of wood fibre, PP, and the
flame retardant, obtaining flame retarded wood-plastic pellets (40% PP, 10% STPP).
The manufacturing phase normally includes assembly and inspection as well as
manufacturing process. However, since the assembly of a storage box to a truck is a
relatively simple process and it is assumed that there is no failure in manufacturing,
only the manufacturing process was considered in the simulation. Energy
consumption and emissions for the manufacturing facilities were excluded.

15
The conventional storage box is manufactured through IM at Backa, Swden. It is
assumed that there is no failure in manufacturing, so material loss only occurs during
machine start-up, cleaning, and maintenance. The production yield—the ratio of the
manufactured quantity against the amount of material used—for IM is assumed to be
90% [39]. It is assumed that the wasted material at this phase is recycled [40]. Energy
consumption and emissions during IM was set according to the LCI DB. The weight
of the manufactured item is 4.20 kg.
The WPC storage box is manufactured through AM at Södertälje, Sweden. It is
assumed that there is no failure in manufacturing, so material loss is only contributed
by the support material, which is a technically inevitable waste. The production yield
for AM is assumed to be 84.4% [41]. Since there has not been any research on energy
consumption and emissions data for FPF, data for FDM from the literature were
adopted [41, 42]. FPF does not involve filament manufacturing process, so one of the
lowest energy consumption data for FDM was chosen. The infill percentage was set to
50%. It must be noted that the weight of the manufactured item is 2.07 kg, which is
less than half of the injection-moulded one.
Distribution to individual consumers was excluded in the simulation because the
consumers are expected to come and get the vehicles at the distribution site in
Södertälje, Sweden themselves.
The conventional storage box is transported from the manufacturing facility in Backa,
Sweden to the distribution centre in Södertälje, Sweden by using roads.
The WPC storage box is manufactured in the same place as the distribution centre in
Södertälje, Sweden. Therefore, the product does not need to be transported.
The use phase calculated the amount of fuel consumed by a truck due to the weight of
each storage box assembled with the truck during the useful life of the vehicle. In
Sweden, average mileage of heavy trucks is 40,570 km per year [35], and medium and
heavy commercial vehicles are on average 6.2 years old [36].

16
All storage boxes were considered disposed when the vehicles on which they were
assembled reach the end of their useful life. It was assumed that the discarded
products are classified as municipal solid waste and incinerated in Södertälje, Sweden.
The classification and characterization process were carried out in accordance with
the ISO 14040s standard. For the impact assessment, ReCiPe Midpoint (Hierachist)
was applied to calculate the environmental impacts, and the following 10 impact
categories were included in the LCA: global warming (GW), stratospheric ozone
depletion (OD), fine particulate matter formation (FP), terrestrial acidification (AD),
freshwater eutrophication (EP), human toxicity (HT), fossil depletion (FD) and three
types of ecotoxicity—terrestrial ecotoxicity (TEC), freshwater ecotoxicity (FEC) and
marine ecotoxicity (MEC).
The results of the cradle-to-grave comparative LCA between the injection-moulded
storage box and the 3D-printed WPC alternative with 50% infill are presented in
Figure 6. The results showed that the environmental impacts caused by the alternative
are about half of those caused by the conventional product. This difference is mostly
contributed by the weight effect in the use phase.
Figure 6 Characterization results of the case study A (cradle-to-grave)
0
10
20
30
40
50
60
70
80
90
100
GW OD FP AD EP HT FD TEC FEC MEC
IM Storage Box 3D Storage Box

17
Since the use phase is dominant in the full LCA, it was expected to be meaningful to
observe the results of a comparative LCA without the use phase as well. Therefore, a
cradle-to-gate comparative LCA was additionally performed. The results are shown in
Figure 7. The results indicated that the 3D-printed WPC alternative may not always
be good for the environment from the manufacturer’s perspective. Ozone depletion,
human toxicity and three types of ecotoxicity appeared to be unfavourable to the
alternative. These are contributed mostly by FPF and the flame retardant.
Figure 7 Characterization results of the case study A (cradle-to-gate)
According to the experimental data provided by the manufacturer, mechanical
properties of the material for the 3D-printed WPC alternative are competitive when
compared with those of the material for the conventional product (see Table 5).
However, there is no guarantee that mechanical properties of the actual product are
suitable for the usage because those of the 3D-printed products are highly dependent
on the infill percentage. That is, there is a possibility that 50% infill will not offer
enough mechanical properties that are needed for the usage. Therefore, it was
expected to be meaningful to set up a hypothetical scenario where the manufacturer
prints the WPC product with a higher infill percentage than 50% and observe the
results. For a dramatic comparison, it was assumed that the hypothetical product is
manufactured with 100% infill. The results of the cradle-to-grave comparative LCA
between the injection-moulded storage box and the 3D-printed WPC alternative with
100% infill are shown in Figure 8. It must be noted that the weight of the alternative
0
10
20
30
40
50
60
70
80
90
100
GW OD FP AD EP HT FD TEC FEC MEC
IM Storage Box 3D Storage Box

18
increased to 4.15 kg.
Table 5 Mechanical properties of the materials used in the case study A
Mechanical properties
PP (20% mineral) WPC (40% PP, 10% APP)
Tensile strength 38.50 MPa 28.22 MPa
Young’s modulus 2.40 GPa 4.31 GPa
Elongation 11.58% strain 1.92% strain
Figure 8 Characterization results of the case study A (100% infill)
The results displayed that the environmental impacts caused by the 3D-printed
alternative with 100% infill are slightly higher than those caused by the conventional
product for all categories except fossil depletion (FD).
For the 3D-printed WPC storage box, process contribution—a percentage of the
contribution made by the impact values of each phase on those of whole life cycle in
the given impact categories—was investigated. The results are shown in Figure 9. The
use phase is dominant as observed in 4.1.3.1. There is no contribution made by the
impact of the distribution phase because distribution to individual consumers is
excluded.
Sensitivity analysis was performed to determine the sensitivity of certain
0
10
20
30
40
50
60
70
80
90
100
GW OD FP AD EP HT FD TEC FEC MEC
IM Storage Box 3D Storage Box

19
materials and processes to the impact value of the investigated impact category. The
results are presented in Table 6. The base product is the 3D-printed WPC storage box.
In the first scenario, petrochemical PP—one of the raw materials—is replaced by PP
made of used cooking oil (UCO)—a renewable resource [43]. In the second scenario,
end-of-life treatment is changed: recycling plastic materials from the used product,
instead of incinerating everything. The unit for global warming potential (GWP) is kg
CO2 eq.
Figure 9 Process contribution of the 3D-printed WPC storage box
Table 6 Sensitivity analysis for the 3D-printed WPC storage box
Scenario Case Total GWP Deviation
(A-B) Sensitivity
(A-B)/A Base (A) Alt. (B) Base (A) Alt. (B)
Raw material
Petrochemical PP
UCO-PP 76.5 75.2 1.3 1.7%
End-of-life Incineration Recycling PP 76.5 74.4 2.1 2.7%
5.0
5.4
7.6
4.8
16.6
10.3
7.9
5.3
9.0
10.7
7.7
10.9
5.1
3.9
7.5
3.1
59.1
50.9
96.1
90.9
68.0
71.3
84.3
88.1
88.4
89.9
26.9
33.0
19.4
0% 10% 20% 30% 40% 50% 60% 70% 80% 90% 100%
MEC
FEC
TEC
FD
HT
EP
AD
FP
OD
GW
Pre-manufacturing Manufacturing Distribution Use End-of-life

20
The main goal of this case study is to perform a comparative LCA between two interior
parts for trucks from Scania. One is the conventional injection-moulded tunnel
storage made of mineral-filled polyurethane (PUR), and the other is the 3D-printed
alternative made of wood fibre and PUR with a small addition of a flame retardant
(see Figure 10). The objective is to determine, with a quantitative analysis, if the use
of the 3D-printed WPC product may suggest a sustainable alternative to the
conventional tunnel storage.
Figure 10 3D modeling of the compared products in the case study B
The functional unit for the tunnel storages is simply a single unit product with a
volume of 2.63 L, each having a different material composition. The difference in
mass between them was considered irrelevant because both the products achieve the
same task. Since it was intended is to compare the products based on the functional
unit, the production volume was excluded from consideration.
The system boundary for the LCAs of this study is cradle-to-grave: pre-
manufacturing, manufacturing, distribution, use and end-of-life phases. The process
trees for the injection-moulded tunnel storage and the 3D-printed WPC alternative
are presented in Figure 11 and Figure 12, respectively. The system boundary and the
assumptions and limitations used in data collection are presented in Table 7.
The geography for the manufacturing, distribution, use and end-of-life phases
was set to Sweden, and the time horizon 2020. Ecoinvent 3 was used for the LCI

21
database [32]. Allocation at the point of substitution—which is also called Ecoinvent
default—was chosen as the allocation method [33]. The chosen LCIA method is
ReCiPe 2016 Midpoint (Hierarchist) which is considered to be the default model [34].
The impact categories included in the LCAs are: global warming, stratospheric ozone
depletion, fine particulate matter formation, terrestrial acidification, freshwater
eutrophication, human toxicity, fossil depletion and three types of ecotoxicity—
terrestrial ecotoxicity, freshwater ecotoxicity and marine ecotoxicity.
Figure 11 Process tree of the injection-moulded tunnel storage
Figure 12 Process tree of the 3D-printed WPC tunnel storage

22
Table 7 System boundary and assumptions/limitations for the case study B
Life cycle stages
System boundary Assumptions and
limitations
Pre-manufacturing
- Resource extraction
- Materials processing
- Transport from the suppliers to the processing site
- Geography data are unavailable for some raw materials
Manufacturing - Product manufacturing
- Transport from the processing site to the manufacturing site
- SEC for FPF is the same as SEC for FDM
- Energy consumption and emissions for the manufacturing facilities are excluded
Distribution - Transport from the manufacturing site to the distribution site
- Distribution to the individual consumers is excluded
Use - Consumer use 40,570 km per year [35]
- Consumer use for 6.2 years [36]
- Both products have the same use phase
End-of-life - Incineration
- Recycling
- Wasted PUR during IM is recycled
Inventory analysis was performed in accordance with the framework provided by the
ISO. Data collected are: the list of the raw materials, transport modes and distance for
each item, production data of manufacturing processes, fuel consumption during the
use phase, and disposal processed. The project Wouldwood is based in Sweden, so the
energy and production data were used according to the average value of the European
market. The field data were primarily collected, and if they were unavailable
experimental data from the literature were adopted.
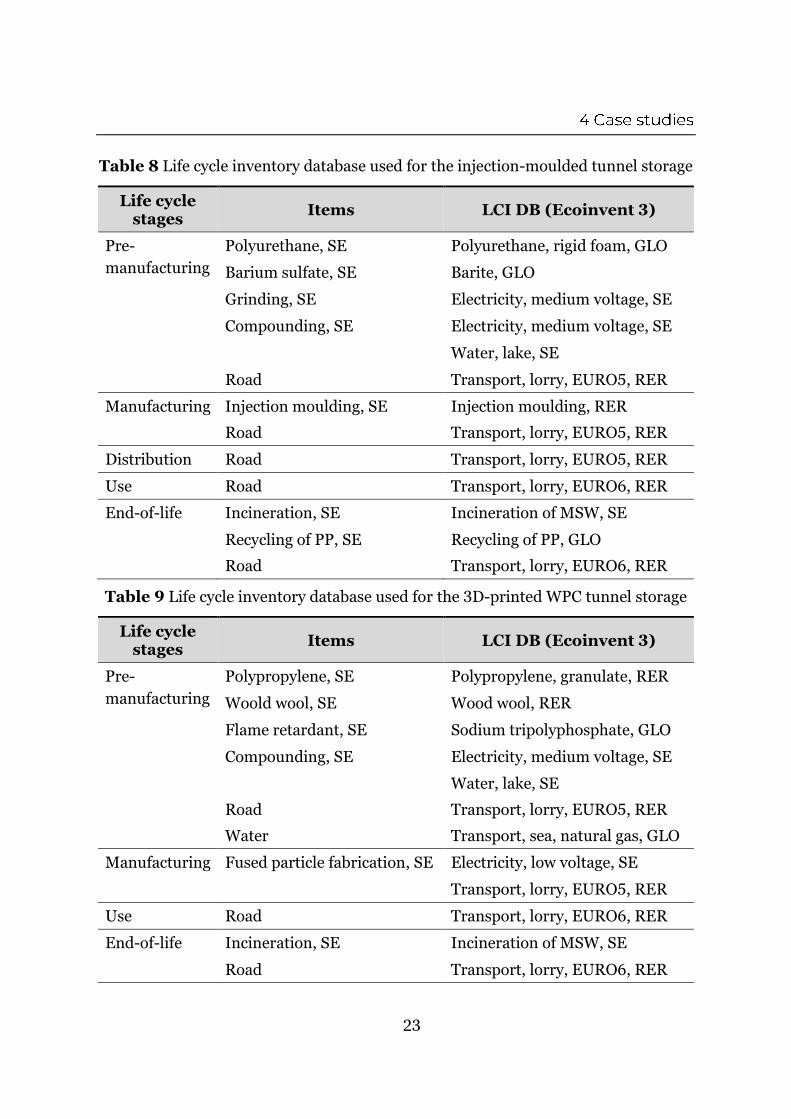
All the databases used in the LCAs for the injection-moulded tunnel storage and
the 3D-printed WPC alternative are presented in Table 8 and Table 9, respectively.
Data collection and processing methods are described separately for each stage of the
LCAs.
The shortcuts attached to the end of each item show geographical reference. For
example, SE represents Sweden and means the corresponding item contains average
data for Sweden. GLO and RER represent global and Europe, respectively.
23
Table 8 Life cycle inventory database used for the injection-moulded tunnel storage
Life cycle stages
Items LCI DB (Ecoinvent 3)
Pre-
manufacturing
Polyurethane, SE Polyurethane, rigid foam, GLO
Barium sulfate, SE Barite, GLO
Grinding, SE Electricity, medium voltage, SE
Compounding, SE Electricity, medium voltage, SE
Water, lake, SE
Road Transport, lorry, EURO5, RER
Manufacturing Injection moulding, SE Injection moulding, RER
Road Transport, lorry, EURO5, RER
Distribution Road Transport, lorry, EURO5, RER
Use Road Transport, lorry, EURO6, RER
End-of-life Incineration, SE Incineration of MSW, SE
Recycling of PP, SE Recycling of PP, GLO
Road Transport, lorry, EURO6, RER
Table 9 Life cycle inventory database used for the 3D-printed WPC tunnel storage
Life cycle stages
Items LCI DB (Ecoinvent 3)
Pre-
manufacturing
Polypropylene, SE Polypropylene, granulate, RER
Woold wool, SE Wood wool, RER
Flame retardant, SE Sodium tripolyphosphate, GLO
Compounding, SE Electricity, medium voltage, SE
Water, lake, SE
Road Transport, lorry, EURO5, RER
Water Transport, sea, natural gas, GLO
Manufacturing Fused particle fabrication, SE Electricity, low voltage, SE
Transport, lorry, EURO5, RER
Use Road Transport, lorry, EURO6, RER
End-of-life Incineration, SE Incineration of MSW, SE
Road Transport, lorry, EURO6, RER

24
The pre-manufacture phase includes extraction, acquisition, processing, and
transportation of raw materials. Masses of the raw materials were calculated based on
the volume and material composition of the products. Raw material productivity—the
ratio of production quantity against the amount of raw material used—is assumed to
be 100% for the sake of simplicity. When the transportation data for the raw materials
were not available, average transportation modes and distance in the European
market were adopted.
The conventional tunnel storage is made of mineral-filled PUR. Therefore, the pre-
manufacturing process begins with the extraction and acquisition of PUR and barite.
The process is followed by the grinding of barite [37]. It ends with the compounding
of PUR and barium sulfate, obtaining PUR (40% barium sulfate).
Pellets for the WPC tunnel storage are made of wood fibre, PP, and a small addition
of a flame retardant. Therefore, the pre-manufacturing process begins with the
extraction and acquisition of them. According to the material data obtained from the
manufacturer, the flame retardant was supposed to be ammonium polyphosphate
(APP), however, sodium tripolyphosphate (STPP)—which is also used as a flame
retardant—was chosen as the flame retardant in the simulation because APP was not
available in the LCI DB [38]. It is assumed that the flame retardant is prepared as
powder form. The process ends with the compounding of wood fibre, PP, and the
flame retardant, obtaining flame retarded wood-plastic pellets (40% PP, 10% STPP).
The manufacturing phase normally includes assembly and inspection as well as
manufacturing process. However, since the assembly of a tunnel storage to a truck is
a relatively simple process and it is assumed that there is no failure in manufacturing,
only the manufacturing process was considered in the simulation. Energy
consumption and emissions for the manufacturing facilities were excluded.
The conventional tunnel storage is manufactured through IM at Monza, Italy. It is
assumed that there is no failure in manufacturing, so material loss only occurs during
machine start-up, cleaning, and maintenance. The production yield—the ratio of the
manufactured quantity against the amount of material used—for IM is assumed to be

25
90% [39]. It is assumed that the wasted material at this phase is recycled [40]. Energy
consumption and emissions during IM was set according to the LCI DB. The weight
of the manufactured item is 4.10 kg.
The WPC tunnel storage is manufactured through AM at Södertälje, Sweden. It is
assumed that there is no failure in manufacturing, so material loss is only contributed
by the support material, which is a technically inevitable waste. The production yield
for AM is assumed to be 84.4% [41]. Since there has not been any research on energy
consumption and emissions data for FPF, data for FDM from the literature were
adopted [41, 42]. FPF does not involve filament manufacturing process, so one of the
lowest energy consumption data for FDM was chosen. The infill percentage was set to
50%. It must be noted that the weight of the manufactured item is 1.35 kg, which is
less than half of the injection-moulded one.
Distribution to individual consumers was excluded in the simulation because it is
assumed that the consumers would come to get the vehicles themselves.
The conventional tunnel storage is transported from the manufacturing facility in
Monza, Italy to the distribution centre in Södertälje, Sweden by using roads and ocean.
The WPC tunnel storage is manufactured in the same place as the distribution centre
in Södertälje, Sweden. Therefore, the product does not need to be transported.
The use phase calculated the amount of fuel consumed by a truck due to the weight of
each tunnel storage assembled with the truck during the useful life of the vehicle. In
Sweden, average mileage of heavy trucks is 40,570 km per year [35], and medium and
heavy commercial vehicles are on average 6.2 years old [36].
All tunnel storages were considered disposed when the vehicles on which they were
assembled reach the end of their useful life. It was assumed that the discarded
products are classified as municipal solid waste and incinerated in Södertälje, Sweden.
26
The classification and characterization process were carried out in accordance with
the ISO 14040s standard. For the impact assessment, ReCiPe Midpoint (Hierachist)
was applied to calculate the environmental impacts, and the following 10 impact
categories were included in the LCA: global warming (GW), stratospheric ozone
depletion (OD), fine particulate matter formation (FP), terrestrial acidification (AD),
freshwater eutrophication (EP), human toxicity (HT), fossil depletion (FD) and three
types of ecotoxicity—terrestrial ecotoxicity (TEC), freshwater ecotoxicity (FEC) and
marine ecotoxicity (MEC).
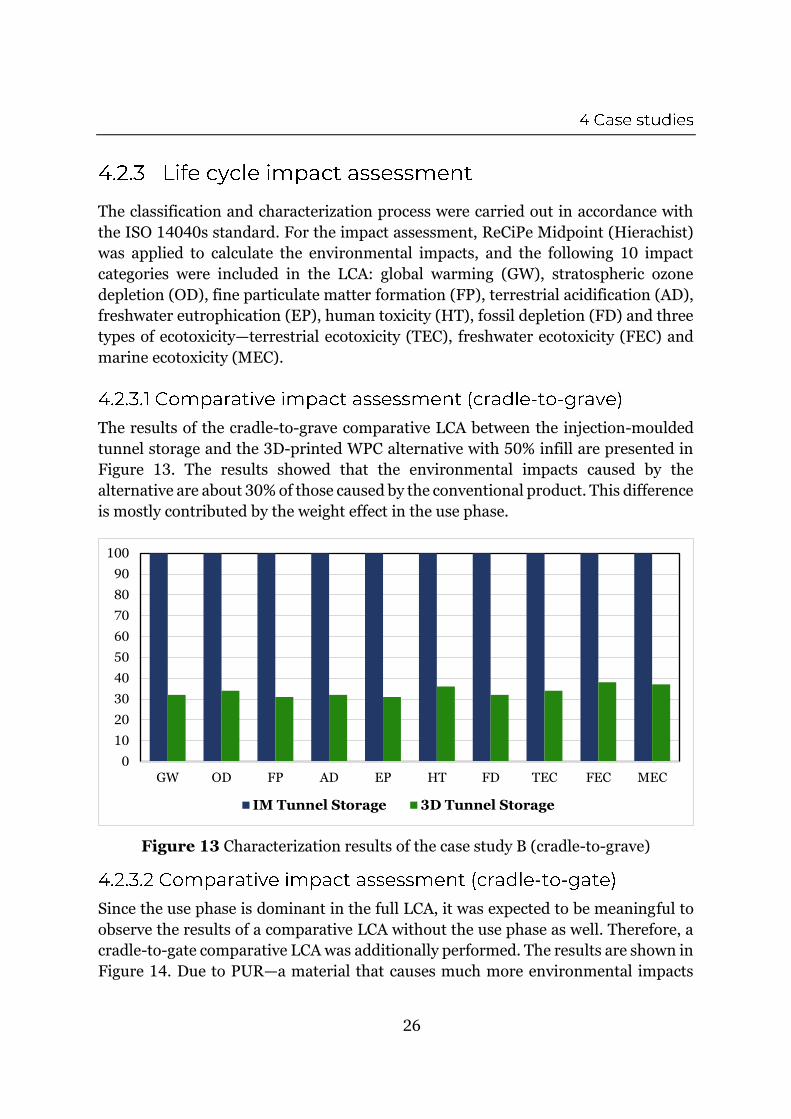
The results of the cradle-to-grave comparative LCA between the injection-moulded
tunnel storage and the 3D-printed WPC alternative with 50% infill are presented in
Figure 13. The results showed that the environmental impacts caused by the
alternative are about 30% of those caused by the conventional product. This difference
is mostly contributed by the weight effect in the use phase.
Figure 13 Characterization results of the case study B (cradle-to-grave)
Since the use phase is dominant in the full LCA, it was expected to be meaningful to
observe the results of a comparative LCA without the use phase as well. Therefore, a
cradle-to-gate comparative LCA was additionally performed. The results are shown in
Figure 14. Due to PUR—a material that causes much more environmental impacts
0
10
20
30
40
50
60
70
80
90
100
GW OD FP AD EP HT FD TEC FEC MEC
IM Tunnel Storage 3D Tunnel Storage

27
compared with PP—and the long transportation between Italy and Sweden, the results
without the use phase were still favourable to the 3D-printed WPC alternative
although it showed higher impacts on ozone depletion, human toxicity and three types
of ecotoxicity because of FPF and the flame retardant.
Figure 14 Characterization results of the case study B (cradle-to-gate)
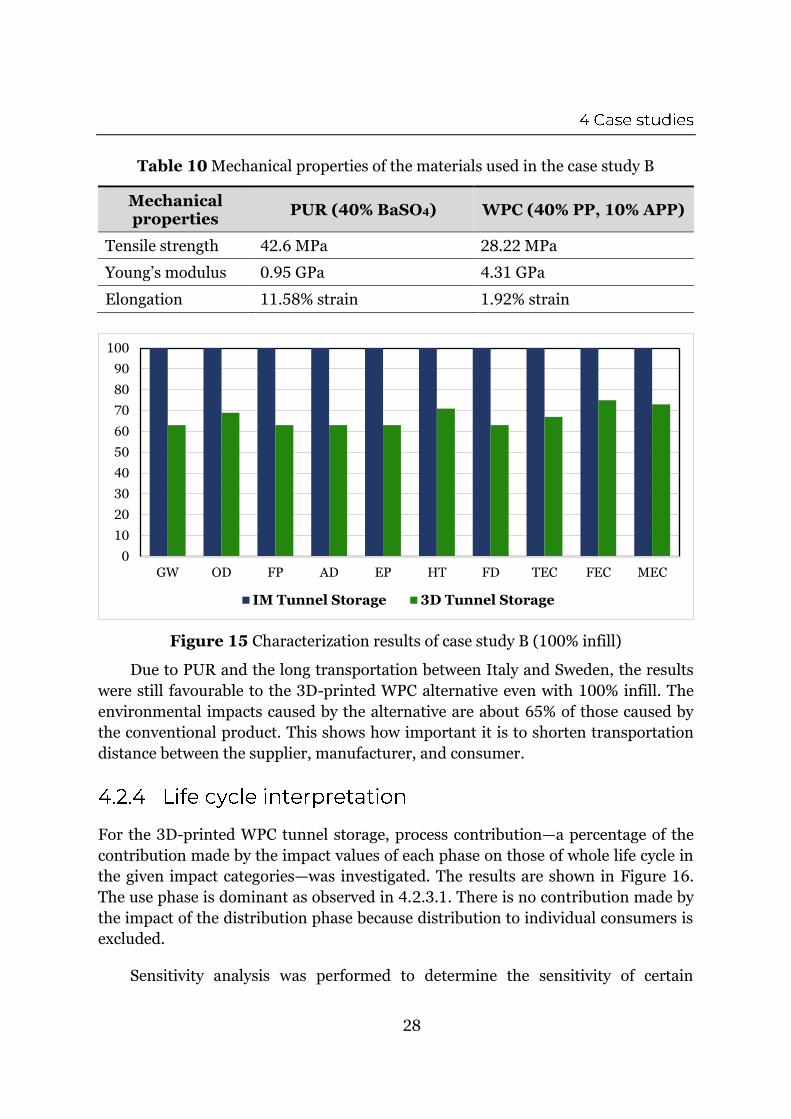
According to the experimental data provided by the manufacturer, mechanical
properties of the material for the 3D-printed WPC alternative are competitive when
compared with those of the material for the conventional product (see Table 10).
However, there is no guarantee that mechanical properties of the actual product are
suitable for the usage because those of the 3D-printed products are highly dependent
on the infill percentage. That is, there is a possibility that 50% infill will not offer
enough mechanical properties that are needed for the usage. Therefore, it was
expected to be meaningful to set up a hypothetical scenario where the manufacturer
prints the WPC product with a higher infill percentage than 50% and observe the
results. For a dramatic comparison, it was assumed that the hypothetical product is
manufactured with 100% infill. The results of the cradle-to-grave comparative LCA
between injection-moulded tunnel storage and the 3D-printed WPC alternative with
100% infill are shown in Figure 15. It must be noted that the weight of the alternative
increased to 2.70 kg.
0
10
20
30
40
50
60
70
80
90
100
GW OD FP AD EP HT FD TEC FEC MEC
IM Tunnel Storage 3D Tunnel Storage
28
Table 10 Mechanical properties of the materials used in the case study B
Mechanical properties
PUR (40% BaSO4) WPC (40% PP, 10% APP)
Tensile strength 42.6 MPa 28.22 MPa
Young’s modulus 0.95 GPa 4.31 GPa
Elongation 11.58% strain 1.92% strain
Figure 15 Characterization results of case study B (100% infill)
Due to PUR and the long transportation between Italy and Sweden, the results
were still favourable to the 3D-printed WPC alternative even with 100% infill. The
environmental impacts caused by the alternative are about 65% of those caused by
the conventional product. This shows how important it is to shorten transportation
distance between the supplier, manufacturer, and consumer.
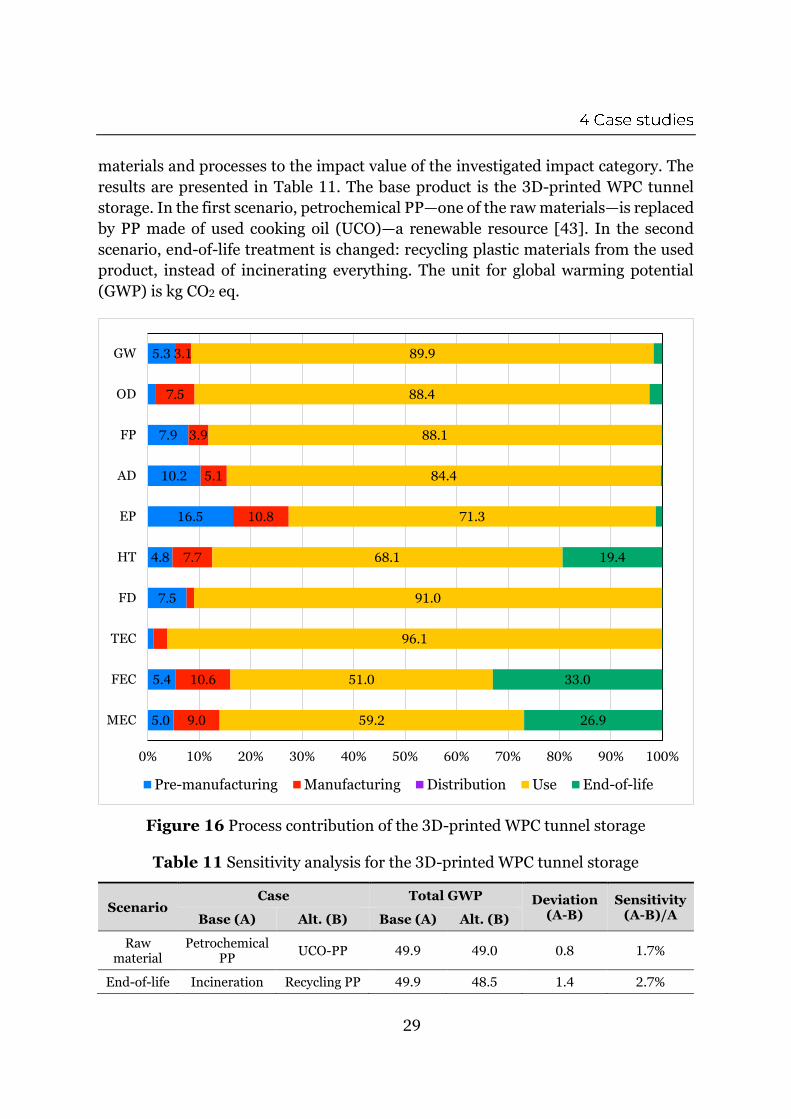
For the 3D-printed WPC tunnel storage, process contribution—a percentage of the
contribution made by the impact values of each phase on those of whole life cycle in
the given impact categories—was investigated. The results are shown in Figure 16.
The use phase is dominant as observed in 4.2.3.1. There is no contribution made by
the impact of the distribution phase because distribution to individual consumers is
excluded.
Sensitivity analysis was performed to determine the sensitivity of certain
0
10
20
30
40
50
60
70
80
90
100
GW OD FP AD EP HT FD TEC FEC MEC
IM Tunnel Storage 3D Tunnel Storage
29
materials and processes to the impact value of the investigated impact category. The
results are presented in Table 11. The base product is the 3D-printed WPC tunnel
storage. In the first scenario, petrochemical PP—one of the raw materials—is replaced
by PP made of used cooking oil (UCO)—a renewable resource [43]. In the second
scenario, end-of-life treatment is changed: recycling plastic materials from the used
product, instead of incinerating everything. The unit for global warming potential
(GWP) is kg CO2 eq.
Figure 16 Process contribution of the 3D-printed WPC tunnel storage
Table 11 Sensitivity analysis for the 3D-printed WPC tunnel storage
Scenario Case Total GWP Deviation
(A-B) Sensitivity
(A-B)/A Base (A) Alt. (B) Base (A) Alt. (B)
Raw material
Petrochemical PP
UCO-PP 49.9 49.0 0.8 1.7%
End-of-life Incineration Recycling PP 49.9 48.5 1.4 2.7%
5.0
5.4
7.5
4.8
16.5
10.2
7.9
5.3
9.0
10.6
7.7
10.8
5.1
3.9
7.5
3.1
59.2
51.0
96.1
91.0
68.1
71.3
84.4
88.1
88.4
89.9
26.9
33.0
19.4
0% 10% 20% 30% 40% 50% 60% 70% 80% 90% 100%
MEC
FEC
TEC
FD
HT
EP
AD
FP
OD
GW
Pre-manufacturing Manufacturing Distribution Use End-of-life

30
The main goal of this case study is to perform a comparative LCA between two ceiling
boards from Veidekke. One is the conventional gypsum plasterboard, and the other is
the 3D-printed alternative made of wood fibre and polypropylene (PP) with a small
addition of a flame retardant (see Figure 17). The objective is to determine, with a
quantitative analysis, if the use of the 3D-printed WPC product may suggest a
sustainable alternative to the conventional gypsum plasterboard.
Figure 17 3D modeling of the compared products in the case study C
The functional unit for the ceiling boards is simply a single unit product with a
volume of 13.5 L (12.5 mm × 900 mm × 1200 mm), each having a different material
composition. The difference in mass between them was considered irrelevant because
both the products achieve the same task. Since it was intended is to compare the
products based on the functional unit, the production volume was excluded from
consideration.
The system boundary for the LCAs of this study is cradle-to-grave: pre-
manufacturing, manufacturing, distribution, use and end-of-life phases. The process
trees for the gypsum plasterboard and the 3D-printed WPC alternative are presented
in Figure 18 and Figure 19, respectively. The system boundary and the assumptions
and limitations used in data collection are presented in Table 12.
The geography for the manufacturing, distribution, use and end-of-life phases
was set to Sweden, and the time horizon 2020. Ecoinvent 3 was used for the LCI

31
database [32]. Allocation at the point of substitution—which is also called Ecoinvent
default—was chosen as the allocation method [33]. The chosen LCIA method is
ReCiPe 2016 Midpoint (Hierarchist) which is considered to be the default model [34].
The impact categories included in the LCAs are: global warming, stratospheric ozone
depletion, fine particulate matter formation, terrestrial acidification, freshwater
eutrophication, human toxicity, fossil depletion and three types of ecotoxicity—
terrestrial ecotoxicity, freshwater ecotoxicity and marine ecotoxicity.
Figure 18 Process tree of the gypsum plasterboard
Figure 19 Process tree of the 3D-printed WPC ceiling board
32
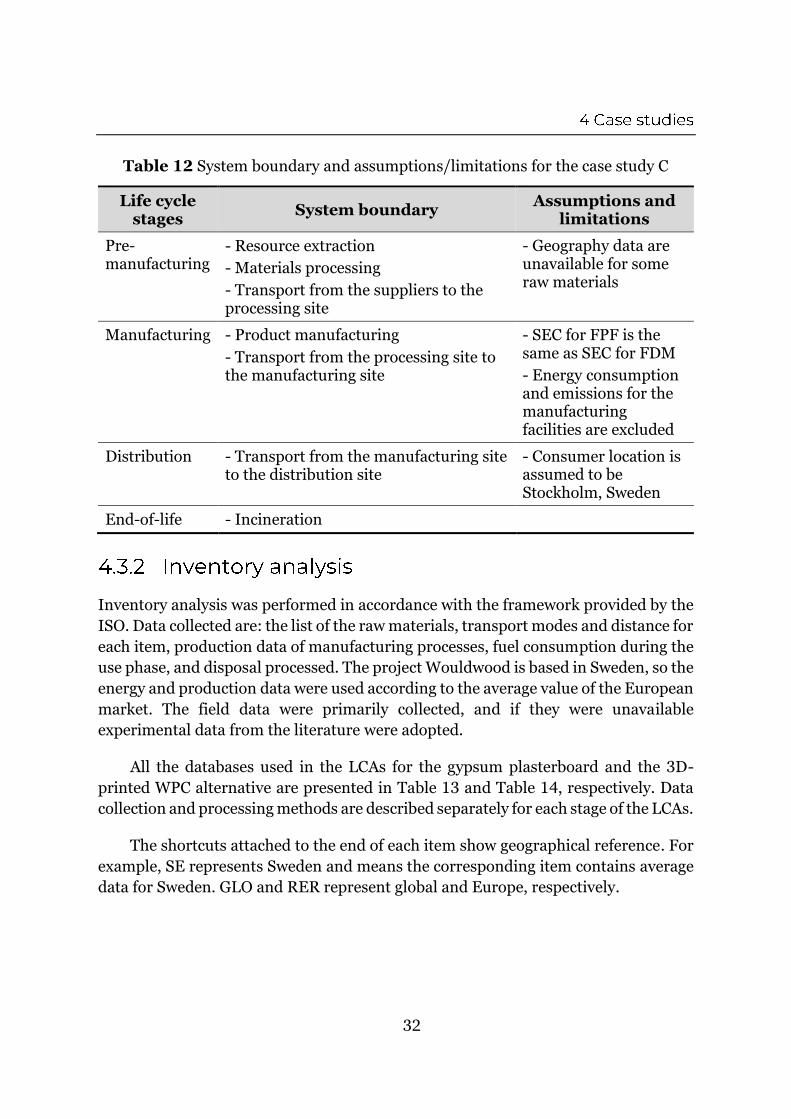
Table 12 System boundary and assumptions/limitations for the case study C
Life cycle stages
System boundary Assumptions and
limitations
Pre-manufacturing
- Resource extraction
- Materials processing
- Transport from the suppliers to the processing site
- Geography data are unavailable for some raw materials
Manufacturing - Product manufacturing
- Transport from the processing site to the manufacturing site
- SEC for FPF is the same as SEC for FDM
- Energy consumption and emissions for the manufacturing facilities are excluded
Distribution - Transport from the manufacturing site to the distribution site
- Consumer location is assumed to be Stockholm, Sweden
End-of-life - Incineration
Inventory analysis was performed in accordance with the framework provided by the
ISO. Data collected are: the list of the raw materials, transport modes and distance for
each item, production data of manufacturing processes, fuel consumption during the
use phase, and disposal processed. The project Wouldwood is based in Sweden, so the
energy and production data were used according to the average value of the European
market. The field data were primarily collected, and if they were unavailable
experimental data from the literature were adopted.
All the databases used in the LCAs for the gypsum plasterboard and the 3D-
printed WPC alternative are presented in Table 13 and Table 14, respectively. Data
collection and processing methods are described separately for each stage of the LCAs.
The shortcuts attached to the end of each item show geographical reference. For
example, SE represents Sweden and means the corresponding item contains average
data for Sweden. GLO and RER represent global and Europe, respectively.

33
Table 13 Life cycle inventory database used for the gypsum plasterboard
Life cycle stages
Items LCI DB (Ecoinvent 3)
Pre-
manufacturing
Gypsum plasterboard Gypsum plasterboard, GLO
Road Transport, lorry, EURO5, GLO
Manufacturing Paint, SE Alkyd paint, GLO
Road Transport, lorry, EURO5, RER
Distribution Road Transport, lorry, EURO5, RER
End-of-life Incineration, SE Incineration of MSW, SE
Road Transport, lorry, EURO6, RER
Table 14 Life cycle inventory database used for the 3D-printed ceiling board
Life cycle stages
Items LCI DB (Ecoinvent 3)
Pre-
manufacturing
Polypropylene, SE Polypropylene, granulate, RER
Woold wool, SE Wood wool, RER
Flame retardant, SE Sodium tripolyphosphate, GLO
Compounding, SE Electricity, medium voltage, SE
Water, lake, SE
Road Transport, lorry, EURO5, RER
Water Transport, sea, natural gas, GLO
Manufacturing Fused particle fabrication, SE Electricity, low voltage, SE
Transport, lorry, EURO5, RER
Distribution Road Transport, lorry, EURO5, RER
End-of-life Incineration, SE Incineration of MSW, SE
Road Transport, lorry, EURO6, RER
The pre-manufacture phase includes extraction, acquisition, processing, and
transportation of raw materials. Masses of the raw materials were calculated based on
the volume and material composition of the products. Raw material productivity—the
ratio of production quantity against the amount of raw material used—is assumed to
be 100% for the sake of simplicity. When the transportation data for the raw materials
were not available, average transportation modes and distance in the European

34
market were adopted.
Since gypsum plasterboard exists in the LCI DB as a complete product, pre-
manufacturing data for gypsum plasterboard were not manually entered.
Pellets for the WPC ceiling board are made of wood fibre, PP, and a small addition of
a flame retardant. Therefore, the pre-manufacturing process begins with the
extraction and acquisition of them. According to the material data obtained from the
manufacturer, the flame retardant was supposed to be ammonium polyphosphate
(APP), however, sodium tripolyphosphate (STPP)—which is also used as a flame
retardant—was chosen as the flame retardant in the simulation because APP was not
available in the LCI DB [38]. It is assumed that the flame retardant is prepared as
powder form. The process ends with the compounding of wood fibre, PP, and the
flame retardant, obtaining flame retarded wood-plastic pellets (40% PP, 10% STPP).
The manufacturing phase normally includes inspection as well as manufacturing
process. However, since it is assumed that there is no failure in manufacturing, only
the manufacturing process was considered in the simulation. Energy consumption
and emissions for the manufacturing facilities were excluded.
Since gypsum plasterboard exists in the LCI DB as a complete product, manufacturing
data for gypsum plasterboard were not manually entered. The weight of the
manufactured item is 15.53 kg.
The WPC ceiling board is manufactured through AM at Södertälje, Sweden. It is
assumed that there is no failure in manufacturing, so material loss is only contributed
by the support material, which is a technically inevitable waste. The production yield
for AM is assumed to be 84.4% [41]. Since there has not been any research on energy
consumption and emissions data for FPF, data for FDM from the literature were
adopted [41, 42]. FPF does not involve filament manufacturing process, so one of the
lowest energy consumption data for FDM was chosen. The infill percentage was set to
30%. It must be noted that the weight of the manufactured item is 4.17 kg, which is
much lighter than the conventional gypsum plasterboard.

35
Distribution phase for the ceiling boards include installing, which is human labour,
and it was assumed that human labour creates no impact on the environment, thus
excluded in the simulation. Consumer location for distribution was assumed to be
Stockholm, Sweden.
The gypsum plasterboard is transported from the manufacturing facility in Södertälje,
Sweden to the construction site in Stockholm, Sweden by using roads. It is then
painted by human. Since it is also human labour, only the amount of paint was
considered in the simulation. The weight of the paint required is 0.072 kg for each
gypsum plasterboard. It was calculated considering the theoretical spreading rate of
a commercial paint and the area of surface of the gypsum plasterboard.
The WPC ceiling board is transported from the manufacturing facility in Södertälje,
Sweden to the construction site in Stockholm, Sweden by using roads. Painting is not
necessary for the 3D-printed WPC alternative.
Ceiling boards are stationary once installed and there is neither energy consumed nor
emissions released while in use, therefore there was no data input for the use phase.
It was assumed that the discarded ceiling boards are classified as municipal solid
waste and incinerated in Södertälje, Sweden.
The classification and characterization process were carried out in accordance with
the ISO 14040s standard. For the impact assessment, ReCiPe Midpoint (Hierachist)
was applied to calculate the environmental impacts, and the following 10 impact
categories were included in the LCA: global warming (GW), stratospheric ozone
depletion (OD), fine particulate matter formation (FP), terrestrial acidification (AD),
freshwater eutrophication (EP), human toxicity (HT), fossil depletion (FD) and three
types of ecotoxicity—terrestrial ecotoxicity (TEC), freshwater ecotoxicity (FEC) and
marine ecotoxicity (MEC).
36
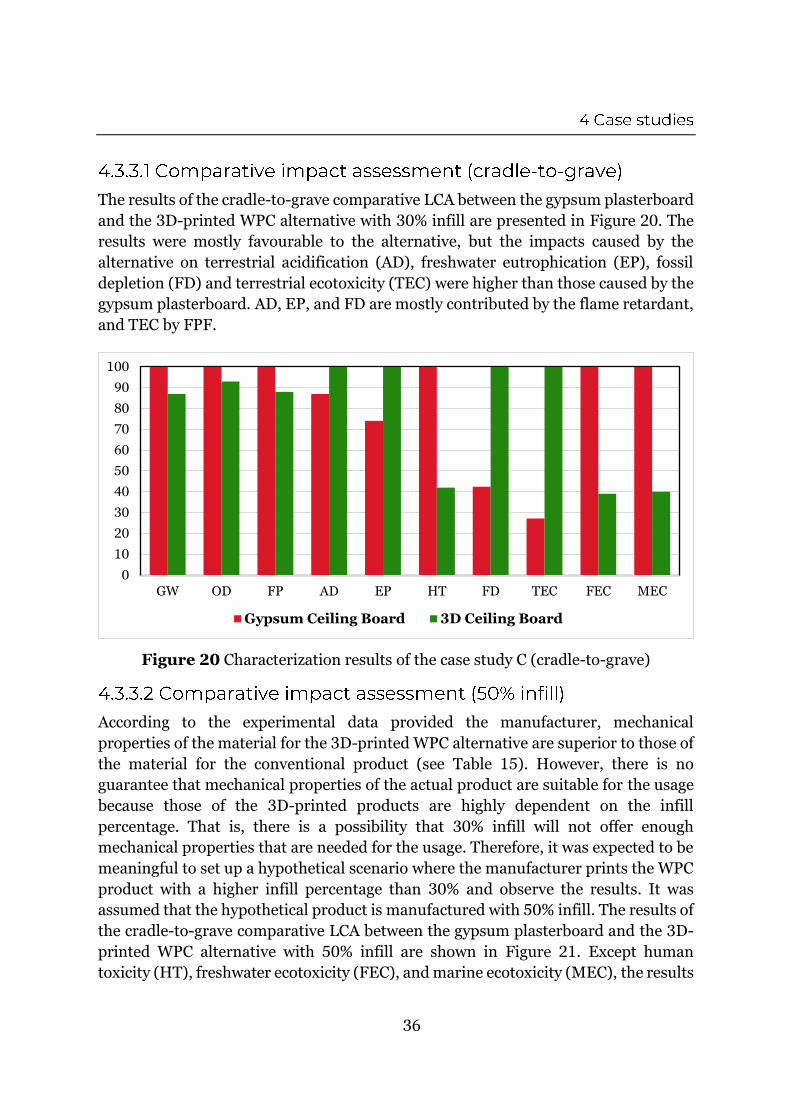
The results of the cradle-to-grave comparative LCA between the gypsum plasterboard
and the 3D-printed WPC alternative with 30% infill are presented in Figure 20. The
results were mostly favourable to the alternative, but the impacts caused by the
alternative on terrestrial acidification (AD), freshwater eutrophication (EP), fossil
depletion (FD) and terrestrial ecotoxicity (TEC) were higher than those caused by the
gypsum plasterboard. AD, EP, and FD are mostly contributed by the flame retardant,
and TEC by FPF.
Figure 20 Characterization results of the case study C (cradle-to-grave)
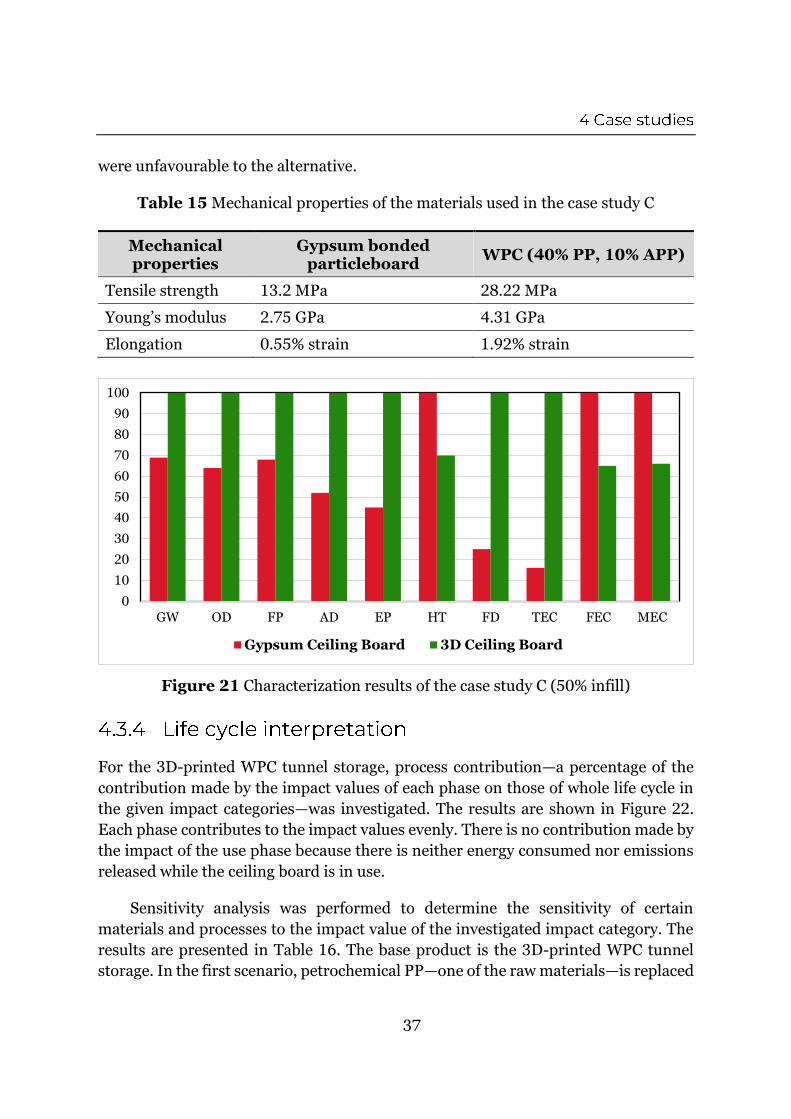
According to the experimental data provided the manufacturer, mechanical
properties of the material for the 3D-printed WPC alternative are superior to those of
the material for the conventional product (see Table 15). However, there is no
guarantee that mechanical properties of the actual product are suitable for the usage
because those of the 3D-printed products are highly dependent on the infill
percentage. That is, there is a possibility that 30% infill will not offer enough
mechanical properties that are needed for the usage. Therefore, it was expected to be
meaningful to set up a hypothetical scenario where the manufacturer prints the WPC
product with a higher infill percentage than 30% and observe the results. It was
assumed that the hypothetical product is manufactured with 50% infill. The results of
the cradle-to-grave comparative LCA between the gypsum plasterboard and the 3D-
printed WPC alternative with 50% infill are shown in Figure 21. Except human
toxicity (HT), freshwater ecotoxicity (FEC), and marine ecotoxicity (MEC), the results
0
10
20
30
40
50
60
70
80
90
100
GW OD FP AD EP HT FD TEC FEC MEC
Gypsum Ceiling Board 3D Ceiling Board
37
were unfavourable to the alternative.
Table 15 Mechanical properties of the materials used in the case study C
Mechanical properties
Gypsum bonded particleboard
WPC (40% PP, 10% APP)
Tensile strength 13.2 MPa 28.22 MPa
Young’s modulus 2.75 GPa 4.31 GPa
Elongation 0.55% strain 1.92% strain
Figure 21 Characterization results of the case study C (50% infill)
For the 3D-printed WPC tunnel storage, process contribution—a percentage of the
contribution made by the impact values of each phase on those of whole life cycle in
the given impact categories—was investigated. The results are shown in Figure 22.
Each phase contributes to the impact values evenly. There is no contribution made by
the impact of the use phase because there is neither energy consumed nor emissions
released while the ceiling board is in use.
Sensitivity analysis was performed to determine the sensitivity of certain
materials and processes to the impact value of the investigated impact category. The
results are presented in Table 16. The base product is the 3D-printed WPC tunnel
storage. In the first scenario, petrochemical PP—one of the raw materials—is replaced
0
10
20
30
40
50
60
70
80
90
100
GW OD FP AD EP HT FD TEC FEC MEC
Gypsum Ceiling Board 3D Ceiling Board

38
by PP made of used cooking oil (UCO)—a renewable resource [42]. In the second
scenario, end-of-life treatment is changed: recycling plastic materials from the used
product, instead of incinerating everything. The unit for global warming potential
(GWP) is kg CO2 eq.
Figure 22 Process contribution of the 3D-printed WPC ceiling board
Table 16 Sensitivity analysis for 3D-printed WPC ceiling board
Scenario Case Total GWP Deviation
(A-B) Sensitivity
(A-B)/A Base (A) Alt. (B) Base (A) Alt. (B)
Raw material
Petrochemical PP
UCO-PP 15.0 12.5 2.5 16.5%
End-of-life Incineration Recycling PP 15.0 10.9 4.1 27.3%
12.2
11.1
27.4
83.2
15.0
57.7
65.5
66.0
13.7
52.4
22.0
21.7
70.2
15.8
24.2
37.8
32.7
32.7
64.7
30.9
65.8
67.2
60.8
4.5
21.5
16.6
0% 10% 20% 30% 40% 50% 60% 70% 80% 90% 100%
MEC
FEC
TEC
FD
HT
EP
AD
FP
OD
GW
Pre-manufacturing Manufacturing Distribution Use End-of-life

39
The results of the cradle-to-grave LCAs showed that, in all case studies, the 3D-
printed WPC alternatives would have smaller environmental impacts compared with
the conventional products regarding most impact categories although the extent to
which environmental impacts can be reduced by replacing the conventional products
with the alternatives varied from case study to case study. The most significant
difference was observed in the case study A and B because of the light-weighting effect.
In terms of global warming potential (GWP), the alternative in the case study A scored
51% lower impact than the conventional storage box, the alternative in the case study
B had 68% lower impact than the conventional tunnel storage, and the 3D-printed
WPC ceiling board in the case study C had 13% lower GWP than the conventional
gypsum plasterboard. However, the results of the cradle-to-gate LCAs suggested that
the 3D-printed WPC alternative might cause greater environmental impacts than the
conventional products regarding some impact categories because where the light-
weighting effect is insignificant.
Therefore, in the LCA context, the 3D-printed WPC alternatives would be much
more beneficial to the environment compared with the conventional products, but the
environmental benefits might be insignificant from the manufacturer’s perspective.

40
Since energy consumption data for FPF were not available due to lack of research,
specific energy consumption (SEC) for FDM was used throughout the case studies
instead of that for FPF. This was considered reasonable because both manufacturing
methods are fundamentally the same. However, more accurate results could have
been obtained if energy consumption data for FPF were available. Therefore, it is
recommended to investigate SEC for FPF.
Another recommendation for future work is to investigate the proper infill
percentage for each product. The experimental data provided by the manufacturer
only showed the mechanical properties of the material—there was no test with a
complete product or prototype. It would have been possible to set more realistic infill
percentage if there were mechanical testing with the actual products.
Additionally, life cycle cost analysis (LCCA) would help making decisions. It is
true that the WPC 3D-printed products are more beneficial for the environment
compared with the conventional products. However, the case studies did not consider
the resources required to replace conventional manufacturing systems with 3D-
printing manufacturing system, which would incur a significant cost. Thus, a broad-
scale LCCA might suggest a different perspective.

41
First and foremost, I would like to express my gratitude towards my supervisor
Anna Hedlund Åström from the department of Machine Design at KTH for giving me
the opportunity to do my thesis within the project Wouldwood. I would like to thank
Anna and her colleagues—Björn Möller, Lars Hässler and Anton Boström for helping
me with both technical and non-technical issues on this project. I would also like to
thank Matthew Smyth from Stora Enso for providing crucial data, Oliver Schmidt
from Scania for providing constructive feedback, and Sushanth Kombathula and my
examiner Anders Eliasson from the department of Materials Science and Engineering
at KTH for giving me advice regarding my thesis work. Special thanks to Selena Torres
and BTS for encouraging me and keeping me motivated. Lastly, I would like to thank
my family and friends for their endless support.

42
[1] United Nations Department of Economic and Social Affairs, “The Sustainable Development Goals Report 2016,” New York, 2016. doi: 10.18356/3405d09f-en.
[2] United Nations Framework Convention on Climate Change, “Paris Agreement,” New York, 2015. [Online]. Available: https://digitallibrary.un.org/record/827098.
[3] Swedish Environmental Protection Agency, “Sweden’s Seventh National Communication on Climate Change,” Bromma, 2018. [Online]. Available: http://www.naturvardsverket.se/Om-Naturvardsverket/Publikationer/ISBN/6800/978-91-620-6807-3/.
[4] B. Morgan, “101 Companies Committed To Reducing Their Carbon Footprint,” Forbes, 2019. https://www.forbes.com/sites/blakemorgan/2019/08/26/101-companies-committed-to-reducing-their-carbon-footprint/#5b530ae0260b (accessed Jul. 26, 2020).
[5] J. Gardan, “Additive manufacturing technologies: state of the art and trends,” International Journal of Production Research, vol. 54, no. 10, pp. 3118–3132, May 2016, doi: 10.1080/00207543.2015.1115909.
[6] M. Attaran, “The rise of 3-D printing: The advantages of additive manufacturing over traditional manufacturing,” Business Horizons, vol. 60, no. 5, pp. 677–688, Sep. 2017, doi: 10.1016/j.bushor.2017.05.011.
[7] S. H. Huang, P. Liu, A. Mokasdar, and L. Hou, “Additive manufacturing and its societal impact: a literature review,” The International Journal of Advanced Manufacturing Technology, vol. 67, no. 5, pp. 1191–1203, 2013, doi: 10.1007/s00170-012-4558-5.
[8] C. W. J. Lim, K. Q. Le, Q. Lu, and C. H. Wong, “An Overview of 3-D Printing in Manufacturing, Aerospace, and Automotive Industries,” IEEE Potentials, vol.

43
35, no. 4, pp. 18–22, 2016, doi: 10.1109/MPOT.2016.2540098.
[9] D. Delgado Camacho et al., “Applications of additive manufacturing in the construction industry – A forward-looking review,” Automation in Construction, vol. 89, pp. 110–119, 2018, doi: https://doi.org/10.1016/j.autcon.2017.12.031.
[10] I. V. Muralikrishna and V. Manickam, “Chapter Five - Life Cycle Assessment,” Environmental Management, pp. 57–75, 2017, doi: 10.1016/B978-0-12-811989-1.00005-1.
[11] RISE Research Institutes of Sweden, “Wouldwood,” 2020. https://www.wouldwood.se/ (accessed Jul. 26, 2020).
[12] Scania, “Scania,” 2020. https://www.scania.com/ (accessed Jul. 26, 2020).
[13] Veidekke, “Veidekke i Sverige - bostad, bygg, anläggning och bostadsutveckling,” 2020. http://veidekke.se/ (accessed Jul. 26, 2020).
[14] A. L. Woern, D. J. Byard, R. B. Oakley, M. J. Fiedler, S. L. Snabes, and J. M. Pearce, “Fused Particle Fabrication 3-D Printing: Recycled Materials’ Optimization and Mechanical Properties,” Materials (Basel, Switzerland), vol. 11, no. 8, p. 1413, Aug. 2018, doi: 10.3390/ma11081413.
[15] Stora Enso, “Stora Enso,” 2020. https://www.storaenso.com/ (accessed Jul. 26, 2020).
[16] K. J. Fridley, “Wood and Wood-Based Materials: Current Status and Future of a Structural Material,” Journal of Materials in Civil Engineering, vol. 14, no. 2, pp. 91–96, Apr. 2002, doi: 10.1061/(ASCE)0899-1561(2002)14:2(91).
[17] A. Ashori, “Wood–plastic composites as promising green-composites for automotive industries!,” Bioresource Technology, vol. 99, no. 11, pp. 4661–4667, 2008, doi: https://doi.org/10.1016/j.biortech.2007.09.043.
[18] G. Martins, F. Antunes, A. Mateus, and C. Malça, “Optimization of a Wood Plastic Composite for Architectural Applications,” Procedia Manufacturing, vol. 12, pp. 203–220, 2017, doi: https://doi.org/10.1016/j.promfg.2017.08.025.
[19] A. Partanen and M. Carus, “Wood and natural fiber composites current trend in consumer goods and automotive parts,” Reinforced Plastics, vol. 60, no. 3, pp. 170–173, 2016, doi: https://doi.org/10.1016/j.repl.2016.01.004.
[20] J. Markarian, “Wood-plastic composites: current trends in materials and processing,” Plastics, Additives and Compounding, vol. 7, no. 5, pp. 20–26, 2005, doi: https://doi.org/10.1016/S1464-391X(05)70453-0.

44
[21] T. Pereira, J. V Kennedy, and J. Potgieter, “A comparison of traditional manufacturing vs additive manufacturing, the best method for the job,” Procedia Manufacturing, vol. 30, pp. 11–18, 2019, doi: https://doi.org/10.1016/j.promfg.2019.02.003.
[22] J. Flynt, “The Pros and Cons of Every 3D Printing Filament Material,” 3D Insider, 2020. https://3dinsider.com/pros-and-cons-3d-printing-filaments/ (accessed Jul. 26, 2020).
[23] R. Baguley, “3D Printing Materials: The Pros and Cons of Each Type,” Tom’s Guide, 2017. https://www.tomsguide.com/us/3d-printing-materials,news-24392.html (accessed Jul. 26, 2020).
[24] Y. Tao, H. Wang, Z. Li, P. Li, and S. Q. Shi, “Development and Application of Wood Flour-Filled Polylactic Acid Composite Filament for 3D Printing,” Materials , vol. 10, no. 4. 2017, doi: 10.3390/ma10040339.
[25] M. Kariz, M. Sernek, M. Obućina, and M. K. Kuzman, “Effect of wood content in FDM filament on properties of 3D printed parts,” Materials Today Communications, vol. 14, pp. 135–140, 2018, doi: https://doi.org/10.1016/j.mtcomm.2017.12.016.
[26] L. Liu, M. Lin, Z. Xu, and M. Lin, “Polylactic Acid-based Wood-plastic 3D Printing Composite and its Properties,” Bioresources, vol. 14, pp. 8484–8498, 2019.
[27] J. I. Montalvo Navarrete, M. A. Hidalgo-Salazar, E. Escobar Nunez, and A. J. Rojas Arciniegas, “Thermal and mechanical behavior of biocomposites using additive manufacturing,” International Journal on Interactive Design and Manufacturing (IJIDeM), vol. 12, no. 2, pp. 449–458, 2018, doi: 10.1007/s12008-017-0411-2.
[28] O. Martikka, T. Kärki, and Q. L. Wu, “Mechanical Properties of 3D-Printed Wood-Plastic Composites,” Key Engineering Materials, vol. 777, pp. 499–507, 2018, doi: 10.4028/www.scientific.net/KEM.777.499.
[29] K. L. Alvarez C, R. F. Lagos C, and M. Aizpun, “Investigating the influence of infill percentage on the mechanical properties of fused deposition modelled ABS parts ,” Ingeniería e Investigación , vol. 36. scieloco , pp. 110–116, 2016.
[30] Environmental management — Life cycle assessment — Requirements and guidelines. ISO 14044:2006, 2006.
[31] PRé Sustainability, “SimaPro software.” Amersfoort, 2019.
[32] G. Wernet, C. Bauer, B. Steubing, J. Reinhard, E. Moreno-Ruiz, and B. Weidema, “The ecoinvent database version 3 (part I): overview and

45
methodology,” The International Journal of Life Cycle Assessment, vol. 21, no. 9, pp. 1218–1230, 2016, doi: 10.1007/s11367-016-1087-8.
[33] T. Ponsioen, “Finding Your Way In Multifunctional Processes And Recycling - PRé Sustainability,” PRé Sustainability, 2015. https://pre-sustainability.com/articles/finding-your-way-in-allocation-methods-multifunctional-processes-recycling/ (accessed Jul. 26, 2020).
[34] L. Golsteijn, “ReCiPe - PRé Sustainability,” PRé Sustainability, 2012. https://pre-sustainability.com/articles/recipe/ (accessed Jul. 26, 2020).
[35] Trafikanalys, “Körsträckor 2019,” 2020. [Online]. Available: https://www.trafa.se/globalassets/statistik/vagtrafik/korstrackor/2020/korstrackor_2019.pdf?
[36] European Automobile Manufacturers Association, “Vehicles in use – Europe 2018,” Brussels, 2018. [Online]. Available: https://www.acea.be/statistics/article/report-vehicles-in-use-europe-2018.
[37] J. Jeswiet and A. Szekeres, “Energy Consumption in Mining Comminution,” Procedia CIRP, vol. 48, pp. 140–145, 2016, doi: https://doi.org/10.1016/j.procir.2016.03.250.
[38] National Center for Biotechnology Information, “Sodium tripolyphosphate, CID=24455,” PubChem Database, 2020. https://pubchem.ncbi.nlm.nih.gov/compound/Sodium-tripolyphosphate (accessed May 20, 2020).
[39] C. Telenko and C. C. Seepersad, “A comparison of the energy efficiency of selective laser sintering and injection molding of nylon parts,” Rapid Prototyping Journal, vol. 18, no. 6, pp. 472–481, Jan. 2012, doi: 10.1108/13552541211272018.
[40] W. Michaeli, “10.2 Recycling of Production Waste,” in Training in injection molding : a text- and workbook, 2nd ed., Munich: Hanser Publishers, 1995, p. 115.
[41] R. Song and C. Telenko, “Material and energy loss due to human and machine error in commercial FDM printers,” Journal of Cleaner Production, vol. 148, pp. 895–904, Apr. 2017, doi: 10.1016/j.jclepro.2017.01.171.
[42] Z. Liu et al., “Investigation of Energy Requirements and Environmental Performance for Additive Manufacturing Processes,” Sustainability, vol. 10, no. 10, p. 3606, Oct. 2018, doi: 10.3390/su10103606.
[43] C. Moretti, M. Junginger, and L. Shen, “Environmental life cycle assessment of polypropylene made from used cooking oil,” Resources, Conservation and
46
Recycling, vol. 157, p. 104750, Jun. 2020, doi: 10.1016/j.resconrec.2020.104750.

47
1. Conventional storage box (case study A)
a) Manual data input of [Grinding, SE]
Input Amount Unit Notes/Sources
Unprocessed mineral 1 kg Dummy data
Electricity, medium voltage, SE 0.02412 MJ [37]
Output Amount Unit Notes/Sources
Ground mineral 1 kg Dummy data
b) Production of 1 kg [Ground kaolin, GLO]
Input Amount Unit Notes/Sources
Kaolin, GLO 1 kg [32]
Grinding, SE 1 kg See section 1. a)
Output Amount Unit Notes/Sources
Ground kaolin, GLO 1 kg
c) Manual data input of [Compounding, SE]
Input Amount Unit Notes/Sources
Unprocessed material 1 kg Dummy data
Electricity, medium voltage, SE 1 MJ Data received from Stora Enso
Water, lake, SE 10 kg Data received from Stora Enso
Output Amount Unit Notes/Sources
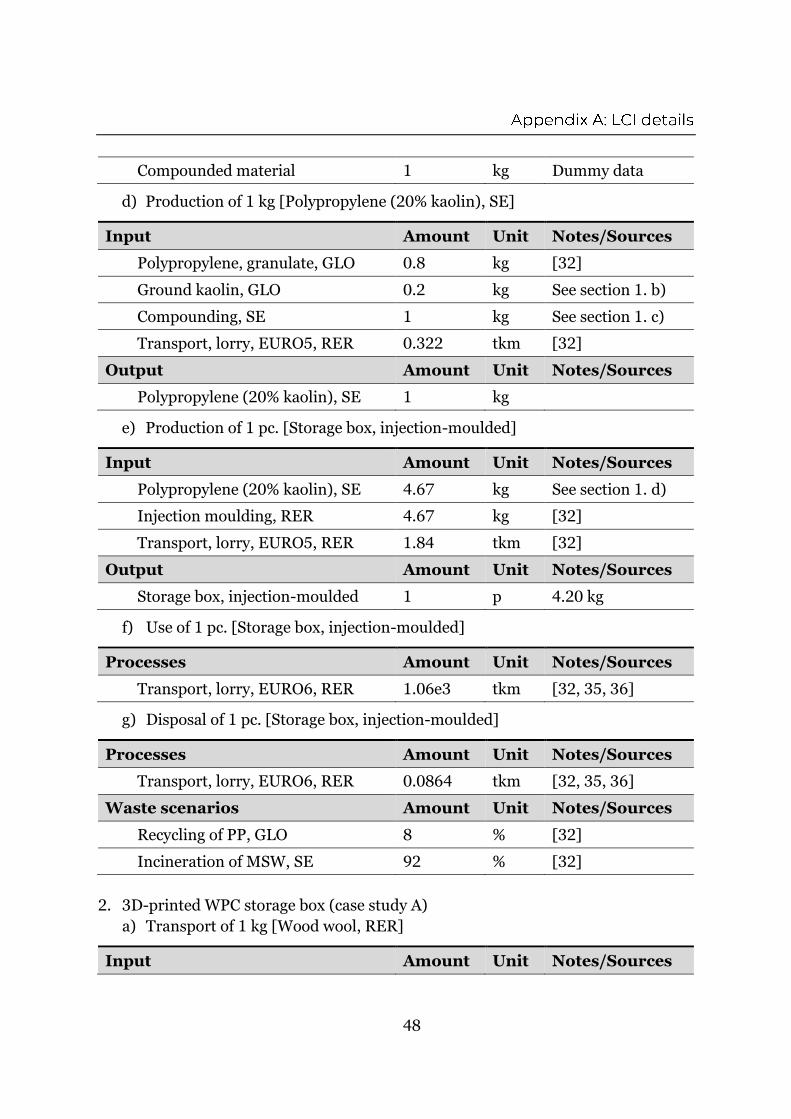
48
Compounded material 1 kg Dummy data
d) Production of 1 kg [Polypropylene (20% kaolin), SE]
Input Amount Unit Notes/Sources
Polypropylene, granulate, GLO 0.8 kg [32]
Ground kaolin, GLO 0.2 kg See section 1. b)
Compounding, SE 1 kg See section 1. c)
Transport, lorry, EURO5, RER 0.322 tkm [32]
Output Amount Unit Notes/Sources
Polypropylene (20% kaolin), SE 1 kg
e) Production of 1 pc. [Storage box, injection-moulded]
Input Amount Unit Notes/Sources
Polypropylene (20% kaolin), SE 4.67 kg See section 1. d)
Injection moulding, RER 4.67 kg [32]
Transport, lorry, EURO5, RER 1.84 tkm [32]
Output Amount Unit Notes/Sources
Storage box, injection-moulded 1 p 4.20 kg
f) Use of 1 pc. [Storage box, injection-moulded]
Processes Amount Unit Notes/Sources
Transport, lorry, EURO6, RER 1.06e3 tkm [32, 35, 36]
g) Disposal of 1 pc. [Storage box, injection-moulded]
Processes Amount Unit Notes/Sources
Transport, lorry, EURO6, RER 0.0864 tkm [32, 35, 36]
Waste scenarios Amount Unit Notes/Sources
Recycling of PP, GLO 8 % [32]
Incineration of MSW, SE 92 % [32]
2. 3D-printed WPC storage box (case study A)
a) Transport of 1 kg [Wood wool, RER]
Input Amount Unit Notes/Sources

49
Wood wool, RER 1 kg Production data, [32]
Transport, lorry, EURO5, RER 0.06 tkm [32]
Output Amount Unit Notes/Sources
Wood wool, RER 1 kg Market data
b) Transport of 1 kg [Polypropylene, granulate, RER]
Input Amount Unit Notes/Sources
Polypropylene, granulate, RER 1 kg Production data, [32]
Transport, lorry, EURO5, RER 0.7 tkm [32]
Transport, sea, natural gas, GLO 0.206 tkm [32]
Output Amount Unit Notes/Sources
Polypropylene, granulate, RER 1 kg Market data
c) Production of 1 kg [Wood-plastic pellet, flame-retarded, SE]
Input Amount Unit Notes/Sources
Wood wool, RER 0.5 kg See section 2. a)
Polypropylene, granulate, RER 0.4 kg See section 2. b)
Sodium tripolyphosphate, GLO 0.1 kg [32]
Compounding, SE 1 kg See section 1. c)
Transport, lorry, EURO5, RER 0.406 tkm [32]
Output Amount Unit Notes/Sources
Wood-plastic pellet,
flame-retarded, SE
1 kg
d) Manual data input of [Fused particle fabrication, SE]
Input Amount Unit Notes/Sources
Unprocessed material 1 kg Dummy data
Electricity, low voltage, SE 39.4 kg [41]
Output Amount Unit Notes/Sources
3D-printed product 1 p Dummy data
Carbon dioxide 0.2829 kg [42]

50
Methane 5.8502E-4 kg [42]
Dinitrogen monoxide 3.8662E-6 kg [42]
e) Production of 1 pc. [Storage box, 3D-printed]
Input Amount Unit Notes/Sources
Wood-plastic pellet,
flame-retarded, SE
2.46 kg See section 2. c)
Fused particle fabrication, SE 2.46 kg See section 2. d)
Output Amount Unit Notes/Sources
Storage box, 3D-printed 1 p 2.07 kg
f) Use of 1 pc. [Storage box, 3D-printed]
Processes Amount Unit Notes/Sources
Transport, lorry, EURO6, RER 521 tkm [32, 35, 36]
g) Disposal of 1 pc. [Storage box, 3D-printed]
Processes Amount Unit Notes/Sources
Transport, lorry, EURO6, RER 0.0455 tkm [32, 35, 36]
Waste scenarios Amount Unit Notes/Sources
Incineration of MSW, SE 100 % [32]
3. Conventional tunnel storage (case study B)
a) Production of 1 kg [Polyurethane (40% barite), SE]
Input Amount Unit Notes/Sources
Polyurethane, rigid foam, GLO 0.6 kg [32]
Barite, GLO 0.4 kg [32]
Compounding, SE 1 kg See section 1. c)
Transport, lorry, EURO5, RER 0.322 tkm [32]
Output Amount Unit Notes/Sources
Polyurethane (40% barite), SE 1 kg
b) Production of 1 pc. [Tunnel storage, injection-moulded]
Input Amount Unit Notes/Sources

51
Polyurethane (40% barite), SE 4.55 kg See section 3. a)
Injection moulding, RER 4.55 kg [32]
Transport, lorry, EURO5, RER 8.25 tkm [32]
Transport, sea, natural gas, GLO 0.0767 tkm [32]
Output Amount Unit Notes/Sources
Tunnel storage, injection-moulded 1 p 4.10 kg
c) Use of 1 pc. [Tunnel storage, injection-moulded]
Processes Amount Unit Notes/Sources
Transport, lorry, EURO6, RER 1.03e3 tkm [32, 35, 36]
d) Disposal of 1 pc. [Tunnel storage, injection-moulded]
Processes Amount Unit Notes/Sources
Transport, lorry, EURO6, RER 0.0842 tkm [32, 35, 36]
Waste scenarios Amount Unit Notes/Sources
Recycling of PUR, GLO 6 % [32]
Incineration of MSW, SE 94 % [32]
4. 3D-printed WPC tunnel storage (case study B)
a) Production of 1 pc. [Tunnel storage, 3D-printed]
Input Amount Unit Notes/Sources
Wood-plastic pellet,
flame-retarded, SE
1.60 kg See section 2. c)
Fused particle fabrication, SE 1.60 kg See section 2. d)
Output Amount Unit Notes/Sources
Tunnel storage, 3D-printed 1 p 1.35 kg
b) Use of 1 pc. [Tunnel storage, 3D-printed]
Processes Amount Unit Notes/Sources
Transport, lorry, EURO6, RER 340 tkm [32, 35, 36]
c) Disposal of 1 pc. [Tunnel storage, 3D-printed]
Processes Amount Unit Notes/Sources

52
Transport, lorry, EURO6, RER 0.0296 tkm [32, 35, 36]
Waste scenarios Amount Unit Notes/Sources
Incineration of MSW, SE 100 % [32]
5. Conventional ceiling board (case study C)
a) Production of 1 pc. [Gypsum plasterboard, painted]
Input Amount Unit Notes/Sources
Gypsum plasterboard, GLO 17.64 kg [32]
Alkyd paint, white, GLO 0.072 kg [32]
Output Amount Unit Notes/Sources
Gypsum plasterboard, painted 1 p 15.6 kg
b) Distribution of 1 pc. [Gypsum plasterboard, painted]
Processes Amount Unit Notes/Sources
Transport, lorry, EURO5, RER 0.727 tkm [32]
c) Disposal of 1 pc. [Gypsum plasterboard, painted]
Processes Amount Unit Notes/Sources
Transport, lorry, EURO6, RER 0.328 tkm [32]
Waste scenarios Amount Unit Notes/Sources
Incineration of MSW, SE 100 % [32]
6. 3D-printed WPC ceiling board (case study C)
a) Production of 1 pc. [Ceiling board, 3D-printed]
Input Amount Unit Notes/Sources
Wood-plastic pellet,
flame-retarded, SE
4.74 kg See section 2. c)
Fused particle fabrication, SE 4.74 kg See section 2. d)
Output Amount Unit Notes/Sources
Ceiling board, 3D-printed 1 p 4.17 kg
b) Distribution of 1 pc. [Ceiling board, 3D-printed]
Processes Amount Unit Notes/Sources

53
Transport, lorry, EURO5, RER 0.195 tkm [32]
c) Disposal of 1 pc. [Ceiling board, 3D-printed]
Processes Amount Unit Notes/Sources
Transport, lorry, EURO6, RER 0.0877 tkm [32]
Waste scenarios Amount Unit Notes/Sources
Incineration of MSW, SE 100 % [32]

54
1. Characterization results
a) Case study A: storage box
Impact category
Unit IM
(cradle-to-grave)
3D 50% (cradle-
to-grave)
3D 100% (cradle-
to-grave)
IM (cradle-to-gate)
3D 50% (cradle-to-gate)
GW kg CO2
eq 1.55E+02 7.65E+01 1.58E+02 1.36E+01 6.46E+00
OD kg CFC11
eq 1.01E-04 5.35E-05 1.11E-04 3.12E-06 4.86E-06
FP kg
PM2.5 eq
1.33E-01 6.80E-02 1.41E-01 1.18E-02 8.03E-03
AD kg SO2
eq 3.30E-01 1.69E-01 3.55E-01 4.03E-02 2.61E-02
EP kg P eq 1.52E-02 7.87E-03 1.71E-02 3.55E-03 2.16E-03
HT kg 1,4-DCB eq
3.60E+03 2.01E+03 4.40E+03 1.37E+02 2.52E+02
FD kg oil eq 5.64E+01 2.67E+01 5.49E+01 7.66E+00 2.40E+00
TEC kg 1,4-DCB eq
5.41E-01 2.75E-01 5.58E-01 4.36E-03 1.05E-02
FEC kg 1,4-DCB eq
3.35E+00 1.98E+00 4.53E+00 1.60E-01 3.18E-01
MEC kg 1,4-DCB eq
5.49E+00 3.15E+00 7.06E+00 2.24E-01 4.41E-01
b) Case study B: tunnel storage

55
Impact category
Unit IM
(cradle-to-grave)
3D 50% (cradle-
to-grave)
3D 100% (cradle-
to-grave)
IM (cradle-to-gate)
3D 50% (cradle-to-gate)
GW kg CO2
eq 1.58E+02 4.99E+01 9.97E+01 1.98E+01 4.20E+00
OD kg CFC11
eq 1.01E-04 3.49E-05 6.97E-05 5.27E-06 3.16E-06
FP kg
PM2.5 eq
1.41E-01 4.43E-02 8.87E-02 2.25E-02 5.22E-03
AD kg SO2
eq 3.50E-01 1.10E-01 2.21E-01 6.71E-02 1.70E-02
EP kg P eq 1.63E-02 5.13E-03 1.03E-02 5.03E-03 1.41E-03
HT kg 1,4-DCB eq
3.68E+03 1.31E+03 2.62E+03 2.94E+02 1.64E+02
FD kg oil eq 5.52E+01 1.74E+01 3.48E+01 7.51E+00 1.56E+00
TEC kg 1,4-DCB eq
5.34E-01 1.79E-01 3.59E-01 9.95E-03 6.86E-03
FEC kg 1,4-DCB eq
3.43E+00 1.29E+00 2.58E+00 3.02E-01 2.07E-01
MEC kg 1,4-DCB eq
5.59E+00 2.05E+00 4.11E+00 4.30E-01 2.87E-01
c) Case study C: ceiling board
Impact category
Unit Gypsum
plasterboard
3D ceiling board 30%
infill
3D ceiling board 50%
infill
GW kg CO2
eq 1.73E+01 1.50E+01 2.49E+01
OD kg CFC11
eq 1.28E-05 1.19E-05 1.99E-05
FP kg
PM2.5 eq
1.77E-02 1.57E-02 2.61E-02
AD kg SO2
eq 4.45E-02 5.12E-02 8.52E-02
EP kg P eq 3.23E-03 4.36E-03 7.26E-03
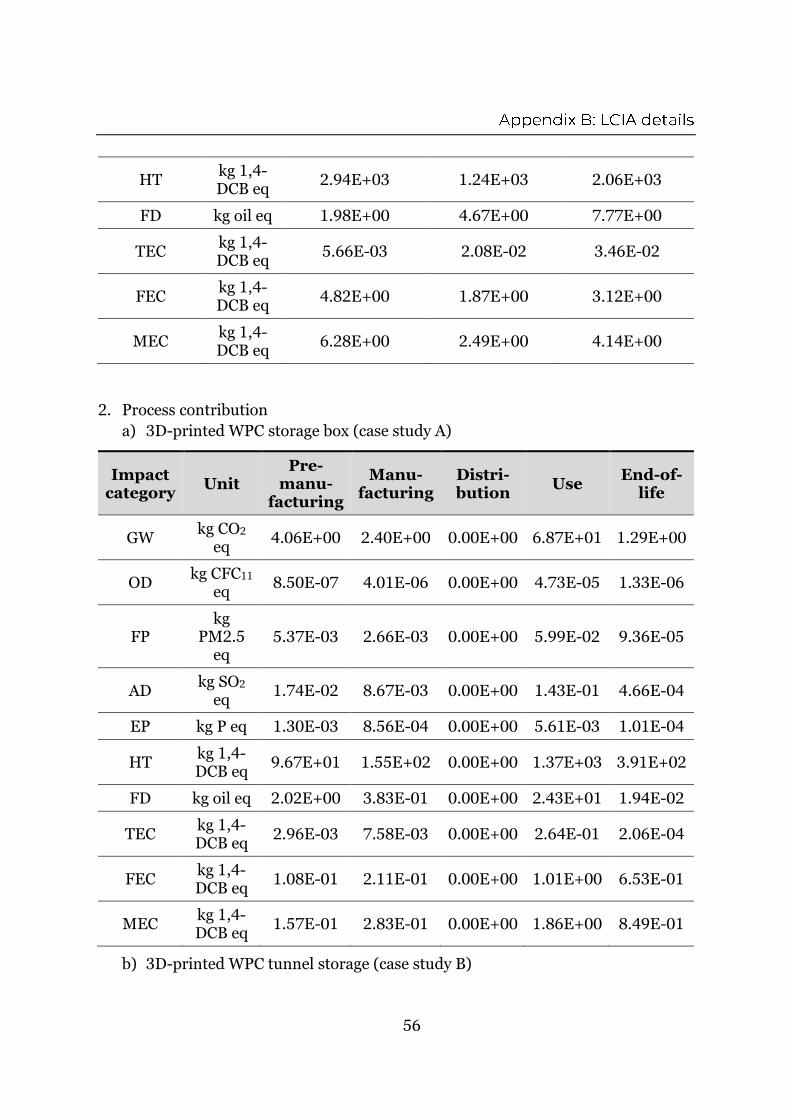
56
HT kg 1,4-DCB eq
2.94E+03 1.24E+03 2.06E+03
FD kg oil eq 1.98E+00 4.67E+00 7.77E+00
TEC kg 1,4-DCB eq
5.66E-03 2.08E-02 3.46E-02
FEC kg 1,4-DCB eq
4.82E+00 1.87E+00 3.12E+00
MEC kg 1,4-DCB eq
6.28E+00 2.49E+00 4.14E+00
2. Process contribution
a) 3D-printed WPC storage box (case study A)
Impact category
Unit Pre-
manu-facturing
Manu-facturing
Distri-bution
Use End-of-
life
GW kg CO2
eq 4.06E+00 2.40E+00 0.00E+00 6.87E+01 1.29E+00
OD kg CFC11
eq 8.50E-07 4.01E-06 0.00E+00 4.73E-05 1.33E-06
FP kg
PM2.5 eq
5.37E-03 2.66E-03 0.00E+00 5.99E-02 9.36E-05
AD kg SO2
eq 1.74E-02 8.67E-03 0.00E+00 1.43E-01 4.66E-04
EP kg P eq 1.30E-03 8.56E-04 0.00E+00 5.61E-03 1.01E-04
HT kg 1,4-DCB eq
9.67E+01 1.55E+02 0.00E+00 1.37E+03 3.91E+02
FD kg oil eq 2.02E+00 3.83E-01 0.00E+00 2.43E+01 1.94E-02
TEC kg 1,4-DCB eq
2.96E-03 7.58E-03 0.00E+00 2.64E-01 2.06E-04
FEC kg 1,4-DCB eq
1.08E-01 2.11E-01 0.00E+00 1.01E+00 6.53E-01
MEC kg 1,4-DCB eq
1.57E-01 2.83E-01 0.00E+00 1.86E+00 8.49E-01
b) 3D-printed WPC tunnel storage (case study B)

57
Impact category
Unit Pre-
manu-facturing
Manu-facturing
Distri-bution
Use End-of-
life
GW kg CO2
eq 2.64E+00 1.56E+00 0.00E+00 4.48E+01 8.37E-01
OD kg CFC11
eq 5.53E-07 2.61E-06 0.00E+00 3.08E-05 8.66E-07
FP kg
PM2.5 eq
3.49E-03 1.73E-03 0.00E+00 3.90E-02 6.09E-05
AD kg SO2
eq 1.13E-02 5.64E-03 0.00E+00 9.31E-02 3.03E-04
EP kg P eq 8.49E-04 5.56E-04 0.00E+00 3.66E-03 6.56E-05
HT kg 1,4-DCB eq
6.29E+01 1.01E+02 0.00E+00 8.93E+02 2.54E+02
FD kg oil eq 1.31E+00 2.49E-01 0.00E+00 1.58E+01 1.26E-02
TEC kg 1,4-DCB eq
1.93E-03 4.93E-03 0.00E+00 1.72E-01 1.34E-04
FEC kg 1,4-DCB eq
6.99E-02 1.37E-01 0.00E+00 6.57E-01 4.25E-01
MEC kg 1,4-DCB eq
1.02E-01 1.84E-01 0.00E+00 1.22E+00 5.52E-01
c) 3D-printed WPC ceiling board (case study C)
Impact category
Unit Pre-
manu-facturing
Manu-facturing
Distri-bution
Use End-of-
life
GW kg CO2
eq 7.83E+00 4.62E+00 2.51E-02 0.00E+00 2.48E+00
OD kg CFC11
eq 1.64E-06 7.73E-06 1.80E-08 0.00E+00 2.56E-06
FP kg
PM2.5 eq
1.03E-02 5.13E-03 2.19E-05 0.00E+00 1.80E-04
AD kg SO2
eq 3.35E-02 1.67E-02 6.51E-05 0.00E+00 8.97E-04
EP kg P eq 2.51E-03 1.65E-03 1.97E-06 0.00E+00 1.94E-04

58
HT kg 1,4-DCB eq
1.86E+02 2.99E+02 4.76E-01 0.00E+00 7.53E+02
FD kg oil eq 3.89E+00 7.39E-01 8.72E-03 0.00E+00 3.74E-02
TEC kg 1,4-DCB eq
5.71E-03 1.46E-02 9.72E-05 0.00E+00 3.96E-04
FEC kg 1,4-DCB eq
2.07E-01 4.06E-01 3.49E-04 0.00E+00 1.26E+00
MEC kg 1,4-DCB eq
3.03E-01 5.46E-01 6.54E-04 0.00E+00 1.64E+00

TRITA ITM-EX 2020:610
www.kth.se