comparison and analysis of remote sensing-based and ground
TRANSCRIPT

Chiang Mai J. Sci. 2011; 38(4) 541
Chiang Mai J. Sci. 2011; 38(4) : 541-550http://it.science.cmu.ac.th/ejournal/Contributed Paper
Comparison and Analysis of Remote Sensing-basedand Ground-based Precipitation Data Over IndiaThitikon Chanyatham*[a] and Sukrit Kirtsaeng [b][a] Bureau of Royal Rainmaking and Agricultural Aviation, Bangkok 10900, Thailand.[b] Thai Meteorological Department, Bangkok 10260, Thailand.*Author for correspondence; e-mail: [email protected]
Received: 12 October 2010Accepted: 4 June 2011
ABSTRACTAccurate estimation of precipitation is crucial for crop yield assessment, flood and
drought monitoring and water resources management. Rainfall consists of both temporal andspatial variability. Rain gauges support temporal resolution, on the other hand it is weakness inthe quality of spatial resolution. However, remote sensing provides good spatial resolution.According to the advantages of these measurement methods, more precious rainfall datashould be estimated from the combination of existent rain gauges and remote sensingobservation. The pilot project is comparative study and analysis gridded rainfall products ofTropical Rainfall Measuring Mission (TRMM) 3B43 monthly, 3B42 3-hourly, Climate PredictionCenter (CPC) and India Meteorological Department (IMD). The study areas are India regionand Ganga basin, located in north-eastern of India. The methodology of comparison iscarried out the gridded data sets to 0.5x0.5 degree. The rainfall data sets in 2005 were analyzedfor all monthly products and rainfall data sets during 15 June to 15 September 2005 wereanalyzed for daily products. In the analysis, three statistical measures are used: bias, root meansquare difference and mean absolute difference for over India, each state of India. TRMM3B42 and 3B43 products have higher bias, RMSD and MAD than CPC products. The accuracyof CPC, TRMM 3B43 monthly products and TRMM 3B42 3-hourly products are 83%, 76%and 69% respectively. States analysis show very high bias of CPC, TRMM 3B42 and 3B43products in Arunachal Pradesh and Mizoram that located in hilly area and have high rainfallrate. The rainfall estimated by remote sensing show lower rain rate than ground-based datathat may be the effect of temporal resolution of satellites, in monsoon season this effect ispredominant.
Keywords: TRMM rainfall, CPC rainfall, remote sensing-based precipitation.
1. INTRODUCTIONThe estimation of precipitation is
important for flood and drought monitoringand water resources management. Excessrainfall causes severe flooding [1], properties
and lives loss. Extended absence of rainfalllead to droughts, which can devastate cropyields and limits human consumption. A betterunderstanding of the spatial and temporal

542 Chiang Mai J. Sci. 2011; 38(4)
rainfall distributions is therefore essential forwater resources management.
Rain gauge measurements are usuallylimited by their spatial coverage. Remotesensing using space borne sensors provide anexcellent complement to continuous monitoringof rain event both spatially and temporally.The launch of the Tropical Rainfall MeasuringMission (TRMM) satellite in November 1997by National Aeronautics and Space Adminis-tration (NASA) of US and the JapaneseAerospace Exploration Agency (JAXA)provided more than twelve years of qualityrainfall data for tropical rainfall study. TheTRMM orbit is circular and is at an altitudeof 218 nautical miles (350 km) and aninclination of 35 degrees to the Equator as
shown in figure 1. The spacecraft takes about91 minutes to complete one orbit around theEarth. This orbit allows for as much coverageof the tropics and extraction of rainfall dataover the 24-hour day (16 orbits) as possible.
TRMM data has been used for variouskinds of remotely sensed analysis. TRMMrainfall data are used to make hydrologicmodels to compare with areal extent of waterplumes from rivers in the Lebanese coastal tomonitor the behavior of water input in thecatchments versus the output from rivers [2].In rainfall assessment, some researcher triedto compare and validate TRMM rainfallproducts with other rainfall measurements[3-5]. TRMM 3B42-V6 data set are used forinter-comparison with observations from a
Data set nameSpatial Temporal
resolution resolutionDuration
Indian Meteorological Department (IMD) 0.5×0.5 degree Daily 2005Climate Prediction Center (CPC) 0.1×0.1 degree Daily 2005TRMM 3B42 V6 0.25×0.25 degree 3 Hourly 15 June-15 Sep 2005TRMM 3B43 V6 0.25×0.25 degree Monthly 2005
Table 1. Characteristics of the data sets used in this study.
Figure 1. Example of TRMM strip line over India.
Chiang Mai J. Sci. 2011; 38(4) 543
high density rain-gauge network over thewestern state of Maharashtra, India [6]. Someresearcher used TRMM data set for inter-comparison with rain gauge data set overThailand [7]. However, these studies are usuallylimited to comparisons at the monthly scale.For hydrological or agricultural applications,shorter periods, such as daily, five day (pentad)or ten day (decade) rain rates are moreappropriate. A comparison of India raingauges with the Climate Prediction Center(CPC) and TRMM products enables anevaluation of applicability of satellite rainestimates in India on agricultural andhydrological applications.
The purpose of this study is to comparethe rainfall estimation of TRMM and CPCrainfall products with India MeteorologicalDepartment (IMD) (Ground-based data)over India.
2. MATERIALS AND METHODS2.1 Remote Sensing-based DataTropical Rainfall Measuring Mission (TRMM)
•3B 42 3-hourly products•3B 43 monthly productsThe global rainfall data were downloaded
for year 2005Climate Prediction Center (CPC)
2.2 Ground-based DataIndian Rain gauge data are obtained
from Indian Meteorological Department(IMD). The data are binned into 0.5×0.5degree boxes.
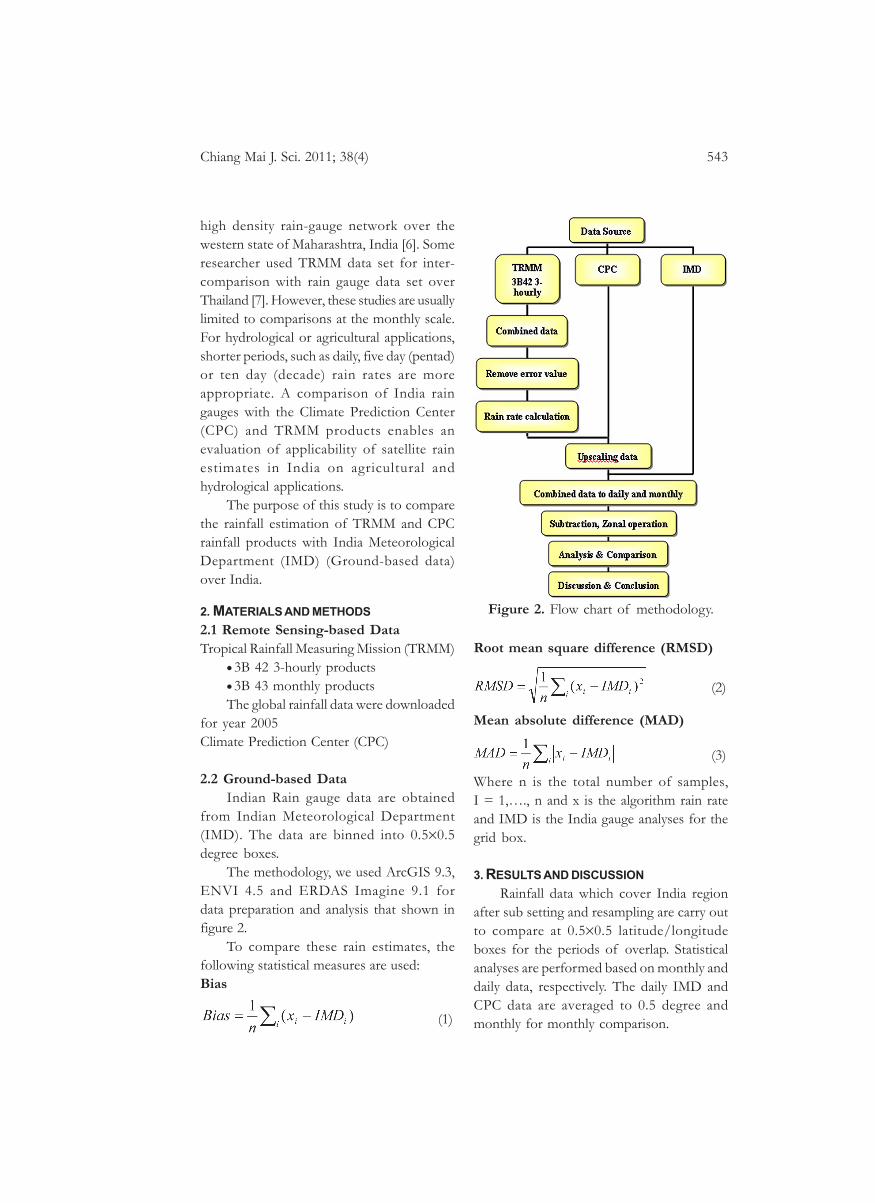
The methodology, we used ArcGIS 9.3,ENVI 4.5 and ERDAS Imagine 9.1 fordata preparation and analysis that shown infigure 2.
To compare these rain estimates, thefollowing statistical measures are used:Bias
(1)
Root mean square difference (RMSD)
(2)
Mean absolute difference (MAD)
(3)
Where n is the total number of samples,I = 1,…., n and x is the algorithm rain rateand IMD is the India gauge analyses for thegrid box.
3. RESULTS AND DISCUSSIONRainfall data which cover India region
after sub setting and resampling are carry outto compare at 0.5×0.5 latitude/longitudeboxes for the periods of overlap. Statisticalanalyses are performed based on monthly anddaily data, respectively. The daily IMD andCPC data are averaged to 0.5 degree andmonthly for monthly comparison.
Figure 2. Flow chart of methodology.
544 Chiang Mai J. Sci. 2011; 38(4)
3.1 Over India Analysis3.1.1 Monthly comparison
This section focus on TRMM 3B43monthly products, 3B42 daily products, CPCand IMD products compare over India.
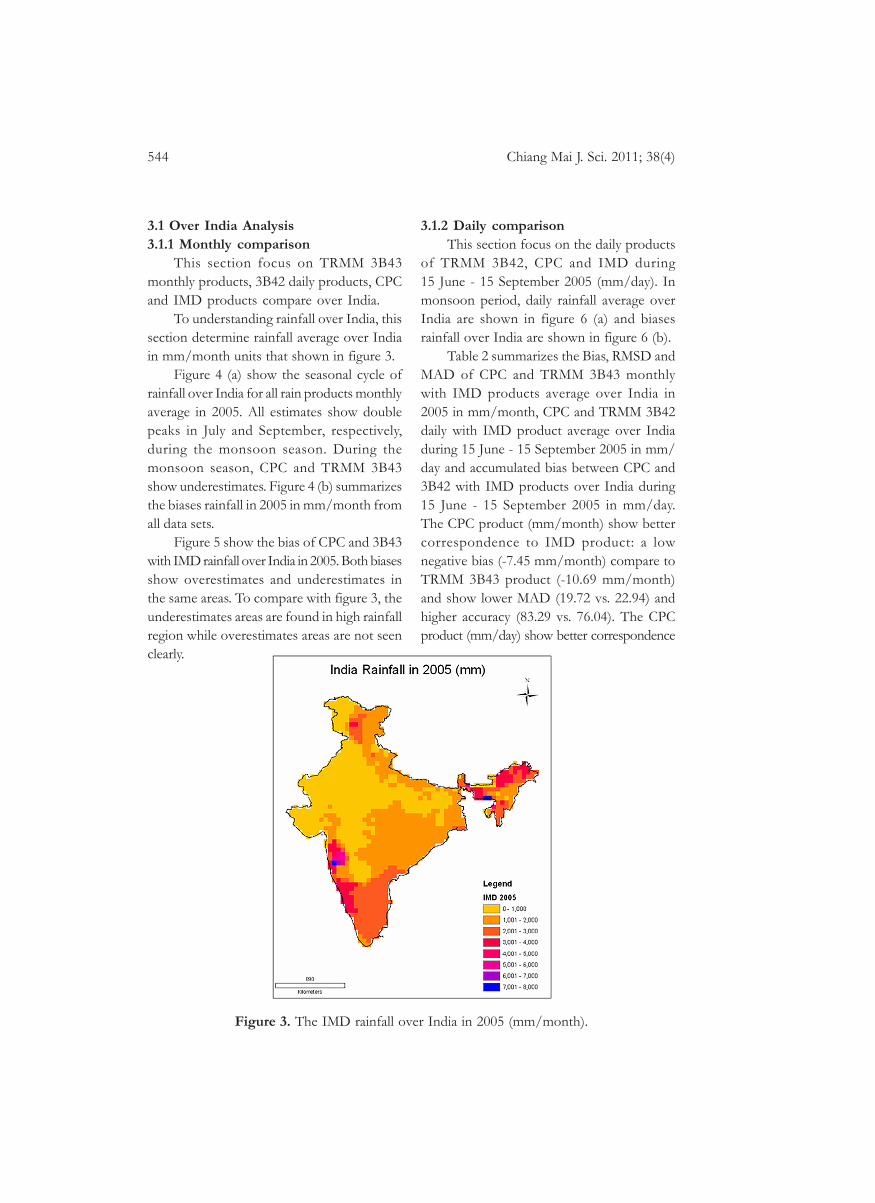
To understanding rainfall over India, thissection determine rainfall average over Indiain mm/month units that shown in figure 3.
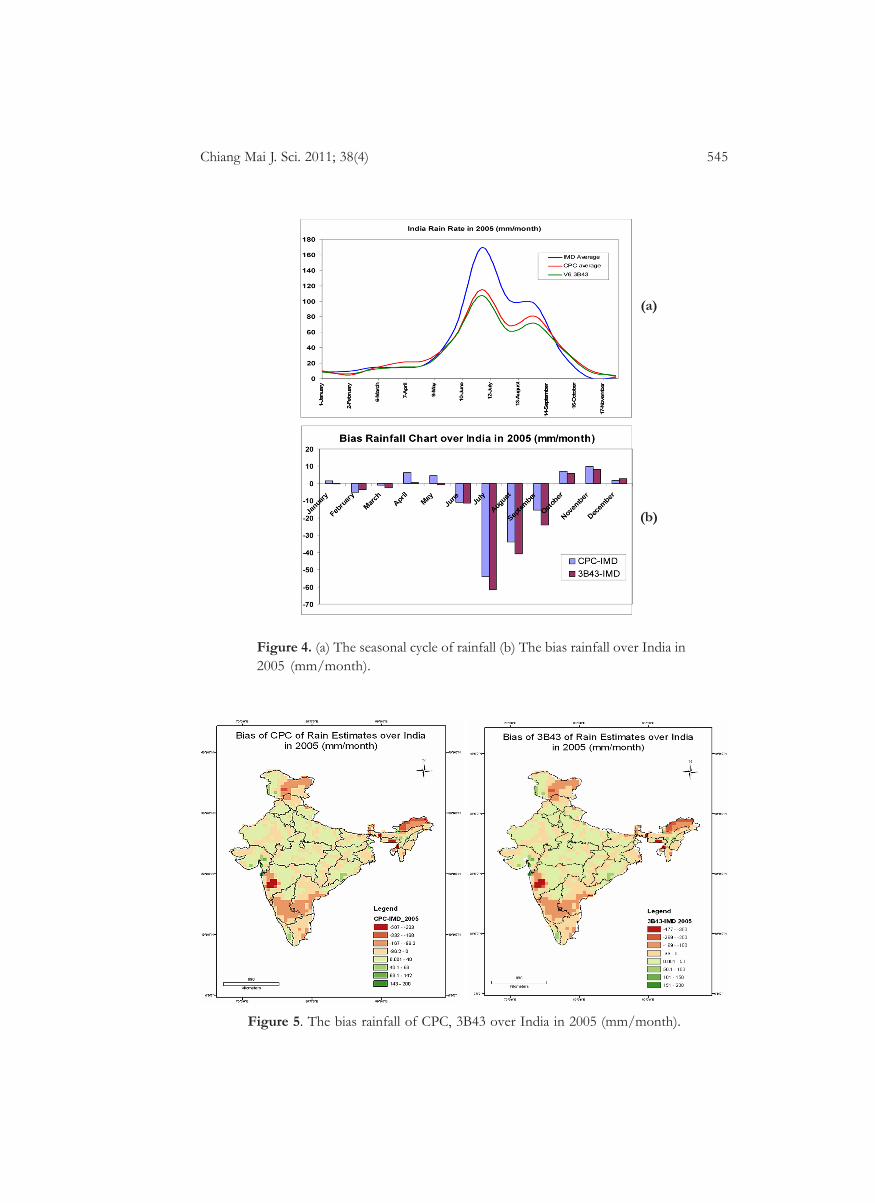
Figure 4 (a) show the seasonal cycle ofrainfall over India for all rain products monthlyaverage in 2005. All estimates show doublepeaks in July and September, respectively,during the monsoon season. During themonsoon season, CPC and TRMM 3B43show underestimates. Figure 4 (b) summarizesthe biases rainfall in 2005 in mm/month fromall data sets.
Figure 5 show the bias of CPC and 3B43with IMD rainfall over India in 2005. Both biasesshow overestimates and underestimates inthe same areas. To compare with figure 3, theunderestimates areas are found in high rainfallregion while overestimates areas are not seenclearly.
3.1.2 Daily comparisonThis section focus on the daily products
of TRMM 3B42, CPC and IMD during15 June - 15 September 2005 (mm/day). Inmonsoon period, daily rainfall average overIndia are shown in figure 6 (a) and biasesrainfall over India are shown in figure 6 (b).
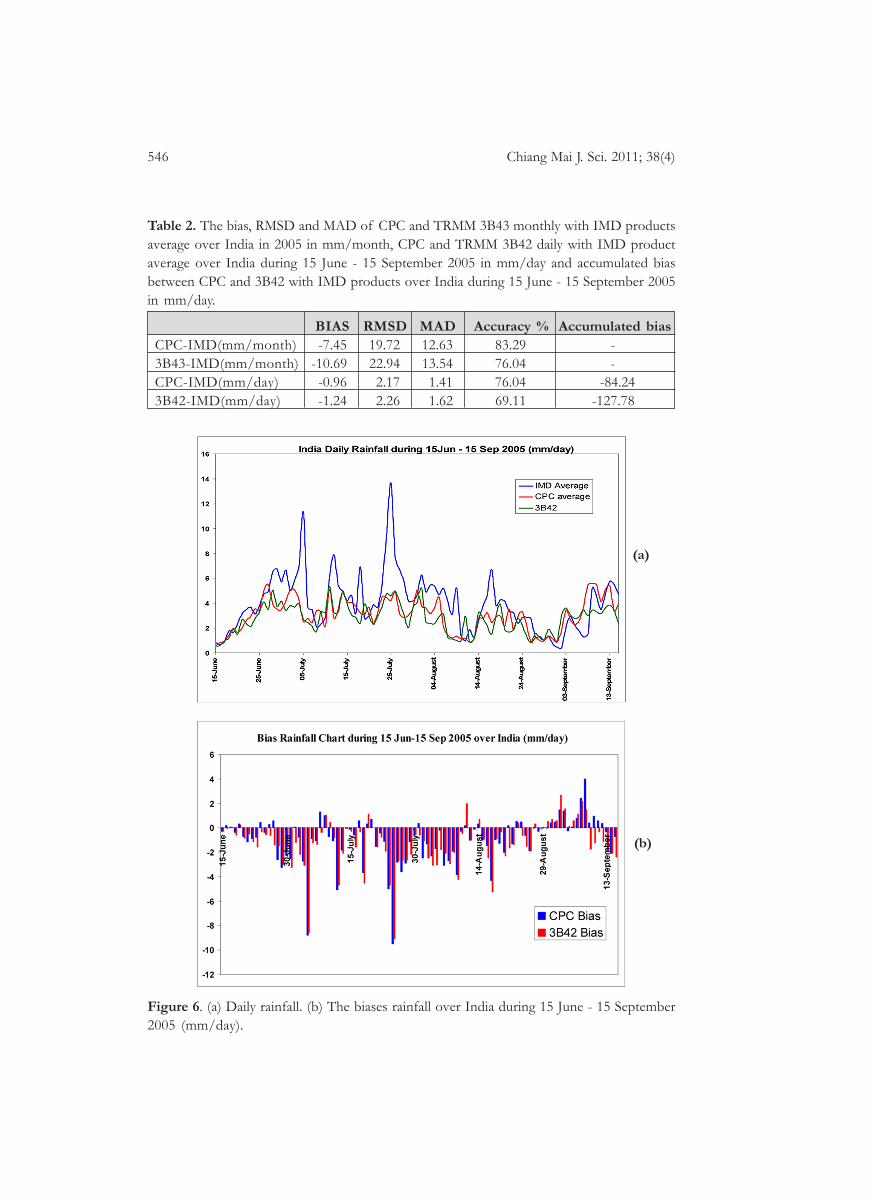
Table 2 summarizes the Bias, RMSD andMAD of CPC and TRMM 3B43 monthlywith IMD products average over India in2005 in mm/month, CPC and TRMM 3B42daily with IMD product average over Indiaduring 15 June - 15 September 2005 in mm/day and accumulated bias between CPC and3B42 with IMD products over India during15 June - 15 September 2005 in mm/day.The CPC product (mm/month) show bettercorrespondence to IMD product: a lownegative bias (-7.45 mm/month) compare toTRMM 3B43 product (-10.69 mm/month)and show lower MAD (19.72 vs. 22.94) andhigher accuracy (83.29 vs. 76.04). The CPCproduct (mm/day) show better correspondence
Figure 3. The IMD rainfall over India in 2005 (mm/month).
Chiang Mai J. Sci. 2011; 38(4) 545
Figure 4. (a) The seasonal cycle of rainfall (b) The bias rainfall over India in2005 (mm/month).
Figure 5. The bias rainfall of CPC, 3B43 over India in 2005 (mm/month).
(a)
(b)
546 Chiang Mai J. Sci. 2011; 38(4)
Figure 6. (a) Daily rainfall. (b) The biases rainfall over India during 15 June - 15 September2005 (mm/day).
BIAS RMSD MAD Accuracy % Accumulated biasCPC-IMD(mm/month) -7.45 19.72 12.63 83.29 -3B43-IMD(mm/month) -10.69 22.94 13.54 76.04 -CPC-IMD(mm/day) -0.96 2.17 1.41 76.04 -84.243B42-IMD(mm/day) -1.24 2.26 1.62 69.11 -127.78
Table 2. The bias, RMSD and MAD of CPC and TRMM 3B43 monthly with IMD productsaverage over India in 2005 in mm/month, CPC and TRMM 3B42 daily with IMD productaverage over India during 15 June - 15 September 2005 in mm/day and accumulated biasbetween CPC and 3B42 with IMD products over India during 15 June - 15 September 2005in mm/day.
(a)
(b)
Chiang Mai J. Sci. 2011; 38(4) 547
to IMD product: a low negative bias (-0.96mm/day) compare to TRMM 3B42 product(-1.24 mm/day) and show lower MAD (1.41vs. 1.62) and higher accuracy (76.04 vs. 69.11).The CPC (mm/day) is consistently lower thanthe TRMM 3B42 estimates (-84.24 vs. -127.78mm/day).
3.2 States AnalysisThis section focus on TRMM 3B43
monthly products, 3B42 daily products, CPCand IMD products analyzed by zonaloperation over states and cut some states thatvery small : Chandigarh, Dadra & NagarHaveli, Delhi, Goa and Pondicherry.
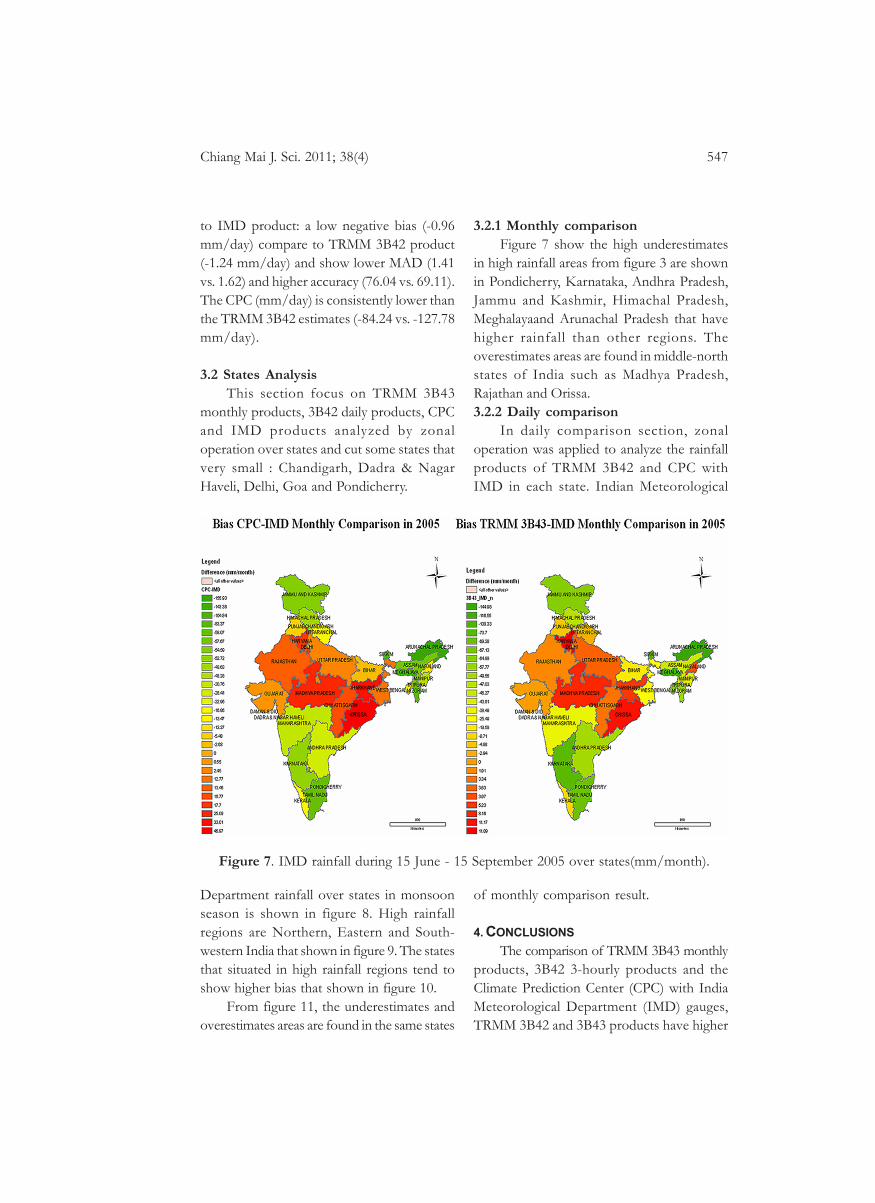
3.2.1 Monthly comparisonFigure 7 show the high underestimates
in high rainfall areas from figure 3 are shownin Pondicherry, Karnataka, Andhra Pradesh,Jammu and Kashmir, Himachal Pradesh,Meghalayaand Arunachal Pradesh that havehigher rainfall than other regions. Theoverestimates areas are found in middle-northstates of India such as Madhya Pradesh,Rajathan and Orissa.3.2.2 Daily comparison
In daily comparison section, zonaloperation was applied to analyze the rainfallproducts of TRMM 3B42 and CPC withIMD in each state. Indian Meteorological
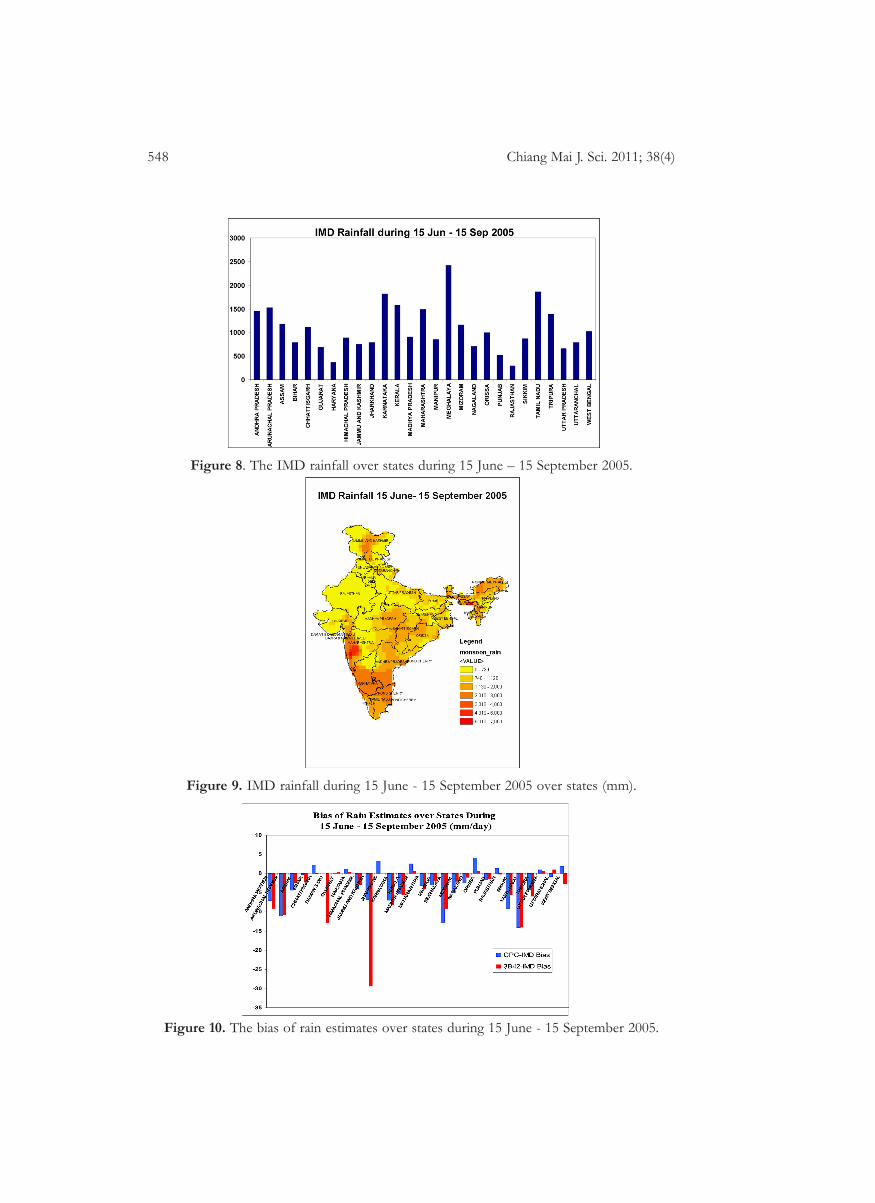
Department rainfall over states in monsoonseason is shown in figure 8. High rainfallregions are Northern, Eastern and South-western India that shown in figure 9. The statesthat situated in high rainfall regions tend toshow higher bias that shown in figure 10.
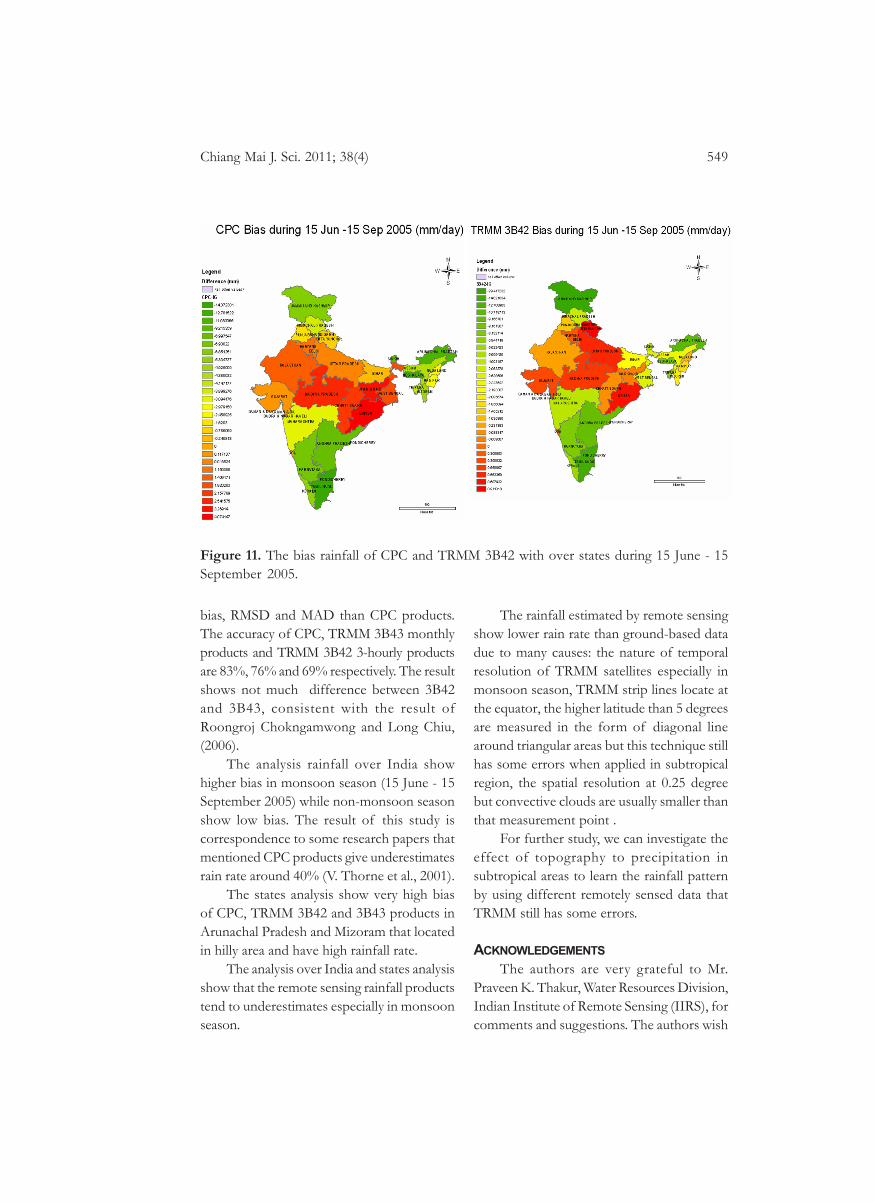
From figure 11, the underestimates andoverestimates areas are found in the same states
of monthly comparison result.
4. CONCLUSIONSThe comparison of TRMM 3B43 monthly
products, 3B42 3-hourly products and theClimate Prediction Center (CPC) with IndiaMeteorological Department (IMD) gauges,TRMM 3B42 and 3B43 products have higher
Figure 7. IMD rainfall during 15 June - 15 September 2005 over states(mm/month).
548 Chiang Mai J. Sci. 2011; 38(4)
Figure 8. The IMD rainfall over states during 15 June – 15 September 2005.
Figure 10. The bias of rain estimates over states during 15 June - 15 September 2005.
Figure 9. IMD rainfall during 15 June - 15 September 2005 over states (mm).
Chiang Mai J. Sci. 2011; 38(4) 549
Figure 11. The bias rainfall of CPC and TRMM 3B42 with over states during 15 June - 15September 2005.
bias, RMSD and MAD than CPC products.The accuracy of CPC, TRMM 3B43 monthlyproducts and TRMM 3B42 3-hourly productsare 83%, 76% and 69% respectively. The resultshows not much difference between 3B42and 3B43, consistent with the result ofRoongroj Chokngamwong and Long Chiu,(2006).
The analysis rainfall over India showhigher bias in monsoon season (15 June - 15September 2005) while non-monsoon seasonshow low bias. The result of this study iscorrespondence to some research papers thatmentioned CPC products give underestimatesrain rate around 40% (V. Thorne et al., 2001).
The states analysis show very high biasof CPC, TRMM 3B42 and 3B43 products inArunachal Pradesh and Mizoram that locatedin hilly area and have high rainfall rate.
The analysis over India and states analysisshow that the remote sensing rainfall productstend to underestimates especially in monsoonseason.
The rainfall estimated by remote sensingshow lower rain rate than ground-based datadue to many causes: the nature of temporalresolution of TRMM satellites especially inmonsoon season, TRMM strip lines locate atthe equator, the higher latitude than 5 degreesare measured in the form of diagonal linearound triangular areas but this technique stillhas some errors when applied in subtropicalregion, the spatial resolution at 0.25 degreebut convective clouds are usually smaller thanthat measurement point .
For further study, we can investigate theeffect of topography to precipitation insubtropical areas to learn the rainfall patternby using different remotely sensed data thatTRMM still has some errors.
ACKNOWLEDGEMENTSThe authors are very grateful to Mr.
Praveen K. Thakur, Water Resources Division,Indian Institute of Remote Sensing (IIRS), forcomments and suggestions. The authors wish
550 Chiang Mai J. Sci. 2011; 38(4)
to acknowledge the Centre for Space Scienceand Technology Education in the Asia Pacific(affiliated to the United Nations) and IIRS,The Indian Space Research Organization(ISRO) Ahmedabad for their knowledge,encouragement and help. The authors alsoacknowledge the use of the TRMM datasetwhich is available on internet from http://trmm.gsfc.nasa.gov by NASA and the GoddardEarth Sciences Data and Information ServicesCenter (GES DISC) and the use of theClimate Prediction Center (CPC) datasetwhich is available from http://www.cpc.noaa.gov/ for data and useful suggestions. Therainfall observation data from the IMD arethankfully acknowledged.
REFERENCES
[1] Kirtsaeng S., Chantara S. and KreasuwunJ., Mesoscale simulation of a very heavyrainfall event over Mumbai, using theweather research and forecasting (WRF)model. Chaing Mai J. Sci., 2010; 37(3):429-442.
[2] Shaban A., Robinson C. and El-Baz F.,Using MODIS images and TRMM datato correlate rainfall peaks and waterdischarges from the Lebanese coastalrivers, J. Warp, 2009; 1(4): 227-236.
[3] Chiu L., Liu Z., Rui H. and Teng W.L.,Tropical rainfall measuring mission(TRMM) data and access tools. In: EarthScience Satellite Remote Sensing. Vol II,Qu, J., et al., (Editors), Springer-Verlag andTsinghua University Press. 2006; 202-218.
[4] Chiu L., D-B. Shin and Kwaitkowski J.,Surface rainfall from satellite algorithms.In: Earth Science Satellite Remote Sensing.Vol I, Qu, J., et al., (Editors), Springer-Verlag and Tsinghua University Press.2006; 317-336.
[5] Chiu L., Liu Z., Vongssaard J., MorainS., Budge A., Bales C. and Neville P.,Comparison of surface rain rates fromTRMM and water division over NewMexico, 3rd international Oceanic and
Atmospheric Conference, Jun 28-30,2004, Beijing PRC.
[6] Nair S., Govindrajan SRINIVASAN andRamkrishna NEMANI: Evaluation ofMulti-Satellite TRMM Derived RainfallEstimates over a Western State of India.J. Meteor.Soc.Japan, 2009; 87: 927-939.
[7] Chokengamwong R. and Chiu., TRMMand Thailand Daily Gauge RainfallComparison, Center for Earth Observingand Space Research, George MasonUniversity.
[8] Chaubey I., Haan C.T., Salisbury J.M.and Grunwald S., Quantifying modeloutput uncertainty due to spatial variabilityof rainfall, J. Am. Water ResourcesAssoc., 1999; 35(5): 1113-1123.
[9] Huffman G., et al., Global precipitationat one-degree daily resolution frommultisatllite observations, J. Hydromet,2001: 2; 36-50.
[10] Kummerow C. and coauthors, The statusof the tropical rainfall measuring mission(TRMM) sensor package, J. Atmos. OceanicTechnol., 2000; 15: 808-816.
[11] Rudolf B., Hauschild H., Rueth W. andSchneider U., Terrestrial precipitationanalysis: operational method and requireddensity of point measurements, In:Global Precipitations and ClimateChange, M. Desbois and F. Desalmond,Eds., Springer-Verlag, NATO ASI SeriesI, 1994; 26: 173-186.
[12] Thorne V., Coakeley P., Grimes D.,Dugdale G., Comparison of TAMSATand CPC rainfall estimates withraingauges, for southern Africa, Int. J.Remote Sens., 2001; 22(10): 1951-1974.
[13] Chatham County Flood Forecasting andWarning System(CCFFWS), Radarbody. Radar. Available Source http://www.d h i . d k / d h i p r o j / C o u n t r y / U S A /Chathamdemo/Radar_body.htm, May13, 2003.