comparison o n soft storey effect a t different level in
TRANSCRIPT

International Journal of Science and Engineering Applications
Volume 8–Issue 11,471-475, 2019, ISSN:-2319–7560
www.ijcat.com 471
Comparison on Soft Storey Effect at Different Level in
Multi-Storey Buildings
Aye Thet Mon
Department of Civil
Engineering
Technological University
Thanlyin, Myanmar
Kyaw Zeyar Win
Department of Civil
Engineering
Technological University
Thanlyin, Myanmar
Ni Ni Moe Kyaw
Department of Civil
Engineering
Technological University
Thanlyin, Myanmar
Abstract: Nowadays, according to social and functional needs, various types of multi-storey or high rise buildings are the mostly
useable buildings in many towns and cities. Among them, some buildings are constructed as soft storey because of the space
occupancy considerations. The soft storey has one level that is considerably greater flexible than the storey above and below it. This
type of building has no masonry wall in this level or it can also have a greater height than the rest of the floors. Generally, the soft
storey usually exists at the ground floor level but it can form any level of a high-rise building to fulfill necessity. In this study, analysis
and design of superstructure for twelve-storey reinforced concrete building are presented. Analysis and design of superstructure of the
selected building are carried out by using Extended Three Dimensional Analysis of Building Systems software. Firstly, the model is
analysed by using software. For the superstructure, storey drift limitation, P-∆ effect, overturning, storey shear and torsional
irregularities are carried out from design results. Secondly, the structural designs are made by change of storey height and without
change of structural element size, seismic zone, exposure type and soil type. Finally, storey drift of all storey levels and the analysis
results of structural performance are compared.
Keywords: multi-storey; soft storey; storey drift; P-∆ effect; overturning; torsional irregularities.
1. INTRODUCTION All over the world, the multi-storey buildings are widely used
due to the rapid growth of the urban population, the high cost
of land, and potential of popularity in which the provision of
soft storey is a common practice. Generally, the soft storey
usually exists at the ground floor level and is known as a soft
storey building or an open ground storey building. As per
Indian standard code of practice, a soft storey has stiffness
less than 70 percent of the storey immediately above, or less
than 80 percent of the average stiffness of the three storeys
above. If the stiffness of the storey meets at least one of above
two criteria, the structure is considered to have a soft storey.
Nowadays, some space need to be wider open space and
higher floor level are considered for the purpose of a large
meeting room, a showroom or a banking hall etc. Therefore,
soft storey can form any level of a high-rise building. Some
buildings are regarded with typical height and designed for
same typical floors in structural design. But in practice, height
is suddenly increased in one floor and structural elements for
this changed height are not designed again. These structures
can get soft storey effect and the effect of the seismic loading
becomes more severe for heights above this floor level. When
the lateral force acts on soft storey building, the building
might become failure due to its less stiffness because the
seismic force distribution is dependent on the distribution of
stiffness and mass along the height. In this study, the
structural designs are made by change of storey height and
without change of structural element sizes, seismic zone,
exposure type and soil type. The structural elements are
designed to resist not only gravity forces but also lateral
forces including earthquake and wind loads. The mostly
failure of soft storey effect on the world are mainly due to the
earthquake because the structural members are not strong
enough to hold up the building during an earthquake. This
indicate that those buildings possess storeys that are
significantly weaker or more flexible than adjacent storeys
and where deformations and damage tend to be concentrated. The Figure.1 is the soft storey failure in M7.4 earthquake,
Tukery, August 17, 1999.
Figure.1 Soft storey failure in Tukery
2. METHODOLOGY In this paper, The 12 multi-storey building will be analysed
and designed by using Extended Three Dimensional Analysis
of Building Systems (E-tabs) Software. All reinforced
concrete members are designed with ultimate strength design
using building code of American Concrete Institute (ACI)
318-99. Wind and earthquake loads are considered according
to Uniform Building Code (UBC-1997). Exposure type (B)
and soil type (D) are considered with design wind velocity

International Journal of Science and Engineering Applications
Volume 8–Issue 11,471-475, 2019, ISSN:-2319–7560
www.ijcat.com 472
120 mph. Structural system is considered by concrete
intermediate moment-resisting frame with over-strength factor
5.5. Firstly, the proposed model is statically analyzed and the
structural elements of all storey levels will be compared to
know whether or not soft storey effect for proposed buildings.
And then, the results are carried out for the superstructure of
the proposed model and finally these are compared.
3. TYPE OF STRUCTURE
3.1 Data Preparation The following Tables describe the design data for five models
having different geometrical configurations. Table 1 shows
material specifications, Table 2 shows structural
configurations, Table 3 shows different cases of five models,
Table 4 shows storey heights of different configuration and
Table 5 shows structural element sizes.
Table 1 . Material specifications
Concrete compressive strength ( fc’) 4 ksi
Reinforcing yield strength ( fy ) 50 ksi
Modulus of Elasticity 3605 ksi
Poisson’s ratio 0.2
Table 2. Structural configurations
Number of stories 12
Width of structure 68ʹ-0″
Length of structure 95ʹ-0″
Total height of structure 148ʹ-0″
Number of bay’s along X 8
Number of bay’s along Y 6
Table 3. Different cases of five models
Model-1 Conventional
Model-2 Soft storey at ground floor
Model-3 Soft storey at first floor
Model-4 Soft storey at second floor
Model-5 Soft storey at third floor
Table 4. Storey heights of different configuration
Storey
Height
Model
M1
Model
M2
Model
M3
Model
M4
Model
M5
RT-1 10 10 10 10 10
RT 10 10 10 10 10
11F 10 10 10 10 10
10F 10 10 10 10 10
9F 10 10 10 10 10
8F 11 10 10 10 10
7F 11 10 10 10 10
6F 11 10 10 10 10
5F 11 10 10 10 10
4F 11 10 10 10 18
3F 11 10 10 18 10
2F 11 10 18 10 10
1F 11 18 10 10 10
GF to
Base 10 10 10 10 10
Total
height 148 148 148 148 148
Table 5. Structural element sizes
Column sizes 22″x22″, 20″x20″, 18″x18″,
16″x16″
Beam sizes for
proposed buildings
18″x20″, 16″x18″ , 14″x18″,
12″x18″, 12″x14″, 10″x12″
3.2 Model Description The Figure.2 shows the architectural floor plans of proposed
buildings. The Figure.3 and Figure.4 show the layout plan of
columns and beams of all models respectively.
(i)Typical floor plan
(ii)Soft storey floor plan
Figure.2 Architectural floor plan of proposed buildings

International Journal of Science and Engineering Applications
Volume 8–Issue 11,471-475, 2019, ISSN:-2319–7560
www.ijcat.com 473
Figure.3 Typical layout plan of columns
Figure.4 Typical layout plan of beams
4. LOAD COMBINATION According to ACI (318-99), static design load combinations
are as follows in Table 6.
Table 6. Load combination according to ACI (318-99)
1 1.4DL + 1.4SDL
2 1.4DL + 1.4SDL + 1.7LL
3,4 1.05DL + 1.05SDL + 1.275 LL ± 1.275WX
5,6 1.05DL + 1.05SDL + 1.275 LL ± 1.275WY
7,8 0.9DL + 0.9SDL ± 1.3WX
9,10 0.9DL + 0.9SDL ± 1.3WY
11,12 1.05DL + 1.05SDL + 1.28LL ± EQX
13,14 1.05DL + 1.05SDL + 1.28LL ± EQY
15,16 0.9DL + 0.9SDL ± EQX
17,18 0.9DL + 0.9SDL ± EQY
19,20 1.27DL + 1.27SDL + 1.28LL ± EQX
21,22 1.27DL + 1.27SDL + 1.28LL ± EQY
23,24 0.68DL + 0.68SDL ± 1.02EQX
25,26 0.68DL + 0.68SDL ± EQY
5. RESULTS AND DISCUSSIONS In this section, the results obtained from the analysis of one
conventional and four soft storey RC models using ETABS
software have been tabulated and compared. The performance
of structures on different criteria have been analyzed and
discussed as follow.
5.1 Storey Drift Storey drift is the lateral displacement of one level relative to
the level above or below. The figure.5 and figure.6 show
comparison of storey drift of five proposed models in x
direction and y direction respectively. The storey drifts for
models 2, 3, 4 and 5 suddenly increase at soft storey levels.
From the following results, it can be seen that the storey drift
of model 2 at soft storey level is maximum in both directions,
the storey drift of model 3, model 4 and model 5 at that level
are nearly equal in both directions and model 1 is minimum.
The storey drifts in both direction at each soft storey level are
more than drift limit so that the storey drift is significant in
soft storey buildings.
Figure.5 Comparison of storey drift in x direction
Figure.6 Comparison of storey drift in y direction
5.2 P- Effect The P-∆ effect results in additional forces and moments of
frame members and increases storey displacement
and overturning moment .The Figure.7 and Figure.8 show the
comparison of P- effect in x-direction and y-direction
respectively. In comparison of both directions, the P-Δ effects
of models 2, 3, 4 and 5 suddenly increase at soft storey level
in which the P- effect at soft storey level of model 2 and 3 in
both directions and that of model 4 in X direction are more

International Journal of Science and Engineering Applications
Volume 8–Issue 11,471-475, 2019, ISSN:-2319–7560
www.ijcat.com 474
than limitation. The stability coefficient for x and y direction
of model 1 and 5 is smaller than the allowable limit (0.1).
Therefore, P- effect is also significant in soft storey at lower
level.
Figure.7 Comparison of P- effect in x direction
Figure.8 Comparison of P- effect in y direction
5.3 Overturning Moment The Figure.9 and Figure.10 show the comparison of
overturning moment in x direction and y direction. In this
comparison, for all models in both directions are nearly
similar and it is increasing from top to bottom.
Figure.9 Comparison of overturning moment in x direction
Figure.10 Comparison of overturning moment in y direction
5.4 Storey Shear Storey shear is the summation of design lateral forces above
the storey under consideration. The Figure.11 and Figure.12
show the comparison of storey shear in x direction and y
direction. In this comparison, the results of storey shear for all
models in x and y directions are nearly similar and it is
increasing from top to bottom. Storey shear is the largest in
footing and then it declines gradually from footing to top.
Figure.11 Comparison of storey shear in x direction
Figure.12 Comparison of storey shear in y direction
5.5 Torsional Iirregularity The checking of torsional irregularity in both directions for
this study is shown in Figure.13 and Figure.14. The torsional
irregularity cannot exist as the values of ∆max/∆avg are
smaller than the allowable limit (1.2) for all models.

International Journal of Science and Engineering Applications
Volume 8–Issue 11,471-475, 2019, ISSN:-2319–7560
www.ijcat.com 475
Figure.13 Comparison of max/avg for torsional irregularity in x
direction
Figure.14 Comparison of max/avg for torsional irregularity in y
direction
6. CONCLUSION 1. Storey drifts of soft storey models in x-direction and y-
direction are more than conventional building. It can be
seen that the storey drift of model 2 at soft storey level is
maximum in both directions. Storey drift of each soft
storey level is more than drift limit and the higher the
building, the more displacement will be there. Therefore,
storey drift is significant in soft storey buildings.
2. P- effect of model 1 and 4 are more than limitation in
both directions. The stability coefficient for x and y
direction of model 1 and 5 is smaller than the allowable
limit in both directions. Therefore the P- effect is more
significant in soft storey models at low level.
3. Overturning moment of proposed models in x-direction
and y-direction are nearly similar and it is increasing
from top to bottom and these safety factors are less than
1.5.
4. The results of storey shear for all models in x and y
directions are nearly similar. It is maximum at ground
floor level and is gradually decreasing towards to the top
storey of the structure.
5. The torsional irregularity cannot exist as the values of
∆max/∆avg are smaller than the allowable limit for all
models.
6. According to study, overturning moment and torsional
irregularity have less influence for soft storey level.
However, the storey drift of model 2 at soft storey level
is maximum in both directions and that of each soft
storey level is more than limitation and the P- effect is
also significant in soft storey models at low level.
Therefore, the structure is found more economical and
safe when soft storey is avoided from ground, first and
second storey.
7. ACKNOWLEDGMENTS The author wishes to express grateful thanks to Dr. Theingi,
Rector of Technological University (Thanlyin). The author
wishes to express the deepest thanks and gratitude to her
supervisor Dr. Kyaw Zeyar Win, Professor of Civil
Engineering Department of Technological University
(Thanlyin). The author special thanks go to her co-supervisor
Dr. Ni Ni Moe Kyaw, Lecturer of Civil Engineering
Department of Technological University (Thanlyin), for her
invaluable advice and effective suggestion throughout the
study. The author would like to express her thanks to her
teacher Daw Ei Ei Kyaw, Assistant Lecturer of Civil
Engineering Department of Technological University
(Thanlyin), for her valuable comments and indispensable
guidance during this study. Finally, her special thanks to all
who helped her towards the successful completion of this
study.
8. REFERENCES [1] “International Conference of Building Officials.
1997. Uniform Building Code.Vol II”, Structural
Engineering Design Provisions
[2] Murty, C.V.R. No Date “Why are Open Ground
Storey Buildings Vulnerable in Earthquakes”
August 2012.
[3] Dogan, Mizan, Kirac, Nevzat and Gonen,
Hasan. No Date. “Soft Storey Behaviour in an
Earthquake”, IZMIT - DUZCE. August 2012
[4] Weinstein. No Date. “Why Are Soft Stories
Inherently Weak” August 2012
[5] “Structural Engineers Association of
California.1999, Seismic Design Manual.
Vol I”

International Journal of Science and Engineering Applications
Volume 8–Issue 11,476-484, 2019, ISSN:-2319–7560
www.ijsea.com 476
Analysis and design of spun pile Foundation of Sixteenth Storyed Building in cohesion
less soil
Chan Myae Kyi
Department of Civil Engineering
Technological University (ThanLyin)
Yangon, Myanmar
Dr.Nyan Phone
Professor and Head
Department of Civil Engineering
Technological University (ThanLyin)
Yangon, Myanmar
Abstract – This aim of the paper is the study on the analysis and design of spun pile
foundation in cohesion less soil. This foundation describes the axial force, bending
moment, lateral deflection due to seismic load, pile working load and settlement. The pile
working load compares the result of pile applying load by analyzing ETAB software. The
two results of pile settlement are gained by using Brom:s method and by analyzing ETAB
software. To design the foundation, the super structure of sixteenth storeyed R.C building
with basement is analyzed by applying E-tab software. According to the result of
unfactored load of superstructure, the same number of pile is divided into four groups.
Allowable bearing capacity is gained from the soil report of Inya Lake Residence Project
in Yangon. The allowable bearing capacity of soil is calculated by Myerhof’s and SPT
methods. The size of spun pile is used outside diameter 16″ and thickness 3″ slender shape.
The pile working load from materials for spun pile is 60 tons. The required length for 60
tons spun pile regard to 85 ft according to calculation of the allowable bearing capacity
.The analyzing result and calculations of deflection and settlement is lesser than the
allowable limits. The analysis and design of spun pile foundation in cohesion less soil is
available for the sixteenth storeyed building.
Keywords – Design of superstructure, spun pie foundation, deflection, settlement and working load.
I. INTRODUCTION
Pile foundation is the part of a structure used
to carry the applied column load of a super
structure to the allowable bearing capacity of
the ground surface at the same depth. The
common used shape of pile is rectangular and
slender which applied the load to the stratum
of high bearing capacity. In the case of heavy
construction, the bearing capacity of shallow
soil will not be satisfactory; the construction
should be built on pile foundation. It is used
where soil having low bearing capacity respect
to loads coming on structure or the stresses
developed due to earthquake cannot be
accommodated by shallow foundation. To
obtain the most economical and durable
foundation, the engineers have to consider the
super structure loads, the soil

International Journal of Science and Engineering Applications
Volume 8–Issue 11,476-484, 2019, ISSN:-2319–7560
www.ijsea.com 477
condition and desired to tolerable settlement.
Pile foundations are convened to construct the
multi-storeyed building and work for water,
such as jetties as bridge pier. The types of
prestressed concrete pile are usually of square,
triangular, triangle, circle and octagonal
section which are produced in suitable length
in one meter interval between 3 and 13 meters.
Nowadays, most people use spun pile
foundation addition to precast concrete pile to
construct most of the buildings and bridges.
Spun pile is one of the types of piles are widely
used in the world construction. Prestressed
concrete cylinder pile is a special type of
precast concrete pile with a hollow circular
cross section. Advantage of using spun pie are
spun pile is less permeable than reinforced
concrete pile, thus it has a good performance
in marine environment. So the design of two
pile foundation can be based on the deflection
and settlement due to earthquake.
II. PREPARATION FOR
ANALYSIS OF PILE
FOUNDATION Information of structure and material properties
are prescribed as follows. Dead load, live load,
wind load and earthquake loads are considered in
proposed building. The typical beam plans and 3D
view of the proposed buildings from ETABs
software are shown in Figure 1 and Figure 2.
A. Site location and Profile of structure Type of Structure : 16-storeyed R.C Building
Location : Seismic zone (4)
Soil Type : Silty Sand, SD
Type of Occupancy : Residential
Shape of Building : Rectangular shape
Size of Building : Length = 81 ft
: Width = 73 ft
: Height =162 ft
Height of Building: Typical story height = 10 ft
: Bottom story height = 12 ft
B. Design Codes Design codes applied for superstructure are ACI
(318-99) and UBC-97. There are 26 numbers of
Load combinations which are accepted for beam,
column, etc.
(1)Material Properties
Analysis property data
Weight per unit volume of concrete = 150 pcf
Modulus of elasticity = 3.12 x 10⁶
Poisson’s ratio = 0.2
Design property data
Reinforcing yield stress (fy) = 50000 psi
Shear reinforcing yield stress (fy) = 50000 psi
Concrete cylinder strength (f′c) = 3500 psi
C. loading Considerations The applied loads are dead loads, live loads,
earthquake load and wind load.
(1) Gravity Loads: Data for dead loads which are
used in structural analysis are as follows;
Unit weight of concrete = 150 pcf
4½ inches thick wall weight = 50 psf
9 inches thick wall weight = 100psf
Light partition weight = 20 psf
Finishing Weight = 20 psf
Weight of elevator = 2 ton
Data for live loads which are used in structural
analysis are as follows:
Live load on slab = 40 psf
Live load on lift = 100 psf
Live load on stairs = 100 psf
Live load on corridors = 60 psf
Live load on roof = 20 psf
Weight of water =62.4 pcf
(2)Lateral loads: Data for wind loads which are
used in structural analysis are as follows;
Exposure Type = B
Basic wind velocity =100mph
Important factor, Iw = 1.0
Windward Coefficient = 0.8
Leeward Coefficient = 0.5
Data for earthquake load are as follows:
Soil profile type = SD

International Journal of Science and Engineering Applications
Volume 8–Issue 11,476-484, 2019, ISSN:-2319–7560
www.ijsea.com 478
Seismic Zone = 2A
Seismic Zone Factor = 0.2
Building period coefficient, Ct = 0.03
Important Factor, I = 1
Seismic coefficient, Ca = 0.28
Seismic coefficient, Cv = 0.4
(3)Lateral Load Combination: According to (ACI
318-99) codes, the design of load combination are
as follows:
1. 1.4 DL
2. 1.4 D + 1.7 LL
3. 1.05DL + 1.275LL + 1.275WX
4. 1.05DL + 1.275LL – 1.275 WX
5. 1.05DL + 1.275LL + 1.275 WY
6. 1.05DL + 1.275LL - 1.275 WY
7. 0.9DL + 1.3 WX
8. 0.9DL -1.3 WX
9. 0.9DL + 1.3 WY
10. 0.9DL - 1.3 WY
11. 1.05DL + 1.28LL + EX
12. 1.05DL + 1.28LL - EX
13. 1.05DL + 1.28LL + EY
14. 1.05DL + 1.28LL - EY
15. 0.9DL + 1.02 EX
16. 0.9DL - 1.02 EX
17. 0.9DL + 1.02 EY
18. 0.9DL - 1.02 EY
19. 1.16DL + 1.28 LL + EX
20. 1.16DL + 1.28 LL - EX
21. 1.16DL + 1.28 LL + EY
22. 1.16DL + 1.28 LL – EY
23. 0.79DL + 1.02 EX
24. 0.79DL - 1.02 EX
25. 0.79DL + 1.02 EY
26. 0.79DL - 1.02 EY
III.DESIGN RESULTS OF PROPOSED
BUILDING
The design results of beam and column for
proposed building are described
TABLE I DESIGN RESULTS FOR
COLUMN, BEAM AND SLAB
Figure.1 3D Model of Proposed Building
Section Size
Column
28″× 28″, 26″×26″, 24″×24″,
22″×22″, 20″×20″, 18″×18″,
16″×16″, 14″×14″, 12″×12″
Beam
9″×9″, 9″×12″,
10″×12″,12″×16″, 12″×18″,
12″×20″,14″×18″,14″×20″
Slab 4″ thick, 4.5″ thick and 5″thick
Wall 12″ thickness and 14″ thickness

International Journal of Science and Engineering Applications
Volume 8–Issue 11,476-484, 2019, ISSN:-2319–7560
www.ijsea.com 479
Figure.2 Beam and Column Layout Plan
IV. STABILITY OF THE
SUPERSTRUCTURE
CHECKING
The design superstructure is checked for
(1) Overturning,
(2) Sliding
(3) Story Drift
(4) Torsional Irregularity
(5) P-∆ Effect
All checking for stability of superstructure are
within the limits.
TABLE II STABILITYCHECKING
The superstructure of sixteenth storeyed building
with basement is available by checking five
methods.
TABLE III SOIL PROPERTIES
The allowable bearing capacity ( Qult )all is
calculated by Myherhof’s method.
Checking X-
direction
Y-
direction
Limit
Overturning
Moment
14.03 11.51 ˃ 1.5
Sliding
Resistance
4.81 4.81 ˃ 1.5
Story Drift 0.22 0.26 ˂ 2.4
Torsional
Irregularity
1 1 ˂ 1.2
P-∆ Effect 0.001 0.01 ˂ 0.1
Depth
(m)
N
(Blow/
m)
ᵞsat
(KN/
m2)
Nq (ф′)
( ̊ )
бvo
(KN/m3)
4.50 7 9.95 0 0 44.775
6.00 7 10.53 0 0 60.57
7.50 7 10.98 8 28 77.04
9.00 13 10.48 8 28 92.76
10.50 5 7.98 0 0 104.73
12.00 8 7.98 0 0 116.7
13.50 9 7.98 0 0 128.67
15.00 14 8.65 0 0 141.64
16.50 21 9.76 10 30 156.28
18.00 29 9.76 12 31 170.92
19.50 28 9.76 12 31 185.56
21.00 26 9.76 10 30 200.20
22.50 23 9.76 10 30 214.84
24.00 24 9.76 10 30 229.48
25.5 28 9.76 12 31 244.12
27 10 8.45 0 0 257.55
28.5 23 10.36 10 30 273.09
30 17 10.36 10 30 288.63

International Journal of Science and Engineering Applications
Volume 8–Issue 11,476-484, 2019, ISSN:-2319–7560
www.ijsea.com 480
Figure3.Point Levels from load of superstructure
TABLE VI GROUPS OF UNFACTORED
COLUMN LOAD
V. Pile working load from
Material
(Outside diameter = 16 inches, thickness =3
inches slender pile.)
Shear reinforcing yield stress (fy) = 50000 psi
Concrete cylinder strength (f′c) = 4000 psi
Modulus of elasticity = 3.37 x 10⁶
фPT= 0.7 ( 0.33 f′c Ac + 0.39 fyAst)(ACI318-99)
= 0.7 (0.33 × 4000 × 122+ 0.39 × 50000 × 10
× 0.31)
= 155043 lbs.
= 69 Tons
0.86фPT = 0.86 × 69
= 59.34 Tons (Use 60 Tons)
According to CQHP Guideline
Up to 10,000 ft² Area – one bore hole for 2,500
ft²(min) ≥ Two bore hole
For this project,
Project area = 81′-0″ × 73′-0″
= 5913 ft²
Three bore holes are adequate.
The results of unfactored load are received by
applying ETAB software. The base point levels
of super structure are described in Figure3.
The group 1 is applied in bore 1, Group 2 in bore
hole2 And Group 3 in bore hole 3 and Group 3 in
bore hole 2.
The allowable bearing capacity Qult = 618.68
KN (in bore hole 1)
The allowable bearing capacity Qult = 608.06
KN (in bore hole2)
The allowable bearing capacity Qult = 633.02
KN (in bore hole 3)
The analysis results of spun pile foundation are
described as the pile layout plan in Figure 4.
Group
of
Spun
Pile
Points Range Maximum
Unfactored
Load
Cont
rol
Poin
t
1 113,114 300-
500
306.02 4
2 1,4,7,9,20
,21
500-
700
611.81 36
3 2,3,5,6,8,
10,11,12,
13,14,15,
17,18,19,
23,24,25,
26,27
1007.33 1007.33 207
4 SW 4028.47 4028.47 54

International Journal of Science and Engineering Applications
Volume 8–Issue 11,476-484, 2019, ISSN:-2319–7560
www.ijsea.com 481
Figsure4. Spun pile layout plan
VI. Design of Pile Group 1 (Spun
concrete pile)
The results of settlement are calculated by
Brom’s method to compare the software results.
Unfactored load = 611.8 kip
Assume pile cap thickness = 3 ft
B = 6ft
Pile cap weight = 3 × 6 ×4×0.15
= 10.8 kips
Total weight of pile group = 611.81 + 10.8
= 622.61 kips
Load per pile = 622.61
6
=103.7kip˂146kips
(b) Allowable bearing capacity of pile group
The ultimate bearing capacity of the pile group in
cohesion less soil is at least equal to the sum of
individual pile capacities.
Pile group capacity, (QG)ult = n×(Qx) ult
= 16×410.075
= 2460.45 kips
(QG)all = (QG)ult/F.S
= 2460.45
3
= 820.15kips
The group capacity is 820.15 kips, which is greater
than the loads 622.61 kips on the pile group.
Therefore, it is acceptable from a bearing capacity
point of view.
(c) Settlement of pile
Semi-empirical method is used. To calculate the
settlement
Total load on pile group = 622.61 kips
Qp = 85.47 kips
Qpa = 85.47
3 = 28.49 kips
Qf = 324.6 kips
Qfa = 324.6
3 = 108.2 kips
Total allowable load, (Qv)all = 136.69 kips
When actual load on each pile is 103.7 kips.
v
Load per pile x
(Q )pat pa
all
Q Q
= 28.49× 103.77
136.69
= 21.63 kips
v
Load per pile x
(Q )fa fa
all
Q Q
= 108.2 × 103.77/136.69
= 82.14 kips
L = 85 ft
ἀs = 0.55
B = 16 in

International Journal of Science and Engineering Applications
Volume 8–Issue 11,476-484, 2019, ISSN:-2319–7560
www.ijsea.com 482
Ap = 1.38 ft2
Ep = 3.37 × 10⁶ psi for concrete
Cp = 0.02 ( Table)
qp = Q/A
= 85.47/1.38
= 61.93 k/ft2
0.93 0.16s p
LC C
D
= 0.066in
( )pa fa
s
p p
Q Q LS
A E
= 0.1in
Sp = CsQfa/Lqp = 0.12
s fa
ps
p
C QS
Lq
= 0.01 in
St =Ss + Sp +Sps
= 0.1+ 0.12 + 0.01
= 0.23 in ˂ 1 in (satisfied)
(ii) Empirical method
St = 𝐵
100 +
𝑄𝑢𝑎𝐿
𝐴𝑝𝐸𝑝
St = 0.31 in
The results obtained from these methods are
compared and then higher value 0.2 in is chosen.
Therefore, the settlement of pile group is
SG = St √(b̅/B)
= 0.31 √(24/10)
= 0.37 ˂ 1 in
TABLE V COMPARISON OF LOAD OF
GROUP PILE
Spun
Pile
Pile
No
(QuG)all Total load
on pile
group
Group 1 4 413.56 312.43
Group 2 6 820.15 640.61
Group 3 9 1251.71 1028.93
Group 4 54 22530.84 4190.47
TABLE VI COMPARISON OF DESIGN OF
PILE CAP
Spun
Pile
No
of
Pile
L (ft.) B(
ft.)
Thickness
(ft.)
Group
1
4 4 4 2.67
Group
2
6 6 6 4
Group
3
9 6 6 4
Group
4
54 18 12 5

International Journal of Science and Engineering Applications
Volume 8–Issue 11,476-484, 2019, ISSN:-2319–7560
www.ijsea.com 483
TABLE VII DESCRIPTION OF
DEFLECTION, SETTLEMENT & LOAD
Deflection Settlement
Load
X Y Broom
’
metho
d
ETA
B
softw
are
Appli
ed
Load
Wo
rkin
g
load
GP
1 0.13 0.11 0.33 0.04 54.91 60
GP
2 0.15 0.18 0.37 0.5 10 60
GP
3 0.2 0.18 0.41 0.3 51.63 60
GP
4 0.16 0.14 0.41 0.38 54.86 60
Figure5. Comparison of X & Y direction of
spun pile foundation
Figure6. Comparison settlement of spun pile
foundation
Figure7. Comparison pile working load and
applied load of spun pile foundation
VII. DSICUSSION AND
CONCLUSION
For the design of spun pile foundation, the
required soil parameters are obtained from the soil
report on, Yangon. The allowable bearing capacity
of the soil is calculated by Tomlinsom, Myerhof in
Rules of Thumb and SPT methods. The soil
condition of the proposed building at the base of
mat foundation is soft soil. The proposed site is
located on seismic zone 2A. The superstructure is
analyzed and designed by using ETAB software.
The lateral load and gravity loads are considered
and the design superstructure is checked for
sliding resistance, overturning effect, story drift,
and torsional irregularity. The sum of critical
unfactored loads from superstructure is 29867.01
kip. In design of spun pile foundation the use of
the same number of pile divided into four groups.
The required pile length for four groups of two pile
foundations is 85 Ft. The deflection of two pile
foundations is satisfied. The calculated settlement
of group1, 3,4 by using Brom’s method are greater
than ones from ETAB software and group 2
settlement is less than one In comparison two
results of settlement for spun pile foundation
these are more satisfactory than the
Allowable limits. The deflections of two
directions are less than the allowable limits. The
applied load of
spun pile foundation are more responsible than the
working load. Finally, the spun pile foundations
are accepted to support the proposed sixteenth-
storey R.C building with basement.
0
0.1
0.2
0.3
0.4
0.5
GP1 GP2 GP3 GP4
X DIRECTION
Y DIRECTION
0
0.2
0.4
0.6
GP 1 GP2
Gp 3 Gp 4
Sett:(Borm's)
Sett: (Etab)
0
20
40
60
80
GP1 GP2 GP3 GP4
Appliedload
WorkingLoad

International Journal of Science and Engineering Applications
Volume 8–Issue 11,476-484, 2019, ISSN:-2319–7560
www.ijsea.com 484
ACKNOWLEDGMENT
First of all, the author is thankful to Dr. Theingi,
Rector of Technological University (Thanlyin),
for her valuable management. The author would
like to express my deepest thanks and gratitude to
her supervisor Dr. Nyan Phone, Professor and
Head of the Department of Civil Engineering of
the Technological University (Thanlyin). The
author special thanks go to her co-supervisor Daw
Myat Thidar Tun, Lecturer of the Department of
Civil Engineering of the Technological University
(Thanlyin), for his invaluable advice and
suggestion throughout the study. The author
would like to express her thanks to her member
Daw Wint Thandar Aye, Assistant Lecture of the
Department of Civil Engineering of Technological
University (Thanlyin), for her valuable comments
and guidance during this study. Finally, her special
thank goes to all who help her with necessary
assistance for this study.
REFERENCES
[1] Foundation Design and Construction MJ
Tomlinson (Seventh Edition) 3. Taranth Pile
[2] Design and Construction Practice –
Tomlinson.
[3] Foundation Analysis and Design – Joseph E.
Bowles (Fifth Edition
[4] Principles of Foundation Engineering –
Braja M. Das ( Adapted International Student
Edition)
[5] Geotechnical Engineering Calculations and
Rules of Thumb Nilson, A.H., and Winter,
G.1991
[6] Das, Braja M. 1998. ″Principles of
Foundation Engineering″. Fourth Edition.
United State of America.
[7] Day, R.W: Foundation Engineering
Handbook, Design and Construction with the
2006 International Building Code, The
McGraw- Hill Companies, Inc, (2006).
[8] FHWA HI 97-013, Design and Construction
of Driven Pile Foundation

International Journal of Science and Engineering Applications
Volume 8–Issue 11,485-491, 2019, ISSN:-2319–7560
www.ijsea.com 485
Study on Effects of Opening Patterns in Shear wall on
Setback building
Han Su Yin win
Department of Civil Engineering
Technological University
(Thanlyin)
Yangon, Myanmar
Kyaw Lin Htat
Department of Civil Engineering
Technological University
(Thanlyin)
Yangon, Myanmar
Ni Ni Moe Kyaw
Department of Civil Engineering
Technological University
(Thanlyin)
Yangon, Myanmar
Abstract: This ar t icle presents the effects of opening on shear wall for thirteen-storeyed U shape RC building,
which is situated in seismic zone (4).This structure is setback building. The elevations and plans of this structure
are irregularity in shape. Special moment resisting frame is considered in this structure. This structure is analyzed
under dead load, live load, wind load, earthquake load and all necessary load combinations are considered by using
UBC 97. The modeling and analyzing of each member is done by ETABS 16.0.3. All of structural members are
designed by ACI 318-14. Response spectrum analysis is used for dynamic analysis. First, the proposed building is
analysed and design by using ETABS software. The shear wall of proposed building is opened with various
percentage of opening and three different patterns. There are three types of patterns opening patterns (center
0pening,staggered opening and two vertical opening).The size of openings of shear wall are 13.6%, 25% and 35%
of shear wall area. This article include comparative study of storey displacement, storey shear and storey moment
under seismic force due to three configurations of openings in shear walls. According to the comparisons of these
results, the maximum structural response is occurred at the structure having shear wall is with two vertical
opening.
Keywords: seismic zone 4; setback; opening; response spectrum; shear wall
1.INTRODUCTION We Nowadays,a large number of tall buildings are emerged
due to the growth of populations. The highly function of
vertical structure elements is to resist not only the gravity
loading from the weight of the buildings but also the lateral
load such as wind and possible earthquake loads. When these
forces are acting on the structure, high shear forces and
bending moments in structural members are causing the
failure of the structure. Irregularities of plan and elevation
give to damage the structural members. Shear wall is a wall
column designed to resist the lateral loads.The strength of the
shear wall depends on the type, size and use of materials. To
attain a structure with sufficient strength and ductility to
assure life safety, it is necessary to know about the
configuration of opening of shear wall
2. DATA PREPARATION FOR
PROPOSED BUILDING
All loadings on superstructure are considered according to
UBC-97.Required loads and structural configurations of the
proposed building are as follow:
2.1Site Location and Structural Framing
System
Type of building : Thirteen-Storeyed RC building
Shape of building : U-shape ( Vertical Irregular)
Location : Seismic zone 4
Type of occupancy : Commercial (Hotel)
Size of building :Length =131ft
Width =106.5ft Height of building
Typical storeyed height =12ft
Base to GF Storeyed height =10ft
GF to1st Storeyed height =16ft
1st to2nd storyed height =14ft
Overall height from ground floor =181ft
2.2 Material properties and design property
data used for the proposed building
Modulus of elasticity , Ec = 3604 ksi
Poisson’s ratio , = 0.2
Coefficient of thermal expansion = 5.5 x 10⁻⁶
in / in per degree F
Bending reinforcement yield stres (fy) = 50ksi Shear
reinforcement yield stress (fys
) = 50ksi Concrete cylinder
strength (f′c) = 4ksi
2.3. Loading Consideration Two kind of loads are considered in this study, which is
gravity load, that include dead and live load, lateral load that
include wind and earthquake load
2.3.1 Dead Load The weight of all material and fixed equipments
incorporated into the building are considered as dead load.

International Journal of Science and Engineering Applications
Volume 8–Issue 11,485-491, 2019, ISSN:-2319–7560
www.ijsea.com 486
Consideration of dead loads for proposed building are as
follows:
4.5" thick brick wall = 55 lb/ft2
Unit weight of concrete = 150 lb/ft3
Superimposed dead load = 25 lb/ft
2.3.2 Live load Live loads are gravity load produced by the used and
occupancy of the building and do not include dead loads,
construction loads, or environmental loads such as wind and
earthquake loadings are based on to UBC-97.
Unit weight of water = 62.4 lb/ft3
Live load on floor area = 40 lb/ft2
Live load on roof = 20 lb/ft2
Live load on stair case = 100 lb/ft2
Live load on lift = 100 lb/ft2
2.3.3 Wind Load
The wind pressure on a structure depends on the wind
response of the structure. Required Data in designing for wind
load:
Exposure type = Type B
Basic wind velocity = 80 mph
Total height of building = 181 ft
Windward coefficient = 0.8
Leeward coefficient = 0.5
Importance Factor = 1.0
2.3.4 Earthquake Load
The purpose of seismic design is to proportion the structures
so that they can withstand the displacements and forces
induced by the ground motion.
Seismic zone = 4
Seismic Source Type = A
Soil Type = SD
Structure =Special Moment Resisting Frame
Seismic Response Coefficient, Ca = 0.44 Na
Seismic Response Coefficient, Cv = 0.64 Nv
Near Source factor, Na = 1
Near Source factor, Nv = 1
Zone Factor = 0.4
Importance Factor, I = 1.0
Response Modification Factor, R = 8.5
CT value = 0.03
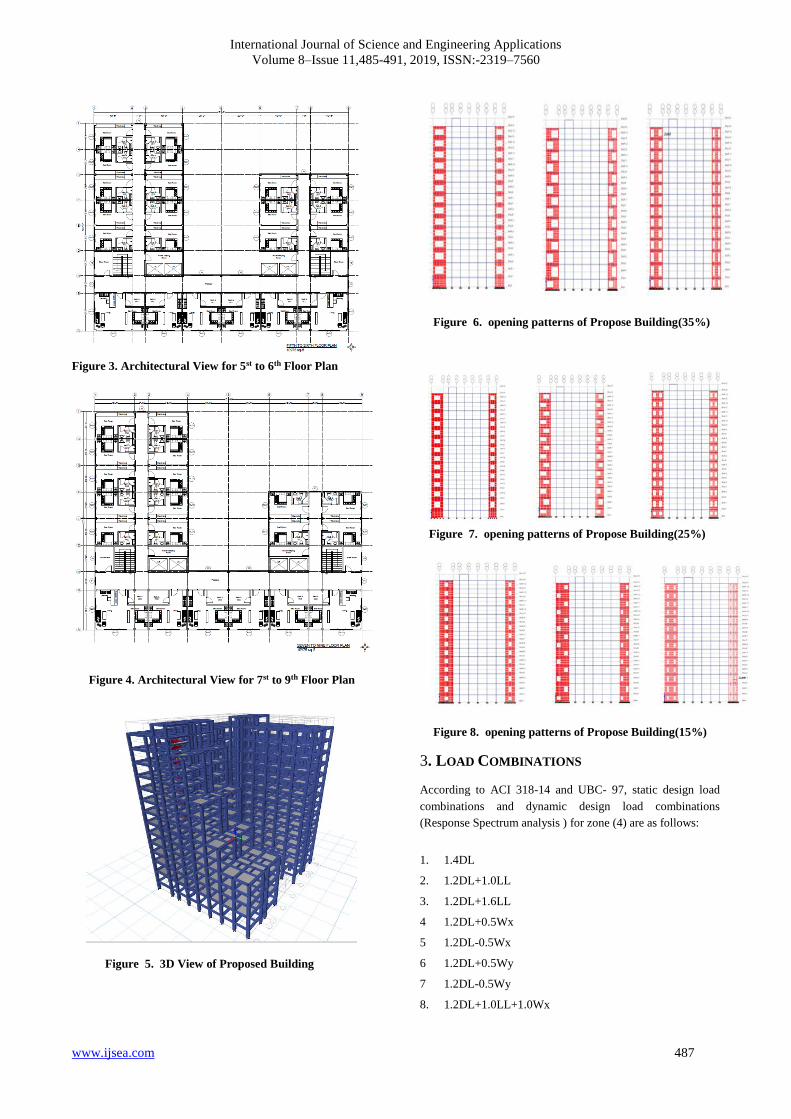
2.4. Modeling of Proposed Building
Architectural view for ground floor plans, fifth to sixth
floor plan, seventh to nine floor plan, tenth to twelve floor
view and three dimensional view (3D) of proposed building
are shown in Figure 1, 2, 3, 4, and 5 respectively. Figure 6 ,7
and 8shows the sample opening pattern of the shear wall.
Figure 1. Architectural View for Ground Floor Plan
Figure 2. Architectural View for 1st to 4th Floor Plan
International Journal of Science and Engineering Applications
Volume 8–Issue 11,485-491, 2019, ISSN:-2319–7560
www.ijsea.com 487
Figure 3. Architectural View for 5st to 6th Floor Plan
Figure 4. Architectural View for 7st to 9th Floor Plan
Figure 5. 3D View of Proposed Building
Figure 6. opening patterns of Propose Building(35%)
Figure 7. opening patterns of Propose Building(25%)
Figure 8. opening patterns of Propose Building(15%)
3. LOAD COMBINATIONS
According to ACI 318-14 and UBC- 97, static design load
combinations and dynamic design load combinations
(Response Spectrum analysis ) for zone (4) are as follows:
1. 1.4DL
2. 1.2DL+1.0LL
3. 1.2DL+1.6LL
4 1.2DL+0.5Wx
5 1.2DL-0.5Wx
6 1.2DL+0.5Wy
7 1.2DL-0.5Wy
8. 1.2DL+1.0LL+1.0Wx

International Journal of Science and Engineering Applications
Volume 8–Issue 11,485-491, 2019, ISSN:-2319–7560
www.ijsea.com 488
9. 1.2DL+1.0LL-1.0Wx
10. 1.2DL+1.0LL+1.0Wy
11. 1.2DL+1.0LL-1.0Wy
12. 0.9DL+1.0Wx
13. 0.9DL-1.0Wx
14. 0.9DL+1.0Wy
15. 0.9DL-1.0Wy
16. 1.2DL+1.0LL+1.0EQX
17. 1.2DL+1.0LL-1.0EQX
18 1.2DL+1.0LL+1.0EQY
19 1.2DL+1.0LL-1.0EQY
20 0.9DL+1.0EQX
21 0.9DL-1.0EQX
22 0.9DL+1.0EQY
23 0.9DL-1.0EQY
4. Modeling the Structure with Static
Analysis The column section, beam sections and shear wall sizes of the
proposed building with static analysis are shown in Table 1
and 2. Layout plan for beam, and location of shear walls of
the proposed building are shown in Fig 6, 7, 8,9, 10, 11,
12,and 13 respectively
Table 1 Design Section of Columns
Table 2 Design Section of beams
Shear wall thickness is 12 in from base to level 13. The
thickness of slab is 6 in for all room and 7 in for
landing.Function of column C 1 is not only exterior column
but also interior column for all room. Column C2 is only for
lift room.
Figure 9. Beam layout plan
Figure10. Column layout plan
5. Comparing the Results
The results of openings are compared form the following
figures.Figure,11,12,13,14,15 and 16 are the comparing
results of 13.6% opening in storey displacement, shear and
moment.
Beam Name Type Section
(in × in)
B1 Main Beam 14 × 20
B2 Main Beam 12 × 15
B3 Main Beam 10 × 12
B4 Main Beam 9× 12
SB Secondary Beam 9 × 12

International Journal of Science and Engineering Applications
Volume 8–Issue 11,485-491, 2019, ISSN:-2319–7560
www.ijsea.com 489
Figure11. Comparing the results of storey displacement in
X direction with 13.6% opening
Figure12. Comparing the results of storey displacement in
Y direction with 13.6% opening
Figure13. Comparing the results of storey shear in X
direction with 13.6% opening
Figure14. Comparing the results of storey shear in Y
direction with 13.6% opening
Figure15. Comparing the results of storey moment in X
direction with 13.6% opening
Figure16. Comparing the results of storey moment in Y
direction with 13.6% opening
Figure17. Comparing the results of storey displacement
in X direction with 25% opening
Figure18. Comparing the results of storey displacement in
Y direction with 25% opening
Figure19. Comparing the results of storey shear in X
direction with 25% opening
Figure20. Comparing the results of storey shear in Y
direction with 25% opening

International Journal of Science and Engineering Applications
Volume 8–Issue 11,485-491, 2019, ISSN:-2319–7560
www.ijsea.com 490
Figure21. Comparing the results of storey moment in X
direction with 25% opening
Figure22. Comparing the results of storey moment in Y
direction with 25% opening
Figure23. Comparing the results of storey displacement in
X direction with 35% opening
Figure24. Comparing the results of storey displacement in
Y direction with 35% opening
Figure25. Comparing the results of storey shear in X
direction with 35% opening
Figure26. Comparing the results of storey shear in Y
direction with 35% opening
Figure27. Comparing the results of storey moment in X
direction with 35% opening
Figure28. Comparing the results of storey moment in Y
direction with 35% opening
from the above figures, figure17,18,19.20,21 and 22 are the
comparing results of 25% opening in storey displacement,
shear and moment .And,figure,23,24,25,26,27 and28 are the
comparing results of 35% opening in storey displacement,
shear and moment.
6. Conclusion
In this study, the proposed building is vertical irregularities
(setback) U-shape building. The shear wall is situated in Y
direction of the structure .So the results of the structure is
clearly different in X direction and the results of the structure
in Y direction is nearly the same.
In comparison of analysis of results, the maximum value of
storey displacement and minimum value of storey shear and
moment at the two vertical opening of the structure.And
minimum value of storey displacement and maximum value
of storey shear and moment are occurred at center opening .
So it can be considered that the center opening is more
suitable than the other opening pattern (staggered and two
vertical). And two vertical opening is not suitable for the
opening in shear wall structure.
ACKNOWLEDGMENT
The author of this paper would like to thank Dr. Thein Gi,
Rector, Technological University (Thanlyin) for her kind
permission to carry out this research work. The author is also
thank to Dr Nyan Phone, Professor, Head of the Department
of Civil Engineering of Technological University (Thanlyin)
.The author special thanks to her supervisor Dr. Kyaw Lin
Htat, Professor, Department Civil Engineering of the
Technological University (Thanlyin) for his invaluable advice
and suggestion to carry out this experimental work. The
author would like express my deepest thanks to all who help
her with necessary assistance for this study
International Journal of Science and Engineering Applications
Volume 8–Issue 11,485-491, 2019, ISSN:-2319–7560
www.ijsea.com 491
REFERENCES
[1] Uniform Building Code, Volume 2. "Structural Engineering
Design Provisions". 1997, 8th Ed. International Conference of Building Officials
[2] Prutha Vyas, “Behaviour of Moment Resisting Frame and
Shear wall-Frame Structure,” International Journal of Innovative and Emerging Research in Engineering Volume 3,
Issue 4.
[3] Nilson, A.H., and Winter, G.1991. Design of Concrete Structures.11th eed. Singapore. McGraw Hill, Inc.
[4] Taranth, B.S.1998. Structural Analysis and Design of Tall
Buildings. Singapore: McGraw. Hill Book Company.
[5] Neuenhofer, A. 2006. Lateral stiffness of shear walls with
openings. Journal of Structural Engineering. ASCE ,132
(11):1846-1851
International Journal of Science and Engineering Applications
Volume 8–Issue 11,492-497, 2019, ISSN:-2319–7560
www.ijsea.com 492
IoT Concept for Animal Detection Using ANN to Prevent
Animal Vehicle Collision on Highways
Kalaivanan Sugumar
SRM Institute of Science and Technology
Chennai, India
Amrutham Suresh Kumar
SRM Institute of Science and Technology
Chennai, India
Abstract: Being in a world where wildlife animals are becoming extinct and remaining getting run over by vehicles while crossing
through the roads, this paper proposes an IoT concept to prevent animal-vehicle collision on highways and roads in reserve areas.
Electric fencing being a huge threat to animal’s life our paper brings in a great replacement of this electric fencing by giving alerts
through smart phones and huge LED displays placed across the major places where animals are found to cross the roads. This paper
uses two major algorithms such as the motion detection algorithm with the sensors and object recognition algorithm using artificial
neural networks. In this paper we have used the motion detection PIR sensor to detect the animal movement near roads and the ANN
for object recognition. Once the motion is detected the object recognition algorithm recognizes whether the motion detected was due to
an animal movement or any other factors. If it is because of an animal movement it sends alerts through the LED signage boards and to
the android application which uses Google maps to show alerts on the corresponding area through MQTT. This paper achieves object
recognition accuracy of up to 91%.
Keywords: ANN (Artificial Neural Networks), IoT, PIR, MQTT, Object recognition
1. INTRODUCTION As the world is evolving towards ‘smart’ technologies
approaching anything with smart technology is the smartest
way. This paper proposes an IoT concept to prevent animal-
vehicle collison by using various sensors and image
processing algorithms. In certain highways and in roads that
go through the reserve areas various wildlife animals are
present and they tend to cross the roads. Animals are unaware
of the vehicle movement so does the vehicle drivers. Each
year thousands of animals get hit by vehicles and die. Hence
we developed an approach to prevent this from happenning or
atleast the numbers can be reduced to a huge amount.
On various bench marking analysis we have proposed that
PIR (Passive Infrared) sensors can be used for motion
detection. Which helps us to find any movement in that
premises. In order to confirm that movement is due to an
animal and not any external factors we use the IP cameras
which uses image recognition algorithm to confirm that it is
an animal.
Having confirmed the presence of animals a message is sent
through huge LED displays and alerts through google maps
who are using it on the premises.
2. ANALYSIS OF ANIMAL VEHICLE
COLLISION
Our paper proposal was initiated with the depth analysis of
animal vehicle collision across the world. Various statistical
data was analysed and based on the results the we have
included certain additional algorithms to our approach in
order to prevent the animal vehicle collision to the maximum.
Folllowing are few of the statistics that has been analyzed.
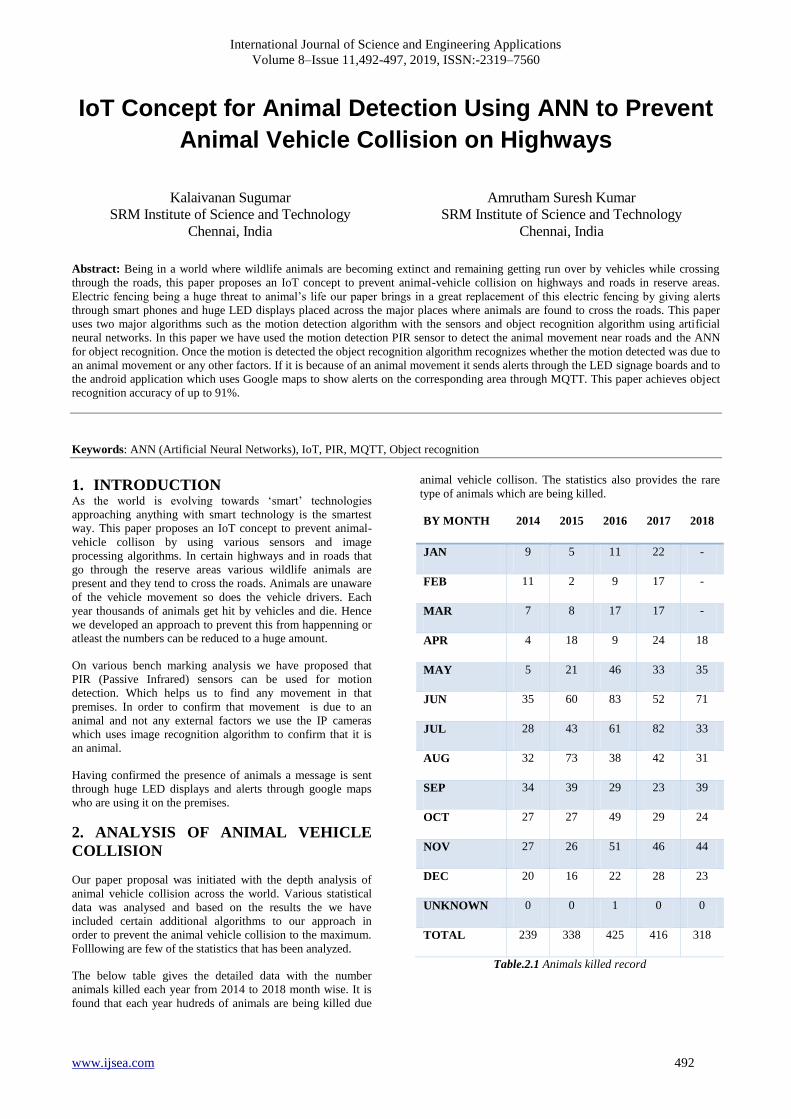
The below table gives the detailed data with the number
animals killed each year from 2014 to 2018 month wise. It is
found that each year hudreds of animals are being killed due
animal vehicle collison. The statistics also provides the rare
type of animals which are being killed.
BY MONTH 2014 2015 2016 2017 2018
JAN 9 5 11 22 -
FEB 11 2 9 17 -
MAR 7 8 17 17 -
APR 4 18 9 24 18
MAY 5 21 46 33 35
JUN 35 60 83 52 71
JUL 28 43 61 82 33
AUG 32 73 38 42 31
SEP 34 39 29 23 39
OCT 27 27 49 29 24
NOV 27 26 51 46 44
DEC 20 16 22 28 23
UNKNOWN 0 0 1 0 0
TOTAL 239 338 425 416 318
Table.2.1 Animals killed record

International Journal of Science and Engineering Applications
Volume 8–Issue 11,492-497, 2019, ISSN:-2319–7560
www.ijsea.com 493
Fig.2.1 Animal Vehicle collision chart
TYPE OF
ANIMAL
NUMBER OF
ANIMALS
YEAR
Bear 4
2018
Bighorn 1
Cat 2
Coyote 3
Deer 220
Dog 1
Elk 31
Fox 2
Lion 4
Moose 3
Pheasant 1
Rabbit 1
Raccoon 4
Skunk 2
UNK 39
Table2.2 Type of animal dead by animal-vehicle collision
Based on the above statistics we infer huge number of animals
become victims of animal-vehicle collision. Hence our paper
proposes the method to reduce the number of deaths caused
by animal-vehicle collision to the maximum and preserve the
nature with a technical and smart approach.
To implement this approach specific locations which are
considered as animal crossing zone are chosen.
The Fig.2.2(a) shows the alert signage boards on highways
denoting moose crossing for next 5 kms. Zones similar to this
are chosen across all states in a country and the project can be
implemented.
(a)
(b)
Fig.2.2 (a) Animal crossing alert displays, (b) Deer in a
highway

International Journal of Science and Engineering Applications
Volume 8–Issue 11,492-497, 2019, ISSN:-2319–7560
www.ijsea.com 494
Fig.2.3 Wildlife exclusion system
The British Columbia ministry of transportation and
infrastructure has released a detailed picture of the animal
crossing in highways. This picture also explains the ways in
which the animal jumps out of the fence and a method to
encapsulate by building an underpass for animals and the
warning signs kept on highways.
3. SYSTEM ARCHITECTURE
3.1 SYSTEM ARCHITECTURE
Fig.3.1 Proposed system architecture
The above block diagram illustrates the overview of the
alerting system. There are two major sensors that is being
used in this system they are the PIR sensor and the cameras.
Detailed description of the sensors are explained in the below
sections.
3.1.1 PIR Sensor
A passive infrared sensor (PIR sensor) is an electronic sensor
that measures infrared (IR) light radiating from objects in its
field of view. They are most often used in PIR-based motion
detectors. PIR sensors are commonly used in security alarms
and automatic lighting applications. PIR sensors detect
general movement, but do not give information on who or
what moved. For that purpose, an active IR sensor is required.
Fig.3.2 PIR Sensor
PIR sensors are commonly called simply "PIR", or sometimes
"PID", for "passive infrared detector". The term passive refers
to the fact that PIR devices do not radiate energy for detection
purposes. They work entirely by detecting infrared radiation
(radiant heat) emitted by or reflected from objects. This PIR
sensor is used in our application to detect the movement of
animals.
3.1.2 IP CAMERAS
An Internet Protocol camera, or IP camera, is a type of digital
video camera that receives control data and sends image data
via the Internet. They are commonly used for surveillance.
Unlike analog closed-circuit television (CCTV) cameras, they
require no local recording device, but only a local area
network. Most IP cameras are webcams, but the term IP
camera or netcam usually applies only to those used for
surveillance that can be directly accessed over a network
connection.
3.1.3 LED SIGNAGE BOARD
The LED signage board is used to show alert message when
an animal motion is detected. In this paper we use RS-232
communication port to send message to the board and display
the messages published through MQTT.
3.1.4 NODE
The node here refers to the controller that has been used on
the premises to process the data received from the sensor and
sends alerts to LED signage boards and android applications.
In this paper we are using an ARM based contoller. Following
are the specifications of the ARM based controller.
SoC: Broadcom BCM2837
CPU: 4× ARM Cortex-A53, 1.2GHz
GPU: Broadcom VideoCore IV
RAM: 1GB LPDDR2 (900 MHz)
Networking: 10/100 Ethernet, 2.4GHz 802.11n wireless
Bluetooth: Bluetooth 4.1 Classic, Bluetooth Low Energy
Storage: microSD
GPIO: 40-pin header, populated
Ports: HDMI, 3.5mm analogue audio-video jack, 4× USB 2.0,
Ethernet, Camera Serial Interface (CSI), Display Serial
Interface (DSI).
Fig.3.3 ARM based controller
There can be multiple nodes across the country. Each node
can be named as Node-1, Node-2, Node-3 etc., each node

International Journal of Science and Engineering Applications
Volume 8–Issue 11,492-497, 2019, ISSN:-2319–7560
www.ijsea.com 495
sends alerts to the LED signage boards and android
application through the common communication protocol i.e.,
MQTT.
3.1.5 MQTT
MQTT is a machine-to-machine (M2M)/"Internet of Things"
connectivity protocol. It was designed as an extremely
lightweight publish/subscribe messaging transport. It is useful
for connections with remote locations where a small code
footprint is required and/or network bandwidth is at a
premium. For example, it has been used in sensors
communicating to a broker via satellite link, over occasional
dial-up connections with healthcare providers, and in a range
of home automation and small device scenarios. It is also
ideal for mobile applications because of its small size, low
power usage, minimised data packets, and efficient
distribution of information to one or many receivers.[2]
3.1.6 NODE ARCHITECTURE
Fig.3.4. Node architecture
The fig.3.4 describes the common communication protocol.
Unlike HTTP this protocol communicates with the publish
subscribe basis. The user end subscribes to the particular URL
from where the data has to be received. The node acts the
publisher which publishes the message to the broker this
broker in turn sends the message to the end user who has
subscribed to the node.
4. IMPLEMENTATIONS
4.1 FLOW CHART
Fig.4.1 Flow Chart
The Fig.4.1 describes the flow chart of the whole system.
Firstly the PIR sensor detects any motion on its premises, if
yes it sends the alert to MQTT broker. Similarly the camera
detects if the movement is because of animal movement or
any other external factor. If it recognises animal then it sends
alert to the MQTT broker. This broker in turn publishes the
alert to the LED signage boards and mobile application.
4.2 OBJECT RECOGNITION TECHNIQUE
In this paper we use the object recognition technique to
identify the prescence of animal each and every time when
motion is detected in the premises, an alert is sent to LED
signage board & android application.
In this paper we use the Artificial Neural networks technique
for object rocognition. The neural network is trained with the
data sets of animals and produce result with more than 90%
accuracy. Neural network uses the backpropagation algorithm
to train the datasets.
4.3 MQTT SETUP
In this paper MQTT is used as the common communication
protocol between the user and the end devices/sensors. The
following images describes how to establish a MQTT
connection and publish messages on the subscribed URL.
MQTT FX is the testing tool that is being used to check
publish and subscribe operations.

International Journal of Science and Engineering Applications
Volume 8–Issue 11,492-497, 2019, ISSN:-2319–7560
www.ijsea.com 496
Fig.4.1 MQTT settings
After installing MQTT FX open the connection settings page.
In the settings page we enter the profile name, profile type,
the broker address and the broker port. In this paper we are
using the mosquitto broker. MQTT always uses port 1883 to
listen.
After applying the changes, we connect to the broker. Once it
is connected to the broker the status changes to green color on
top right of the window as shown in Fig.4.2. This denotes that
the broker is listening and its active. When the connection is
lost it turns into red color.
Fig.4.2 MQTT Connection
Fig.4.3 MQTT Subscribe
In Fig.4.3 you see how to subscribe to a particular url. The url
has to be entered and the subscribe button is clicked. Once it
is subscribed the publish tab is used to publish the messages
to the end device.
Fig4.4 MQTT Publish
Fig.4.5 MQTT Message published
The published message can be seen in the fig.4.5.Which
shows
“ALERT ! ANIMAL MOVEMENT DETECTED CAUTION
: DRIVE SLOWLY”
5. RESULTS AND DISCUSSIONS
The results obtained from object detection & MQTT message
publish to the LED signage boards are as shown below. In
Fig.5.3 you can see the accuracy is 0.9158 which is 91.58 %.
And the total network error is diplayed in Fig.5.2
Fig. 5.1 Objet recognition output

International Journal of Science and Engineering Applications
Volume 8–Issue 11,492-497, 2019, ISSN:-2319–7560
www.ijsea.com 497
Fig.5.2 Network error graph
Fig.5.3 Image recognition result (Accuracy)
6. CONCLUSION
In this paper we have deeply analyzed the animal vehicle
collision happening across the world. We have derived at a
solution to prevent animal vehicle collision using IoT. We
have used sensors such as the PIR sensor to detect motion and
IP cameras to recognize the movement of animal. These
sensors having satisfied with the condition sends message to
the MQTT broker which in turn publishes the message to the
LED signage boards placed across the roads which are animal
crossing zone. Our paper uses the MQTT broker in cloud. The
entire client server communication happens through the node.
7. FUTURE SCOPE
Our future scopeis to involve with the development of an
adroid application which comes with maps and shows alert
directly on the maps when the user is moving along the
location. Also when the user crosses one zone to the other
zone MQTT has to be unsubscribed from the current zone and
be subscribed to the next zone, MQTT handoff is one biggest
challenge which has to be addressed in future. Once the above
two objective are developed the entire system has to be
deployed in real time environment.
8. ACKNOWLEDGEMENT
Our thanks to all experts who have contributed to our research
work.
9. REFERENCES
[1] Yunfei Fang, “Motion Based Animal Detection in Areial
Videos” International Conference on Intelligent Computing
2016, 13 – 17.
[2] Wenzhao Feng, “A Novel Saliency Detection Method for
Wild Animal Monitoring Images with WMSN” Journal of
Sensors, Volume 2018, 1 – 11.
[3] Anandha Raja, Ramya, “Prevention of Wild Animals
From Using Image detection and Edge Algorithms” Concepts
Journal of Applied Research, Volume : 03 Issue : 07, July
2018.
[4] Marsel P. Huijser “Animal Vehicle Crash Mitigation
Using Advanced Technology” for Oregon Department of
Transportation Research Unit, Phase I August 2016
[5] Mohammed Sadegh Nouroughsedehz, “Automatically
Identifying, Counting and Describing wild animals in Camera
Trap Images with Deep Learning” Department of Computer
Science, University of Wyoming, April 30, 2018
[6] Alberto Rivas, “Detection of Cattle using Drone and
Convolutional Neural Networks” Journal of Sensors, 27 June
2018
[7] Prof.Sachin Sharma, “A Brief Overview on Different
Animal Detetction Methods” Signal and Image Processing:
An International Journal, Vol.4,No.3, June 2013
[8] “Wildlife Vehicle Collision Reduction Study” Report to
Congress 2008, U.S Department of Transportation, Federal
Highway Administration