comparison of cell, gps, and bluetooth …docs.trb.org/prp/17-05678.pdf · 27 cellular o-d data and...
TRANSCRIPT

COMPARISON OF CELL, GPS, AND BLUETOOTH DERIVED EXTERNAL O-D 1
DATA – RESULTS FROM THE 2014 TYLER, TEXAS STUDY 2 3
4
Edwin N. Hard 5
Texas A&M Transportation Institute 6
TAMU 3135 7
College Station, TX 77843 8
Tel: 979-845-8539; Email: [email protected] 9
10
Byron T. Chigoy 11
Texas A&M Transportation Institute 12
505 E. Huntland Drive, Suite 455 13
Austin, TX 78752 14
Tel: 512-407-1156; Email: [email protected] 15
16
Praprut Songchitruksa, Ph.D., P.E. 17
Texas A&M Transportation Institute 18
TAMU 3135 19
College Station, TX 77843 20
Tel 979-862-3559; Email: [email protected] 21
22
Stephen P. Farnsworth 23
Texas A&M Transportation Institute 24
TAMU 3135 25
College Station, TX 77843 26
Tel: 979-862-4927; Email: [email protected] 27
28
Darrell W. Borchardt, P.E. 29
Texas A&M Transportation Institute 30
701 North Post Oak, Suite 430 31
Houston, Texas 77024 32
Tel 713-686-2971; Email: [email protected] 33
34
Lisa L. Green, Ph.D. 35
Texas A&M Transportation Institute 36
TAMU 3135 37
College Station, TX 77843 38
Tel: 979-458-8799; Email: [email protected] 39
40
41
Word count: 6,148 words text + 5 tables/figures x 250 words (each) = 7,398 42
43
44
45
Submission Date: August 1, 2016 46

Hard, Chigoy, Songchitruksa, et al. 2
ABSTRACT 1 2
This paper documents a first-of-its-kind study conducted by the Texas A&M Transportation 3
Institute (TTI) in coordination with the Texas Department of Transportation (TxDOT) in the 4
spring 2014. The study’s scope was to collect, analyze, and compare external origin-destination 5
(O-D) data for the Tyler Metropolitan Planning Organization (MPO) study area in Texas using 6
Bluetooth technology provided by TTI, cellular data provided by Airsage, and GPS data 7
provided by INRIX. The chief purpose of the study was to determine if cell and GPS data were 8
viable for use in TxDOT’s external surveys so that TxDOT could resume collecting external data 9
for Texas MPOs. The study focused on external-external (E-E) trips, but also provided some 10
results related to external-internal/internal-external (E-I)/(I-E) trips. 11
12
The paper discusses study design, conduct, and the results in terms of the comparison of external 13
trip data derived from Bluetooth, cellular, and GPS sources. The paper describes the TTI 14
Bluetooth data collection, the acquisition of private sector cellular and GPS data, and the 15
sampling and analysis of each data type. The study design included the aggregation of the Tyler 16
MPOs traffic analysis zone system into larger zones and the development of large ‘travel shed’ 17
zones around the periphery of the study area to better accommodate cell data capture. It also 18
included an approximate 10-mile buffer around the study area for GPS data capture. One month 19
of cellular data was acquired for the study that included data for average weekdays and 20
weekends, AM and PM peak data, and 24-hour totals. Three months of pre-processed GPS data 21
from INRIX was acquired for the study. INRIX provided separate data sets for GPS data sources 22
from cars, freight/commercial fleet vehicles, and mobile applications. TTI collected Bluetooth 23
data at 20 external stations for a two-week period and used data from Tuesdays, Wednesdays, 24
and Thursdays to develop average weekday results. 25
26
Based on TTI’s extensive use and experience with Bluetooth technology and E-E data collection, 27
Bluetooth data were used as a benchmark comparison to the cellular and GPS data. The study 28
found that Bluetooth and GPS E-E results were most similar and that cell data under-estimated 29
E-E trips. It also found that GPS O-D data (at the time) had a commercial vehicle bias and 30
researchers suspect that cell data has a non-commercial vehicle bias. The paper provides results 31
of O-D comparisons by technology with the key results summarized in the areas of 1) general 32
findings, 2) E-E trips, and 3) E-I/I-E trips. 33
34
35
Keywords: Bluetooth, cellular, GPS, external, E-E, E-I, I-E, origin-destination, O-D, survey, 36
technology 37
38

Hard, Chigoy, Songchitruksa, et al. 3
1
INTRODUCTION 2 This study was conducted by the Texas A&M Transportation Institute (TTI) in 3
coordination with the Texas Department of Transportation (TxDOT) in the spring of 2014. The 4
scope was to collect, analyze, and compare external origin-destination (O-D) data for the Tyler 5
Metropolitan Planning Organization (MPO) study area using Bluetooth technology provided by 6
TTI, cellular data provided by Airsage, and Global Positioning Satellite (GPS) data provided by 7
INRIX. The chief purpose of the study was to determine if cell and GPS data were viable for use 8
in TxDOT’s external surveys so that TxDOT could resume collecting external data for Texas 9
MPOs. The key objectives of the study were to compare: 10
External – External (E-E) trips between Bluetooth, cell, and GPS data; 11
Commercial/freight E-E trips between Bluetooth and GPS; 12
External-Internal/Internal-External (E-I/I-E) matrices and trip length frequency 13
distributions between cell and GPS; and 14
Where possible, compare study results to those of the Tyler 2004 External Survey (1). 15
16
To help improve the accuracy of cell data results, Airsage recommended that internal 17
study area zones be a minimum of 500 meters x 500 meters in size (unpublished data, personal 18
communication: TTI conference call with AirSage, discussion of cell data purchase on design of 19
Tyler O-D study, March 28, 2014). Based on this criterion, the Tyler study area’s 420 traffic 20
analysis zones (TAZs) were aggregated into 307 larger zones. Eighteen (18) large external zones 21
were created around the periphery of the study area to capture cell data in these areas. The 22
external capture zones were jointly developed by TTI and Airsage considering a 45-minute travel 23
time buffer around the study area. The use of the buffer increased the likelihood of including 24
vehicles where no cell phones were actively in use by capturing off-call handover cell sightings. 25
Per the recommendation of INRIX, a 10-mile buffer was used around the study area to capture 26
travel from GPS devices. Figure 1 shows the study area zones and capture areas used for the 27
study. 28
29

Hard, Chigoy, Songchitruksa, et al. 4
FIGURE 1 Study Area Zones, Capture Areas, and External Stations 1
2
3
LITERATURE REVIEW 4 Texas external O-D studies were originally performed using intercept roadside surveys 5
(2). However, this is a cumbersome data collection method associated with safety and feasibility 6
concerns. Therefore, researchers considered other methods of capturing external travel for use in 7
transportation models, including the possibility of synthesizing the data rather than collecting it 8
(3). Recent advances in technology have led to additional options being available for external O-9
D data capture. Bluetooth technology was used to estimate E-E trips in a 2011 study that 10
compared the Bluetooth E-E results to those of the area’s 2002 external survey that was 11
conducted using a roadside intercept method. Results of this study showed a higher percentage 12
of Bluetooth E-E trips than the E-E trips obtained using the intercept method. Researchers 13
attributed this increase in the ability to collect Bluetooth data during non-daylight periods and an 14
increase in growth of travel volumes between the two study periods (unpublished data, 2011 15
Bryan-College Station Bluetooth External Study, Technical Memorandum to the Texas 16
Department of Transportation from Stephen Farnsworth of TTI) (4). However, Bluetooth’s 17
usefulness in external studies is limited to the study of E-E trips. Cell and GPS technologies have 18
emerged as possible options in capturing not only E-E trips, but also E-I/I-E trips. However, cell 19
and GPS data are associated with questions of positional accuracy, sample size, sample 20
penetration, and vehicle type biases. 21
Several studies have been performed to assess the use of cell data for external O-D 22
studies with varying scopes and locations (5-13). The focus of these studies has largely been on 23
comparing cell data to existing model outputs. Many of the results point to cell data being a 24
useful tool in determining external O-D tables, though they are largely preliminary in nature and 25

Hard, Chigoy, Songchitruksa, et al. 5
highlight the need to further understand just what the cell data represent and how they compare 1
to data obtained using more traditional methods. Multiple studies stress the importance of 2
selecting the proper zone size to effectively capture external trips. 3
Though not as prevalent as cellular O-D studies, the literature points to a handful of 4
recent, and in some cases on-going, GPS O-D studies. TTI obtained and processed third-party 5
GPS data in both 2011 and 2013 from national data providers. These efforts used regional and/or 6
national GPS datasets to study the O-D patterns and the quality, granularity, and continuity of 7
trip data and traces. In both cases TTI found the GPS data sample penetration to be low, though 8
it was useable in developing and evaluating external trips (14). A study performed by the SRF 9
Consulting Group used INRIX GPS data to study congestion relief on IH-494/Highway 62 in the 10
Twin Cities area of Minnesota. Using data from 300,000 trips, they were able to develop O-D 11
tables and calibrate a travel model for the study corridor (unpublished data, INRIX Q&A 12
Session, Presentation to MnDOT Metropolitan Council by SRF, January 20, 2016). The 13
Maryland Freight Fluidity Study is an ongoing research effort where INRIX data are available 14
from 20 million trips and 5.5 million unique devices. One aspect of the study is to analyze O-D 15
data to help identify areas of congestion and provide suggestions of alternative routes that could 16
be used to reduce congestion (unpublished data, Freight Fluidity Framework, Calculation 17
Procedures and Analysis Findings, Technical Memorandum for the Maryland State Highway 18
Administration from Bill Eisele of TTI through University of Maryland, June 1, 2015). 19
While there are a large number of cell O-D studies and a handful of GPS O-D studies 20
cited in the literature, there have been very few studies focused on comparing the results 21
obtained from different new technologies. Fehr & Peers performed a NAPA County travel 22
behavior study comparing five data collection methods including vehicle classification counts, 23
winery regression analysis, license plate matching, surveys and mobile device data. The mobile 24
device data were INRIX and Streetlight data, which were found to provide a large sample size at 25
a relatively low cost. However, the fact that demographic information is not available from 26
cellular O-D data and the need to infer trip purpose are weaknesses of GPS data. Therefore, data 27
obtained from all methods were used in improving and assessing existing model results (15; 16). 28
The Tyler study presented within the present work represents a first-of-its-kind study to 29
compare cellular, GPS and Bluetooth external O-D data. Note that several of the cited studies 30
have been performed since the time of the Tyler Study discussed in this paper. TTI is currently 31
performing another comparative study of cell, GPS and Bluetooth external O-D data in the 32
Dallas-Fort Worth region of Texas. TxDOT is sponsoring the study and results from this effort 33
should be available by the fall of 2017. 34
35
36

Hard, Chigoy, Songchitruksa, et al. 6
BLUETOOTH DATA COLLECTION AND ANALYSIS 1 TTI’s Bluetooth technology and E-E data collection has been thoroughly tested and 2
vetted (14). Agency researchers believe it is currently the best means of estimating E-E trips for 3
urban areas and therefore used it as a benchmark comparison to the cellular and GPS data. Based 4
on this premise, if the E-E estimates derived from the cellular and GPS data compared well to the 5
Bluetooth E-E estimates, it could be assumed that the I-E/E-I estimates from those same sources 6
could be considered reasonable. 7
TTI collected Bluetooth data for a two week period and used data from Tuesdays, 8
Wednesdays, and Thursdays to develop average weekdays results. Two weeks was the longest 9
time period Bluetooth data could be collected due to the battery life of the mobile Bluetooth 10
devices. Cellular data were harvested for a one-month period at the recommendation of Airsage. 11
GPS data were acquired for a three-month period due to its lower sample penetration rate. Data 12
collection between the three technologies were coordinated such that the data collection time 13
periods of the cell and GPS data centered around the first two weeks of April 2014 when the 14
Bluetooth and traffic counts data were collected. 15
Bluetooth data and vehicle classification counts were collected at 20 external stations, 16
which were the same stations used in the 2004 Tyler External Survey (unpublished data, 2004 17
Tyler External Survey, prepared for TxDOT by Stephen Farnsworth, April 2005). While 18
deployed, the mobile Bluetooth units transmitted data in real-time to the TTI host software. 19
Bluetooth data were also saved/retained in the portable devices in case of spotty or interrupted 20
cell service so that the “raw” Media Access Control (MAC) address values were not lost. Since 21
the Bluetooth results represent only a sample of traffic travelling through the area, the counts 22
served as a basis for expanding the Bluetooth data (unpublished data, 2014 Tyler Bluetooth 23
External Study, Technical Memorandum to TxDOT from Stephen Farnsworth and Darrell 24
Borchardt, November 11, 2014). 25
Over 170,000 Bluetooth observations were captured during the survey period. Across all 26
external stations, Bluetooth detection ranged from about 4-to-11 percent. The Bluetooth 27
detections were processed to determine the number of daily matches between each external 28
location and all other locations. All matches that had an observed travel time that exceeded the 29
time skim value were assumed to have stopped at some point between the Bluetooth locations 30
and therefore were removed from the analysis of through (E-E) trips. Such matches were 31
removed because if a vehicle stopped in the study area it would be classified as an E-I or I-E trip. 32
There were nearly 4,100 weekday matches and over 1,800 weekend matches. Using the 33
expansion factors developed for each Bluetooth location, the raw data were expanded and 34
balanced to produce final O-D matrices for the external locations. Additionally, the distribution 35
of commercial and non-commercial vehicles by location was used to proportion the matrix 36
results by vehicle type. 37
38
CELL DATA ACQUISITION AND ANALYSIS 39 One month of cellular data was acquired for the study. It included data for average 40
weekdays and weekends, AM and PM peak data, and 24-hour totals. It also included resident 41
class attributes for two categories; residents and visitors. The cell data acquired included 198,344 42
unique devices, which represented a 17.1 percent sampling rate of the study area population 43
(unpublished data, email from AirSage’s Vijay Sivaraman to TTI’s Ed Hard, Subject: Tyler 44
Data, August 25, 2015). Airsage reported an average of 180 device sightings per day for the 45
study area. The data were expanded by Airsage to the census tract of the device home location to 46

Hard, Chigoy, Songchitruksa, et al. 7
account for different penetration rates. Estimated trips from device movement data were 1
provided for each device by longitude/latitude. Within the data set, each device is identified as a 2
resident of visitor based on the nighttime resting place of the device (unpublished data, email 3
from AirSage’s Vijay Sivaraman to TTI’s Ed Hard, Subject: Tyler Study Comments/Questions, 4
October 9, 2014). 5
Upon review, the initial cell data submission included erroneous trips between the large 6
external capture areas and defined devices with home locations in the external capture areas as 7
residents (when they should have been visitors). Airsage reprocessed and resent the cell data to 8
correct these items. TTI analyzed the data in relation to the internal zone structure and the 9
external capture areas to identify and analyze E-I, I-E, and E-E trips as well as resident versus 10
non-resident trips by external station. The key products resulting from the analysis of E-E cell 11
data included an expanded trip matrix and related matrices by time periods and resident classes; 12
traffic counts by station; and the percent splits of residents versus non-residents by station. The 13
key products from the analysis of E-I/I-E data included an expanded trip matrix and related 14
matrices by time periods and resident classes and trip length frequency results for the study area 15
and by station. 16
17
GPS DATA ACQUISITION AND SAMPLE 18 Three months of pre-processed GPS data from INRIX was acquired for the Tyler Study 19
in the spring of 2014. INRIX used GPS data collected within the Tyler MPO study area (Smith 20
County, TX) and within an area that was roughly a 10-mile buffer around the study area (see 21
Figure 1). This buffer served as a means to detect and capture trips that began or ended outside 22
of the study area. INRIX provided separate data sets for GPS data sources from non-commercial 23
passenger cars/vehicles, commercial/freight vehicles (including trucks), and mobile applications. 24
They also provided a fourth total data set, which included GPS data from all sources combined. 25
(It should be noted that due to the new manner in which INRIX’s Trips products captures trips, a 26
buffer around a study area is no longer needed). 27
The collection period for GPS data spanned 74 days. The original total data set had 28
500,019 records. After removing the data collected on a holiday (Good Friday), there were 29
492,023 records remaining. Each record contained a unique device identification (ID) and the 30
trip ID with time-stamped trip end locations. Trip ends were pre-processed by INRIX using a 31
10-minute dwell time threshold and the time stamps for trip ends were rounded to the nearest 32
hour. The actual trip end locations were anonymized by offsetting the first five minutes for the 33
trip origins and the last five minutes for the trip destinations. For the purpose of E-E trip 34
comparison with Bluetooth data, if the GPS traces passed a Bluetooth reader location, the station 35
number and time stamp rounded to the nearest 10 minutes were recorded. 36
The distribution of GPS data by sources for commercial/freight vehicles, non-commercial 37
/passenger vehicles, and mobile applications were 57 percent, 16 percent, and 27 percent, 38
respectively. Using the frequency of the GPS passes and the traffic counts collected at the 39
external stations, TTI calculated the sampling rate of the GPS data to be about 1.6 percent for the 40
study area. As expected, the GPS saturation rate was lower than the cellular data, but it is 41
expected to increase over time. Since the Tyler study was conducted in early 2014, TTI 42
researchers believe that the saturation of car/non-freight GPS data has improved relative to the 43
truck/freight data. 44
TTI and INRIX coordinated on the GPS data elements that were delivered in the data set. 45
These elements were as follows. 46

Hard, Chigoy, Songchitruksa, et al. 8
1
1. Vehicle ID. An anonymous unique identifier for each vehicle. 2
2. Trip ID. A unique identifier for each trip. 3
3. Day type of trip: An identifier where 1=Weekday, 2 = Weekend. 4
4. Start time of trip. The time when the trip began, rounded to the nearest hour. 5
5. Start location. The latitude/longitude coordinates where the trip began. 6
6. First external station crossed. The external station number where the trip first entered 7
and/or exited the study area boundary. Note that I-E and E-I trips will only cross the study area 8
boundary one time. 9
7. First crossing time of trip. The time, rounded to the nearest 15-minute time period within 10
the hour, when the trip crossed the external station identified in item 6. 11
8. Second external station crossed. The external station number where the trip entered 12
and/or exited the study area boundary for the second time. This field was only populated for E-E 13
trips. 14
9. Second crossing time of trip. The time, rounded to the nearest 15-minute time period 15
within the hour, when the trip crossed the external station identified in item 8. This field was 16
only populated for E-E trips. 17
10. End time of trip. The time when the trip ended, rounded to the nearest hour. 18
11. End location. The latitude/longitude coordinates where the trip ended. 19
12. Vehicle type. An integer estimating the type of vehicle, which completed the trip, where 20
1 = freight, 2 = non freight. 21
13. First buffer sighting. The time, rounded to the nearest hour, when the vehicle was first 22
sighted in the buffer area. 23
14. Last buffer sighting. The time, rounded to the nearest hour, when the vehicle was last 24
sighted in the buffer area. 25
26
DEVELOPMENT OF O-D MATRICES FROM INRIX DATA 27 The GPS trip ends provided by INRIX were processed and analyzed by TTI in relation to 28
E-E, E-I, I-E, Internal-Internal (I-I) trip types and the 20 external stations, the 320-zone TAZ 29
structure, the study area boundary, and the buffer area surrounding the study area. Data on trips 30
where both trip ends occurred within the 10-mile buffer area were excluded from the study (since 31
they were not an E-E, I-E, or E-I trip). Classification count data collected at each external station 32
were used to expand the GPS data. 33
A TAZ polygon layer was overlaid on the trip end coordinates to identify the 34
corresponding TAZ for each trip end. Since the trip ends provided were offset from the actual 35
trip ends due to the anonymization process, an assumption had to be made in some cases to 36
reclassify the trip end based on whether it should be inside or outside the study area. INRIX’s 37
anonymization process offset the true origin and destinations by five minutes, which caused 38
some trips to be misclassified relative to their being an I-E/E-I or an E-E trip. To account for this, 39
a reclassification process was used that assumed a fixed distance threshold of three miles and 40
reclassified the internal TAZs as external if the distance between the reported trip ends and the 41
nearest external stations was less than the fixed threshold and the other trip ends are inside the 42
study area. The trip type classification was based on the following. 43
E-E trips must have both two external stations (Ext1 and Ext2) recorded and no internal 44
TAZs. 45

Hard, Chigoy, Songchitruksa, et al. 9
E-I trips must have TAZ1 as external and TAZ2 as internal. Either Ext1 or Ext2 is 1
recorded. If both Ext1 and Ext2 are recorded, use Ext1. 2
I-E trips must have TAZ1 as internal and TAZ2 as external. Either Ext1 or Ext2 is 3
recorded. If both Ext1 and Ext2 are recorded, use Ext2. 4
I-I trips must have both TAZ1 and TAZ2 as internal. 5
6
The trip records were used to build E-E O-D matrices for all vehicle types, 7
commercial/freight vehicles, and non-freight (passenger vehicles plus mobile applications). TTI 8
used the Tyler models skim travel times plus 10 minutes as the threshold for extracting out trips 9
that may have stopped inside the study area. The 10-minute buffer was added to account for 10-10
minute rounding in GPS time stamps recorded at the external stations. The skim times were 11
considered to be generally conservative and therefore no extra buffers were needed. In addition, 12
this threshold was consistent with the values used for Bluetooth E-E analysis (except for the 10-13
minute buffer addition since the Bluetooth time stamps were reported as-is). Note that due to 14
their coarser granularity, travel time constraints cannot be applied with cell data. The E-E trips 15
totals produced from cell data are based on the time period of the cell dataset analyzed such as 16
24-hour, peak period, etc. 17
The GPS O-D matrices were balanced and then expanded since the GPS trips for the O-D 18
pairs represented just samples of the population. A Fratar method was used to factor up the GPS 19
sample O-D matrices. 20
21
COMPARISON OF E-E RESULTS BY TECHNOLOGY 22 The E-E results from Bluetooth, GPS, and cellular data were compared to those from the 23
Tyler 2004 external survey that was conducted using roadside intercept and a license match 24
surveys. For all external stations combined, the total traffic count increased by about 12 percent 25
from 156,635 vehicles in 2004 to 175,345 vehicles in 2014. The 2004 and 2014 counts are based 26
on automatic vehicle classification counts taken as part of these studies. The 2014 vehicle count 27
based on cell data was estimated to be 187,860. 28
Key items related to the development of E-E estimates that should be kept in mind when 29
assessing the results between each source include the following: 30
The total E-E trips for the 2004 survey, Bluetooth, and GPS are based on the expansion 31
of raw E-E trips to vehicle traffic counts taken at each external station. 32
The total E-E trips for cell data are based on the expansion of a 24-hour traffic count 33
estimated using cell data. This count is developed based on device movements and census tract 34
population data. 35
The 2014 higher vehicle count estimate from cells seems logical since this total 36
essentially represents counts from all roadways that cross the study area boundary, while the 37
2014 class counts for Bluetooth and GPS only represent counts from the 20 external stations. 38
The total E-E trips for Bluetooth and GPS data were developed using the travel time 39
limitations between external pairs. The travel time skims for the Tyler model, plus 10 percent 40
were applied as the time constraint. 41
The total E-E trips for cell data were based on a 24-hour period with no travel time 42
constraint imposed between external pairs. Cell data cannot be disaggregated into small enough 43
time durations (e.g., hourly) to allow use of time constraints. 44
Table 1 shows a summary comparison of the total and percentage E-E trips between the 45
2004 survey data and the 2014 Bluetooth, GPS, and cell data. The table also shows E-E results 46
Hard, Chigoy, Songchitruksa, et al. 10
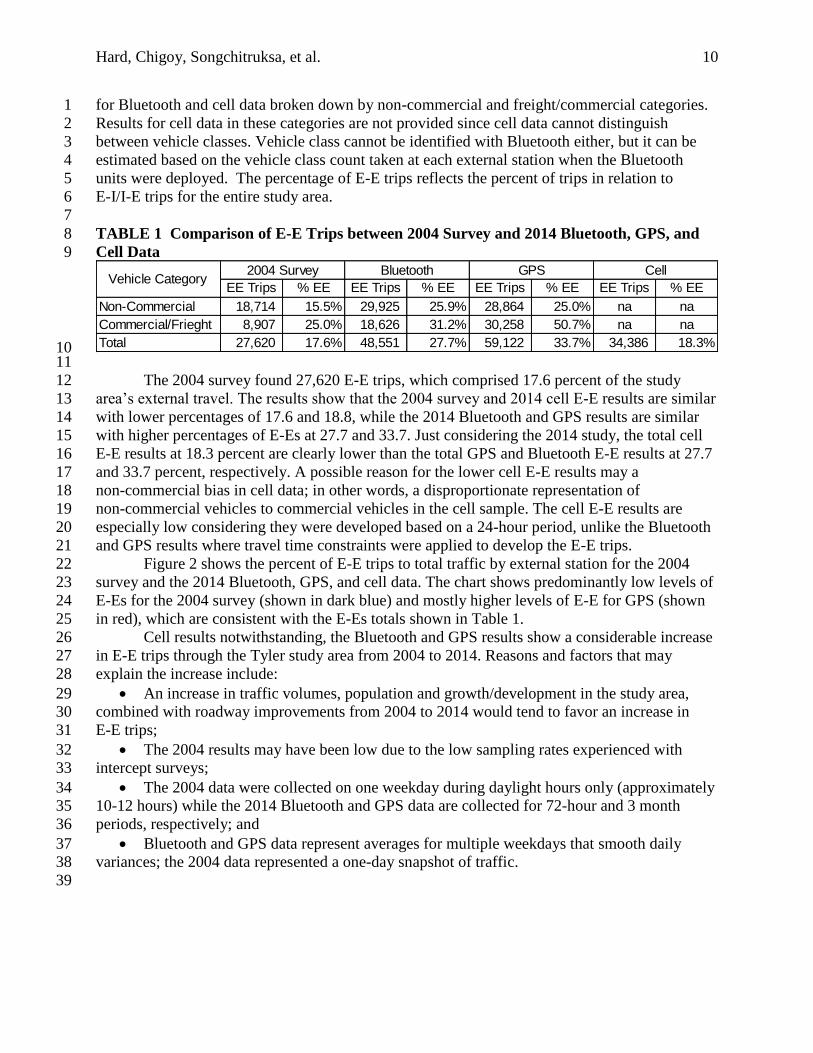
for Bluetooth and cell data broken down by non-commercial and freight/commercial categories. 1
Results for cell data in these categories are not provided since cell data cannot distinguish 2
between vehicle classes. Vehicle class cannot be identified with Bluetooth either, but it can be 3
estimated based on the vehicle class count taken at each external station when the Bluetooth 4
units were deployed. The percentage of E-E trips reflects the percent of trips in relation to 5
E-I/I-E trips for the entire study area. 6
7
TABLE 1 Comparison of E-E Trips between 2004 Survey and 2014 Bluetooth, GPS, and 8
Cell Data 9
10 11
The 2004 survey found 27,620 E-E trips, which comprised 17.6 percent of the study 12
area’s external travel. The results show that the 2004 survey and 2014 cell E-E results are similar 13
with lower percentages of 17.6 and 18.8, while the 2014 Bluetooth and GPS results are similar 14
with higher percentages of E-Es at 27.7 and 33.7. Just considering the 2014 study, the total cell 15
E-E results at 18.3 percent are clearly lower than the total GPS and Bluetooth E-E results at 27.7 16
and 33.7 percent, respectively. A possible reason for the lower cell E-E results may a 17
non-commercial bias in cell data; in other words, a disproportionate representation of 18
non-commercial vehicles to commercial vehicles in the cell sample. The cell E-E results are 19
especially low considering they were developed based on a 24-hour period, unlike the Bluetooth 20
and GPS results where travel time constraints were applied to develop the E-E trips. 21
Figure 2 shows the percent of E-E trips to total traffic by external station for the 2004 22
survey and the 2014 Bluetooth, GPS, and cell data. The chart shows predominantly low levels of 23
E-Es for the 2004 survey (shown in dark blue) and mostly higher levels of E-E for GPS (shown 24
in red), which are consistent with the E-Es totals shown in Table 1. 25
Cell results notwithstanding, the Bluetooth and GPS results show a considerable increase 26
in E-E trips through the Tyler study area from 2004 to 2014. Reasons and factors that may 27
explain the increase include: 28
An increase in traffic volumes, population and growth/development in the study area, 29
combined with roadway improvements from 2004 to 2014 would tend to favor an increase in 30
E-E trips; 31
The 2004 results may have been low due to the low sampling rates experienced with 32
intercept surveys; 33
The 2004 data were collected on one weekday during daylight hours only (approximately 34
10-12 hours) while the 2014 Bluetooth and GPS data are collected for 72-hour and 3 month 35
periods, respectively; and 36
Bluetooth and GPS data represent averages for multiple weekdays that smooth daily 37
variances; the 2004 data represented a one-day snapshot of traffic. 38
39
EE Trips % EE EE Trips % EE EE Trips % EE EE Trips % EE
18,714 15.5% 29,925 25.9% 28,864 25.0% na na
8,907 25.0% 18,626 31.2% 30,258 50.7% na na
27,620 17.6% 48,551 27.7% 59,122 33.7% 34,386 18.3%
CellVehicle Category
Non-Commercial
Commercial/Frieght
Total
2004 Survey Bluetooth GPS

Hard, Chigoy, Songchitruksa, et al. 11
FIGURE 2 Percent of E-E Trips to Total Traffic by External Station for the 2004 Survey 1
and 2014 Bluetooth, GPS, and Cell Data 2 3
The higher number and percent of E-Es for GPS is due in large part to a bias toward 4
commercial vehicles. With few exceptions, commercial vehicles make a higher percentage of 5
E-E trips than non-commercial vehicles. The GPS data for the Tyler study was comprised of 6
70 percent freight/commercial vehicles, 20 percent mobile applications, and 10 percent 7
passenger vehicles. The high percentage of the freight/commercial vehicles combined with the 8
fact that these vehicles make a higher percentage of E-E trips substantiates a commercial bias in 9
the GPS data. 10
The E-E results for cell data compare better to the other E-E sources when they are 11
compared to the non-commercial categories. Figure 3 shows the non-commercial E-E results for 12
the 2004 survey, and the 2014 Bluetooth and GPS vehicles along with the total (all vehicle 13
category) E-E results for the 2014 cell data. The percent of total cell E-E’s at 18.3 percent 14
compares better to the non-commercial E-E trips of the 2004 survey, Bluetooth and GPS data at 15
15.5, 25.9, and 25.0 percent, respectively. Researchers believe this chart may represent a more 16
accurate comparison, since the commercial bias in the GPS data is mitigated and since cell data 17
may have a bias toward non-commercial vehicles. 18
In light of the commercial bias in the GPS data the probable non-commercial bias in 19
cellular data, the non-commercial E-E results are considered to be the most reliable. The 20
non-commercial results for Bluetooth and GPS were very close at 25.0 and 25.9 percent, 21
respectively. Based on these results, the percentage of E-E trips through the Tyler study area has 22
increased from about 18 percent in 2004 to about 25 percent in 2014. 23

Hard, Chigoy, Songchitruksa, et al. 12
FIGURE 3 Non-Commercial Trips for the 2004 Survey and 2014 Bluetooth, GPS, and Cell 1
Data 2 3
The percentage of commercial E-E trips for the study area from the 2004 survey, 2014 4
Bluetooth, and GPS data was 25.0, 31.2, and 50.7 percent, respectively. The 2014 Bluetooth and 5
2004 results are most similar, while the 50.7 percent figure reflects the commercial bias in the 6
GPS data. While this bias in GPS data may not make it the best source for the all-vehicle 7
category, it does make if the best source for studying commercial/freight O-D patterns. Since the 8
Tyler study was conducted in 2014, INRIX data scientists have indicated that they have 9
additional sources of GPS data, the saturation/granularity of their data has improved, and the 10
commercial bias in their data has been reduced. 11
12
COMPARISON OF E-I/I-E RESULTS BY TECHNOLOGY 13 The E-I/I-E trips for the Tyler study area were compared between the 2004 survey data 14
and the 2014 Cell and GPS data. This comparison used data for all vehicles and included both 15
commercial and non-commercial vehicles. Bluetooth data is not included since it cannot be used 16
to develop E-I/I-E trips on an area wide basis. The data were assessed by comparing the 17
distribution of total trips ends (origins and destination points) for each source across the Tyler 18
area’s aggregated internal TAZ structure. Figure 4 shows the distribution of E-I/I-E trip ends 19
across the internal TAZ structure based on the expanded data for each option. 20
Figure 4 shows that the external trip ends for the 2014 cell and GPS data are clearly 21
better distributed than those in the 2004 survey. The 2004 graphic shows more trip end 22
concentration in the urban core probably reflecting the prevailing development pattern at the 23
time and potentially the small sample size afforded by the roadside intercept survey method. The 24
charts for the cell and GPS data show more widespread trip distribution than 2004 probably due 25
to increased traffic volumes, substantially more suburban development, and better sampling 26
rates. 27
Compared to the GPS graphic, the cell graphic shows unusually high trip ends in some of 28
the rural periphery zones near the study area boundary. These results could be due to poor cell 29
coverage and/or a lack of positional accuracy of cell data. The numerous high spikes in trip ends 30
near the top of the GPS graphic are probably a result of the commercial bias in this data. These 31
spikes are located along a major interstate that runs through the area and likely represent trip 32
ends at truck stops. 33

Hard, Chigoy, Songchitruksa, et al. 13
1
FIGURE 4 Distribution of E-I/I-E Trip Ends across the Tyler Internal TAZ 2 3
The E-I/I-E trips and the Tyler model skims were used to develop trip length frequency 4
distributions (TLFDs) for the 2004 survey and 2014 cell and GPS data for the Tyler study area 5
(based on all survey stations combined). When charted, the TLFD’s appear to be similar for all 6
options, especially between cell and GPS data, but statistically they are not. A Kolmogorov-7
Smirnov (K-S) test was used to test the statistical similarity of the TLFDs. A K-S test is a 8
nonparametric statistical method commonly used to test whether the empirical distributions from 9
two samples are the same. The p-value of the test indicates the probability that the statistic will 10
be larger than the observed value, assuming that the null hypothesis is true. A threshold of 0.01 11
or 0.05 is often used for p-value comparison. A small p-value (< 0.05) indicates that there is 12
strong evidence against the hypothesis that the two distributions are the same. 13
The K-S test performed on the TLFDs from the 2004 survey, GPS, and cell data resulted 14
in a p-value of << .01, indicating that the chance that the three TLFD distributions being the 15
same are very remote. Figure 5 shows the variations in TLFD’s for all sites combined. Further 16
study should be conducted to examine the TLFD’s at each individual station because the 17
variations at each location would likely be greater than that for the study area as a whole. 18
19
Summary findings, conclusions lessons learned from the Tyler Study are provided in the 20
sections. 21
22
General Findings: 23
Cell data has a large sample size but poor positional accuracy, while GPS data has a 24
small sample size with good positional accuracy. 25
The 500 x 500 meter minimum size of zones to capture cell data was too small. Future 26
studies should user larger zones. 27
The sample rate/penetration of GPS O-D data is low, especially when compared to cell 28
data sample penetration. 29
2004 Survey Data 2014 Cell Data 2014 GPS Data

Hard, Chigoy, Songchitruksa, et al. 14
GPS data had a significant commercial vehicle bias. Fifty-seven percent of the GPS 1
sample was from commercial/fleet vehicles. (As previously noted, since this study was 2
conducted in 2014, INRIX has indicated that the commercial bias in its data has been reduced). 3
Cell data may have a non-commercial vehicle bias. Researchers suspect that commercial 4
vehicles are under-represented in cell data. 5
Based on TTI’s extensive use, experience and testing of Bluetooth data for travel times, 6
speeds, and O-Ds, agency researchers believe it is a good source for collecting E-E O-D data. In 7
light of this, the E-E results for cell and GPS data from this study were benchmarked against 8
Bluetooth E-E results. 9
10
Findings Related to E-E Trips: 11
When the study was conducted in 2014, TTI researchers concluded that Bluetooth 12
estimates for total (all vehicles) E-E trips were superior to those derived from cell and GPS data. 13
In developing estimates of E-E trips, travel time constraints between external zone pairs 14
can be applied using Bluetooth and GPS data, but not for cell data. 15
The percentages of total E-E trips for Bluetooth, GPS, and cell were 27.7, 33.7, and 18.3, 16
respectively. 17
The estimates of total cell E-E trips were thought to be low, especially since they were 18
developed based on a 24-hour period, unlike the Bluetooth and GPS results where travel time 19
constraints were applied. The time constraint used was the time it takes to travel between each 20
external station, plus about a 20 percent cushion. 21
Travel time constraints for cell data cannot be applied since this data cannot be provided 22
in minutes or hourly increments. 23
Bluetooth and GPS E-E trips compared well when only non-commercial vehicles are 24
considered. 25
Bluetooth, cell, and GPS E-E trips are most similar when only non-commercial vehicles 26
are considered. 27
The GPS data over-estimated commercial E-E trips due to its commercial bias. 28
29
Findings Related to E-I/I-E Trips: 30
Cell and GPS derived O-D data provide a better sample and distribution of E-I/I-E trips 31
than those of prior traditional methods (e.g., intercept, license mail out, or postcard surveys). 32
The commercial bias in GPS data was evident in areas and corridors with high 33
commercial/ truck activity. 34
It appeared that cell data provided questionable trip ends in rural areas with poor cell 35
coverage where estimated device locations are less accurate. 36
The similarities of the cell and GPS TLFDs for E-I/I-E trips were not statistically similar, 37
despite their appearing to be when charted. 38

Hard, Chigoy, Songchitruksa, et al. 15
1
REFERENCES 2
3
[1] Hard, E., B. Chigoy, P. Songchitruksa, S. Farnsworth, and D. Borchardt. Comparison 4
of Cell, GPS, and Bluetooth Derived External Data.In Transportation Research Board 5
Annual Meeting-Travel Survey Methods (ABJ40) Committee Meeting, Washington, D.C., 6
2014. 7
[2] Federal Highway Administration. A Snapshot of Travel Modeling Activities: The State 8
of Texas. 9
https://www.fhwa.dot.gov/planning/tmip/publications/other_reports/snapshot_texas/page0510
.cfm. Accessed November 10, 2016. 11
[3] Farnsworth, S., E. Talbot, P. Songchitruksa, P. Reeder, and D. Pearson. Alternative 12
Methods for Developing External Travel Survey Data.In, No. FHWA/TX-10/0-6583-1, 13
Texas Transportation Institute, 2010. p. 126. 14
[4] Texas A&M Transportation Institute. TTI Transportation Planners Find New Ways to 15
Conduct Travel Surveys. https://tti.tamu.edu/2013/03/27/tti-transportation-planners-find-16
new-ways-to-conduct-travel-surveys/. Accessed November 10, 2016. 17
[5] Bindra, S. Using Cellphone O-D Data for Regional Travel Model Validation.In 15th 18
TRB Planning Applications Conference, Atlantic City, New Jersey, May 19, 2015. 19
[6] Cambridge Systematics. Chattanooga Cell Phone External O-D Matrix Development-20
Process and Findings.In Presented to Tennessee Model Users Group (TNMUG), November 21
10, 2011. 22
[7] Coladner, D., B. Stabler, and S. Sikder. Development of the Idaho STDM Trip Matrices 23
Using Cell Phone OD Data.In 15th TRB Transportation Planning Applications Conference, 24
Atlantic City, New Jersey, May 19, 2015. 25
[8] Fussell, R., C. Gresham, and C. Smith. Origin Destination Analysis for Moore County, 26
NC.In For NCDOT & the Moore County Transportation Committee (MCTC), Parsons 27
Brinckerhoff 28
Clearbox 29
AirSage, July 31, 2013. 30
[9] Harrison, K. Mobile Origin-Destination Study.In 2013 TRB Annual Meeting, 31
Washington, DC. 32
[10] Milone, R. Preliminary Eavluation of Cellular Origin-Destinaiton Data as a Basis for 33
Forecasting Non-Resident Travel (PowerPoint Presentation).In 15th TRB National 34
Transporation Planning Applications Conference, Atlantic City, New Jersey, May 19, 2015. 35
[11] Miquel, R. O., C. Paleti, and K. Viswanathan. Using Cellphone Data for O-D 36
Matrices.In FHWA Cell Phone Data and Travel Behavior Research Symposium, 37
Washington, DC, February 12, 2014. 38
[12] Rohne, A. Model Calibration: Cell Phone Data & Survey Data Comparison.In FHWA 39
Cell Phone Data and Travel Behavior Research Symposium, Washington, DC, February 40
12, 2014. 41
[13] Zhang, W., A. Kuppam, V. Livshits, and B. King. Understanding Cellular-based 42
Travel Data Experience from Phoenix Metropolitan Region.In 15th TRB National 43
Transportation Planning Applications Conference, Atlantic City, New Jersey, 2015. 44

Hard, Chigoy, Songchitruksa, et al. 16
[14] Hard, E., B. Chigoy, P. Songchitruksa, S. Farnsworth, D. Borchardt, and L. Green. 1
Synopsis of New/Emerging Methods and Technologies to Collect Origin-Destination (O-D) 2
Data.In, Texas A&M Transportation Institute,, 2016. pp. 1-72. 3
[15] Napa County Travel Behavior Study. In NCTPA Board Meeting Presentationof Work, 4
December 17, 2014. 5
[16] Peers, F. Napa County Travel Behavior Study-Draft Survey Results and Data Analysis 6
Report.In, December 8, 2014. 7
8