comparison of response of moss, lichens and attic dust to geology and atmospheric pollution from...
TRANSCRIPT

ORIGINAL PAPER
Comparison of response of moss, lichens and attic dust to geologyand atmospheric pollution from copper mine
B. Balabanova • T. Stafilov • R. Sajn •
K. Baceva
Received: 29 September 2012 / Revised: 5 March 2013 / Accepted: 10 March 2013 / Published online: 17 April 2013
� Islamic Azad University (IAU) 2013
Abstract Different sampling media (moss, lichen and
attic dust) were used for monitoring the distribution of 15
elements, including certain trace elements, in the vicinity
of an intensively exploited copper mine in the east of the
Republic of Macedonia. Moss species (Hypnum cupressi-
forme and Campothecium lutescens), epiphytic lichens
(Hypogymnia physodes and Evernia prunastri) and attic
dust were collected for comparative analysis for monitor-
ing air pollution. In both cases (lithological and anthro-
pogenic affected areas) for the distribution of elements, the
sampling media follows the expression capabilities: attic
dust [ moss [ lichens. Enrichment factors M/L—moss vs.
lichen, for plant response to elements distribution and
D/L—attic dust vs. lichen, for historical response of ele-
ments distribution were significant for Cu and Ni, which
were singled out as the main markers for anthropogenic
and geogenic distribution. The factor analysis highlighted
geogenic (F1: Ni-Cr-Cd-Fe-Al-K-Mn-Zn) and anthropo-
genic (F2: As-Cu-Pb) association of elements from three
types of media samples. For anthropogenic affected areas,
T value and F value for Cu content were significant at
p \ 0.05 and higher enrichment factors were obtained for
lichen, moss and attic dust media (3.8, 5.0 and 5.7,
respectively). Spatial distribution for element deposition
(with emphasis on Cu and Ni) is not disturbed by the
significant differences in the sampling media matrix.
Treated sample materials (attic dust, moss, lichen) are
shown to be useful in determining an anthropogenic
impact, as well as the chemical properties or geological
background on orographic diverse terrain in the presence of
complex geological structure.
Keywords Attic dust � Bucim copper mine � Macedonia �Lichen � Moss � Spatial distribution
Introduction
The environmental fate of heavy metals absorbed on to
dust particles is of growing concern when addressing
environmental issues for mine and processing plants
environs (Pacyna et al. 2007). The complexity of the
contamination sources and the large amounts of waste
tailings produced is of high priority when investigating the
contamination levels and the mechanisms that rule their
distribution and deposition in the local environment (Jarup
2003; Vallero 2008; Ashraf et al. 2011). Different media
sampling is used for monitoring the possible air pollution
by heavy metals around metal emission sources. Long-term
and long-distance monitoring are sensitive for different
types of sampling media and stability and responsiveness
with respect to environmental and pollution conditions,
present limitations for implementing air pollution moni-
toring (Artiola et al. 2004). The ability of moss and lichen
to accumulate trace substances present in the lower atmo-
sphere is well known and their potential as biomonitors of
environmental pollution by heavy metals has been docu-
mented by numerous studies (Branquinho et al. 1999;
B. Balabanova
Faculty of Agriculture, Goce Delcev University,
Stip, Macedonia
T. Stafilov (&) � K. Baceva
Faculty of Science, Institute of Chemistry, Ss. Cyril
and Methodius University, POB 162, 1000 Skopje, Macedonia
e-mail: [email protected]
R. Sajn
Geological Survey of Slovenia, Dimiceva 14,
1000 Ljubljana, Slovenia
123
Int. J. Environ. Sci. Technol. (2014) 11:517–528
DOI 10.1007/s13762-013-0262-8

Garty 2001; Onianwa 2001; Jeran et al. 2002; Culicov et al.
2005; Chakrabortty and Tryambakro-Paratkar 2006; Mar-
ket 2007; Balabanova et al. 2010, 2012). The different
morphological and physiological properties of mosses and
lichens partially account for the differences in metal-uptake
efficiency. However, the extent to which humans spend
time in their houses, household vacuum cleaner dust and
especially attic dust, might preserve a record of human
exposure to ambient air pollutants that infiltrate indoor
environments, as well to those materials that were present
outdoors. The use of undisturbed attic dust has the
advantage of being a measurement, albeit indirect, of air
pollution. An attic dust measurement provides an inte-
grated measure based on the above variables over time;
therefore, it is closer to the endpoint in the process con-
tinuum from source to exposure and ultimately, to effects.
Attic dust allows investigations of historical air pollution
on much smaller scales, including the micro-scale to
regional scale. Attic dust is derived primarily from external
sources through aerosol deposition and as a result of soil
dusting, rather than household activities (Sajn 2003). The
usefulness of different types of urban dust and especially of
attic dust, as a suitable long-term monitor for determining
the status and content in air, has been proven by numerous
studies (Alijagic and Sajn 2011; Gosar et al. 2006; Cyrys
et al. 2003; Jeffrey et al. 2005; Sajn 2003, 2005, 2006;
Zibret 2008, 2012; Zibret and Rokavec 2010; Zibret and
Sajn 2008; Balabanova et al. 2011).
Geochemical research on large lowland areas, mostly in
Northern Europe, where there is little influence by local
winds, or where the area lies on a unique geological
structure (primarily large alluvial plains or glacial depos-
its), has shown that it is relatively straightforward to
determine the source of pollution, or the state of the natural
distribution of chemical elements in particular sampling
media. In addition, a developed infrastructure (such as the
roads, paved areas, buildings) is appropriate for the sam-
pling of dust sediments, such as a street dust and household
dust, which reveals the current chemical state of the
environment.
To assess the state of the chemistry of the environment
in mountainous, sparsely populated areas is much more
difficult. Owing to the lack of infrastructure, it is almost
impossible to collect a sufficient number of statistically
significant samples of urban dust, such as street dust or
household dust (Sajn 1999; Zibret and Rokavec 2010;
Zibret 2012).
This problem can be solved by sampling various bio-
genic materials, such as moss and lichen, the usefulness of
which has already been proven for the evaluation of
environmental chemism (Branquinho et al. 1999; Garty
2001; Onianwa 2001; Jeran et al. 2002; Culicov et al. 2005;
Chakrabortty and Tryambakro-Paratkar 2006; Market
2007; Balabanova et al. 2010, 2012). Chemical distribution
in biogenic material, due to their nature (accumulation of
airborne particles and the impact of rainfall), corresponds
more to the distribution of street dust (Zibret and Rokavec
2010; Zibret 2012). Sampling of such materials can be a
significant problem, particularly in Macedonia, because of
the dry climatic conditions. Specifically, moss or lichen do
not thrive on flat plains but are fairly common on the hilly
or mountainous areas where there is more rainfall (Bala-
banova et al. 2010, 2012).
The characteristic difference between the attic dust and
biogenic sampling material is that attic dust records his-
torical air contamination, for the period of operation of a
source of contamination (Sajn 2003, 2005, 2006; Gosar
et al. 2006). On a roof constructed of wood we get an
undamaged sample; the total air deposit that has accumu-
lated since the period of construction until the moment of
sampling. Unlike attic dust, biogenic materials give only
the current state, or a maximum period of plant growth.
Another important aspect is that the distribution of ele-
ments in biogenic material is affected by precipitation
reactions, due to which certain chemical elements are
redistributed. At the same time, they are strongly influ-
enced by soil dust formed from the bedrock. In addition,
attic dust is sampled at the greatest height above the
ground, followed by lichen on branches and mosses on the
soil surface. Thus, attic dust, moss and lichen have the
potential for collecting complementary information on
present and historical air pollution trends.
The main objective for this study was to represent a
systematically model for monitoring of air pollution with
heavy metals; developing a comparative methodology for
monitoring the current and parallel historical records of
heavy metals—air pollution. On the other hand, critical
goal was also included: determination of the most stable
and also the most responsive sampling medium for deter-
mining a long-term status of atmospheric chemism (with
emphasis on heavy metals contents); determination of main
markers for geogenic and anthropogenic influences in
potentially polluted area. Intentionally, an area with
intensive exploitation of Cu minerals (copper mine
‘‘Bucim’’, near the city of Radovis, Republic of Macedo-
nia), was selected as a study area in the period of Sep-
tember–October 2010. Disposed mining waste rock
materials as well as fine particles from the flotation tailing
dam create environmentally hazardous conditions for res-
idents and ecosystems at a local level. Disposed waste rock
(ore tailings) and flotation tailings present the main emis-
sion sources of dust in the atmosphere. Therefore, the
purpose of the investigation was also to determine whether
the comparison method has the potential to reconstruct air
pollution histories since the launching of the mining
activities as well as to determine the intensity of pollution
518 Int. J. Environ. Sci. Technol. (2014) 11:517–528
123

in some certain periods in the past with a simple selection
of the age of the sampled object (attic dust and biogenic
materials: moss and lichens).
Materials and methods
Study area
An area of 400 km2 was monitored, bounded by coordi-
nates 41�320–41�440N and 22�150–22�300E, located in the
eastern part of the Republic of Macedonia (Fig. 1). A
copper mine (open pit) environment was monitored as an
area potentially polluted with anthropogenically introduced
higher contents of certain heavy metals. The region is
characterised by a moderate continental climate. The alti-
tude varies between 350 and 1,000 m. The average annual
rainfall is 563 mm with large variations from year to year.
Most frequent winds in the region are those from the west
with frequency of 199 % and 2.7 m s-1 speed and winds
from the east with frequency of 124 % and 2.0 m s-1
speed. Climatic conditions in the region allow the airborne
distribution of fine dust particles generated by mining
activities and exposed ore and flotation tailings. The
intensively exploited copper mine is located in the centre
of the study area, from where dust distribution occurs
continually. The Bucim mine and ore processing plant have
been in operation since 1979 and it is assumed that the
mine has about 40 million tons of ore reserves. Ore tailings
are deposited by the dampers from the open ore pit at an
open site near the mine. The deposit contains about 130
million tonnes of ore tailings and occupies an area of
0.80 km2. In the process of flotation of copper minerals, the
average annual amount is about 3.95 million tons of flo-
tation tailings. These tailings are drained and disposed of in
a dump near the mine. The exposure of this great mass of
ore and flotation tailings to constant air flow and winds
leads to the distribution of fine dust in the air (Stafilov et al.
2010).
Geological description
The investigated area represents a part of the Vardar
structural zone, separated from other structural zones dur-
ing the Caledonian, and subjected to strong tectonic
deformation during the Hercynian orogenesis. The struc-
tural relations were further complicated by the Alpine
orogenesis.
According to Hristov et al. (1965) and Rakicevic et al.
(1969), the oldest formations are represented by the Pre-
cambrian gneisses and micashists and white marble lenses.
The lower Paleozoic comprises sequences composed of
amphibolite schists, marbles and schistose carbonate rocks.
Except for minor intrusions, serpentines also occur as
xenoliths in the granites. Mesozoic rocks outcrop in a very
small part of the study area. The aforementioned rocks are
covered by the narrow belt of tertiary deposits represented
by the upper Eocene sediments that have been intruded by
Neogene andesites and their pyroclastites. The Pliocene
lacustrine sandy series is developed in a wide area of the
Radovis basin. Holocene deposits (river terraces and allu-
vial sediments) were also developed on the Radovis basin.
The small metallogenic area of Bucim-Damjan-Borov
Dol is characterised by deposits and mineralisations of
iron, copper, gold and base metals. The Bucim Cu and Au
mine is the only mine in the Republic of Macedonia that
belongs to the Serbo-Macedonian metallogenic province. It
was discovered in 1955, explored in the period 1962–1979
and production commenced in 1979. Bucim is Macedonias
principal producer of Cu, operating as a mine and ore
processing installation near Radovis. In 1999, milled 4 Mt
of ore were processed to yield 21,000 t of copper and
700 kg of gold in concentrates. Ore reserves amount to a
total of 80 Mt grading 0.3 % Cu, 0.35 g/t Au in four dis-
crete ore bodies (Stefanova et al. 2004). The map for
generalized geology of the investigated area was previ-
ously published (Balabanova et al. 2011).
Sampling design and procedures
Specific types of moss were selected according to the
protocol adopted within the European Heavy Metal Survey
(Barandovski et al. 2008). Hypnum cupressiforme (Hedw.)
and Campothecium lutescens (De Not.) were used as moss
Fig. 1 Location of the study area
Int. J. Environ. Sci. Technol. (2014) 11:517–528 519
123
biomonitors, characteristic of the flora of the Republic of
Macedonia (Balabanova et al. 2010). Hypogymnia phy-
sodes (Nyl.) and Evernia prunastri (Ach.) were used as
characteristic lichen species (Balabanova et al. 2012).
Moss and lichen samples were collected according to the
previously defined sampling network in the spring of 2010.
Depending on the conditions and the accessibility of the
locations, those species that were available and typical of
the region were collected.
The moss and lichen sampling protocol was performed
according to set standard rules for the collection of such
samples (Tuba et al. 2007) and it was done in the following
order: one sampling spot is formed by collecting five sub-
spots in an area of 50 9 50 m2. Every spot of the sampling
network must be a minimum distance of 300 m from main
roads, 100 m from local roads and 200 m from villages.
Moss and lichen samples were collected using polyethyl-
ene gloves to prevent any further contamination. The col-
lected material was stored in paper bags. After it was
cleaned of other plant species and soil, individual plant
samples were separated and air-dried for several days. Dry
samples were again placed in paper bags until the analyses
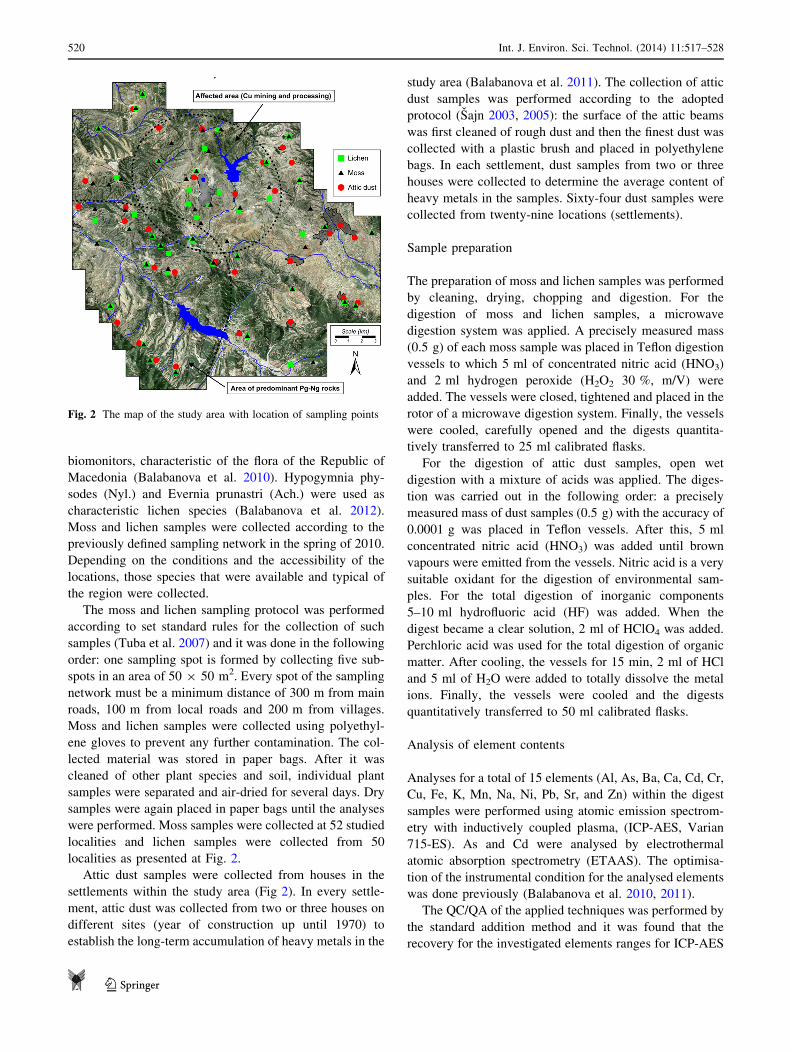
were performed. Moss samples were collected at 52 studied
localities and lichen samples were collected from 50
localities as presented at Fig. 2.
Attic dust samples were collected from houses in the
settlements within the study area (Fig 2). In every settle-
ment, attic dust was collected from two or three houses on
different sites (year of construction up until 1970) to
establish the long-term accumulation of heavy metals in the
study area (Balabanova et al. 2011). The collection of attic
dust samples was performed according to the adopted
protocol (Sajn 2003, 2005): the surface of the attic beams
was first cleaned of rough dust and then the finest dust was
collected with a plastic brush and placed in polyethylene
bags. In each settlement, dust samples from two or three
houses were collected to determine the average content of
heavy metals in the samples. Sixty-four dust samples were
collected from twenty-nine locations (settlements).
Sample preparation
The preparation of moss and lichen samples was performed
by cleaning, drying, chopping and digestion. For the
digestion of moss and lichen samples, a microwave
digestion system was applied. A precisely measured mass
(0.5 g) of each moss sample was placed in Teflon digestion
vessels to which 5 ml of concentrated nitric acid (HNO3)
and 2 ml hydrogen peroxide (H2O2 30 %, m/V) were
added. The vessels were closed, tightened and placed in the
rotor of a microwave digestion system. Finally, the vessels
were cooled, carefully opened and the digests quantita-
tively transferred to 25 ml calibrated flasks.
For the digestion of attic dust samples, open wet
digestion with a mixture of acids was applied. The diges-
tion was carried out in the following order: a precisely
measured mass of dust samples (0.5 g) with the accuracy of
0.0001 g was placed in Teflon vessels. After this, 5 ml
concentrated nitric acid (HNO3) was added until brown
vapours were emitted from the vessels. Nitric acid is a very
suitable oxidant for the digestion of environmental sam-
ples. For the total digestion of inorganic components
5–10 ml hydrofluoric acid (HF) was added. When the
digest became a clear solution, 2 ml of HClO4 was added.
Perchloric acid was used for the total digestion of organic
matter. After cooling, the vessels for 15 min, 2 ml of HCl
and 5 ml of H2O were added to totally dissolve the metal
ions. Finally, the vessels were cooled and the digests
quantitatively transferred to 50 ml calibrated flasks.
Analysis of element contents
Analyses for a total of 15 elements (Al, As, Ba, Ca, Cd, Cr,
Cu, Fe, K, Mn, Na, Ni, Pb, Sr, and Zn) within the digest
samples were performed using atomic emission spectrom-
etry with inductively coupled plasma, (ICP-AES, Varian
715-ES). As and Cd were analysed by electrothermal
atomic absorption spectrometry (ETAAS). The optimisa-
tion of the instrumental condition for the analysed elements
was done previously (Balabanova et al. 2010, 2011).
The QC/QA of the applied techniques was performed by
the standard addition method and it was found that the
recovery for the investigated elements ranges for ICP-AES
Fig. 2 The map of the study area with location of sampling points
520 Int. J. Environ. Sci. Technol. (2014) 11:517–528
123

was 98.5–101.2 % and for ETAAS was 96.9, 103.2 %. The
same methods were applied for the determination of the
analysed elements in the reference materials JSAC 0401
(soil) for the dust samples and M2 and M3 (moss) for the
moss and lichen samples. The sensitivity with regard to the
lower limit of detection was done.
Data processing
For the statistical analysis of data, both parametric and
nonparametric statistical methods were used. The obtained
values for the contents of the investigated elements were
statistically processed using basic descriptive statistics
(Table 1). Data distribution was examined with the appli-
cation of normality tests. The application of bivariate sta-
tistics showed how chemical elements correlate between
their content in different sampling media. For that issue,
the linear coefficient of correlation was used.
Enrichment factors were considered to evaluate the
response of individual media samples. Coordination is
made to determine how to express the values obtained for
the contents of the elements (divide mean values for ele-
ment contents).
Multivariate statistical methods (cluster and R-mode
factor analyses) were used to reveal the associations of the
chemical elements. Factor analysis was performed on
variables standardised to zero mean and unit standard
deviation (Reimann et al. 2002; Filzmoser et al. 2005;
Zibret and Sajn 2008). As a measure of similarity between
variables, the product-moment correlation coefficient
(r) was applied. For orthogonal rotation, the varimax
method was used. Those elements with low communalities
were excluded because of their lack of significant
associations.
To verify the results obtained by factor analysis, clus-
tering multivariate methods were applied to the data.
Cluster analysis encompasses a number of different clas-
sification algorithms that can be used to develop similari-
ties between grouped elements.
Significant difference of the aforementioned population
is additionally verified by the statistical T test and F test.
Results and discussion
Comparative analysis
The comparative analysis of the mean and range values for
the analysed elements in lichen, moss and attic dust sam-
ples are given in Table 1. Enrichment factors M/L—moss
vs. lichen, for plants response to elements distribution and
D/L—attic dusts vs. lichen, for historical response of ele-
ments distribution, is presented in Table 1.
From the obtained values for elements content
(Table 1), it is clearly visibly that lichens have lower
retention power for accumulation for almost all the
Table 1 Descriptive statistics of analyzed chemical elements in various sampling materials (n = 50—lichen; n = 52—moss; n = 64—attic
dust; 15 analyzed elements)
Element Lichen Moss Attic dust ER ER
X Range X Range X Range (M/L) (D/L)
Al 580 150–2,500 2,100 470–8,500 11,000 1,800–22,000 3.7 19
As 0.89 0.10–3.8 2.6 0.14–14 8.1 0.50–52 2.9 9.1
Ba 14 3.8–30 32 12–66 4,600 3.9–39,000 2.3 330
Ca 6,500 1,300–20,000 6,400 4,500–11,000 6,000 340–19,000 0.99 0.93
Cd 0.12 0.10–0.38 0.54 0.18–1.8 2.0 1.1–3.1 4.6 17
Cr 2.3 1.0–6.9 3.1 1.0–11 39 17–110 1.4 17
Cu 12 1.5–130 21 2.1–199 52 11–420 1.7 4.3
Fe 710 190–4,500 3,300 740–12,000 12,000 1,100–18,000 4.6 17
K 2,400 1,200–3,700 3,200 1,900–4,500 8,800 5,600–12,000 1.4 3.8
Mn 57 14–150 170 59–440 210 110–450 2.9 3.7
Na 71 16–250 46 25–82 6,800 330–29,000 0.65 96
Ni 2.8 1.5–10 7.4 2.1–30 23 8.9–59 2.6 8.2
Pb 6.7 0.61–120 8.8 2.7–40 29 3.1–120 1.3 4.3
Sr 14 2.9–37 26 13–55 36 3.6–140 1.8 2.5
Zn 21 10–39 29 17–54 51 21–93 1.4 2.4
Bold values indicate anthropogenic distribution for Cu and geogenic distribution for Ni in the study area
X mean; Range (min–max); ER enrichment ratio; M/L moss vs. lichen; D/L attic dust vs. lichen; n number of observation
Int. J. Environ. Sci. Technol. (2014) 11:517–528 521
123

analysed elements compared with mosses. This phenome-
non is due to the higher porous structure of lichen, the rain
washing effect and the strong influence of acidic surfaces
to the accumulation of these elements. Moss species
accumulate higher concentrations of lithophile elements
(Al, Ba, Ca, Cr, K, Li, Mg, Na, Sr). However, lichen more
easily accumulates chalcophile elements (Cd, Pb, Cu, Zn).
Correlations of element contents between lichen, moss
and attic dust samples were examined. Correlation coeffi-
cients (r) between the various sampling materials (lichen-
moss; lichen-dust and moss-dust) collected from the same
sampling locations (p \ 0.05) were accounted. The moss-
dust significant correlation was singled out for Cd, Cu and
Pb (0.41, 0.80 and 0.41, respectively). Lichen-dust corre-
lation was significant for Cu and Pb (0.41 and 0.37,
respectively). Copper is the most expressed element in the
correlations of the three sampling media. The statistical
observation included only values for elements contents
from sampling materials collected from the same sampling
locations.
The whole study area was monitored as two sub-areas:
an area of predominantly Pliocene sediments, Eocene fly-
sch series and andesites and pyroclastites (Ng–Pg) and an
area of predominantly Precambrian and Paleozoic rocks
(Pz–Pt). This approach was considered to determine the
impact of geogenic effects as natural phenomena on the
elements distribution in the different sampling media
(Table 2). For Cu, no significant values were obtained for
the T and F values; only for the sampling media of attic
dust were significant values for the T and F values found
(3.26 and 5.54, respectively), indicating strong response of
this media to geogenic enrichment for Cu.
Table 2 T test, F test and
enrichment ratios of 11 selected
elements in sampling materials
according to the determined
main geological units
Bold values indicate
anthropogenic distribution for
Cu and geogenic distribution for
Ni in the study area
X (Ng–Pg) average
concentration of chemical
elements in area of predominant
Pliocene sediments, Eocene
flysch series and andesites and
piroclastites (n = 15 lichen;
n = 15 moss; n = 22 attic
dust); X (Pz–Pt) area of
predominant Precambrian and
Paleozoic rocks (n = 35 lichen;
n = 37 moss; n = 44 attic dust)
t result of t test; F result of
F test for sampling materials
between defined areas; NS no
significance; * significance at
p \ 0.05; ER enrichment ratios
(area of Ng–Pg rocks vs. area of
Pz–Pt rocks)
Element Material X (Ng–Pg) X (Pz–Pt) T F EF
Al Lichen 490 620 -1.00 NS 1.01 NS 0.79
Al Moss 2,200 2,100 0.38 NS 0.15 NS 1.1
Al Attic dust 12,000 11,000 -1.77 NS 0.72 NS 1.1
As Lichen 0.64 1.0 -2.22 * 4.91 * 0.64
As Moss 2.8 2.5 0.28 NS 0.08 NS 1.1
As Attic dust 5.4 9.5 2.87 * 2.84 NS 0.57
Cd Lichen 0.12 0.11 0.62 NS 0.38 NS 1.1
Cd Moss 0.54 0.54 -0.05 NS 0.00 NS 0.99
Cd Attic dust 2.2 1.9 -1.48 NS 6.60 * 1.2
Cr Lichen 2.3 2.3 0.10 NS 0.01 NS 1.0
Cr Moss 3.9 2.8 1.80 NS 3.26 NS 1.4
Cr Attic dust 56 30 -4.89 * 31.7 * 1.9
Cu Lichen 6.4 15 21.38 NS 1.91 NS 0.44
Cu Moss 6.8 26 21.94 NS 3.76 NS 0.26
Cu Attic dust 22 68 3.26 * 5.54 * 0.33
Fe Lichen 550 780 -1.15 NS 1.33 NS 0.70
Fe Moss 3,200 3,300 -0.25 NS 0.06 NS 0.95
Fe Attic dust 13,000 11,000 -2.01 * 2.49 NS 1.1
K Lichen 2,300 2,400 -0.96 NS 0.93 NS 0.94
K Moss 3,000 3,300 -2.27 * 5.13 * 0.89
K Attic dust 8,600 9,000 0.92 NS 1.16 NS 0.96
Mn Lichen 69 52 1.93 NS 3.73 NS 1.3
Mn Moss 180 160 1.17 NS 1.36 NS 1.2
Mn Attic dust 250 190 -3.04 * 12.2 * 1.3
Ni Lichen 4.0 2.3 4.36 * 19.0 * 1.7
Ni Moss 11 5.9 4.24 * 17.9 * 1.9
Ni Attic dust 35 17 26.20 * 61.5 * 2.1
Pb Lichen 4.5 7.7 -0.60 NS 0.36 NS 0.59
Pb Moss 8.4 9.0 -0.30 NS 0.09 NS 0.93
Pb Attic dust 30 28 -0.47 NS 0.16 NS 1.1
Zn Lichen 21 21 0.10 NS 0.01 NS 1.0
Zn Moss 27 30 -1.47 NS 2.17 NS 0.90
Zn Attic dust 45 54 2.62 * 6.04 * 0.83
522 Int. J. Environ. Sci. Technol. (2014) 11:517–528
123

On the other hand, the anthropogenic effect (mine-
affected and non-affected areas) was also considered.
Collected samples were grouped in two sub-areas: affected
area (close to the mine) and the rest of the study area
(distant from the mine). The anthropogenic impact of
copper, as the main anthropogenic metal introduced in the
study area was singled out. The T and F values were sig-
nificant at p \ 0.05 and higher enrichment factors were
obtained for lichen, moss and attic dust media (3.8, 5.0 and
5.7, respectively), as presented in Table 3.
Multivariate analysis
Factor analysis, from a total of 15 elements, identified two
synthetic variables: geogenic (F1) and anthropogenic (F2)
association of elements from three types of samples. Factor
1 includes Ni-Cr-Cd-Fe-Al-K-Mn-Zn correlations, with a
total variance of 51 %, while the factor 2 includes As-Cu-
Pb correlations, with a total variance of 23 %. Matrix of
dominant factor loading, from total 166, samples of lichen,
moss and attic dust was constructed, with communality
value 74 %. Factor loadings for F1 (Ni-Cr-Cd-Fe-Al-K-
Mn-Zn) were 0.89, 0.88, 0.86, 0.85, 0.82, 0.72, 0.64,
respectively. Factor loadings for F2: Cu-As-Pb were 0.84,
0.76, and 0.67, respectively. Correlation matrix was used to
detect structure in the relationships between variables.
Elements: Ba, Na, Ca and Sr were excluded from further
analysis because of the very low factor loading (\0.60) or
tendency to form an independent factor and therefore, do
not belong to any factor group. However, the correlation
Table 3 T test, F test and
enrichment ratios of 11 selected
elements in sampling materials
according to the defined
affected areas
Bold values indicate
anthropogenic distribution for
Cu and geogenic distribution for
Ni in the study area
X (affected) average
concentration of chemical
elements in area around open pit
and Cu processing plant—
polluted area (n = 22 lichen;
n = 15 moss; n = 12 attic
dust); X (rest) non-polluted area
(n = 28 lichen; n = 32 moss;
n = 52 attic dust)
t result of T test; F result of
F test for sampling materials
between polluted and
unpolluted area; ns no
significance; * significance at
p \ 0.05; ER enrichment ratios
(polluted area vs. unpolluted
area)
Element Material X (affected) X (rest) T F ER
Al Lichen 660 520 1.11 NS 1.24 NS 1.3
Al Moss 2,500 1,900 1.83 NS 3.33 NS 1.3
Al Attic dust 12,000 11,000 0.50 NS 0.25 NS 1.1
As Lichen 1.0 0.80 1.29 NS 1.67 NS 1.2
As Moss 3.7 1.9 2.06 * 4.23 * 1.9
As Attic dust 13 7.1 1.89 NS 3.57 NS 1.8
Cd Lichen 0.13 0.11 1.31 NS 1.71 NS 1.2
Cd Moss 0.67 0.45 3.02 * 9.10 * 1.5
Cd Attic dust 2.3 2.0 2.52 * 6.33 * 1.2
Cr Lichen 2.5 2.1 1.23 NS 1.52 NS 1.2
Cr Moss 3.4 3.0 0.61 NS 0.37 NS 1.1
Cr Attic dust 31 40 -1.34 NS 1.81 NS 0.77
Cu Lichen 21 5.4 3.01 * 9.05 * 3.8
Cu Moss 41 8.1 3.83 * 14.67 * 5.0
Cu Attic dust 160 28 6.99 * 48.80 * 5.7
Fe Lichen 880 580 1.67 NS 2.80 NS 1.5
Fe Moss 4,000 2,800 2.28 * 5.19 * 1.4
Fe Attic dust 10,000 12,000 -1.84 NS 3.37 NS 0.83
K Lichen 2,400 2,300 0.89 NS 0.80 NS 1.0
K Moss 3,200 3,200 -0.31 NS 0.09 NS 1.0
K Attic dust 9,100 8,800 0.78 NS 0.60 NS 1.0
Mn Lichen 51 61 -1.19 NS 1.43 NS 0.84
Mn Moss 180 160 1.42 NS 2.02 NS 1.1
Mn Attic dust 200 210 -0.78 NS 0.60 NS 0.95
Ni Lichen 2.6 3.0 21.11 NS 1.23 NS 0.84
Ni Moss 7.1 7.5 20.34 NS 0.11 NS 0.94
Ni Attic dust 17 25 22.05 * 4.20 * 0.67
Pb Lichen 10 3.8 1.38 NS 1.91 NS 2.7
Pb Moss 12 6.6 3.28 * 10.73 * 1.9
Pb Attic dust 29 29 0.00 NS 0.00 NS 1.0
Zn Lichen 23 20 1.68 NS 2.81 NS 1.1
Zn Moss 32 27 2.91 * 8.49 * 1.2
Zn Attic dust 53 50 0.60 NS 0.37 NS 1.1
Int. J. Environ. Sci. Technol. (2014) 11:517–528 523
123

matrix explains their occurrence as natural phenomena,
grouping them as Ca-Sr and Ba-Na.
Spatial distribution
Spatial distribution for factor groups was done based on the
three types of media samples. For the geogenic association,
F1 (Ni-Cr-Cd-Fe-Al-K-Mn-Zn) has a significantly similar
distribution pattern with minor variations, especially in the
biogenic samples. In all observed materials, higher con-
centrations are observed in the area of predominant Plio-
cene sediments (Factor 1, as presented in Fig. 3).
Significant deviations from the aforementioned data are
represented by the high values in moss and lichen in the
area where Pz rocks, mainly schist, occur. This type of
observation was not included for attic dust.
Attic dust occurs in places that have the greatest dis-
tance from the ground and most probably can be attributed
to the smallest dust particles that are released by weath-
ering processes. Larger particles formed by the weathering
of schist settle on lower-lying material, such as moss and
lichen. This means that the moss and lichen are much more
exposed to the local composition of soil and geological
background, respectively, whereas the particles formed by
the weathering of Pliocene sediments have much smaller
dimensions and can reach higher elevations, this resulted in
significant enrichment in all sampled materials (Fig. 3).
The spatial distribution pattern of anthropogenic factor
F2 (As, Cu and Pb) is very similar for all three sampled
materials. For this distribution, data similar to those
obtained from F1 can be applied. Seemingly, they are more
similar to the distributions of F2 in attic dust and moss. The
Fig. 3 Spatial distribution of factor 1 loadings (Ni-Cr-Cd-Fe-Al-K-Mn-Zn) in lichen, moss and attic dust
Fig. 4 Spatial distribution of factor 2 loadings (Cu-As-Pb) in lichen, moss and attic dust
524 Int. J. Environ. Sci. Technol. (2014) 11:517–528
123

anthropogenic factor F2 (As, Cu and Pb) presents a dis-
tribution of high contents of potentially high-risk elements
close to the anthropogenic source, as can be seen in Fig. 4.
Almost identical results were obtained for the ultimate
effect of spatial distribution, but the main problem was to
separate them in terms of their capabilities and respon-
siveness to the geogenic and anthropogenic distribution of
elements. For that issue, values for factor loadings were
grouped separately for different sampling media. Anthro-
pogenic factor F2 follows the trend from F1 with emphasis
for attic dust where the expression of the media goes for the
anthropogenic affected area (Fig. 5). The distribution of F1
and F2 according to basic lithological areas for the sam-
pling media follows the expression capabilities: attic
dust [ moss [ lichens (Fig. 5).
The main markers for the geogenic and anthropogenic
influence were identified as Ni and Cu, respectively
(Fig. 7). Consequently, these two elements were analysed
separately for their spatial distribution and expression of
sampling media capabilities. Nickel’s spatial distribution
strongly relies on geogenic enrichment, as presented
in F1 distribution and individual Ni distribution (Figs. 1
and 7).
The spatial distribution of Cu was almost identically
expressed by lichen, moss and attic dust (Fig. 6). When
considering the distribution of Cu in the sampling materials
according to basic lithological units, a similar expression
was found; however, considering the defined areas (affec-
ted and other), the attic dust media has the strongest
expression when anthropogenic influences are considered.
Fig. 5 Distribution of factors 1 and 2 loadings in sampling materials according to basic lithological units (above) and according to defined areas
(below)
Int. J. Environ. Sci. Technol. (2014) 11:517–528 525
123

Fig. 6 Spatial distribution of Cu in lichen, moss and attic dust
Fig. 7 Distribution of Cu (below) and Ni (above) in sampling materials according to basic lithological units (left) and defined areas (right)
526 Int. J. Environ. Sci. Technol. (2014) 11:517–528
123

Plant species can be very sensitive to higher Cu content,
which has been proven with conducted studies (lower
contents for Cu in lichen-moss). In contrast, attic dust is
more useful in terms of direct accumulation (or simple
deposition) of atmospheric dust, distributed by an anthro-
pogenic emission source (Fig. 7).
Functional interdependence of Cu concentrations in the
lichen, moss and attic dust samples was analysed according
to the distance from the pollution source. Proportionality in
data dispersion was determined for all three types of media,
with the correlation values for lichens, r = -0.51; moss,
r = -0.54; attic dust, r = -0.47. Just as spatial distribu-
tion had shown higher contents of Cu contaminated dust
deposits in close proximity to the dust emission source,
long-distance distribution had not occurred.
Based on these assumption and the results from the
present study, it can be considered that attic dust is the
most stable and also the most responsive sampling medium
for determining a long-term status of atmospheric che-
mism. It is also the only indication of conditions in the past,
because the period of accumulation of air deposits is equal
to the age of the building, and the distribution of elements
is not affect by precipitation. Previous studies (Sajn 2003,
2005, 2006; Gosar et al. 2006; Zibret 2008; Zibret and Sajn
2008) have already determined that the distribution of
elements is minimally affected by population activity,
taking into consideration that the particles are only col-
lected from roofs of wooden construction.
Using attic dust, it is possible to determine the intensity
of pollution in some certain periods in the past with a
simple selection of the age of the sampled object, which is
not possible with other sampled material. The big problem
with sampling attic dust is that it is associated with the
presence of settlements and buildings with a roof con-
struction and obtaining the samples can be very difficult
and sometimes dangerous.
On the other hand, biogenic samples are very wide-
spread in the environment, particularly in areas with more
rainfall and sampling is quite simple. Problems can occur
in dry climates with little rainfall, which is the case in the
lowland parts of Macedonia. Both biogenic materials are an
indication of the current state of the environment and are
very useful for monitoring and predicting environmental
changes in chemistry. According to the results, moss is a
more stable and more responsive sampling tool than lichen
and its sampling procedure is easier.
Conclusion
The comparative analysis between elements content from
mosses (Hypnum cupressiforme, Campothecium lutes-
cens), the epiphytic lichens (Hypogymnia physodes and
Evernia prunastri) and attic dust showed: (a) stability to
higher contents of Cu, Pb, Fe (\0.01 %, \ 0.01 % and
1 %, respectively); (b) moss species accumulate higher
concentrations of lithophile elements (Al, Ba, Ca, Cr, K,
Li, Mg, Na, Sr) and lichen more easily accumulates chal-
cophile elements (Cd, Pb, Cu, Zn); (c) mosses and lichens
cannot be used interchangeably as biomonitors of metals in
areas with Cu mineral deposits and ore processing; (d) attic
dust presents a very suitable medium in terms of direct
accumulation (or simple deposition) of atmospheric dust
distributed by an anthropogenic emission source.
The main markers for geogenic and anthropogenic
influences were identified as Ni and Cu, respectively. The
ultimate effect is that spatial distribution for element
deposition (with emphasis on Cu and Ni) is not disturbed
by the significant differences in the sampling media matrix.
In both cases (lithological and anthropogenic affected
areas) for distribution of elements, the sampling media
follows the expression capabilities: attic dust [ mos-
s [ lichens. All three treated sample materials (attic dust,
moss, lichen) are shown to be useful in determining an
anthropogenic impact, as well as the chemical properties or
geological background on orographically diverse terrain in
the presence of complex geological structures with an
assumption that attic dust is the most stable and responsive
to environmental changes and lichen is the worst. Based on
the research results, the combination of attic dust and moss
gives the best results in the determination of anthropogenic
impact on the environment, as well as the natural enrich-
ment. Attic dust shows very stable historical reconstruction
of contamination and moss reveals the current state, related
to a period of growth and to a period of accumulation of
chemical elements. Because the influence of the parental
material (bedrock) on chemistry of biogenic samples, as
well as attic dust is rather vague, would be interesting and
necessary to include topsoil as a direct indicator of the
parental material in further investigation.
Acknowledgments The authors express their gratitude to the
anonymous referees for their constructive comments on earlier drafts
of this article.
References
Alijagic J, Sajn R (2011) Distribution of chemical elements in an old
metallurgical area, Zenica (Bosnia and Herzegovina). Geoderma
162:71–85
Artiola JF, Pepper I, Brussean L (2004) Environmental monitoring
and characterization. Elsevier Academic Press, San Diego
Ashraf MA, Maah MJ, Yusoff I (2011) Heavy metals accumulation in
plants growing in ex tin mining catchment. Int J Environ Sci
Tech 8:401–416
Balabanova B, Stafilov T, Baceva K, Sajn R (2010) Biomontorıng of
atmospherıc pollution wıth heavy metals ın the copper mıne
Int. J. Environ. Sci. Technol. (2014) 11:517–528 527
123

vıcınıty located near Radovıs, Republıc of Macedonıa. J Environ
Sci Health, Part A 45:1504–1518
Balabanova B, Stafilov T, Sajn R, Baceva K (2011) Distribution of
chemical ele-ments in attic dust as reflection of lithology and
anthropogenic influence in the vicinity of copper mine and
flotation. Arch Environ Con Tox 61:173–184
Balabanova B, Stafilov T, Sajn R, Baceva K (2012) Characterisation
of heavy metals in lichen species Hypogymnia Physodes and
Evernia Prunastri due to biomonitoring of air pollution in the
vicinity of copper mine. Inter J Environ Res 6:779–794
Barandovski L, Cekova M, Frontasyeva MV, Pavlov SS, Stafilov T,
Steinnes E, Urumov V (2008) Atmospheric deposition of trace
element pollutants in Macedonia studied by the moss biomon-
itoring technique. Environ Monit Assess 138:107–118
Branquinho C, Catarino F, Brown DH, Pereira MJ, Soares A (1999)
Improving the use of lichens as biomonitors of atmospheric
pollution. Sci Total Environ 232:67–77
Chakrabortty S, Tryambakro-Paratkar G (2006) Biomonitoring of
trace element air pollution using mosses. Aerosol Air Qual Res
6:247–258
Culicov OA, Mocanu R, Frontasyeva MV, Yurukova L, Steinnes E
(2005) Active moss biomonitoring applied to an industrial site in
Romania: relative accumulation of 36 elements in moss-bags.
Environ Monit Assess 108:229–240
Cyrys J, Stolzel M, Heinrich J, Kreyling WG, Menzel N, Wittmaack
K, Tuch T, Wichmann HE (2003) Elemental composition and
sources of fine and ultrafine ambient particles in Erfurt,
Germany. Sci Total Environ 305:143–156
Filzmoser P, Garrett RG, Reimann C (2005) Multivariate outlier
detection in exploration geochemistry. Comput Geosci
31:579–587
Garty J (2001) Biomonitoring atmospheric heavy metals with lichens:
theory and application. Crit Rev Plant Sci 20:309–371
Gosar M, Sajn R, Biester H (2006) Binding of mercury in soils and
attic dust in the Idrija mercury mine area (Slovenia). Sci Total
Environ 369:150–162
Hristov S, Karajovanovic M, Strackov M (1965) Basic geological
map of SFRJ, sheet Stip. Federal Geological Survey, Belgrade
Jarup L (2003) Hazards of heavy metal contamination. Brit Med Bull
68:167–182
Jeffrey J, Davisa B, Gulson BL (2005) Ceiling (attic) dust: a
‘‘museum’’ of contamination and potential hazard. Environ Res
99:177–194
Jeran Z, Jacimovic R, Batic F, Mavsar R (2002) Lichens as
integrating air pollution monitors. Environ Poll 120:107–113
Market B (2007) Definition principles for bioindication and biomon-
itoring of trace metals in the environment. J Trace Elem Med Bio
21:77–82
Onianwa PC (2001) Monitoring atmospheric metal pollution: a
review of the use of mosses as indicators. Environ Monit Assess
71:13–50
Pacyna EG, Pacyna JM, Fudala J, Strzelecka-Jastrzab E, Hlawiczka S,
Panasiuk D, Nitter S, Pregger T, Pfeiffer H, Friedrich R (2007)
Current and future emissions of selected heavy metals to the
atmosphere from anthropogenic sources in Europe. Atmos
Environ 41:8557–8566
Rakicevic T, Dumurdzanov N, Petkovski M (1969) Basic geological
map of SFRJ, sheet Stip, M 1:100,000 (map & interpreter).
Federal Geological Survey, BelgradeReimann C, Filzmoser P, Garrett RG (2002) Factor analysis applied
to regional geochemical data: problems and possibilities. Appl
Geochem 17:185–206
Sajn R (1999) Geokemicne lastnosti urbanih sedimentov na ozemlju
Slovenije. Geological Survey of Slovenia, Ljubljana
Sajn R (2003) Distribution of chemical elements in attic dust and soil
as reflection of lithology and anthropogenic influence in
Slovenia. Journal de Physique 107:1173–1176
Sajn R (2005) Using attic dust and soil for the separation of
anthropogenic and geogenic elemental distributions in an old
metallurgic area (Celje, Slovenia). Geochem-Explor Env A
5:59–67
Sajn R (2006) Factor analysis of soil and attic-dust to separate mining
and metallurgy influence, Meza valley, Slovenia. Math Geol
38:735–746
Stafilov T, Balabanova B, Sajn R, Baceva K, Boev B (2010)
Geochemical atlas of Radovis and the environs and the
distribution of heavy metals in the air. Faculty of Natural
Sciences and Mathematics, Skopje
Stefanova V, Neviealkov R, Moritz R (2004) Magmatism of the
Borov Dol copper occurrence. In: Kovachev V (ed) Proceedings
on the annual scientific conference of the Bulgarian Geological
Society. House of Science and Technology, Sofia
Tuba Z, Csintalanm Z, Nagy Z, Szente K, Takacs Z (2007) Sampling
of terricolous lichen and moss species for trace element analysis,
with special reference to bioindication of air pollution. In:
Markert B (ed) Environmental sampling for trace analysis.
Wiley, Germany
Vallero D (2008) Fundamentals of air pollution, 4th edn. Academic
Press Elsevier, New York
Zibret G (2008) Determination of historical emission of heavy metals
into the atmosphere: Celje case study. Environ Geol 56:189–196
Zibret G (2012) Impact of dust filter installation in ironworks and
construction on brownfield area on the toxic metal concentration
in street and house dust (Celje, Slovenia). Ambio 41:292–301
Zibret G, Rokavec D (2010) Household dust and street sediment as an
indicator of recent heavy metals in atmospheric emissions: a case
study on a previously heavily contaminated area. Environ Earth
Sci 61:443–453
Zibret G, Sajn R (2008) Modeling of atmospheric dispersion of heavy
metals in the Celje area, Slovenia. J Geochem Explor 97:29–41
528 Int. J. Environ. Sci. Technol. (2014) 11:517–528
123